Heartland Financial USA — Q1 2020 Earnings Presentation
52 slides from Heartland Financial USA's earnings presentation, May 8, 2020
Slide 1: Heartland Financial 1Q 2020 Performance
Heartland Financial 1Q 2020 Performance
Slide 2: Safe Harbor
Safe Harbor This release, contains, and future oral and written statements of Heartland Financial USA, Inc. ("Heartland") and its management may contain, forward-looking statements within the meaning of such term in the Private Securities Litigation Reform Act of 1995, with respect to the business,
Slide 3: Tremendous Growth in Assets and Shareholder Return
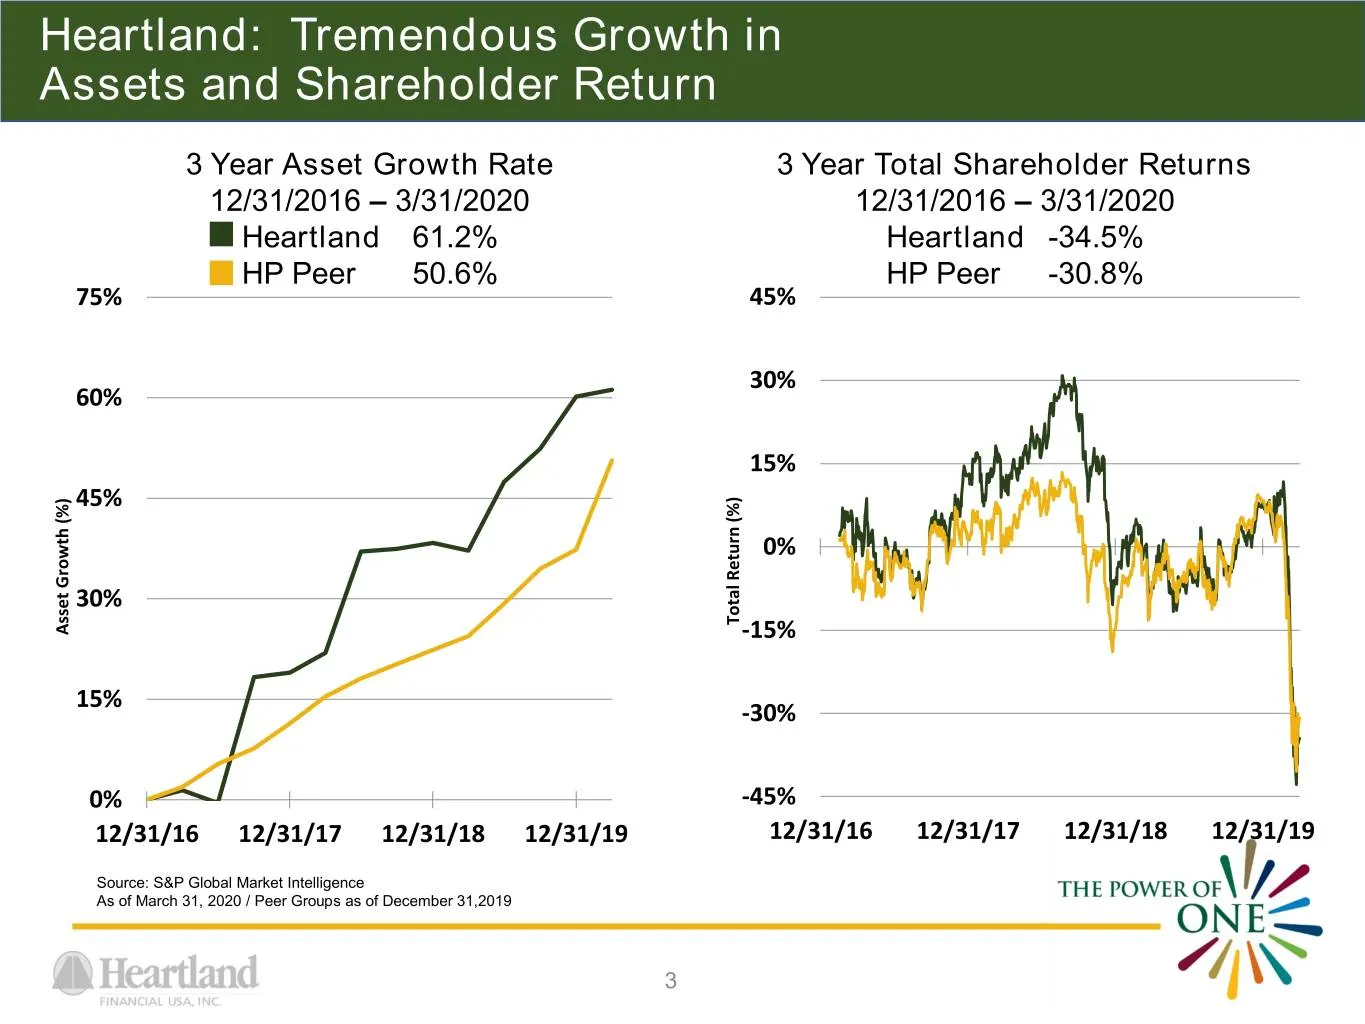
Heartland: Tremendous Growth in Assets and Shareholder Return 3 Year Asset Growth Rate 3 Year Total Shareholder Returns 12/31/2016 – 3/31/2020 12/31/2016 – 3/31/2020 Heartland 61.2% Heartland -34.5% HP Peer 50.6% HP Peer -30.8% 75% 45% 30% 60% 15% 45% 0% 30% TotalReturn (%) Asset Asset Growth(%) -15
Slide 4: Heartland's Stock Performance
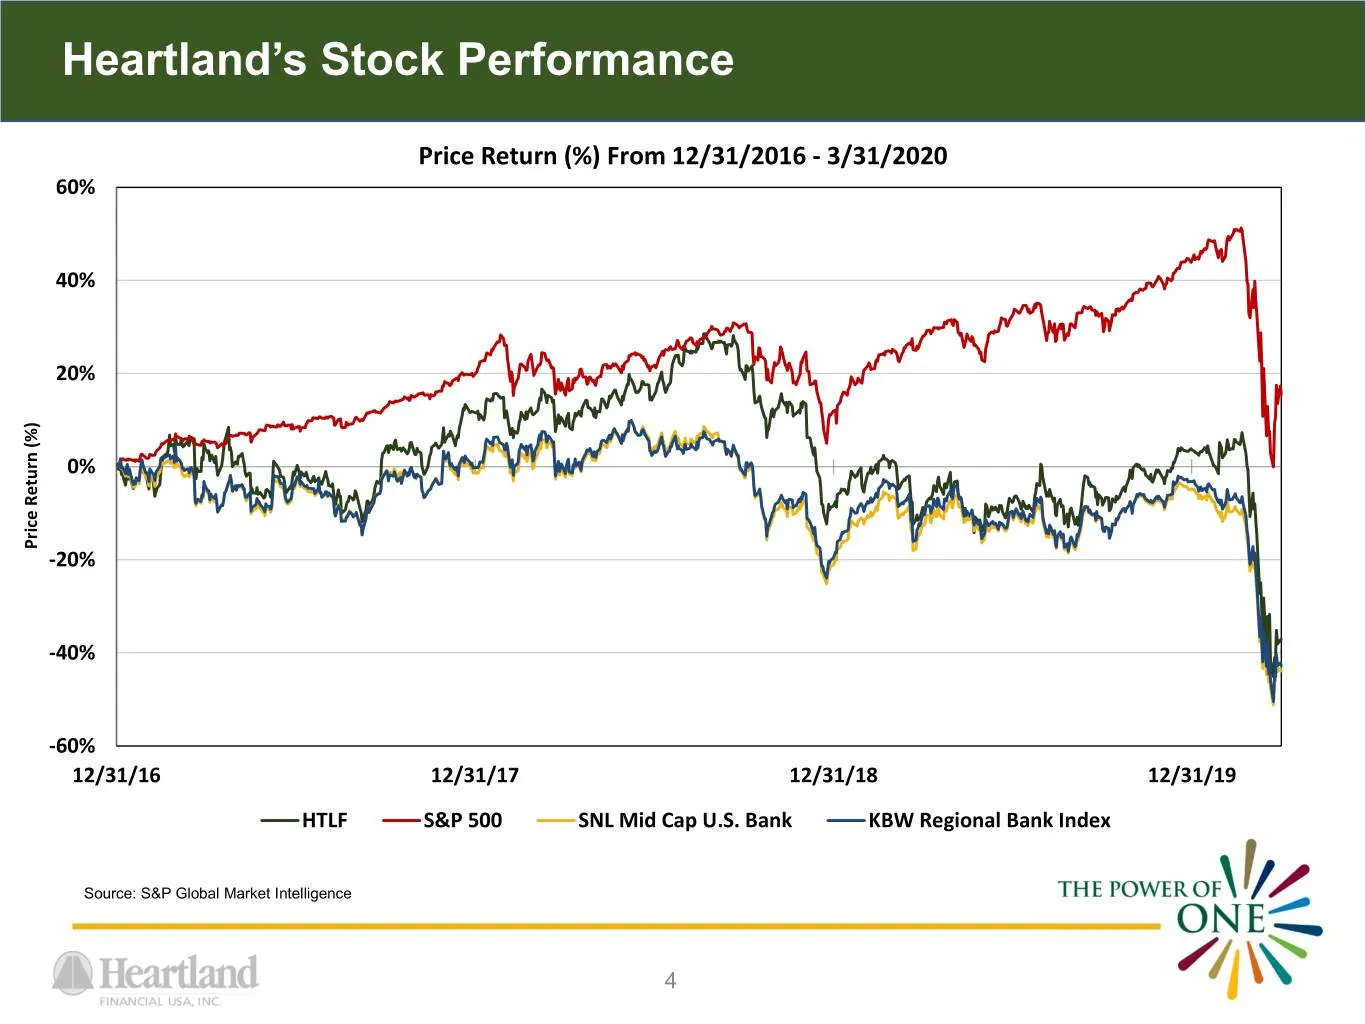
Heartland’s Stock Performance Price Return (%) From 12/31/2016 - 3/31/2020 60% 40% 20% 0% PriceReturn (%) -20% -40% -60% 12/31/16 12/31/17 12/31/18 12/31/19 HTLF S&P 500 SNL Mid Cap U.S. Bank KBW Regional Bank Index Source: S&P Global Market Intelligence 4
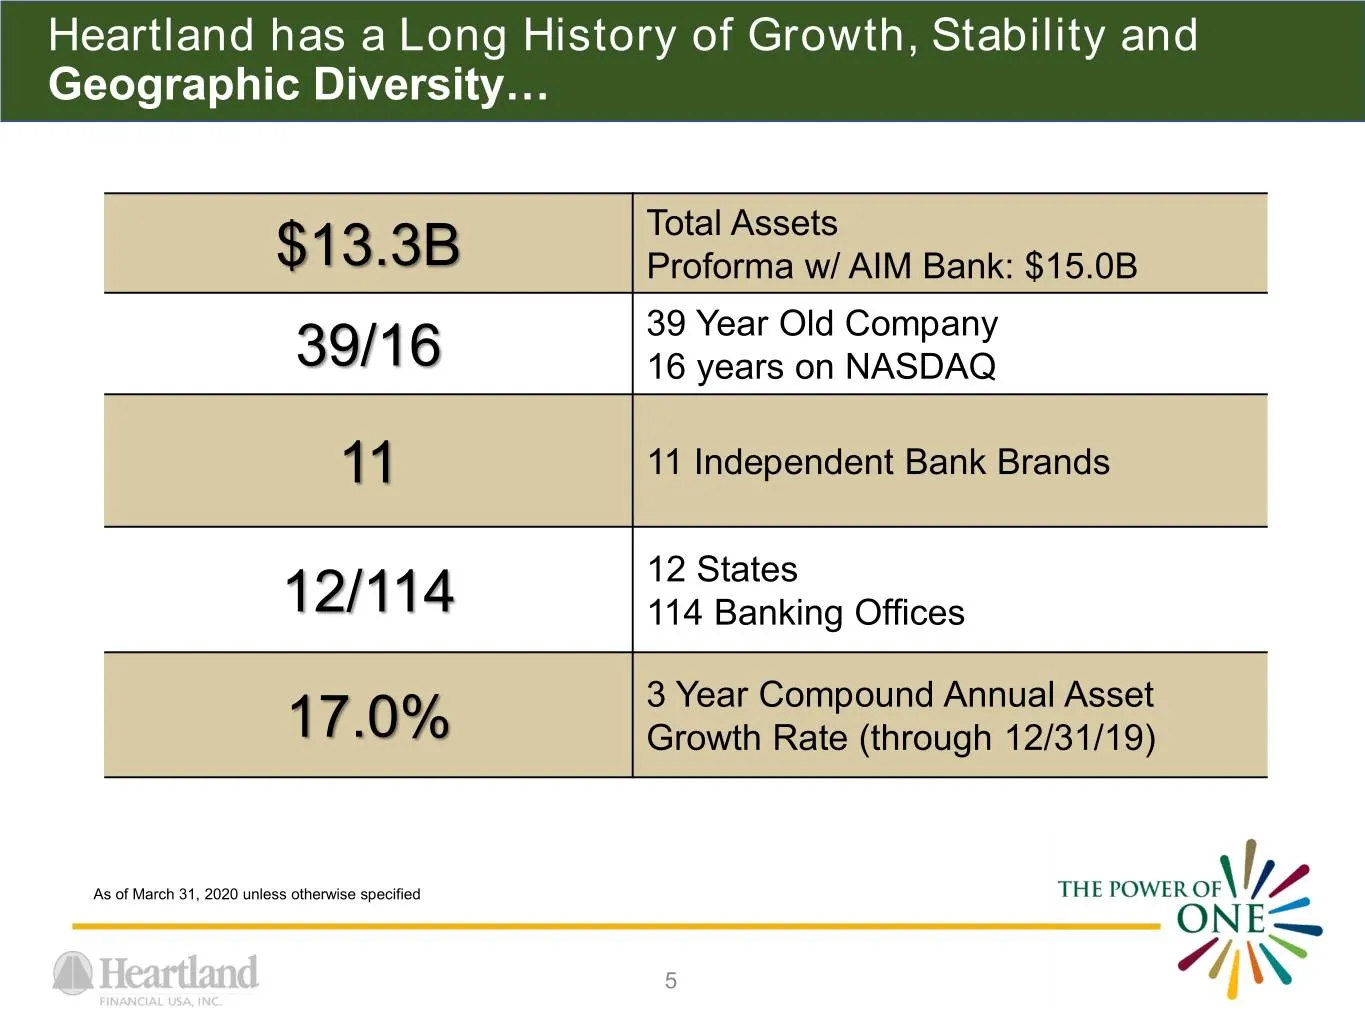
Slide 5: Long History of Growth, Stability and Geographic Diversity
Heartland has a Long History of Growth, Stability and Geographic Diversity… Total Assets $13.3B Proforma w/ AIM Bank: $15.0B 39 Year Old Company 39/16 16 years on NASDAQ 11 11 Independent Bank Brands 12 States 12/114 114 Banking Offices 3 Year Compound Annual Asset 17.0% Growth Rate (through 12/31/1
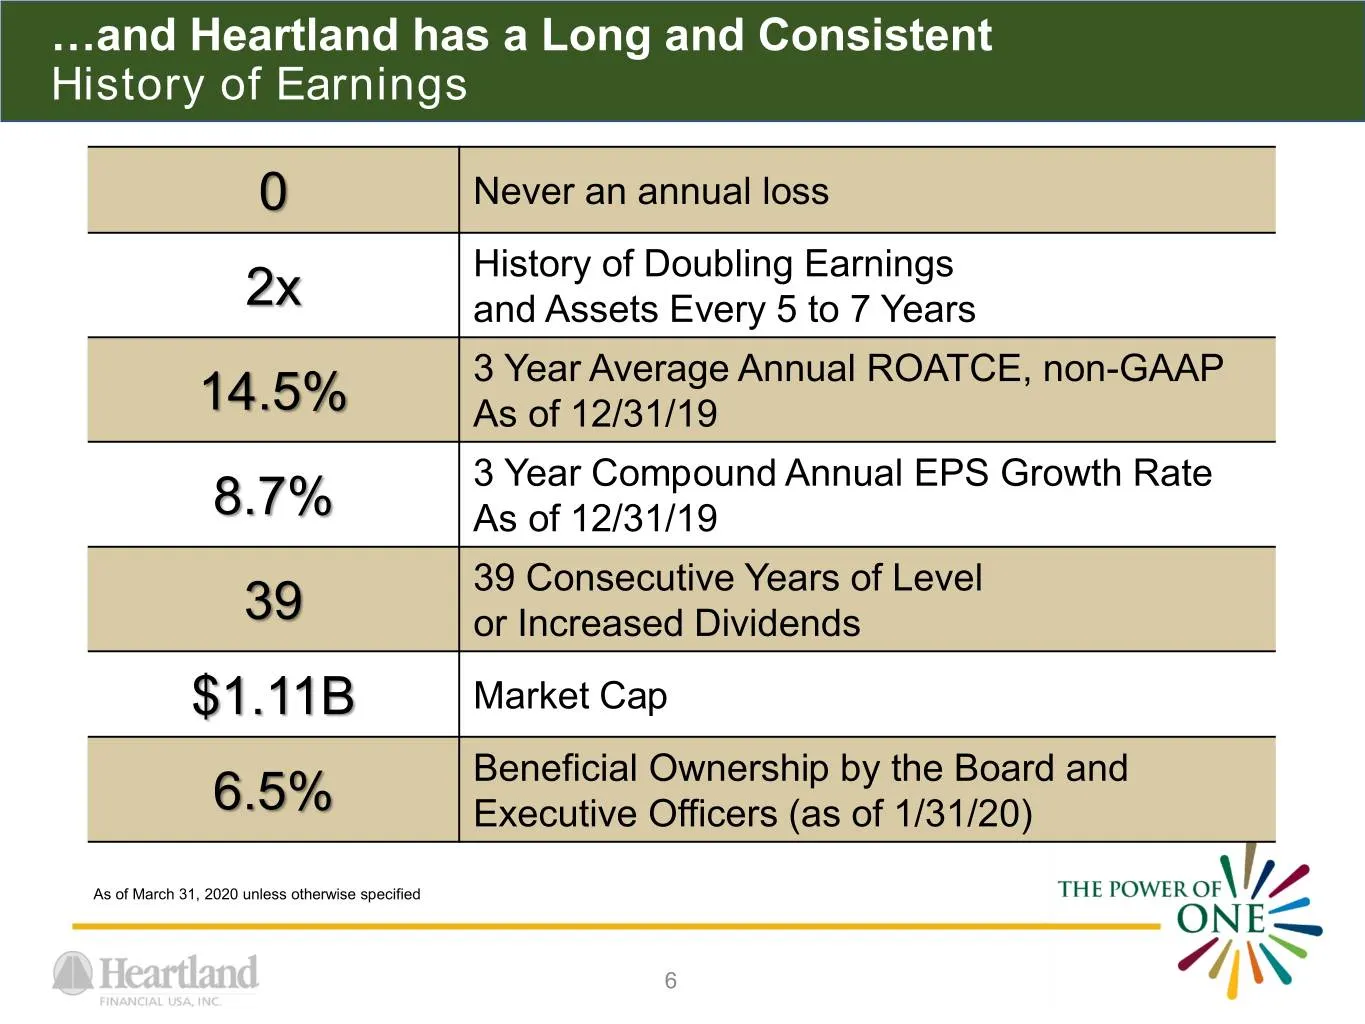
Slide 6: Long and Consistent History of Earnings
…and Heartland has a Long and Consistent History of Earnings 0 Never an annual loss History of Doubling Earnings 2x and Assets Every 5 to 7 Years 3 Year Average Annual ROATCE, non-GAAP 14.5% As of 12/31/19 3 Year Compound Annual EPS Growth Rate 8.7% As of 12/31/19 39 Consecutive Years of Level 39 or
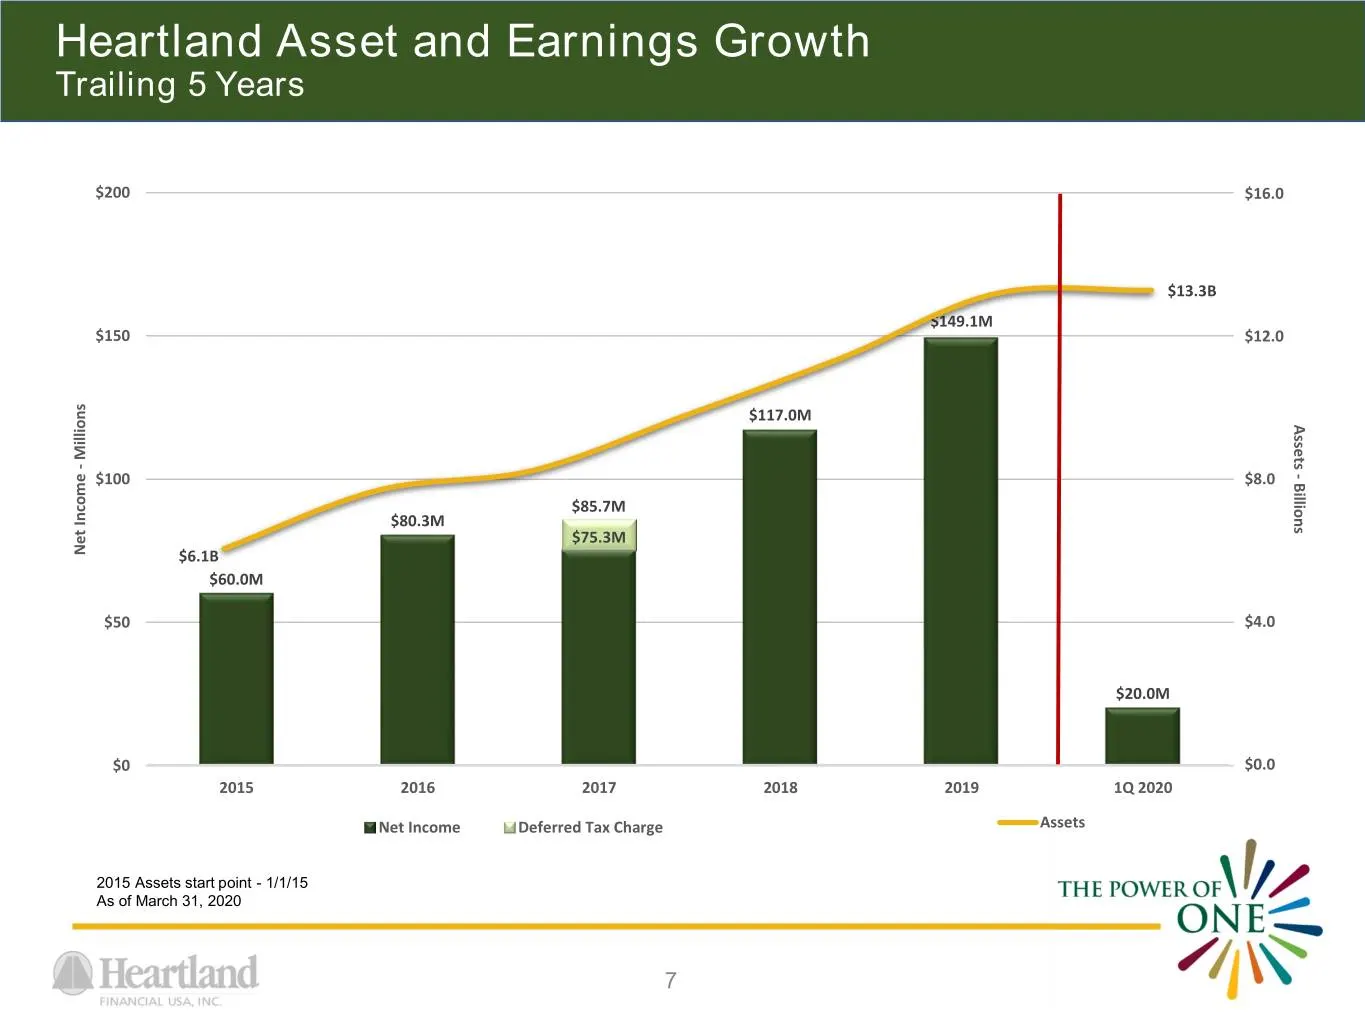
Slide 7: Heartland Asset and Earnings Growth
Heartland Asset and Earnings Growth Trailing 5 Years $200 $16.0 $13.3B $149.1M $150 $12.0 $117.0M Assets Millions - - $100 $8.0 Billions $85.7M $80.3M $75.3M Net Income Income Net $6.1B $60.0M $50 $4.0 $20.0M $0 $0.0 2015 2016 2017 2018 2019 1Q 2020 Net Income Deferred Tax Charge Assets 2015 Assets
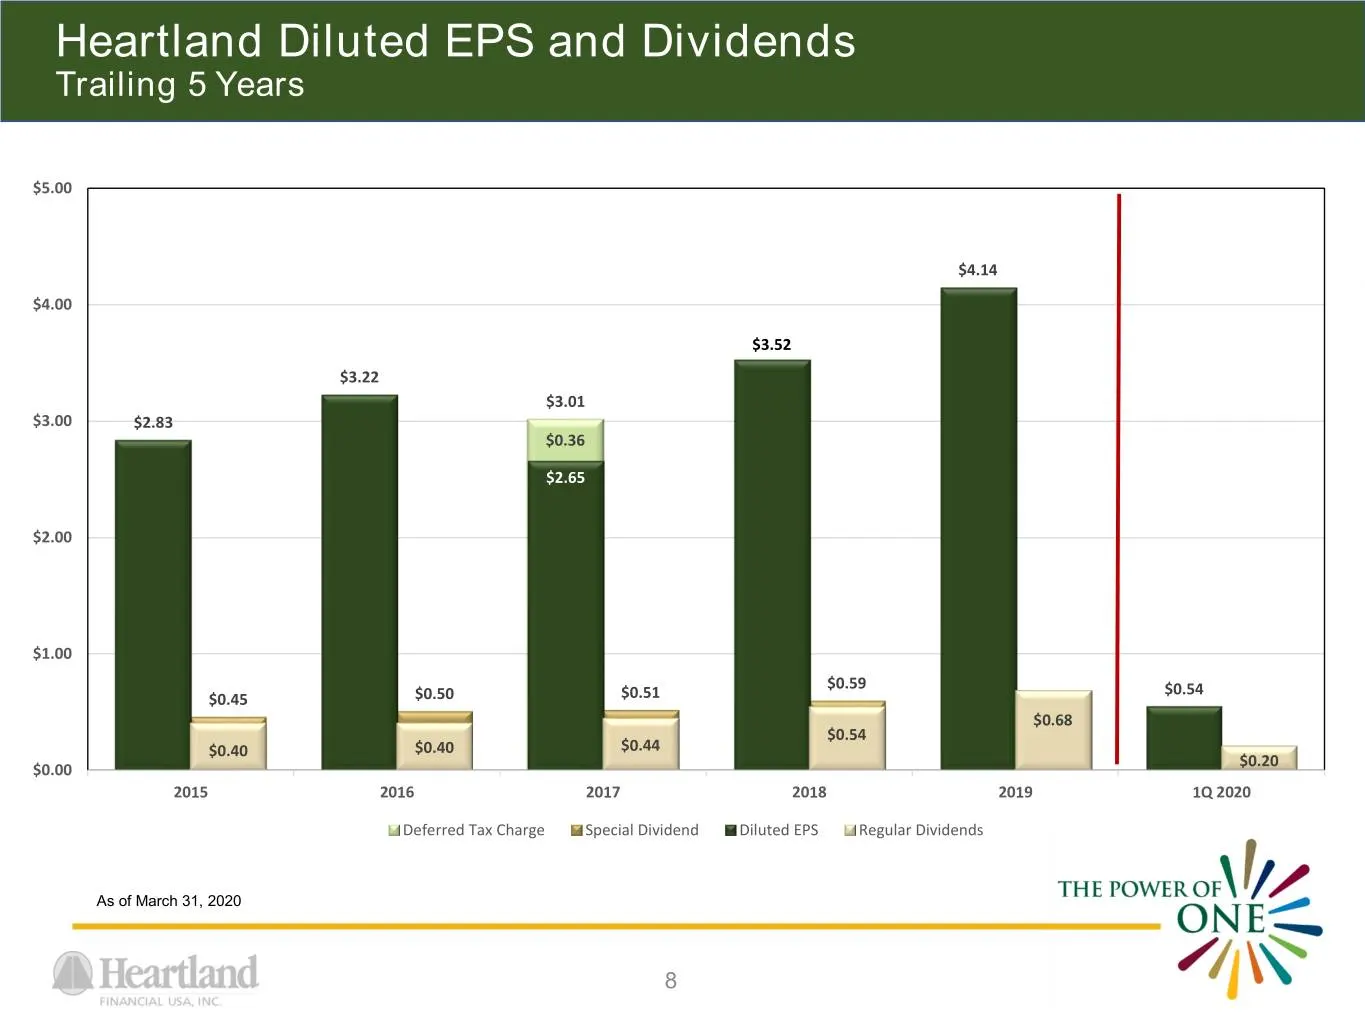
Slide 8: Heartland Diluted EPS and Dividends
Heartland Diluted EPS and Dividends Trailing 5 Years $5.00 $4.14 $4.00 $3.52 $3.22 $3.01 $3.00 $2.83 $0.36 $2.65 $2.00 $1.00 $0.59 $0.54 $0.45 $0.50 $0.51 $0.68 $0.54 $0.40 $0.40 $0.44 $0.20 $0.00 2015 2016 2017 2018 2019 1Q 2020 Deferred Tax Charge Special Dividend Diluted EPS Regular Dividends As
Slide 9: M&A – Core Competency and Strategy
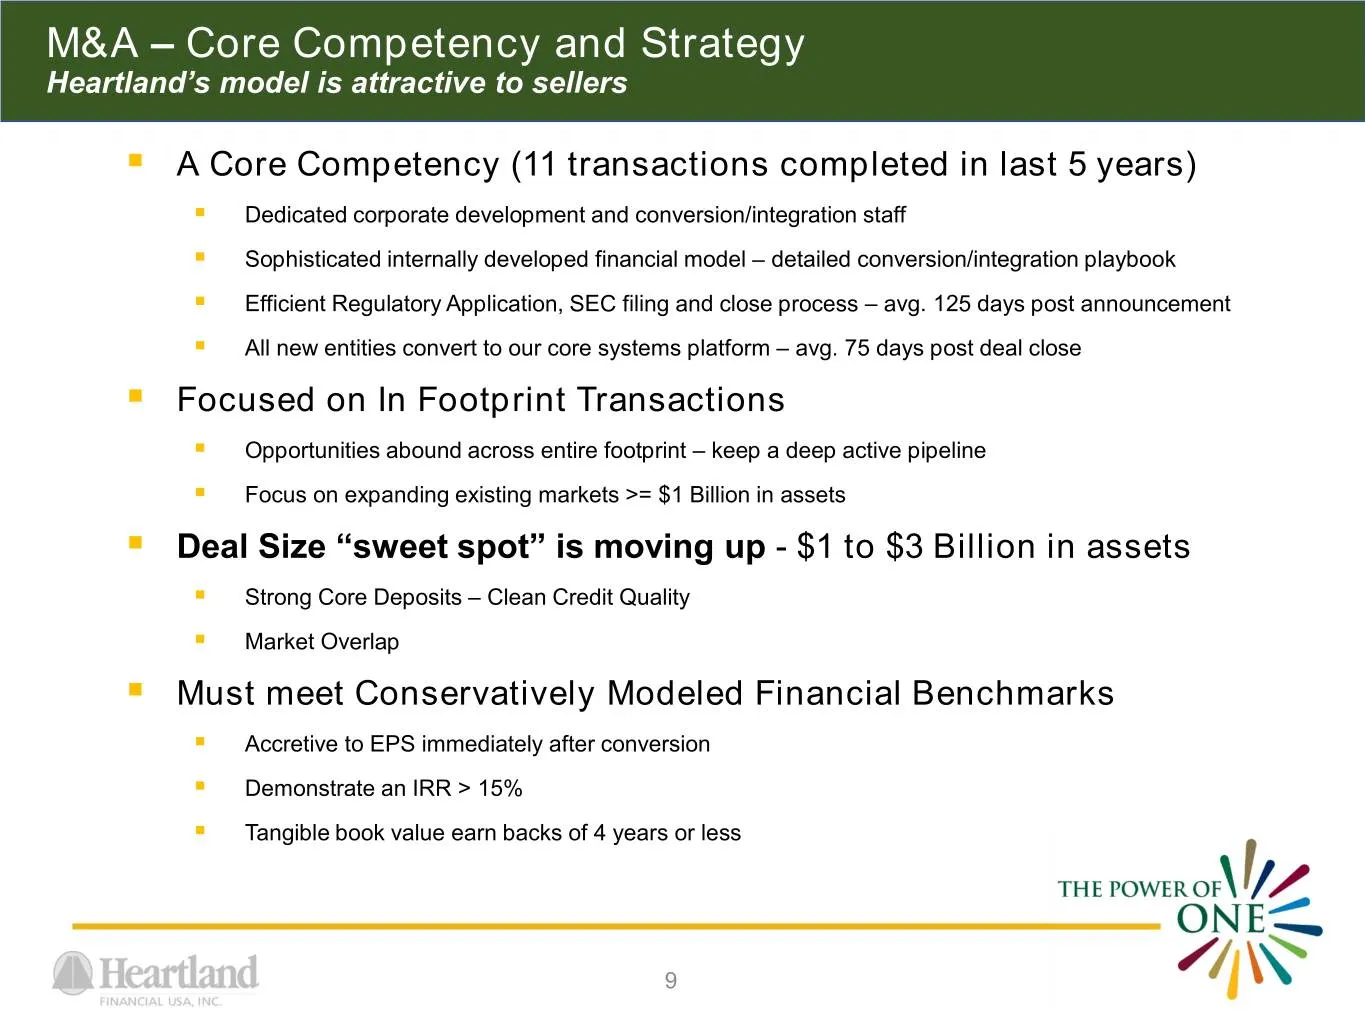
M&A – Core Competency and Strategy Heartland’s model is attractive to sellers . A Core Competency (11 transactions completed in last 5 years) . Dedicated corporate development and conversion/integration staff . Sophisticated internally developed financial model – detailed conversion/integration play
Slide 10: Heartland M&A Transaction Summary 2015 - Current
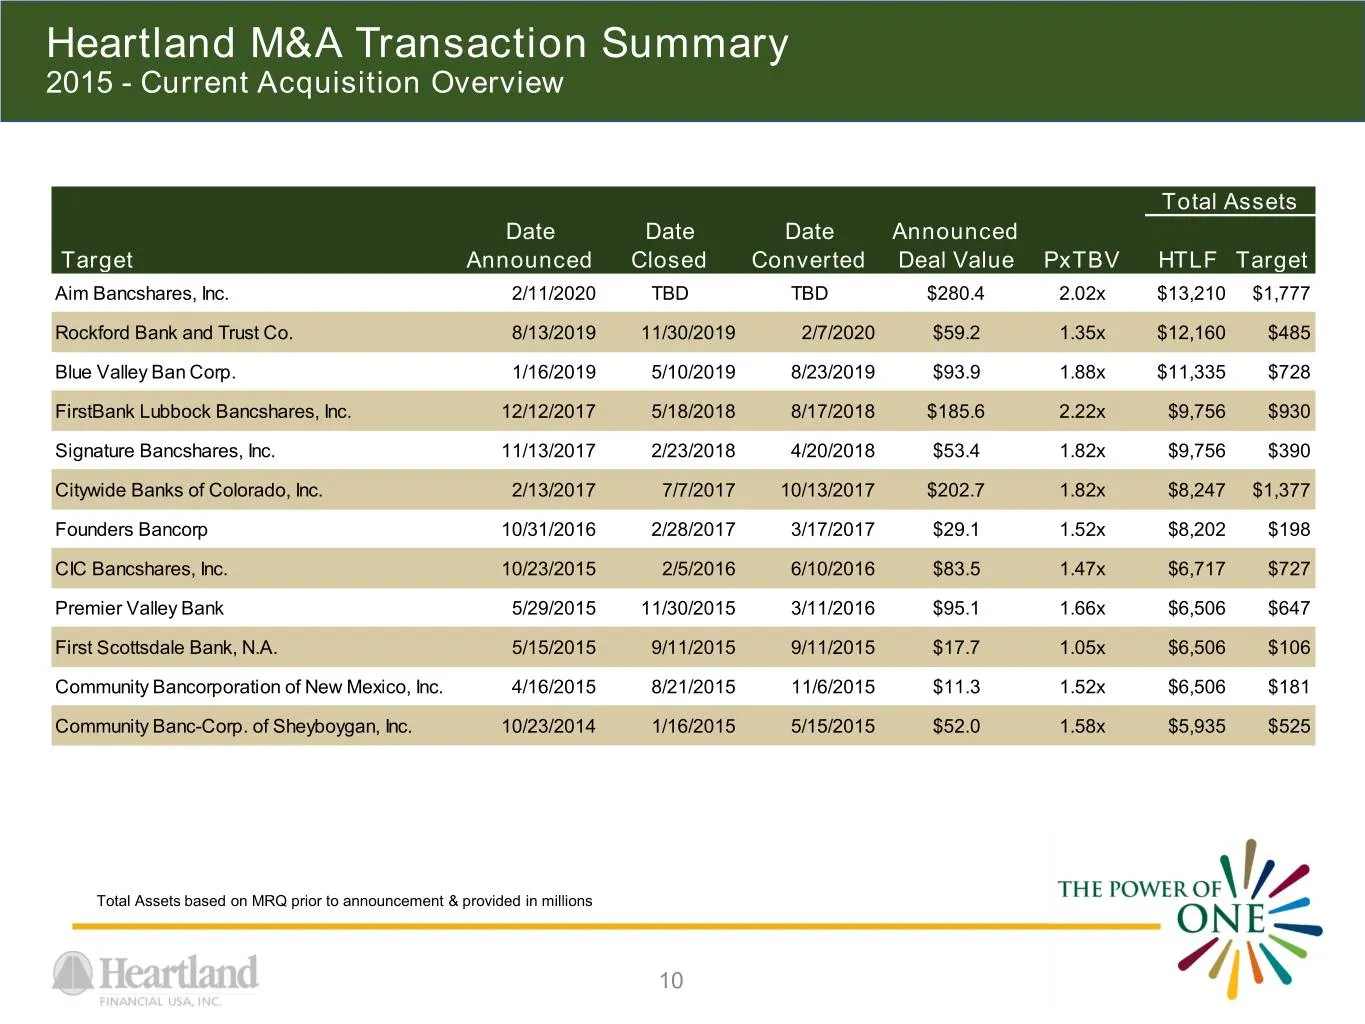
Heartland M&A Transaction Summary 2015 - Current Acquisition Overview Total Assets Date Date Date Announced Target Announced Closed Converted Deal Value PxTBV HTLF Target Aim Bancshares, Inc. 2/11/2020 TBD TBD $280.4 2.02x $13,210 $1,777 Rockford Bank and Trust Co. 8/13/2019 11/30/2019 2/7/2020 $59.
Slide 11: Acquisition Rockford Bank and Trust Co.
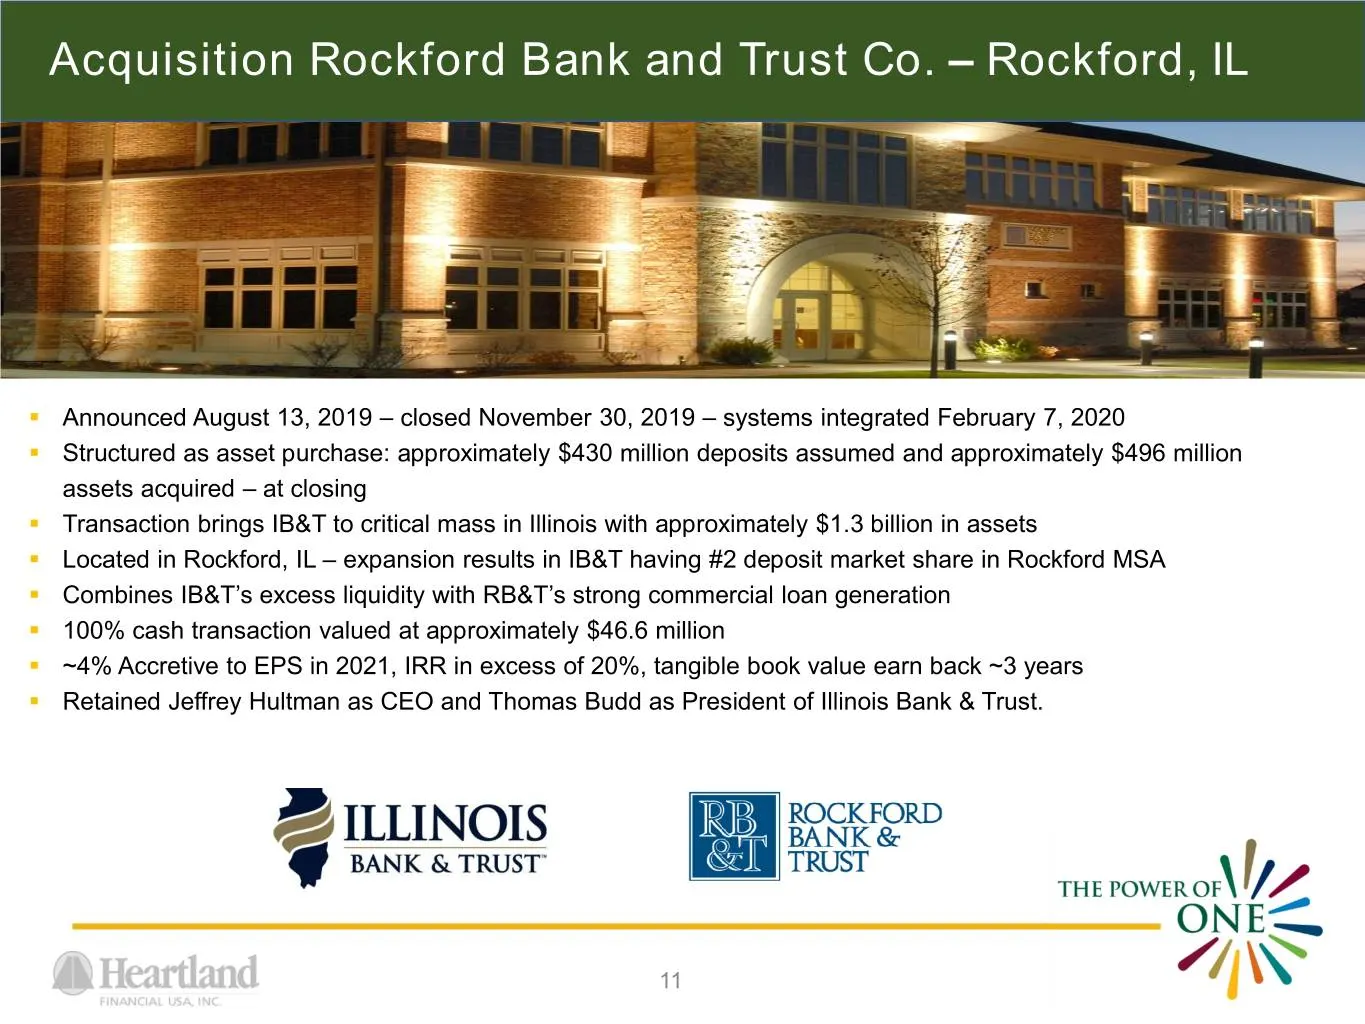
Acquisition Rockford Bank and Trust Co. – Rockford, IL . Announced August 13, 2019 – closed November 30, 2019 – systems integrated February 7, 2020 . Structured as asset purchase: approximately $430 million deposits assumed and approximately $496 million assets acquired – at closing . Transaction br
Slide 12: Acquisition AIM Bancshares, Inc.
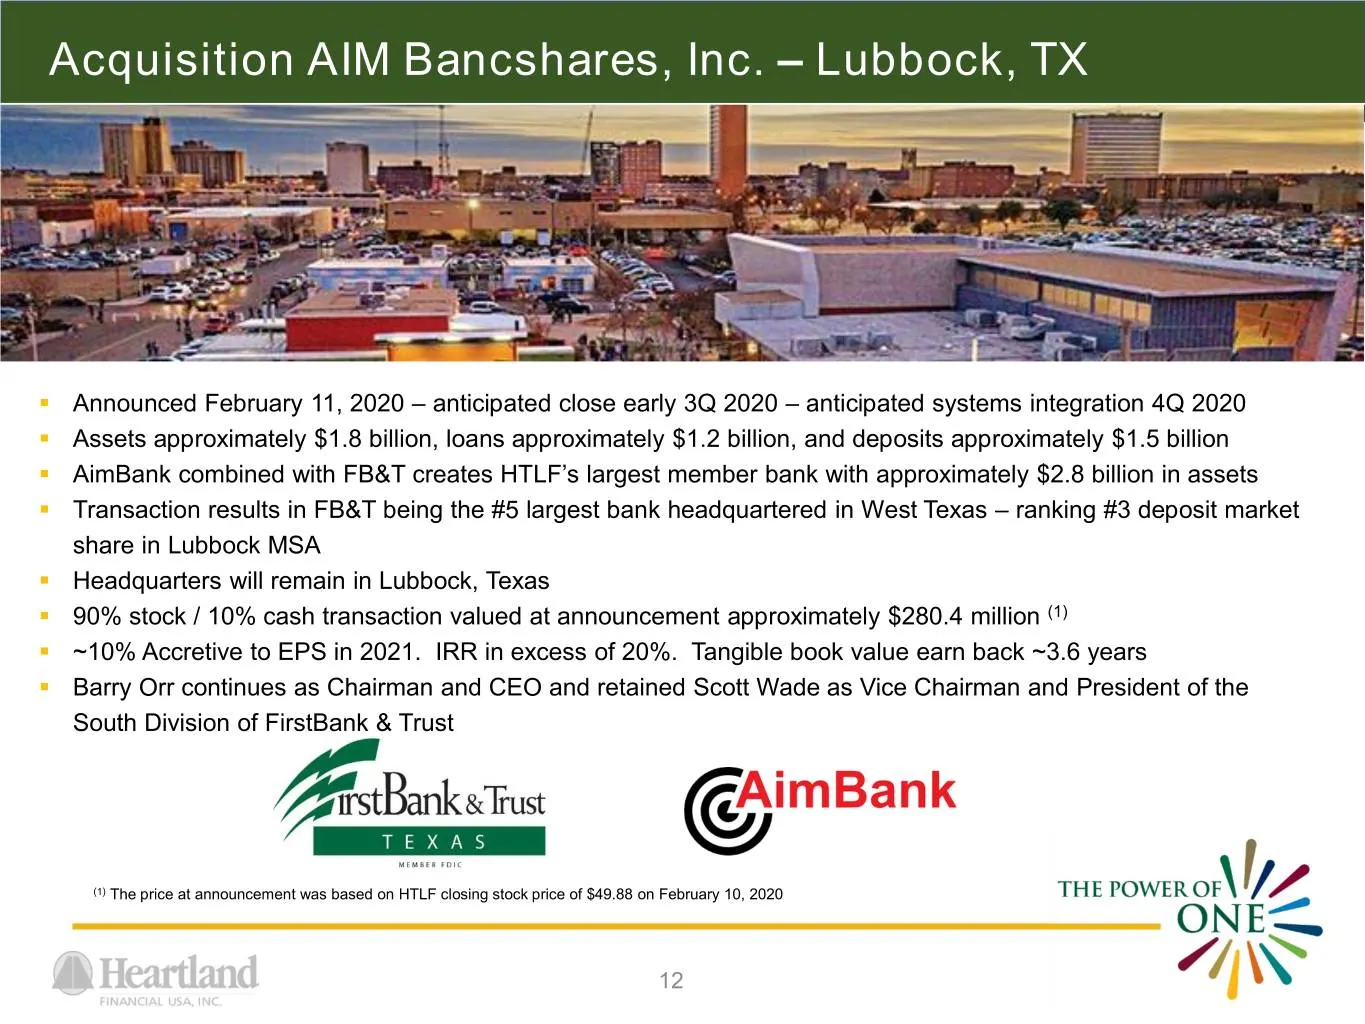
Acquisition AIM Bancshares, Inc. – Lubbock, TX . Announced February 11, 2020 – anticipated close early 3Q 2020 – anticipated systems integration 4Q 2020 . Assets approximately $1.8 billion, loans approximately $1.2 billion, and deposits approximately $1.5 billion . AimBank combined with FB&T creates
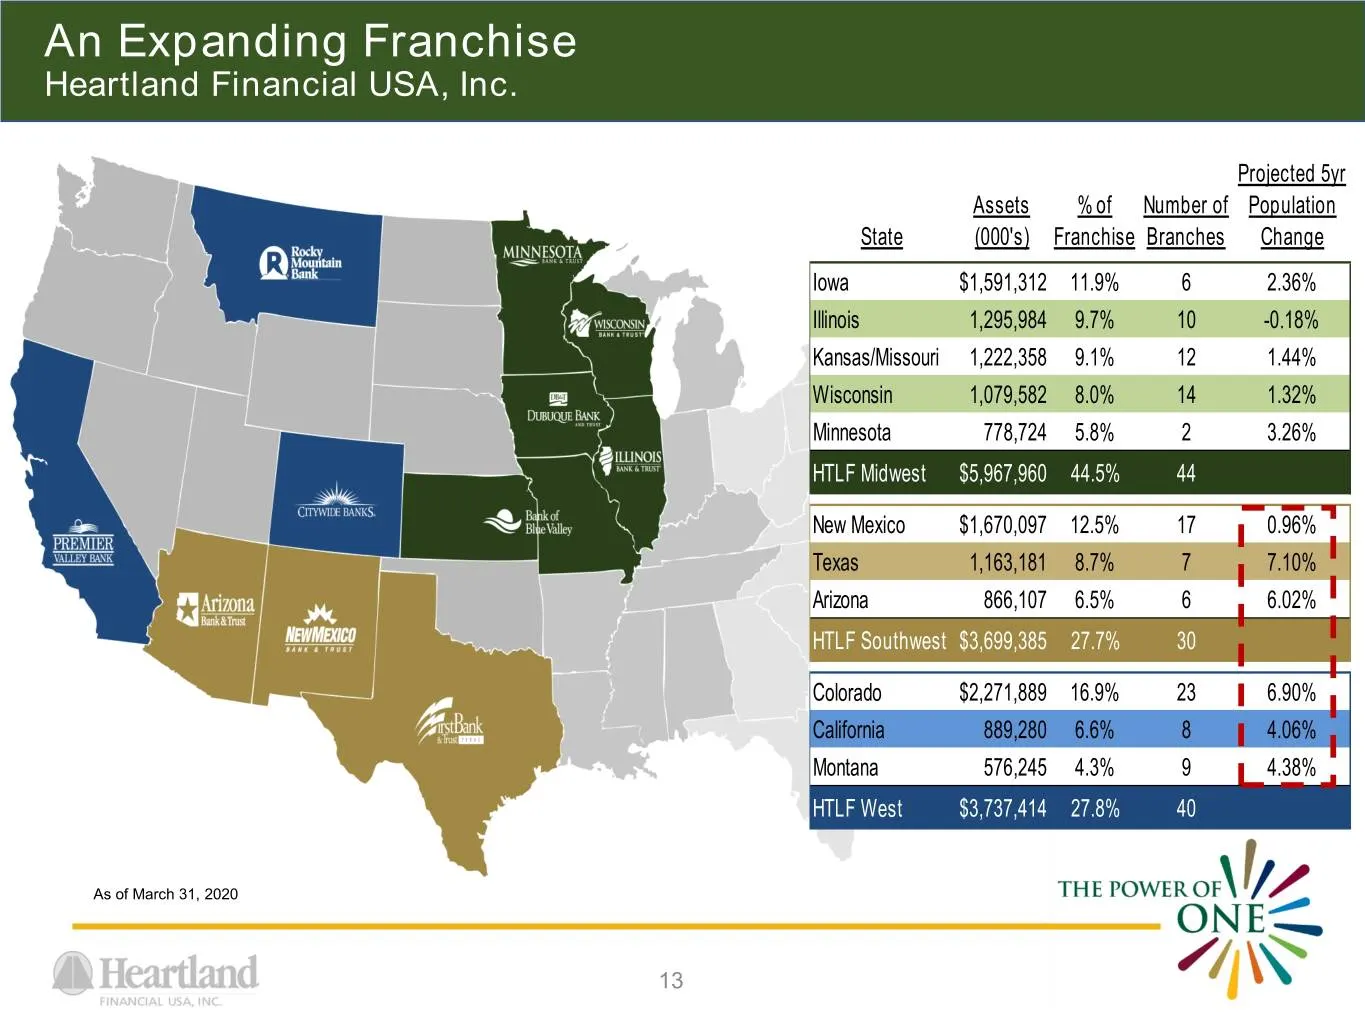
Slide 13: An Expanding Franchise
An Expanding Franchise Heartland Financial USA, Inc. Projected 5yr Assets % of Number of Population State (000's) Franchise Branches Change Iowa $1,591,312 11.9% 6 2.36% Illinois 1,295,984 9.7% 10 -0.18% Kansas/Missouri 1,222,358 9.1% 12 1.44% Wisconsin 1,079,582 8.0% 14 1.32% Minnesota 778,724 5.8%
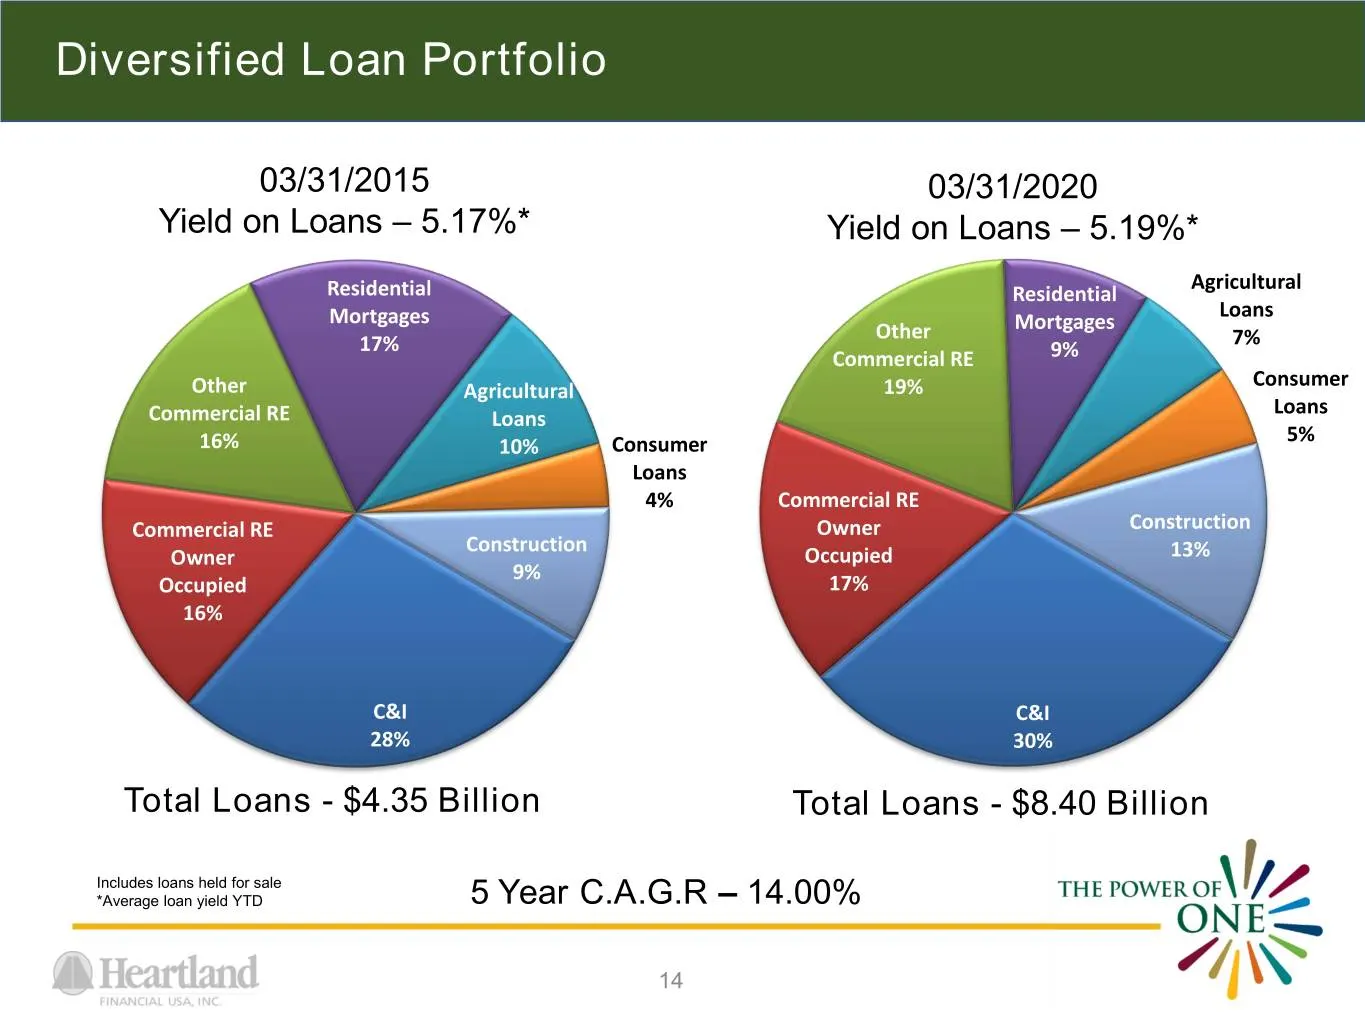
Slide 14: Diversified Loan Portfolio
Diversified Loan Portfolio 03/31/2015 03/31/2020 Yield on Loans – 5.17%* Yield on Loans – 5.19%* Agricultural Residential Residential Mortgages Loans Other Mortgages 17% 7% Commercial RE 9% Consumer Other Agricultural 19% Loans Commercial RE Loans 5% 16% 10% Consumer Loans 4% Commercial RE Commercia
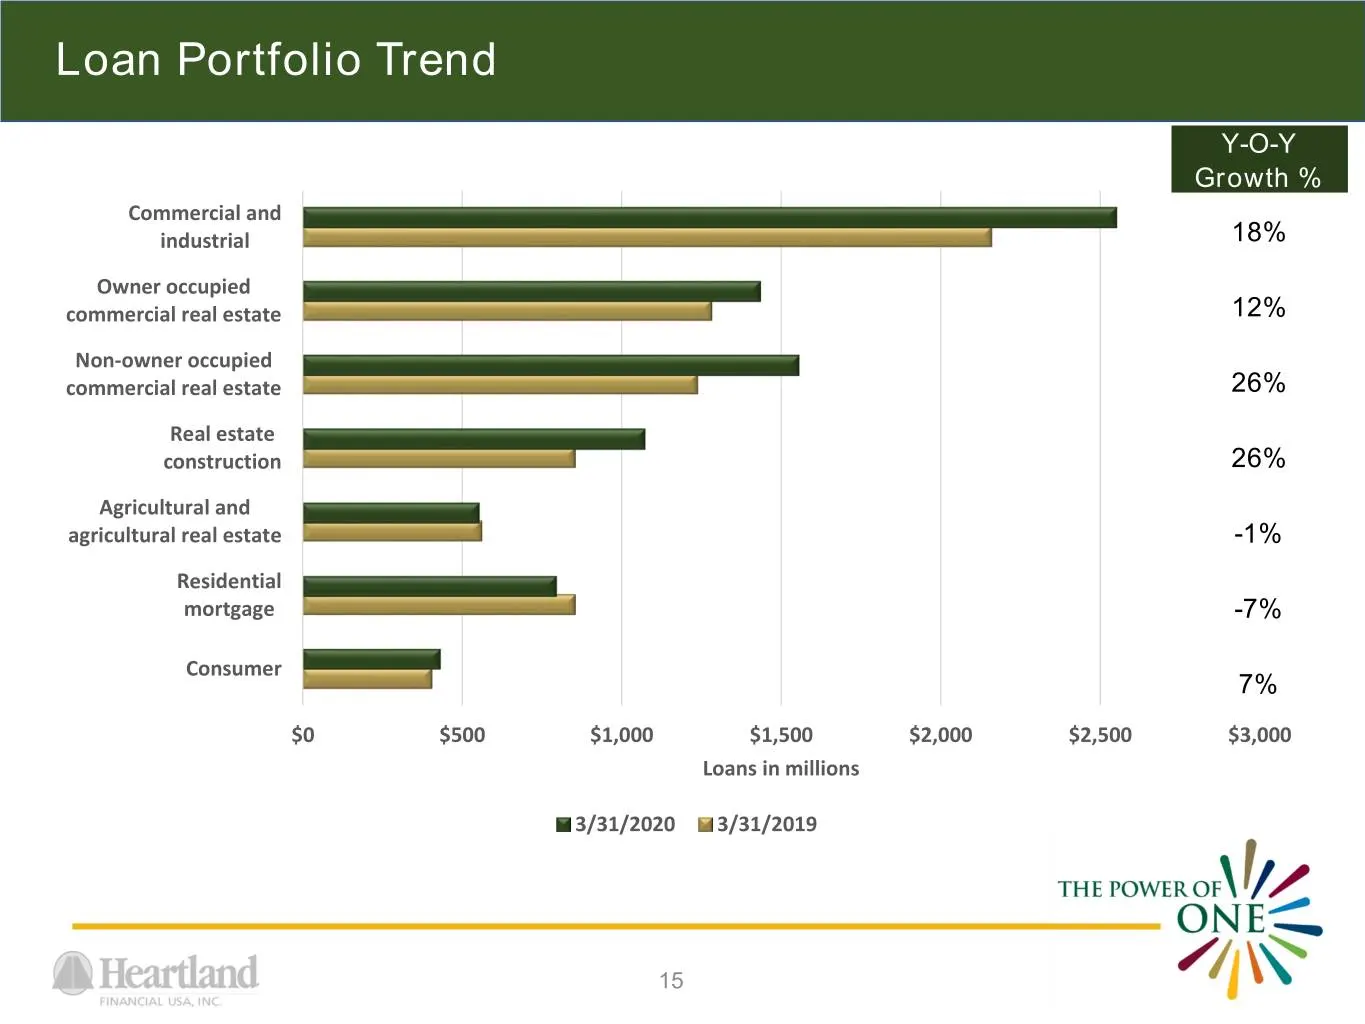
Slide 15: Loan Portfolio Trend
Loan Portfolio Trend Y-O-Y Growth % Commercial and industrial 18% Owner occupied commercial real estate 12% Non-owner occupied commercial real estate 26% Real estate construction 26% Agricultural and agricultural real estate -1% Residential mortgage -7% Consumer 7% $0 $500 $1,000 $1,500 $2,000 $2,50
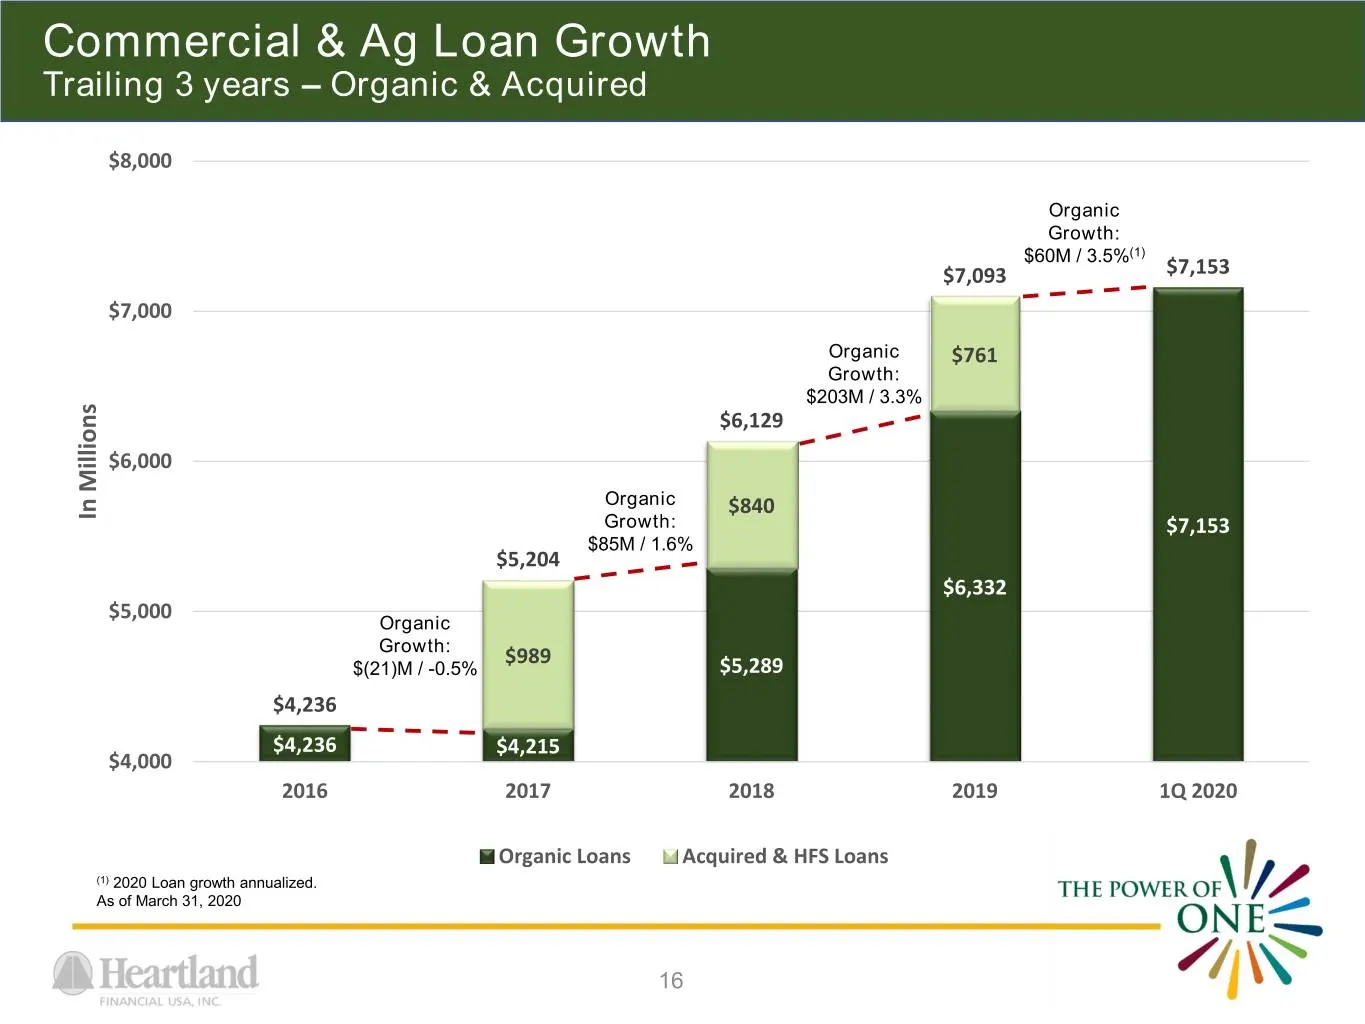
Slide 16: Commercial & Ag Loan Growth
Commercial & Ag Loan Growth Trailing 3 years – Organic & Acquired $8,000 Organic Growth: $60M / 3.5%(1) $7,093 $7,153 $7,000 Organic $761 Growth: $203M / 3.3% $6,129 $6,000 Organic $840 In Millions In Growth: $7,153 $85M / 1.6% $5,204 $6,332 $5,000 Organic Growth: $989 $(21)M / -0.5% $5,289 $4,236 $
Slide 17: Expanding Core Deposit Mix
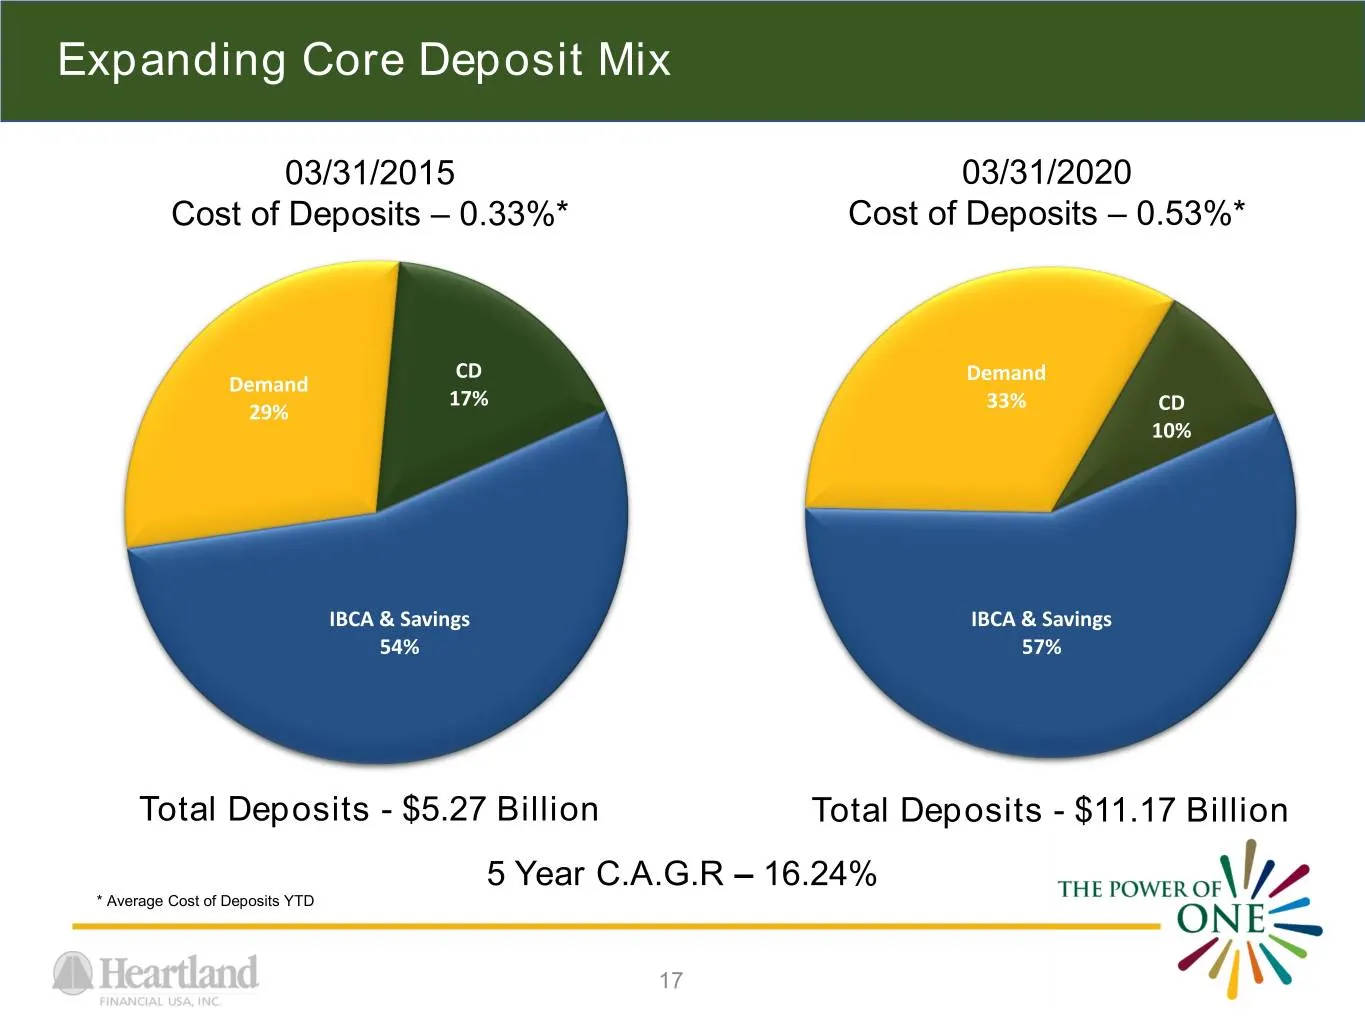
Expanding Core Deposit Mix 03/31/2015 03/31/2020 Cost of Deposits – 0.33%* Cost of Deposits – 0.53%* CD Demand Demand 17% 33% 29% CD 10% IBCA & Savings IBCA & Savings 54% 57% Total Deposits - $5.27 Billion Total Deposits - $11.17 Billion 5 Year C.A.G.R – 16.24% * Average Cost of Deposits YTD 17
Slide 18: Non-Interest Income by Category
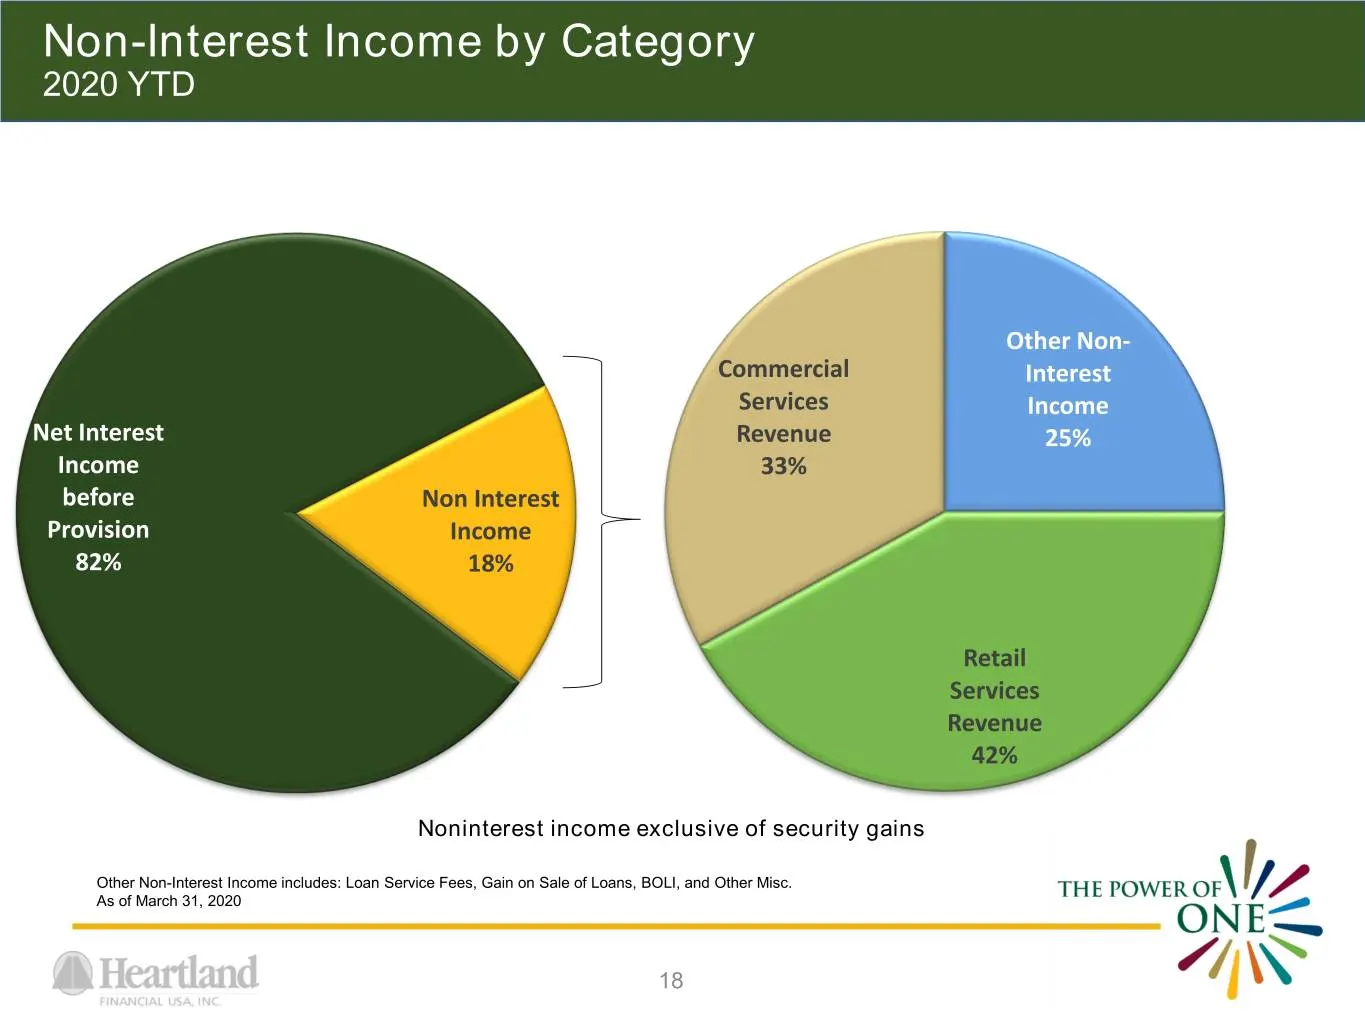
Non-Interest Income by Category 2020 YTD Other Non- Commercial Interest Services Income Net Interest Revenue 25% Income 33% before Non Interest Provision Income 82% 18% Retail Services Revenue 42% Noninterest income exclusive of security gains Other Non-Interest Income includes: Loan Service Fees, G
Slide 19: Commercial Services Revenue Trends
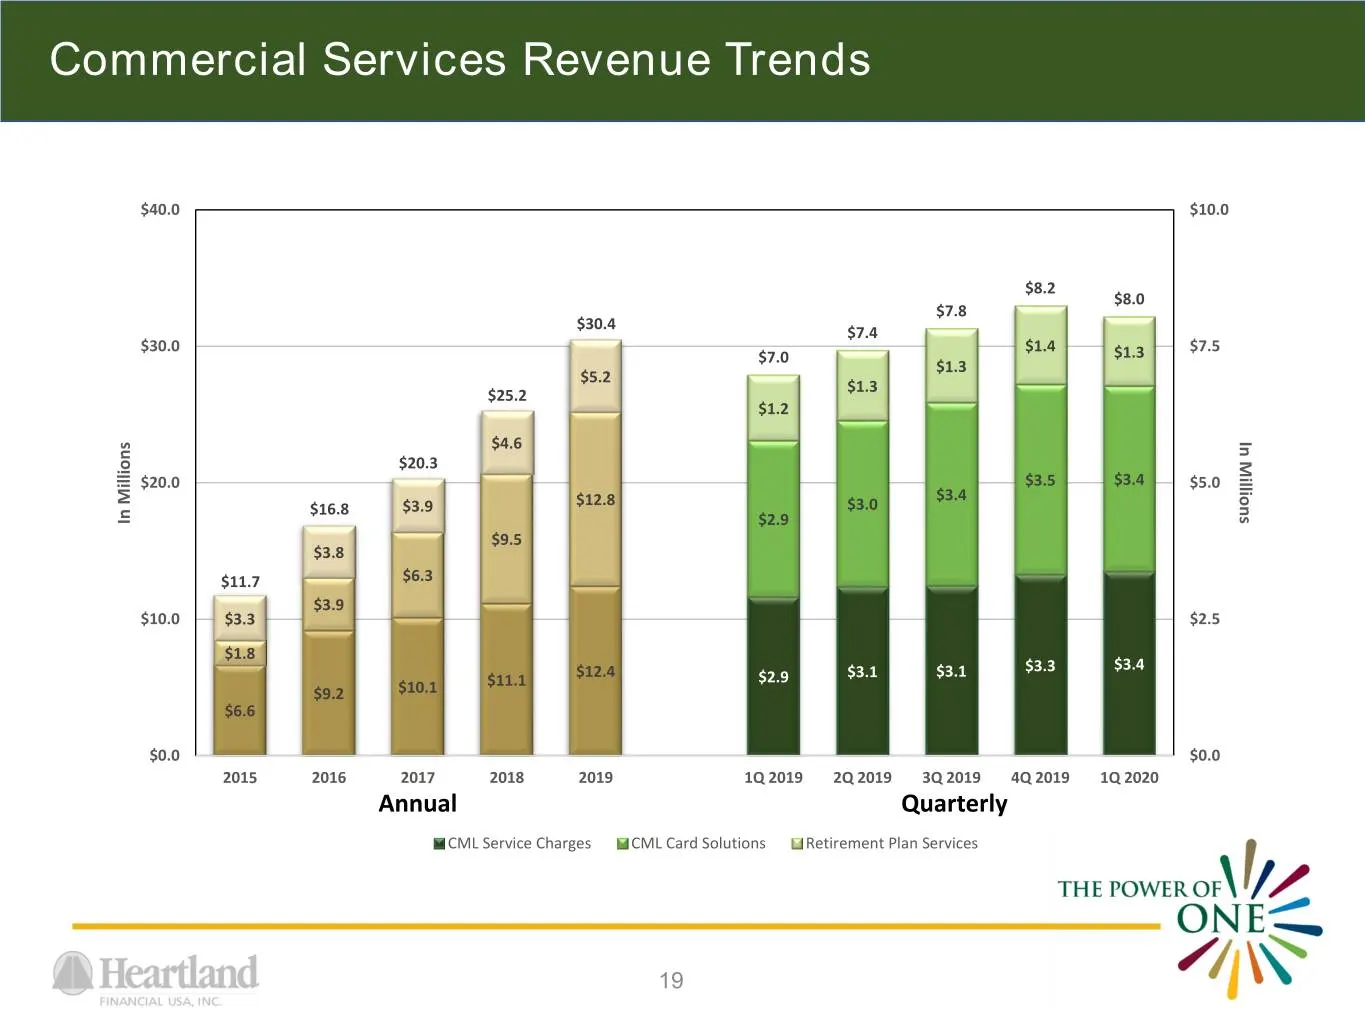
Commercial Services Revenue Trends $40.0 $10.0 $8.2 $8.0 $7.8 $30.4 $7.4 $30.0 $1.4 $7.5 $7.0 $1.3 $1.3 $5.2 $1.3 $25.2 $1.2 $4.6 Millions In $20.3 $20.0 $3.5 $3.4 $5.0 $12.8 $3.4 $16.8 $3.9 $3.0 InMillions $2.9 $9.5 $3.8 $11.7 $6.3 $3.9 $10.0 $3.3 $2.5 $1.8 $12.4 $3.1 $3.3 $3.4 $11.1 $2.9 $3.1 $9.2
Slide 20: Consumer Services Revenue Trends
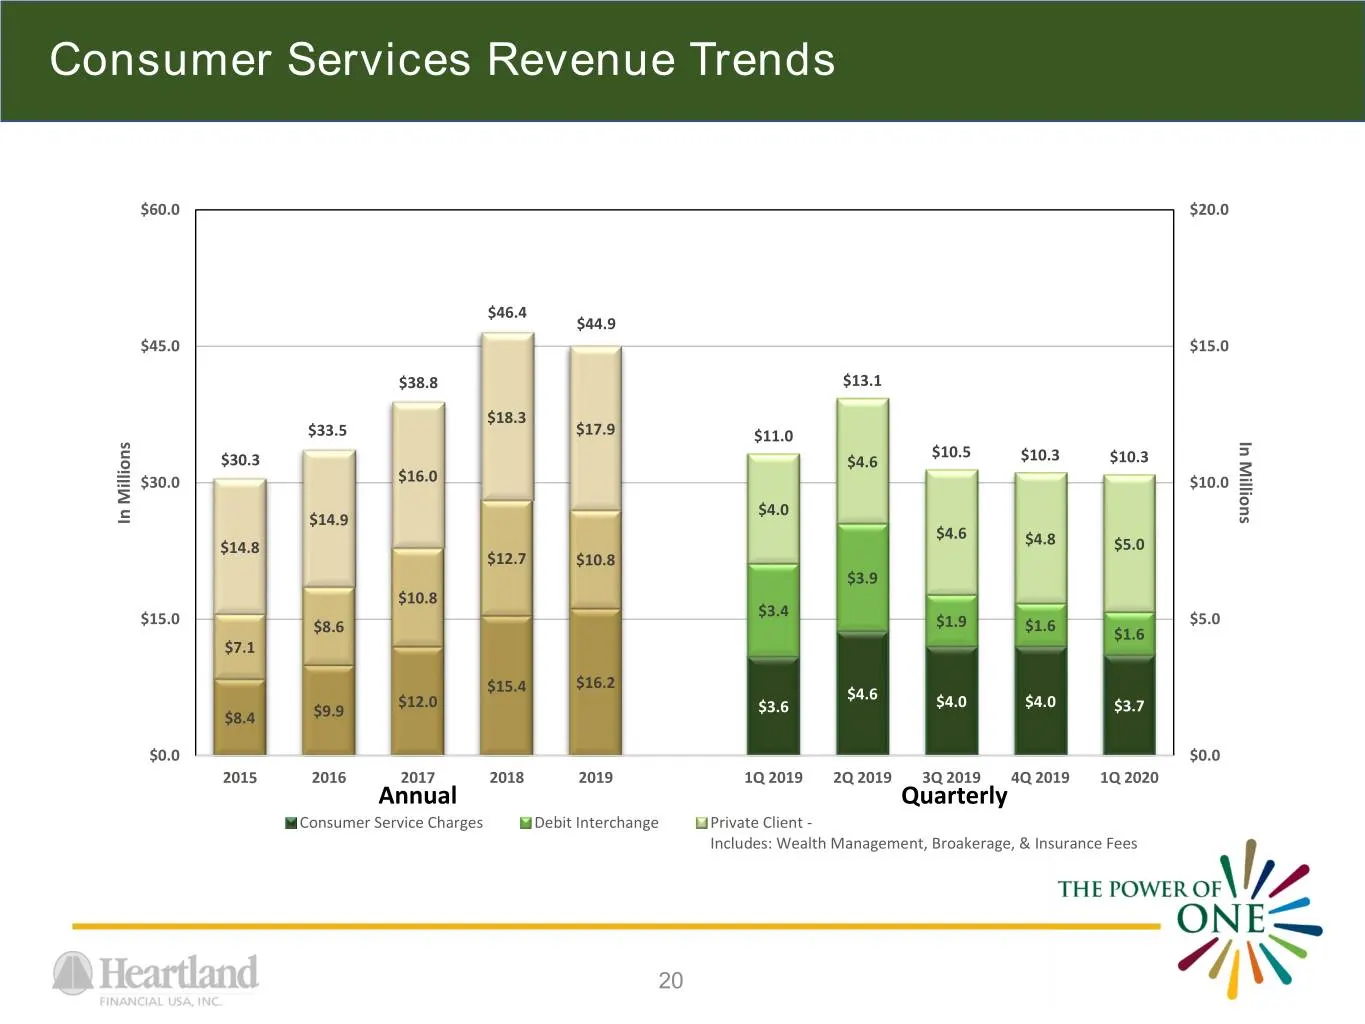
Consumer Services Revenue Trends $60.0 $20.0 $46.4 $44.9 $45.0 $15.0 $38.8 $13.1 $18.3 $33.5 $17.9 $11.0 Millions In $10.5 $30.3 $4.6 $10.3 $10.3 $30.0 $16.0 $10.0 $4.0 InMillions $14.9 $4.6 $14.8 $4.8 $5.0 $12.7 $10.8 $3.9 $10.8 $3.4 $15.0 $1.9 $1.6 $5.0 $8.6 $1.6 $7.1 $16.2 $15.4 $4.6 $12.0 $3.6 $
Slide 21: 2020 Top Priorities
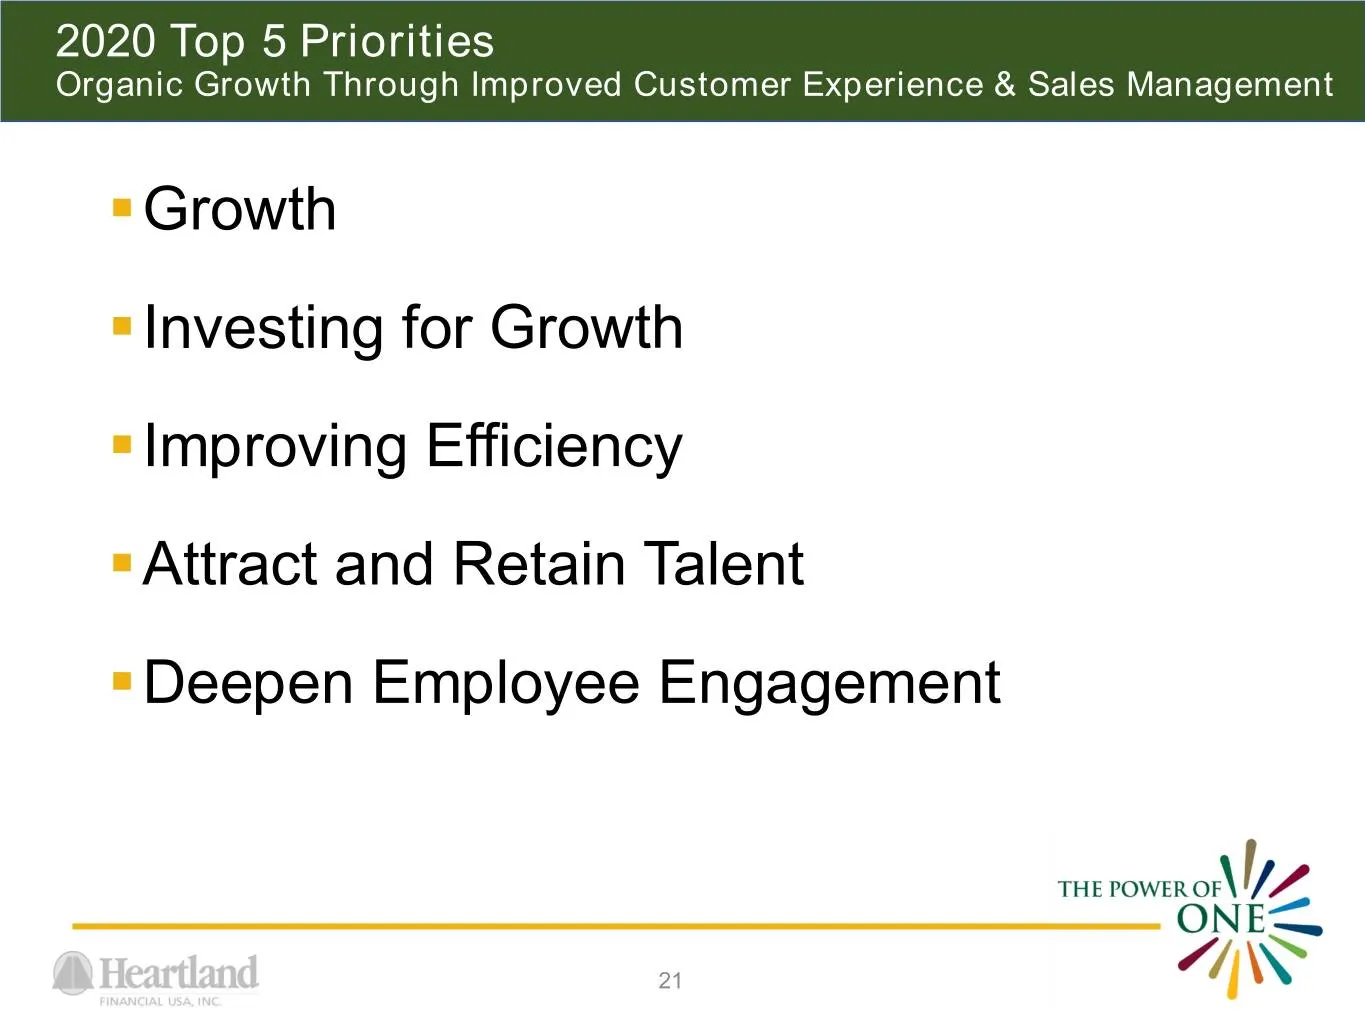
2020 Top 5 Priorities Organic Growth Through Improved Customer Experience & Sales Management .Growth .Investing for Growth .Improving Efficiency .Attract and Retain Talent .Deepen Employee Engagement 21
Slide 22: Conservative Liquidity Profile
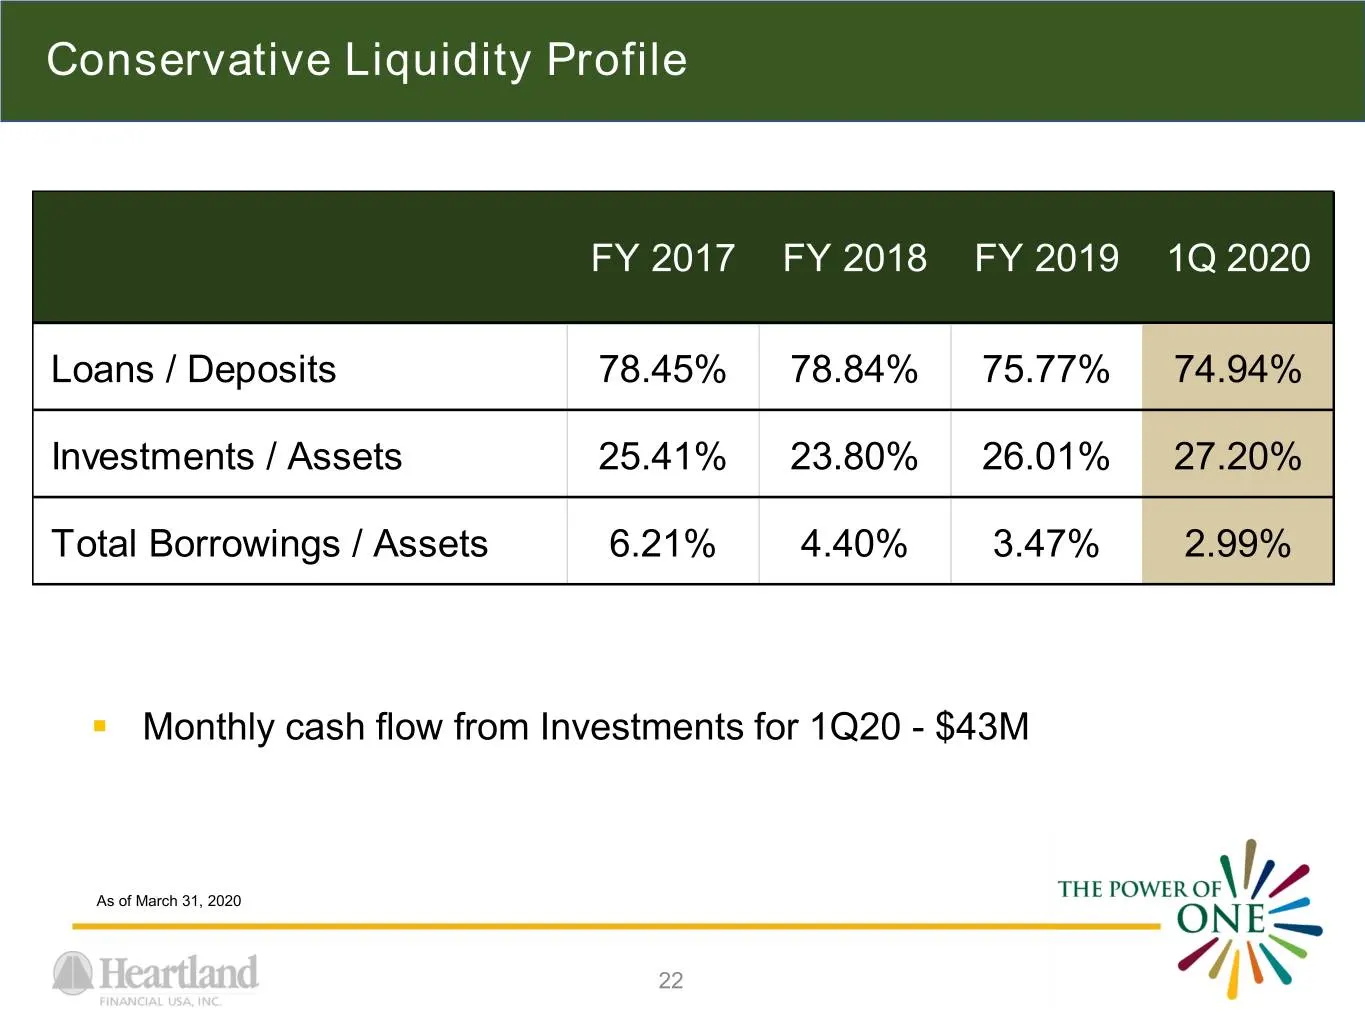
Conservative Liquidity Profile FY 2017 FY 2018 FY 2019 1Q 2020 Loans / Deposits 78.45% 78.84% 75.77% 74.94% Investments / Assets 25.41% 23.80% 26.01% 27.20% Total Borrowings / Assets 6.21% 4.40% 3.47% 2.99% . Monthly cash flow from Investments for 1Q20 - $43M As of March 31, 2020 22
Slide 23: High Performing Securities Portfolio
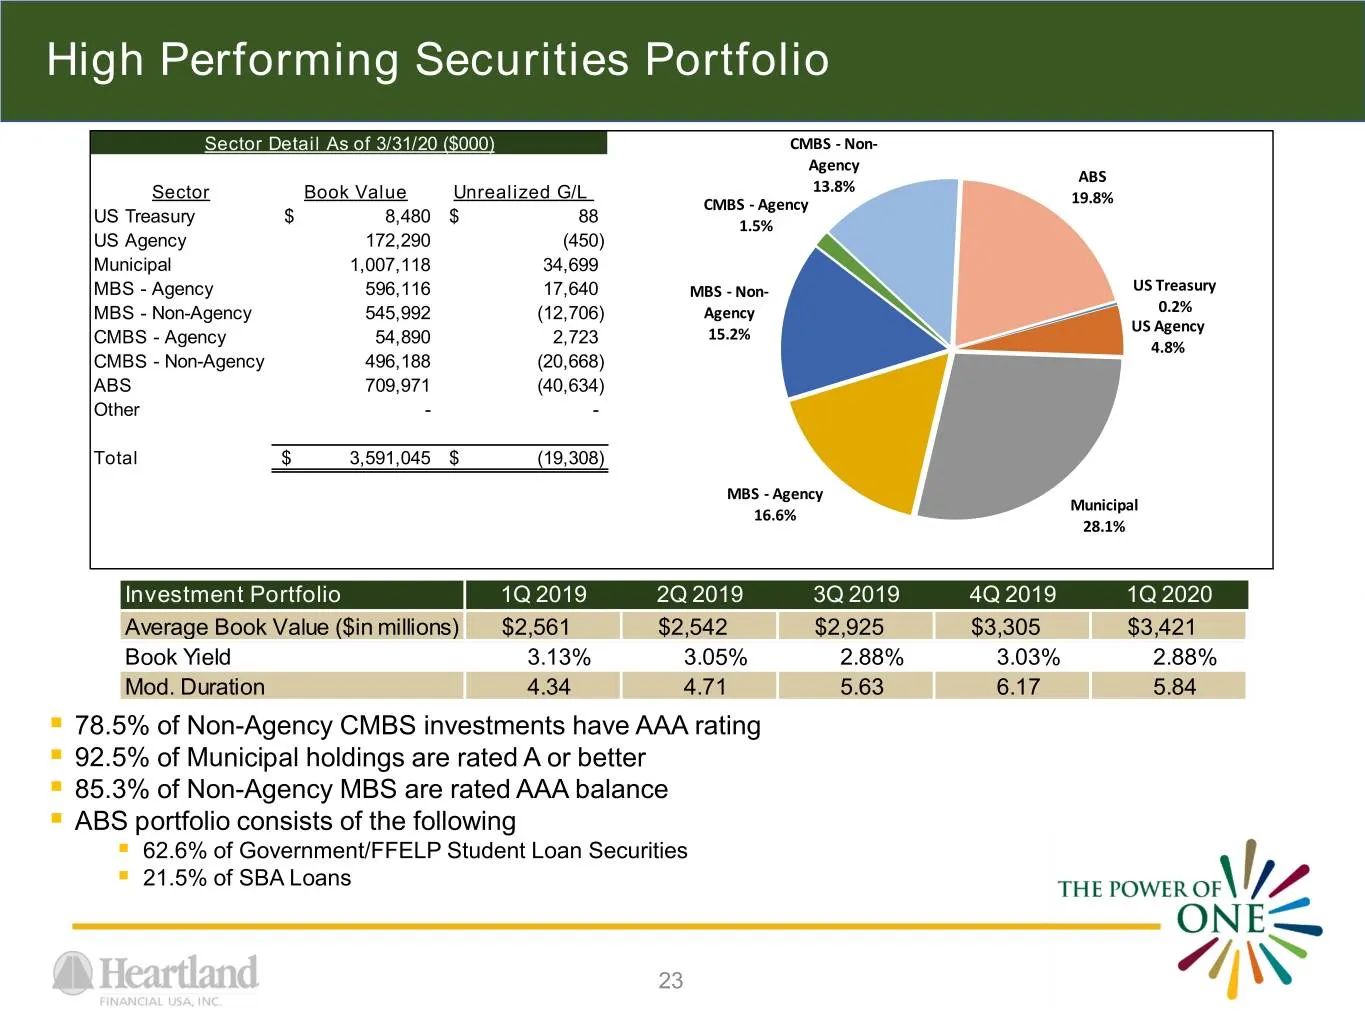
High Performing Securities Portfolio Sector Detail As of 3/31/20 ($000) CMBS - Non- Agency ABS Sector Book Value Unrealized G/L 13.8% CMBS - Agency 19.8% US Treasury $ 8,480 $ 88 1.5% US Agency 172,290 (450) Municipal 1,007,118 34,699 MBS - Agency 596,116 17,640 MBS - Non- US Treasury MBS - Non-Agen
Slide 24: Healthy, Growing Capital Levels
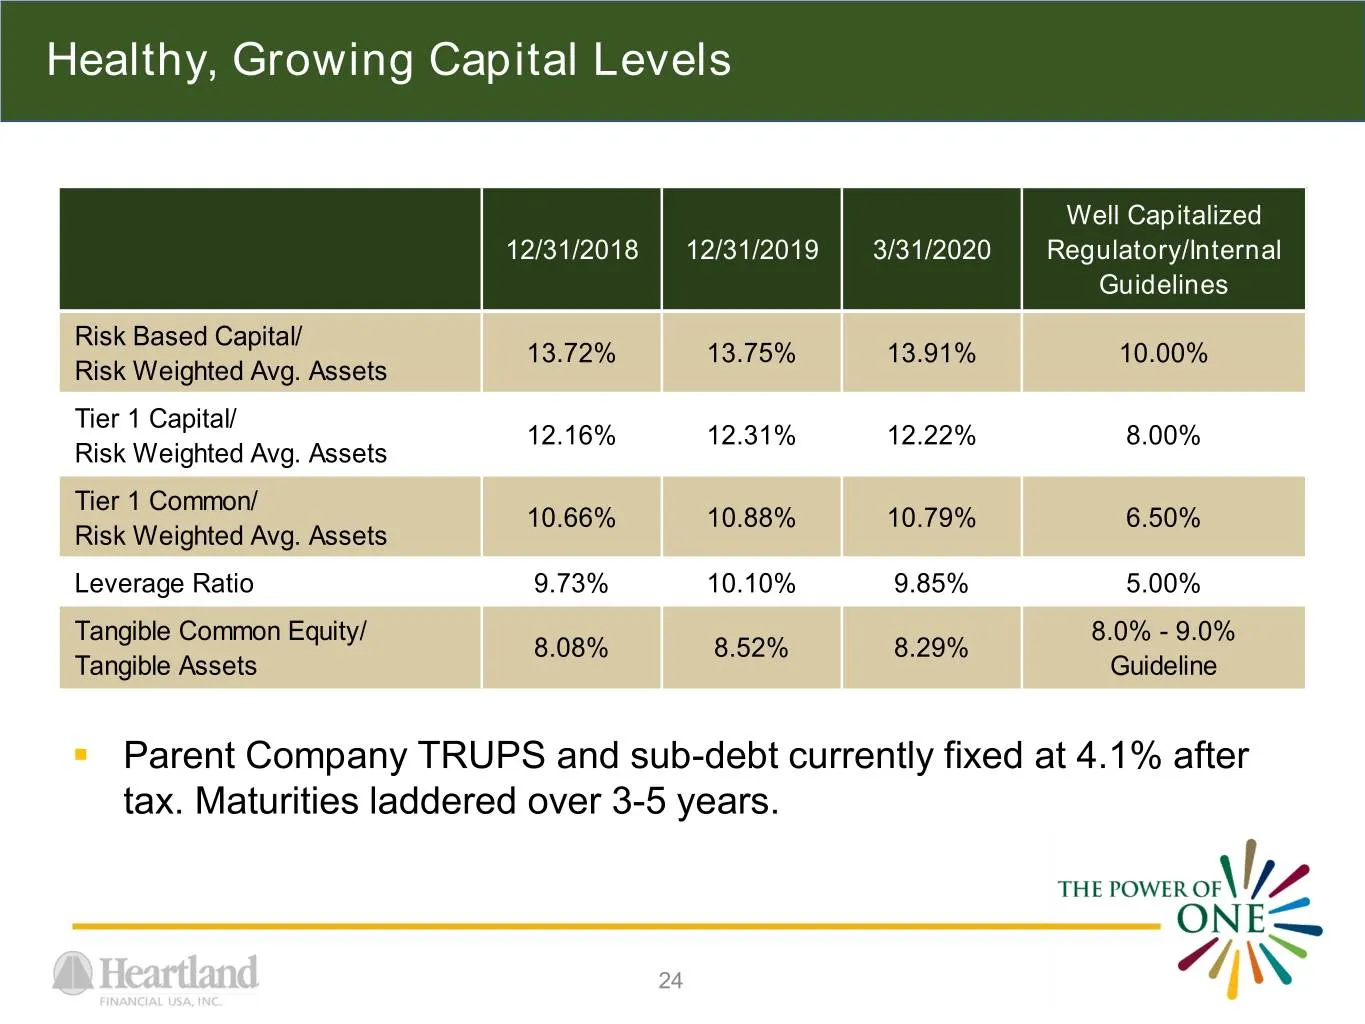
Healthy, Growing Capital Levels Well Capitalized 12/31/2018 12/31/2019 3/31/2020 Regulatory/Internal Guidelines Risk Based Capital/ 13.72% 13.75% 13.91% 10.00% Risk Weighted Avg. Assets Tier 1 Capital/ 12.16% 12.31% 12.22% 8.00% Risk Weighted Avg. Assets Tier 1 Common/ 10.66% 10.88% 10.79% 6.50% Ris
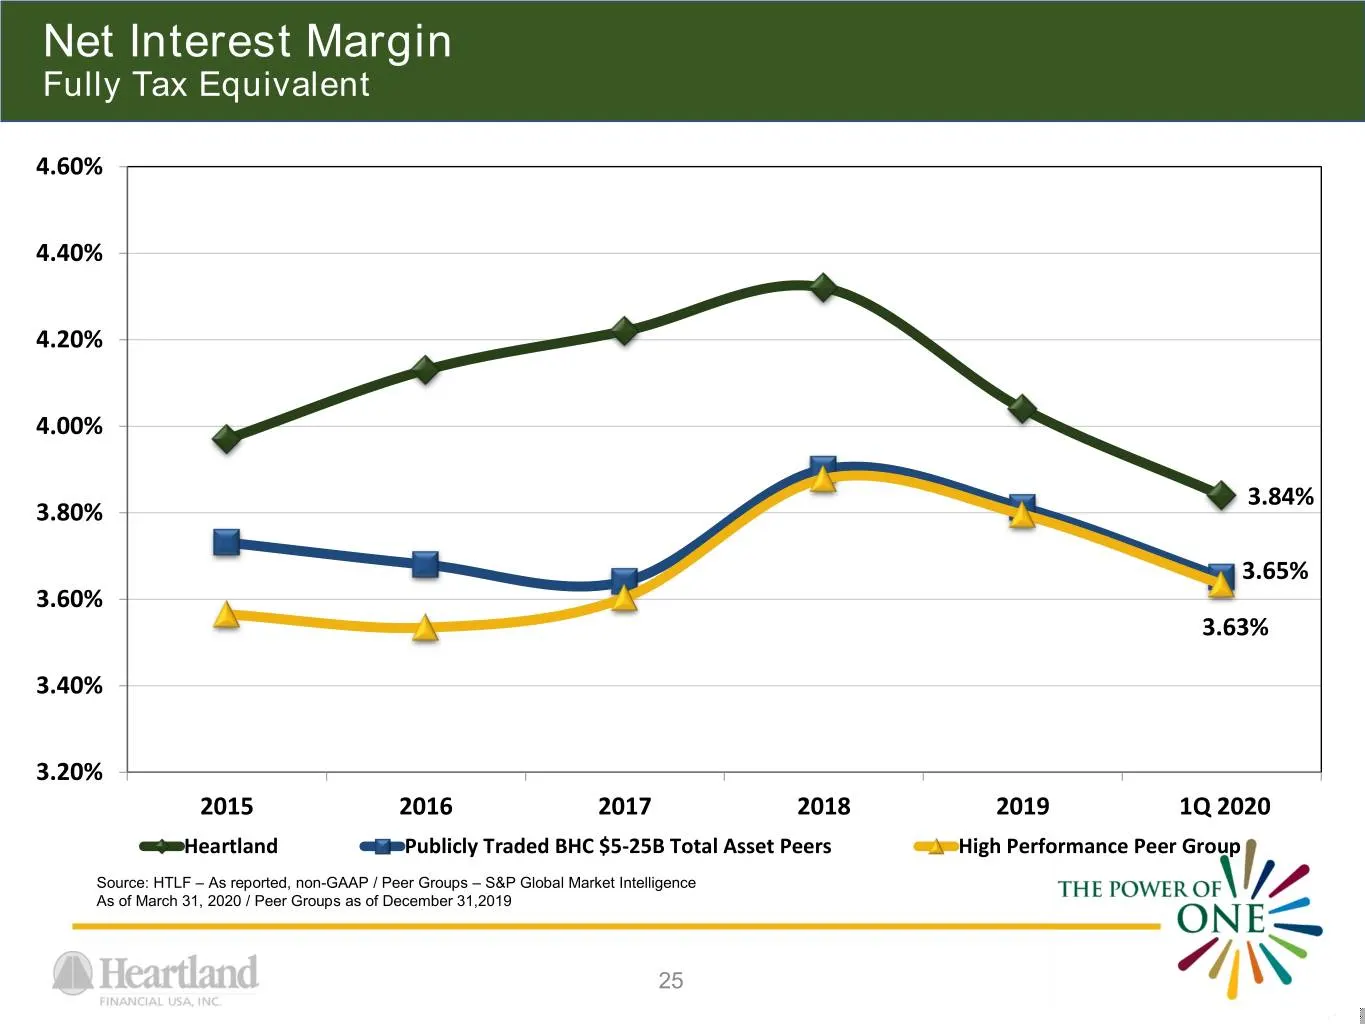
Slide 25: Net Interest Margin
Net Interest Margin Fully Tax Equivalent 4.60% 4.40% 4.20% 4.00% 3.84% 3.80% 3.65% 3.60% 3.63% 3.40% 3.20% 2015 2016 2017 2018 2019 1Q 2020 Heartland Publicly Traded BHC $5-25B Total Asset Peers High Performance Peer Group Source: HTLF – As reported, non-GAAP / Peer Groups – S&P Global Market Intell
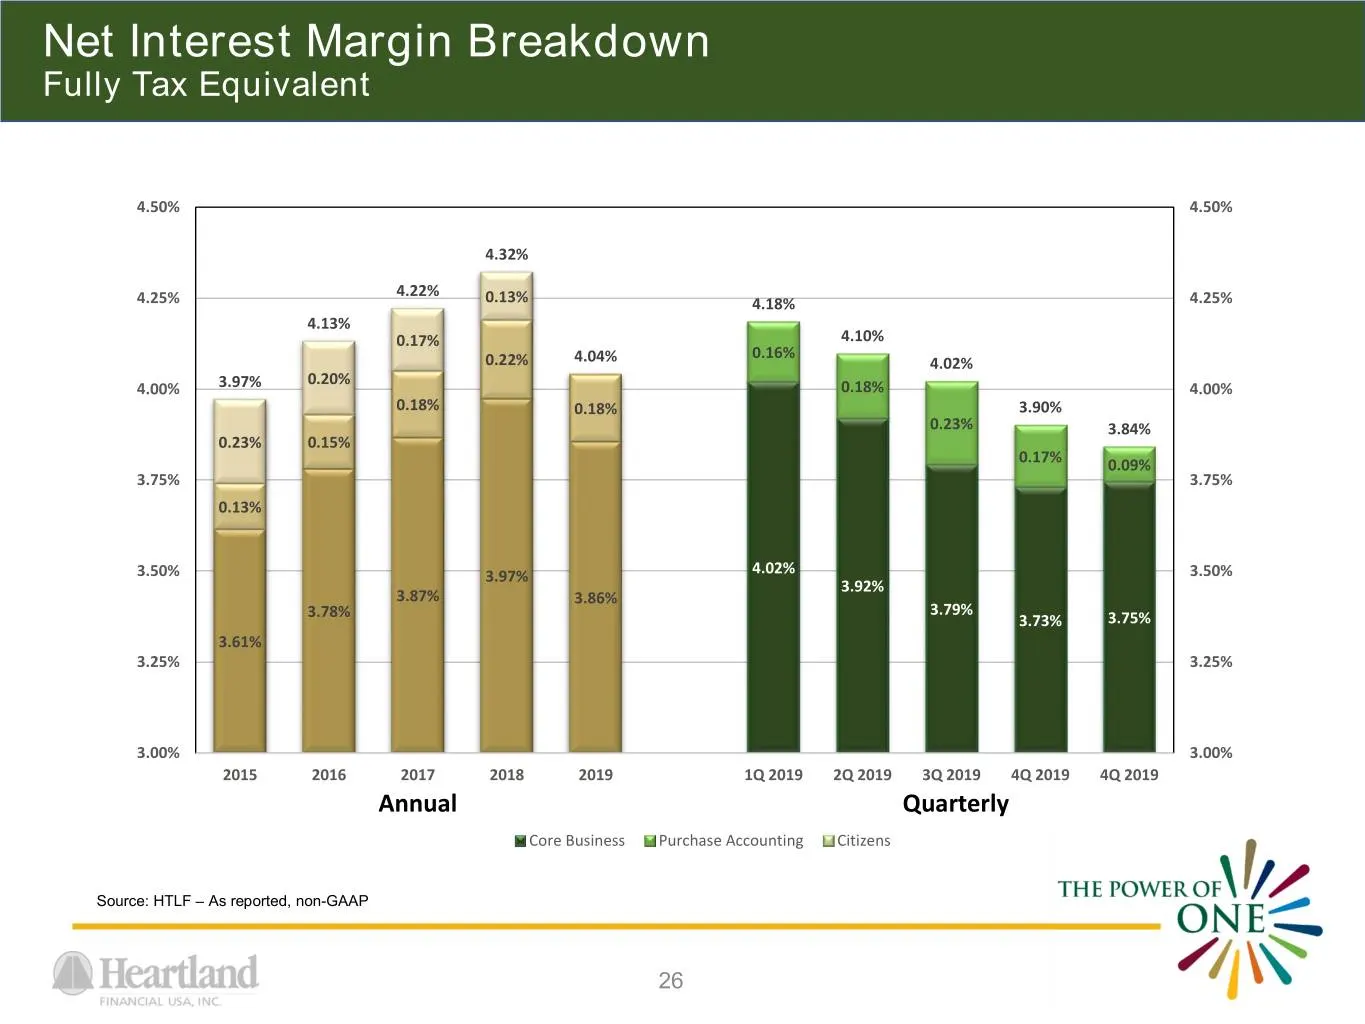
Slide 26: Net Interest Margin Breakdown
Net Interest Margin Breakdown Fully Tax Equivalent 4.50% 4.50% 4.32% 4.22% 4.25% 0.13% 4.18% 4.25% 4.13% 0.17% 4.10% 0.16% 0.22% 4.04% 4.02% 0.20% 4.00% 3.97% 0.18% 4.00% 0.18% 0.18% 3.90% 0.23% 3.84% 0.23% 0.15% 0.17% 0.09% 3.75% 3.75% 0.13% 3.50% 3.97% 4.02% 3.50% 3.92% 3.87% 3.86% 3.78% 3.79% 3.7
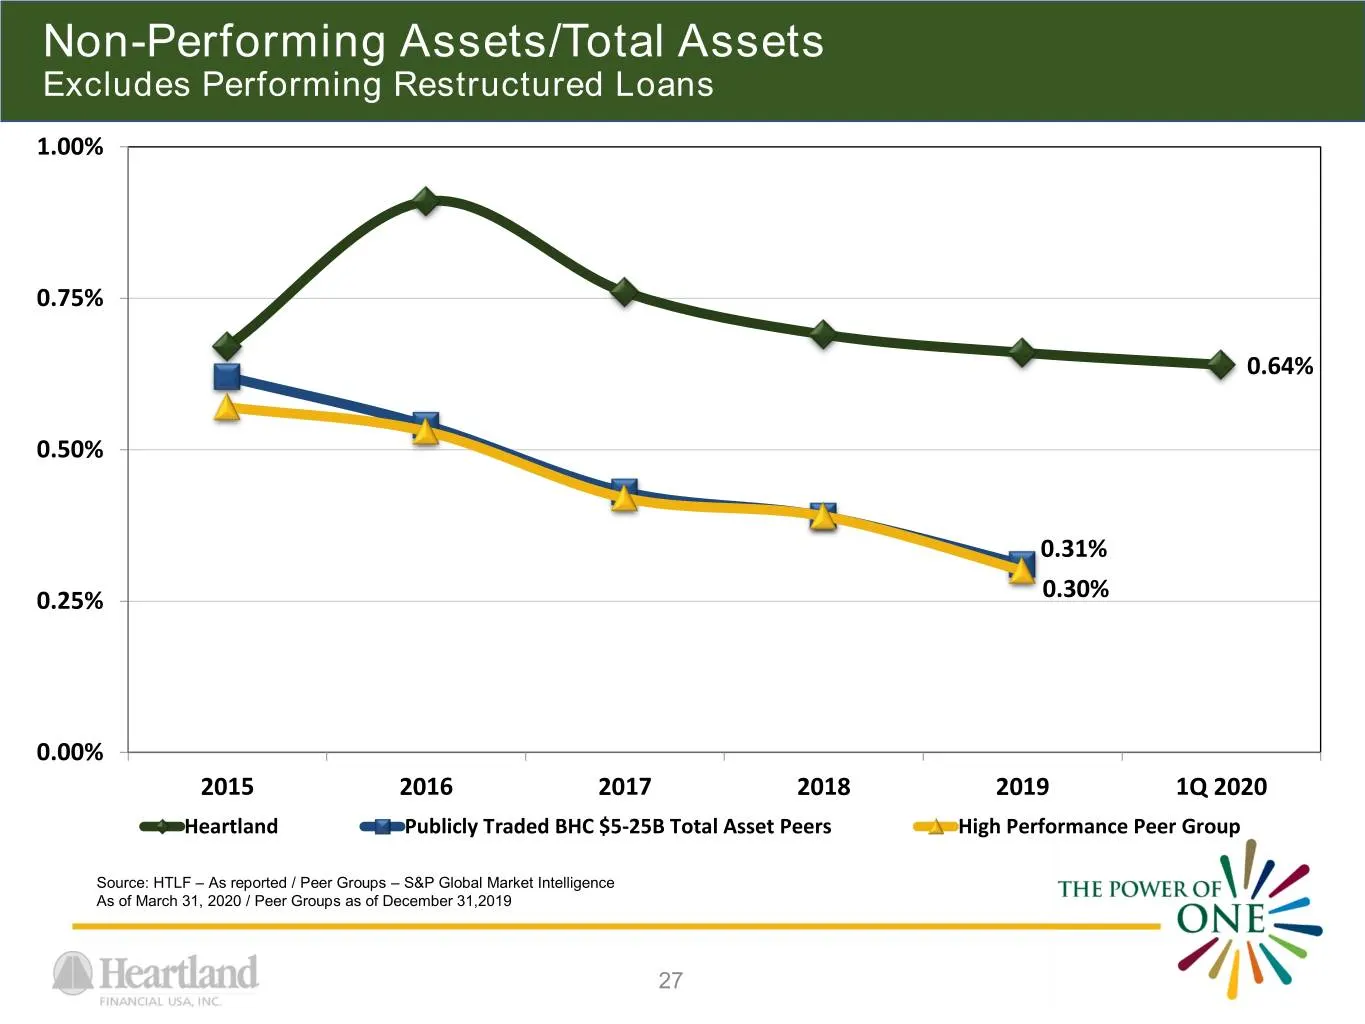
Slide 27: Non-Performing Assets/Total Assets
Non-Performing Assets/Total Assets Excludes Performing Restructured Loans 1.00% 0.75% 0.64% 0.50% 0.31% 0.25% 0.30% 0.00% 2015 2016 2017 2018 2019 1Q 2020 Heartland Publicly Traded BHC $5-25B Total Asset Peers High Performance Peer Group Source: HTLF – As reported / Peer Groups – S&P Global Market I
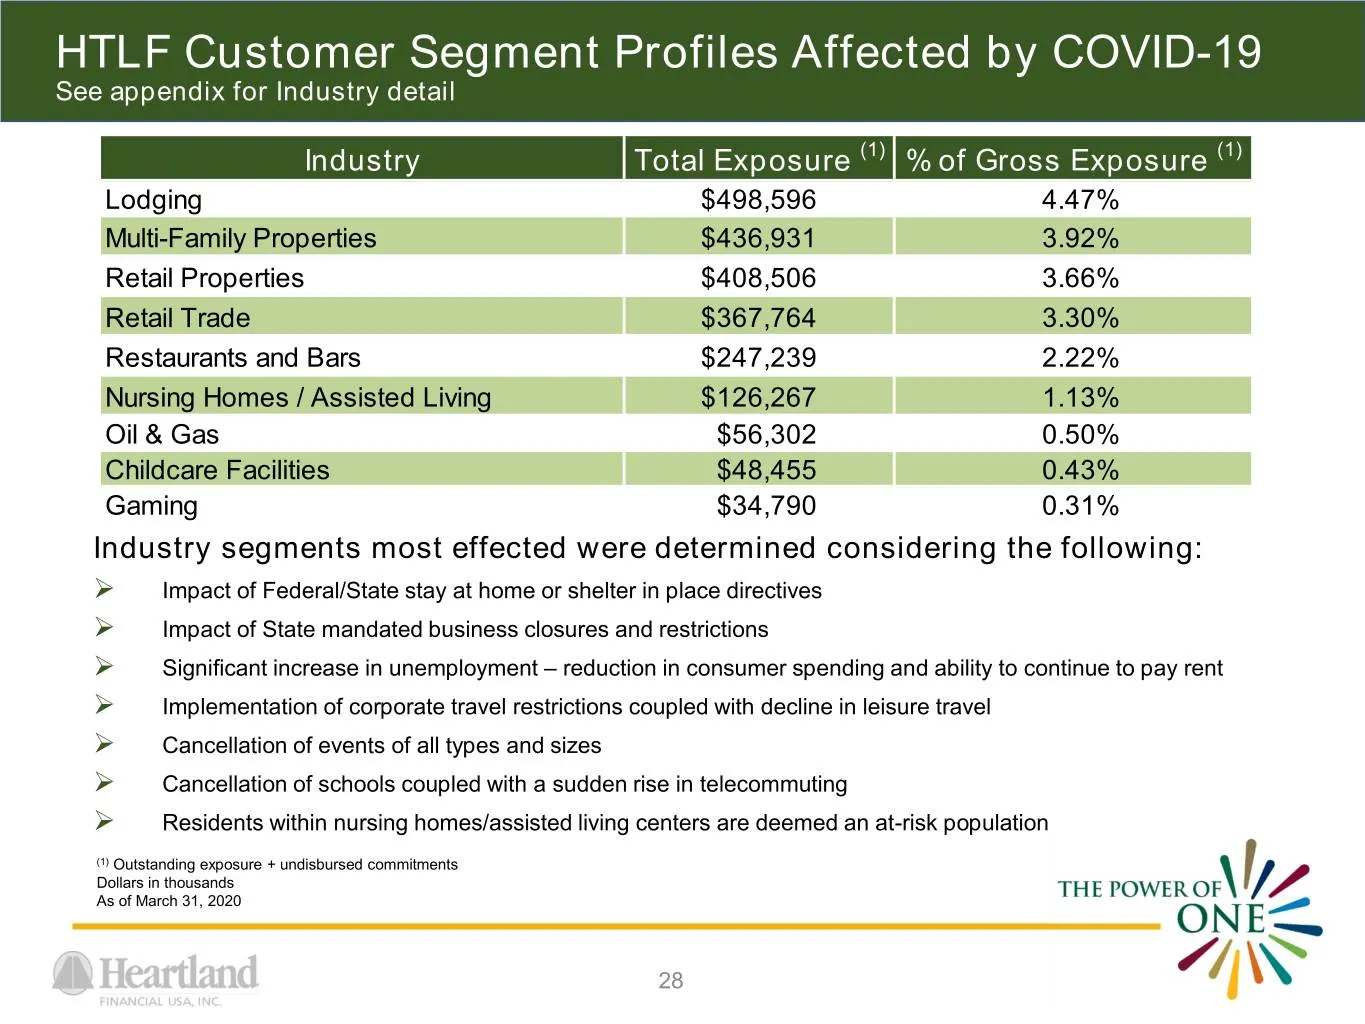
Slide 28: HTLF Customer Segment Profiles Affected by COVID-19
HTLF Customer Segment Profiles Affected by COVID-19 See appendix for Industry detail Industry Total Exposure (1) % of Gross Exposure (1) Lodging $498,596 4.47% Multi-Family Properties $436,931 3.92% Retail Properties $408,506 3.66% Retail Trade $367,764 3.30% Restaurants and Bars $247,239 2.22% Nurs
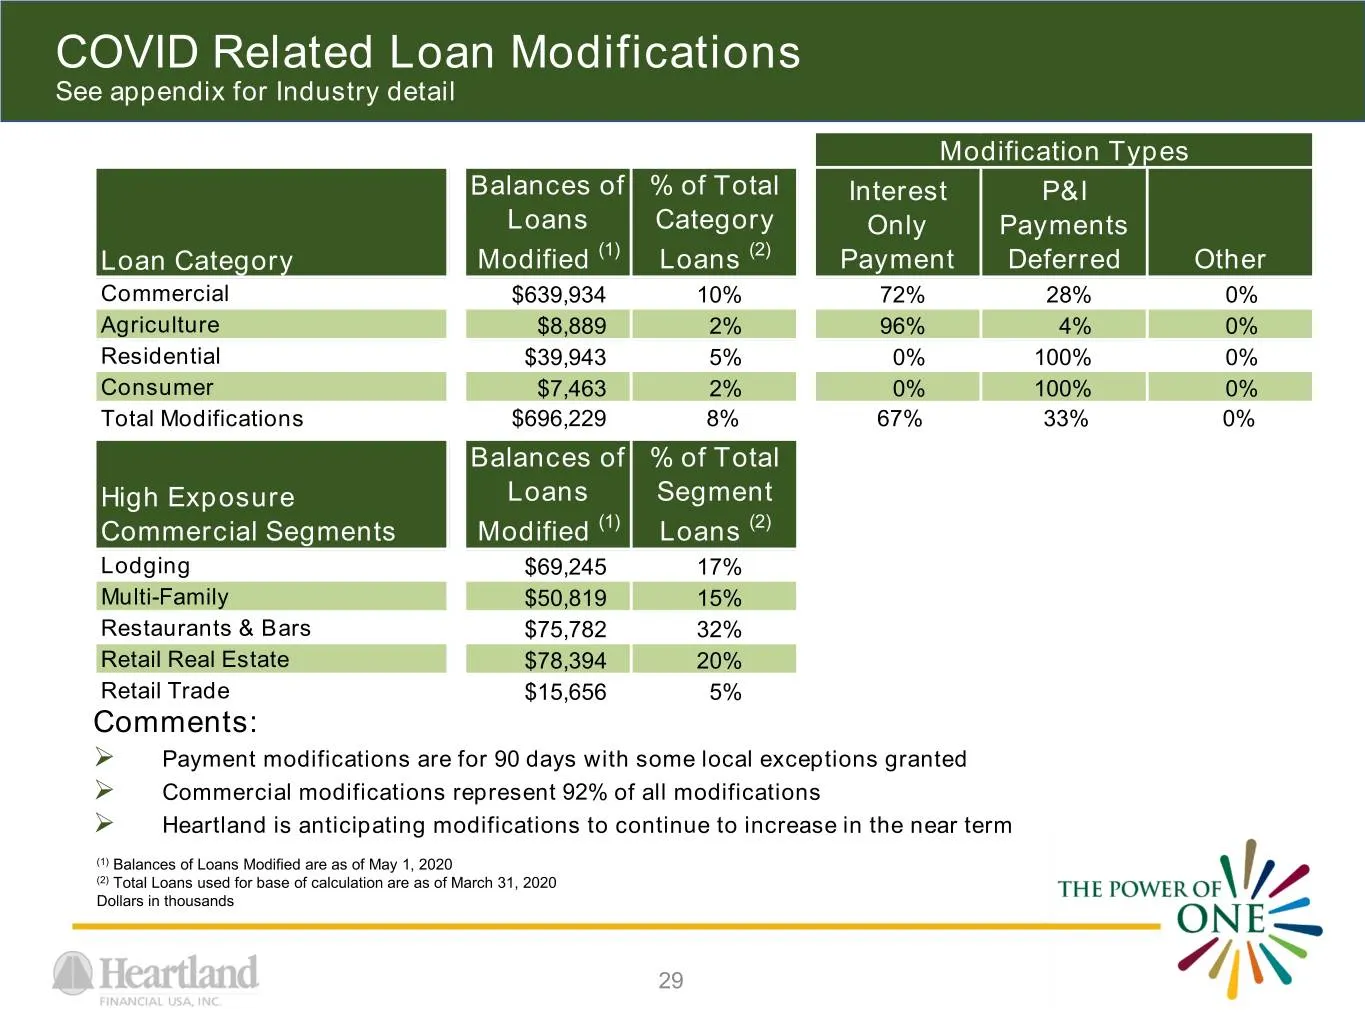
Slide 29: COVID Related Loan Modifications
COVID Related Loan Modifications See appendix for Industry detail Modification Types Balances of % of Total Interest P&I Loans Category Only Payments Loan Category Modified (1) Loans (2) Payment Deferred Other Commercial $639,934 10% 72% 28% 0% Agriculture $8,889 2% 96% 4% 0% Residential $39,943 5%
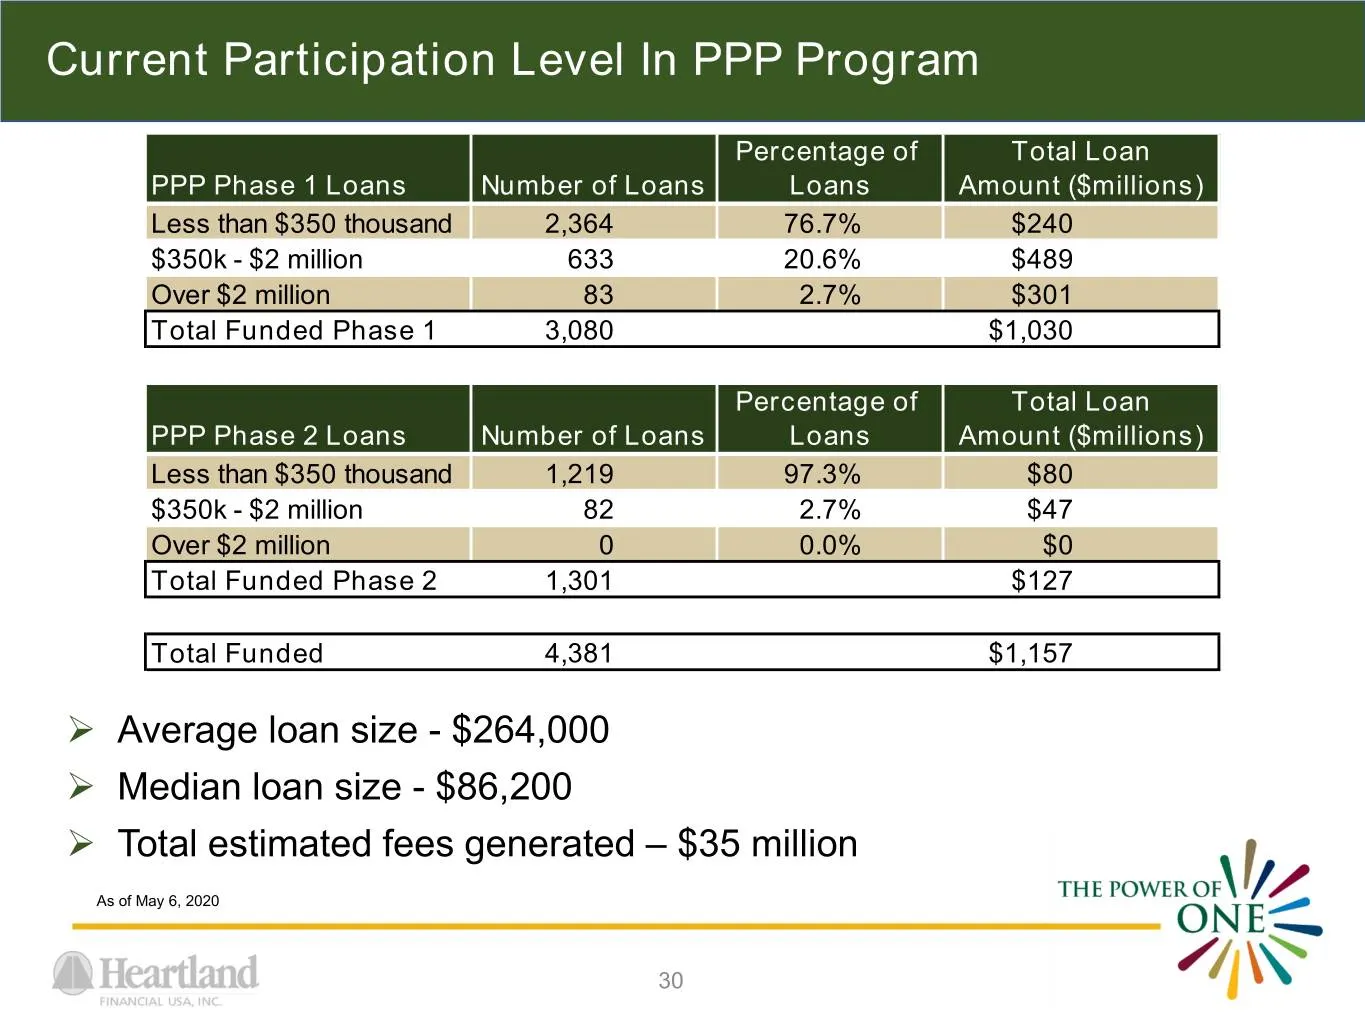
Slide 30: Current Participation Level In PPP Program
Current Participation Level In PPP Program Percentage of Total Loan PPP Phase 1 Loans Number of Loans Loans Amount ($millions) Less than $350 thousand 2,364 76.7% $240 $350k - $2 million 633 20.6% $489 Over $2 million 83 2.7% $301 Total Funded Phase 1 3,080 $1,030 Percentage of Total Loan PPP Phase
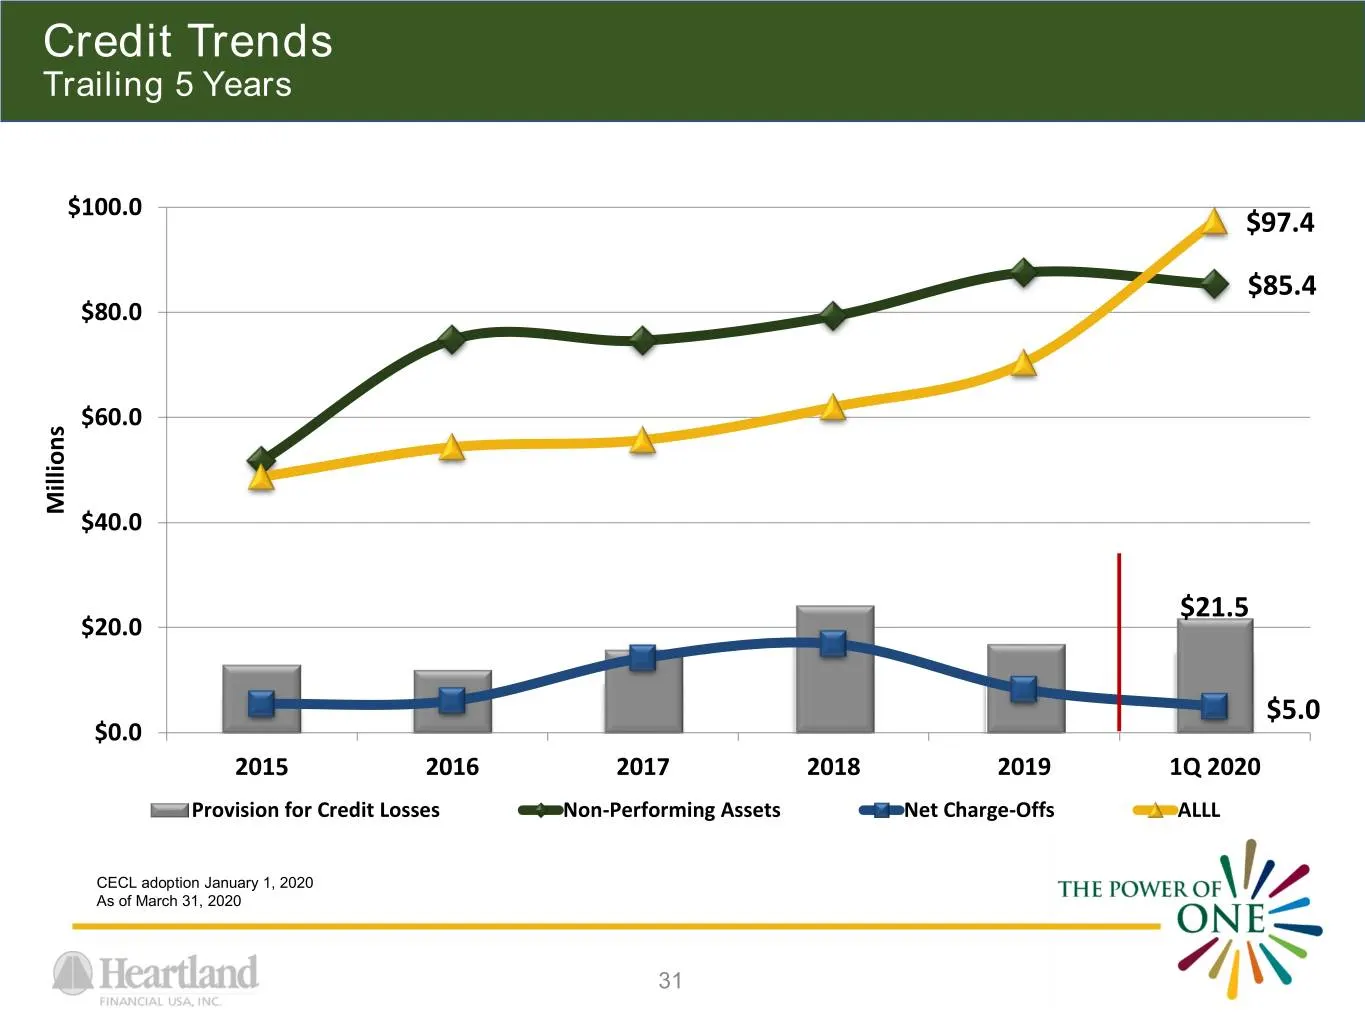
Slide 31: Credit Trends
Credit Trends Trailing 5 Years $100.0 $97.4 $85.4 $80.0 $60.0 Millions $40.0 $21.5 $20.0 $5.0 $0.0 2015 2016 2017 2018 2019 1Q 2020 Provision for Credit Losses Non-Performing Assets Net Charge-Offs ALLL CECL adoption January 1, 2020 As of March 31, 2020 31
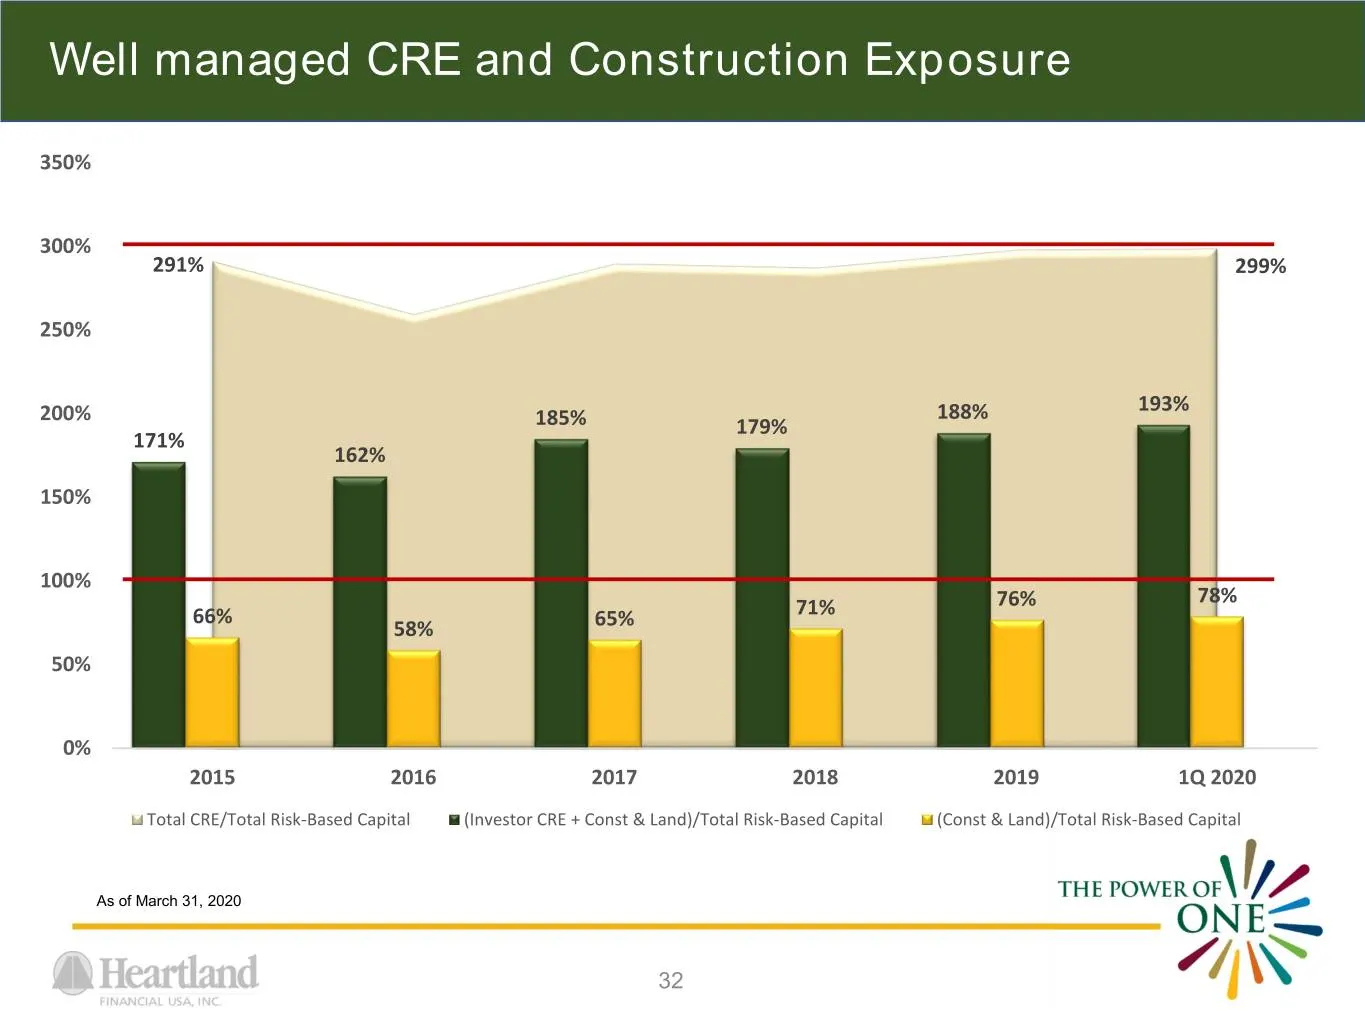
Slide 32: Well managed CRE and Construction Exposure
Well managed CRE and Construction Exposure 350% 300% 291% 299% 250% 200% 188% 193% 185% 179% 171% 162% 150% 100% 76% 78% 66% 71% 58% 65% 50% 0% 2015 2016 2017 2018 2019 1Q 2020 Total CRE/Total Risk-Based Capital (Investor CRE + Const & Land)/Total Risk-Based Capital (Const & Land)/Total Risk-Based C
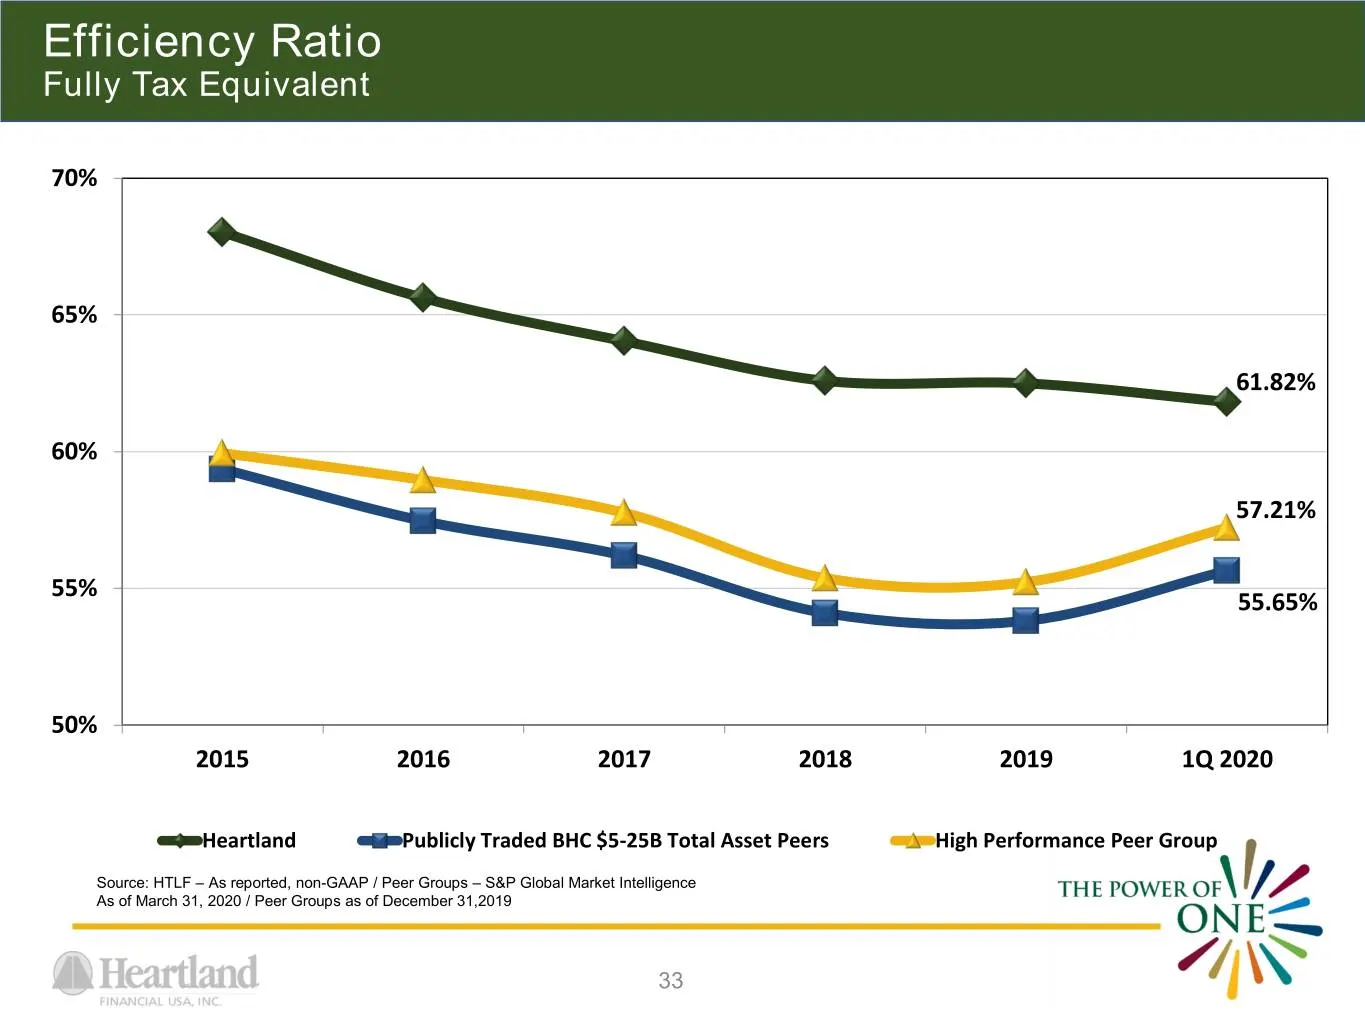
Slide 33: Efficiency Ratio
Efficiency Ratio Fully Tax Equivalent 70% 65% 61.82% 60% 57.21% 55% 55.65% 50% 2015 2016 2017 2018 2019 1Q 2020 Heartland Publicly Traded BHC $5-25B Total Asset Peers High Performance Peer Group Source: HTLF – As reported, non-GAAP / Peer Groups – S&P Global Market Intelligence As of March 31, 2020
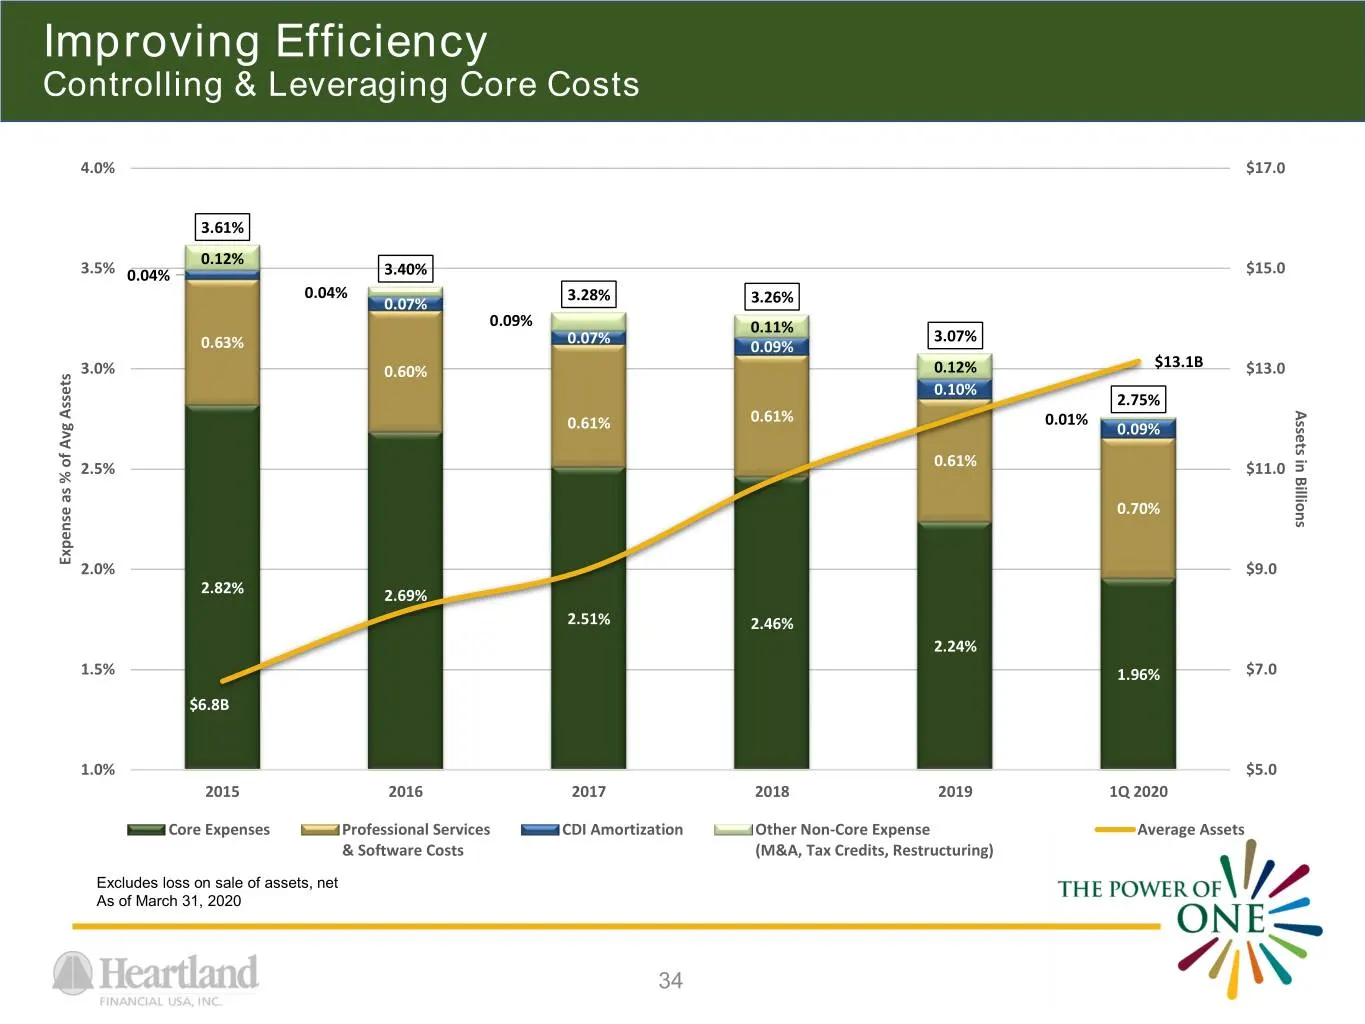
Slide 34: Improving Efficiency
Improving Efficiency Controlling & Leveraging Core Costs 4.0% $17.0 3.61% 0.12% 3.5% 0.04% 3.40% $15.0 0.04% 3.28% 0.07% 3.26% 0.09% 0.11% 0.07% 3.07% 0.63% 0.09% $13.1B 3.0% 0.60% 0.12% $13.0 0.10% 2.75% Assets in BillionsAssetsin 0.61% 0.01% 0.61% 0.09% 2.5% 0.61% $11.0 0.70% Expense as % of Avg A
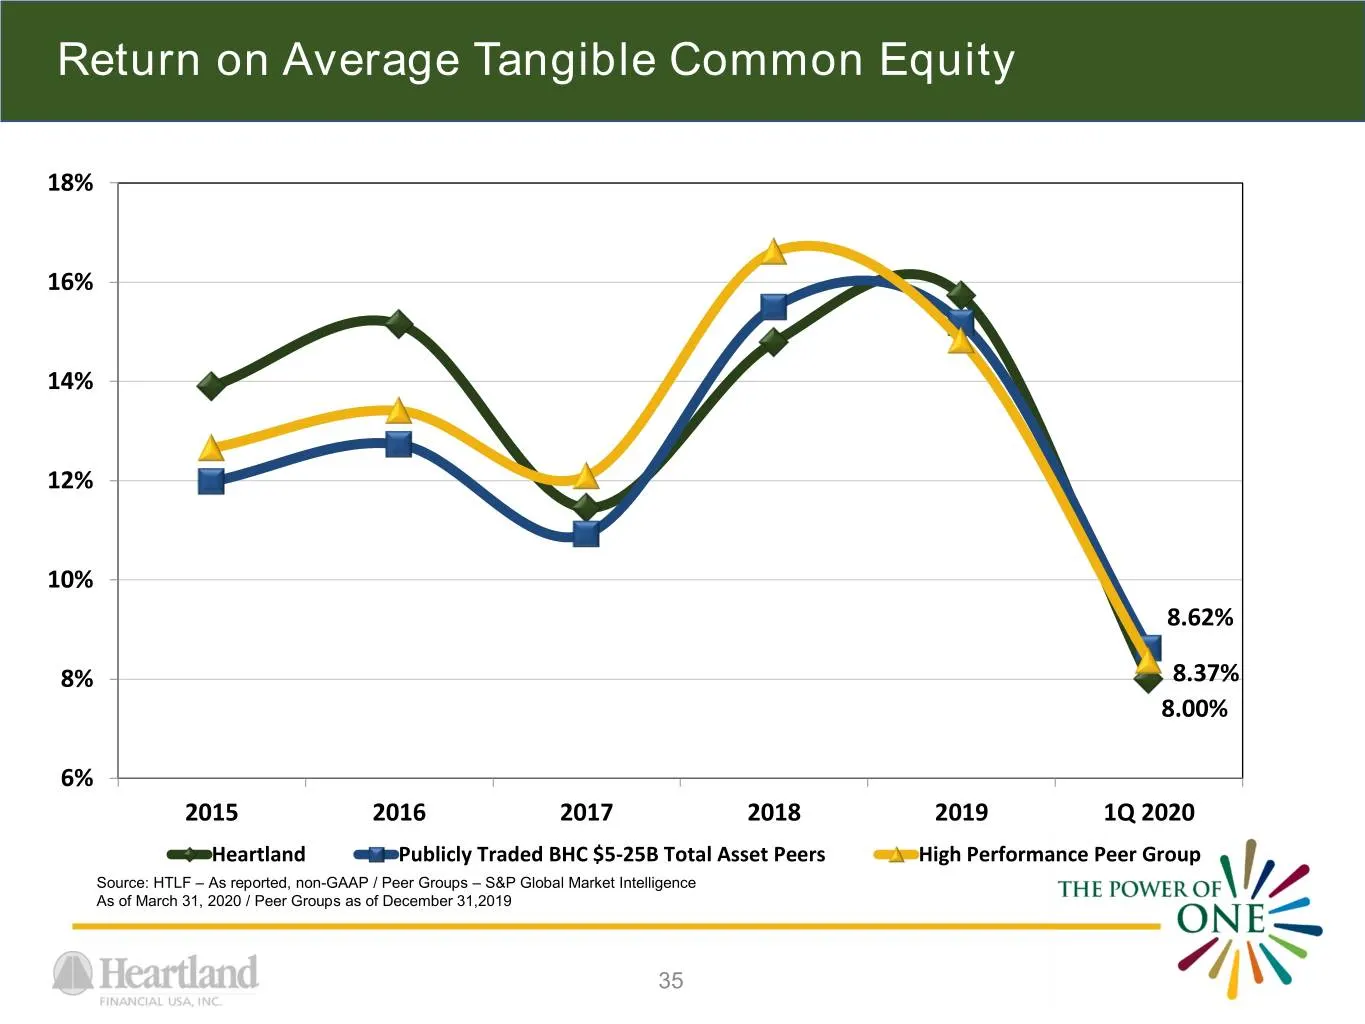
Slide 35: Return on Average Tangible Common Equity
Return on Average Tangible Common Equity 18% 16% 14% 12% 10% 8.62% 8% 8.37% 8.00% 6% 2015 2016 2017 2018 2019 1Q 2020 Heartland Publicly Traded BHC $5-25B Total Asset Peers High Performance Peer Group Source: HTLF – As reported, non-GAAP / Peer Groups – S&P Global Market Intelligence As of March 31,
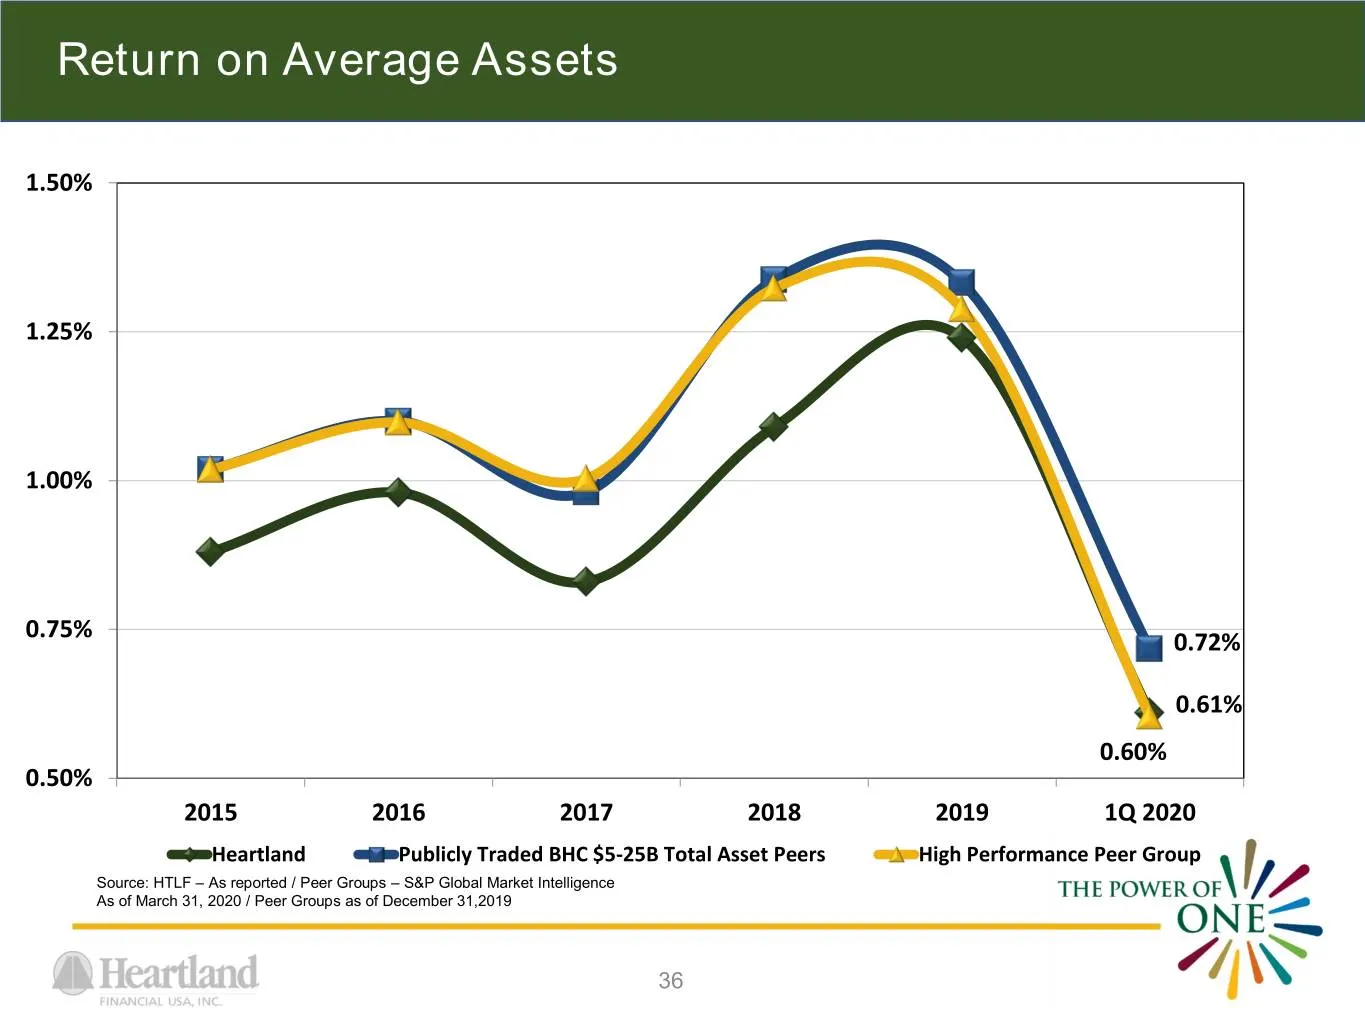
Slide 36: Return on Average Assets
Return on Average Assets 1.50% 1.25% 1.00% 0.75% 0.72% 0.61% 0.60% 0.50% 2015 2016 2017 2018 2019 1Q 2020 Heartland Publicly Traded BHC $5-25B Total Asset Peers High Performance Peer Group Source: HTLF – As reported / Peer Groups – S&P Global Market Intelligence As of March 31, 2020 / Peer Groups as
Slide 37: Investment Summary
Investment Summary . Diverse footprint reduces risk and enhances growth potential . Disciplined and proven acquirer . Large, expanding low cost core deposit base . Strong net interest margin . Solid credit metrics . Conservative liquidity risk profile . Healthy, growing capital levels 37
Slide 38: Analyst Ratings
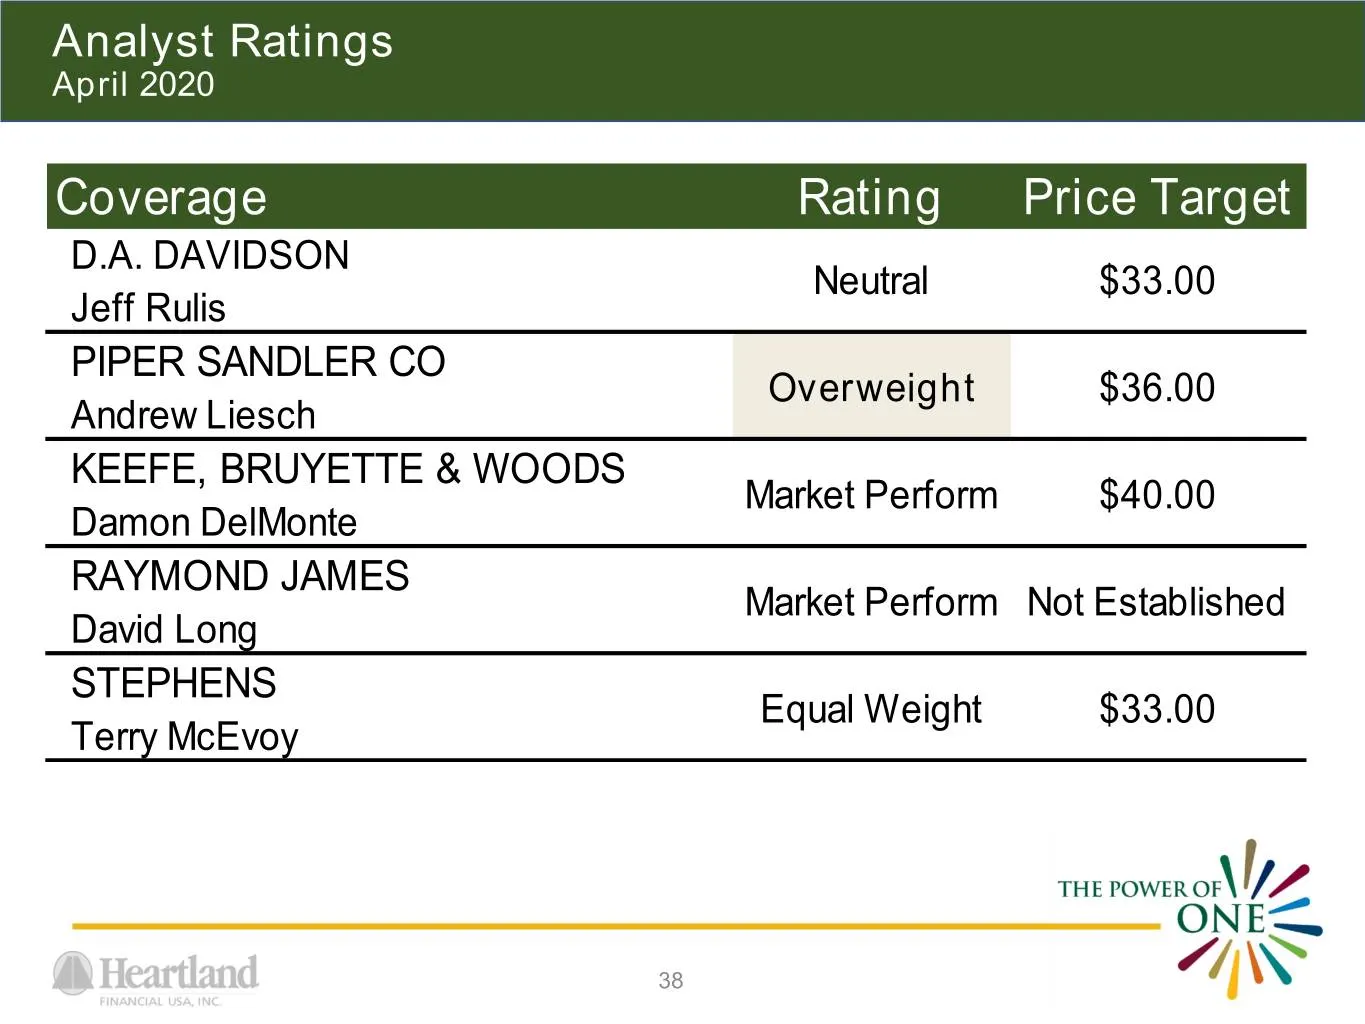
Analyst Ratings April 2020 Coverage Rating Price Target D.A. DAVIDSON Neutral $33.00 Jeff Rulis PIPER SANDLER CO Overweight $36.00 Andrew Liesch KEEFE, BRUYETTE & WOODS Market Perform $40.00 Damon DelMonte RAYMOND JAMES Market Perform Not Established David Long STEPHENS Equal Weight $33.00 Terry McE
Slide 39: Contact Information
Contact Information LYNN B. FULLER BRUCE K. LEE Executive Operating Chairman President a Heartland a Heartland Chief Executive Officer P: 563.589.2105 FINANCIAL USA, INC. FINANCIAL USA, INC, F 563.589.2011 P: 563.587.4176 TOLL-FREE 888.739.2100 F: 563.589.1951 [email protected] TOLL-FREE 888.739.2100
Slide 40: Appendix
APPENDIX MW THE POWE ON E = 0 71\\~
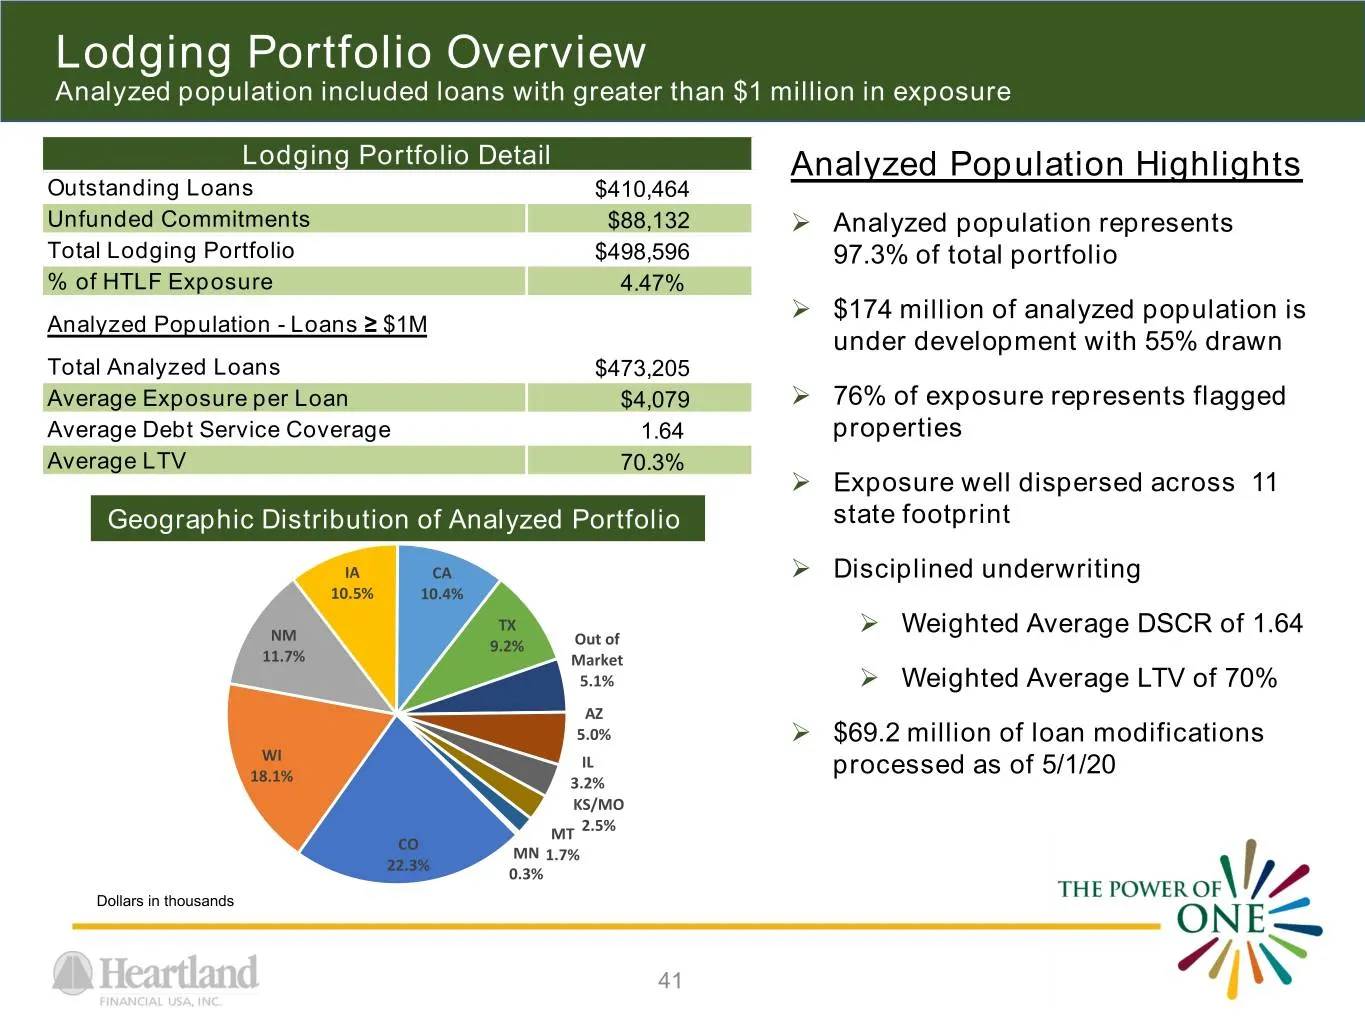
Slide 41: Lodging Portfolio Overview
Lodging Portfolio Overview Analyzed population included loans with greater than $1 million in exposure Lodging Portfolio Detail Analyzed Population Highlights Outstanding Loans $410,464 Unfunded Commitments $88,132 Analyzed population represents Total Lodging Portfolio $498,596 97.3% of total port
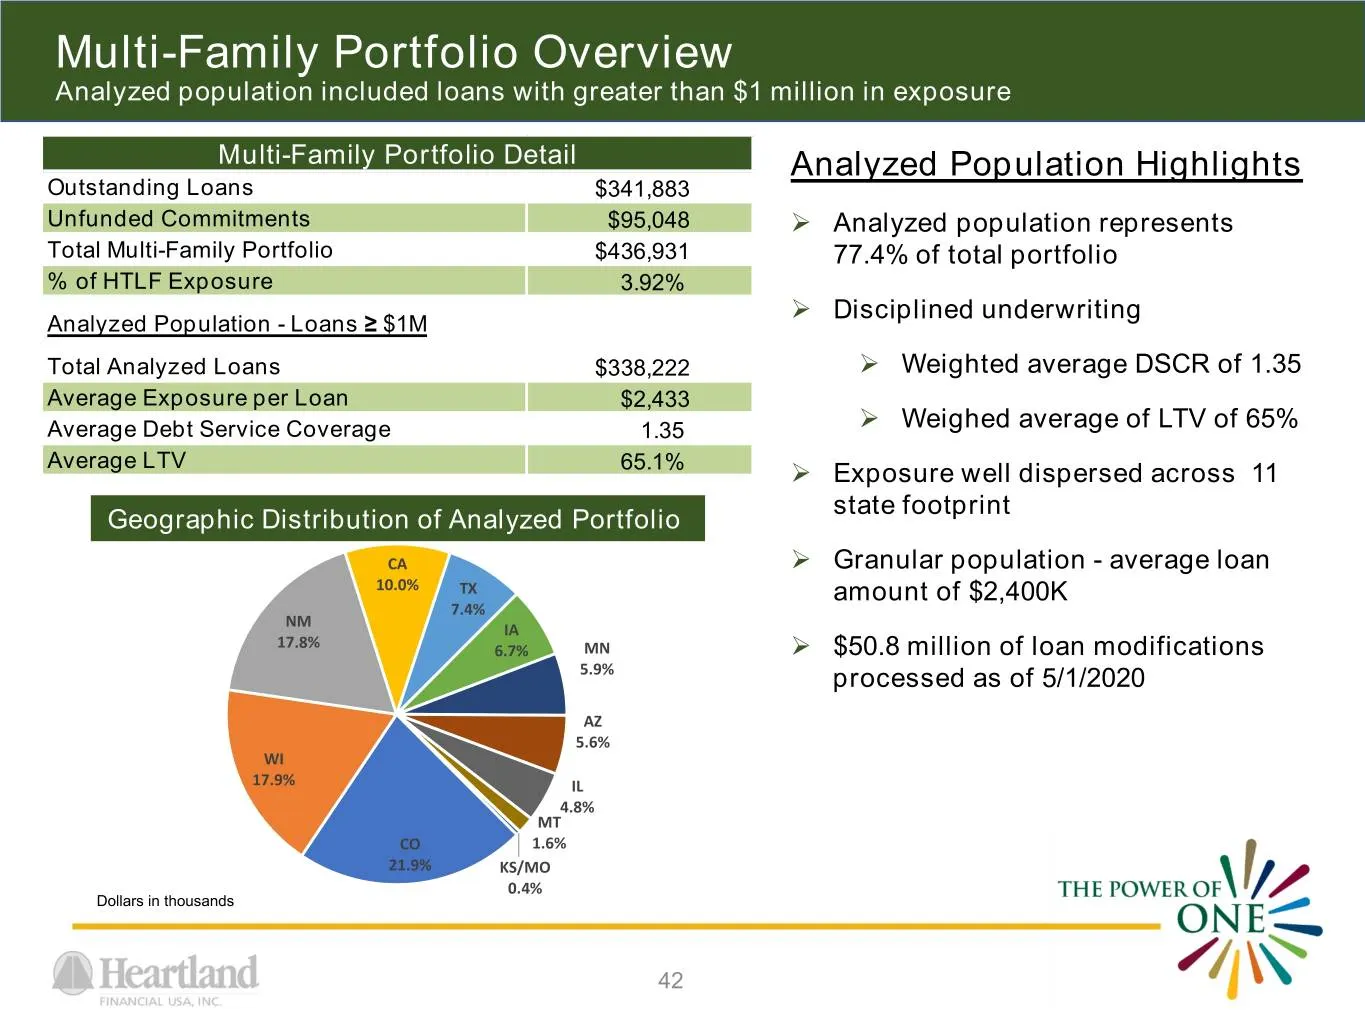
Slide 42: Multi-Family Portfolio Overview
Multi-Family Portfolio Overview Analyzed population included loans with greater than $1 million in exposure Multi-Family Portfolio Detail Analyzed Population Highlights Outstanding Loans $341,883 Unfunded Commitments $95,048 Analyzed population represents Total Multi-Family Portfolio $436,931 77.4
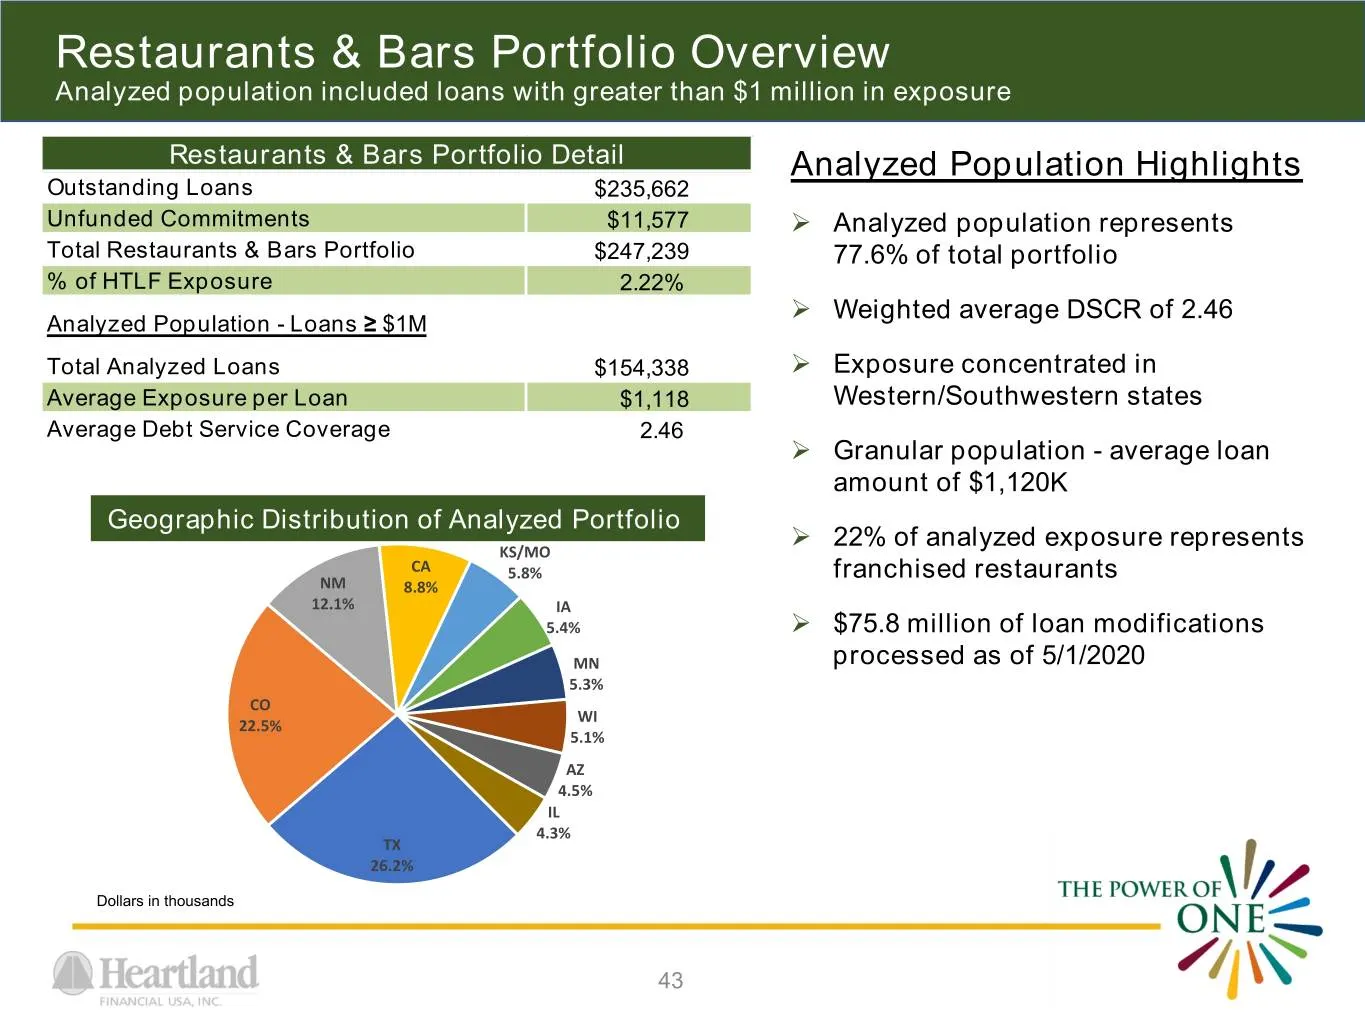
Slide 43: Restaurants & Bars Portfolio Overview
Restaurants & Bars Portfolio Overview Analyzed population included loans with greater than $1 million in exposure Restaurants & Bars Portfolio Detail Analyzed Population Highlights Outstanding Loans $235,662 Unfunded Commitments $11,577 Analyzed population represents Total Restaurants & Bars Portf
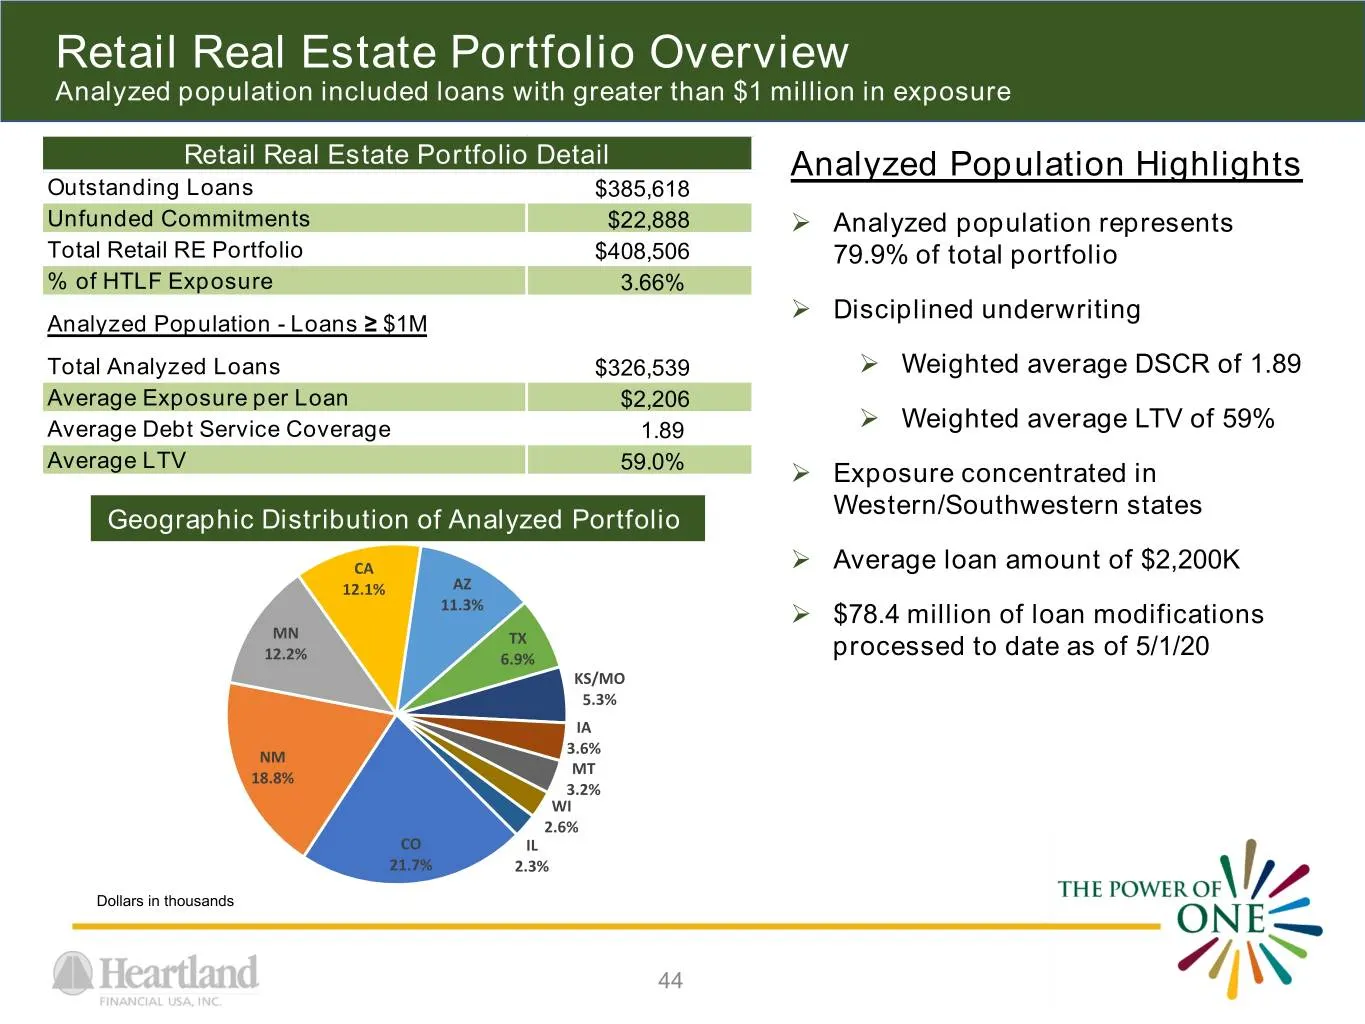
Slide 44: Retail Real Estate Portfolio Overview
Retail Real Estate Portfolio Overview Analyzed population included loans with greater than $1 million in exposure Retail Real Estate Portfolio Detail Analyzed Population Highlights Outstanding Loans $385,618 Unfunded Commitments $22,888 Analyzed population represents Total Retail RE Portfolio $408
Slide 45: Retail Trade Portfolio Overview
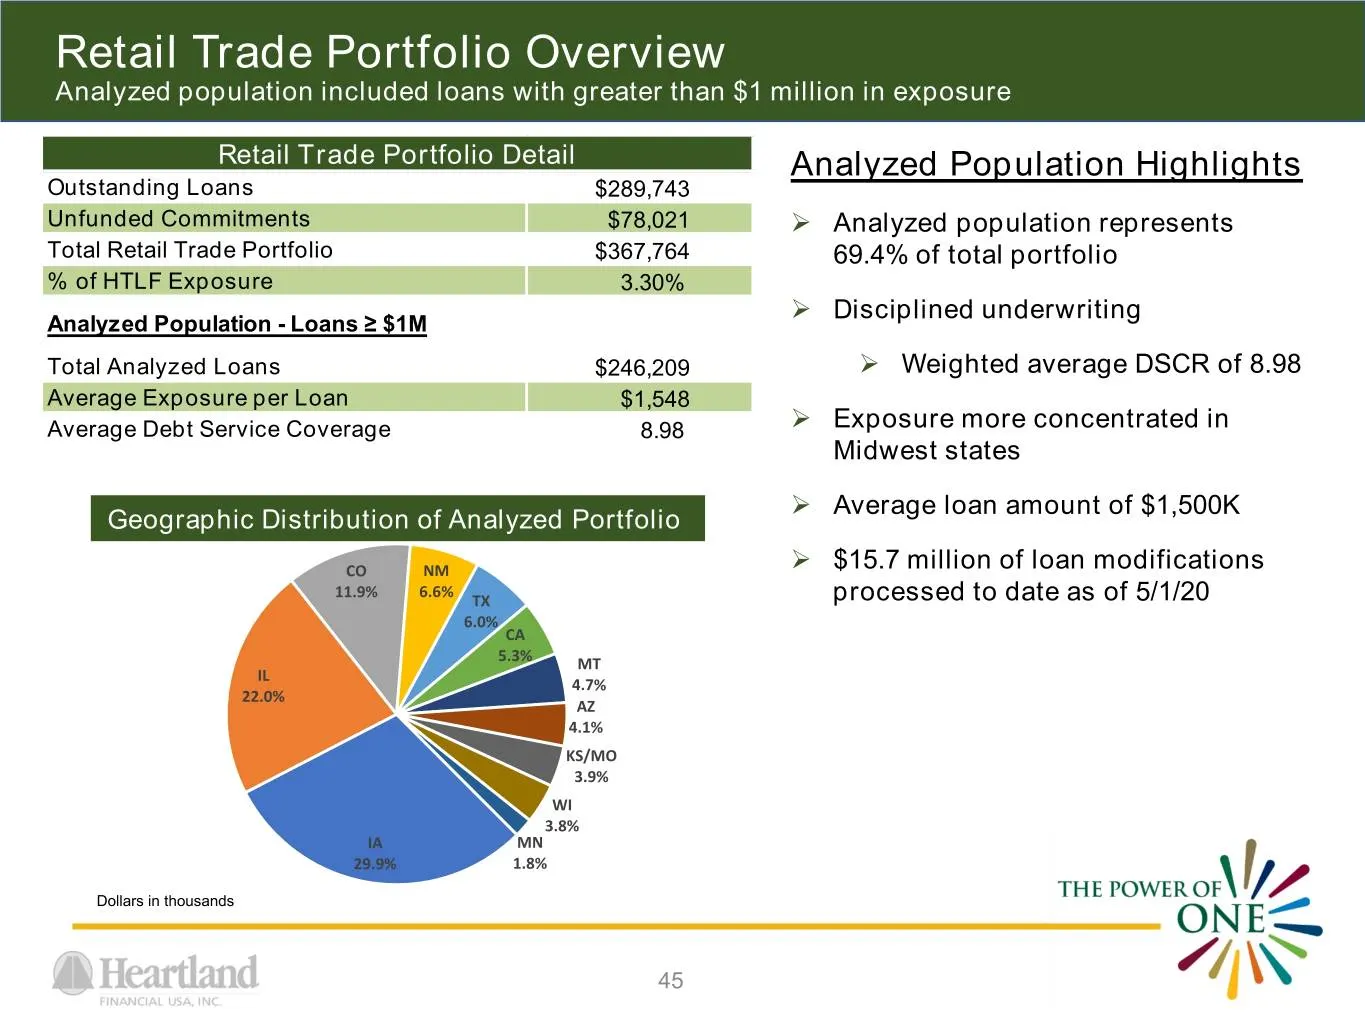
Retail Trade Portfolio Overview Analyzed population included loans with greater than $1 million in exposure Retail Trade Portfolio Detail Analyzed Population Highlights Outstanding Loans $289,743 Unfunded Commitments $78,021 Analyzed population represents Total Retail Trade Portfolio $367,764 69.4
Slide 46: Agriculture Portfolio Overview
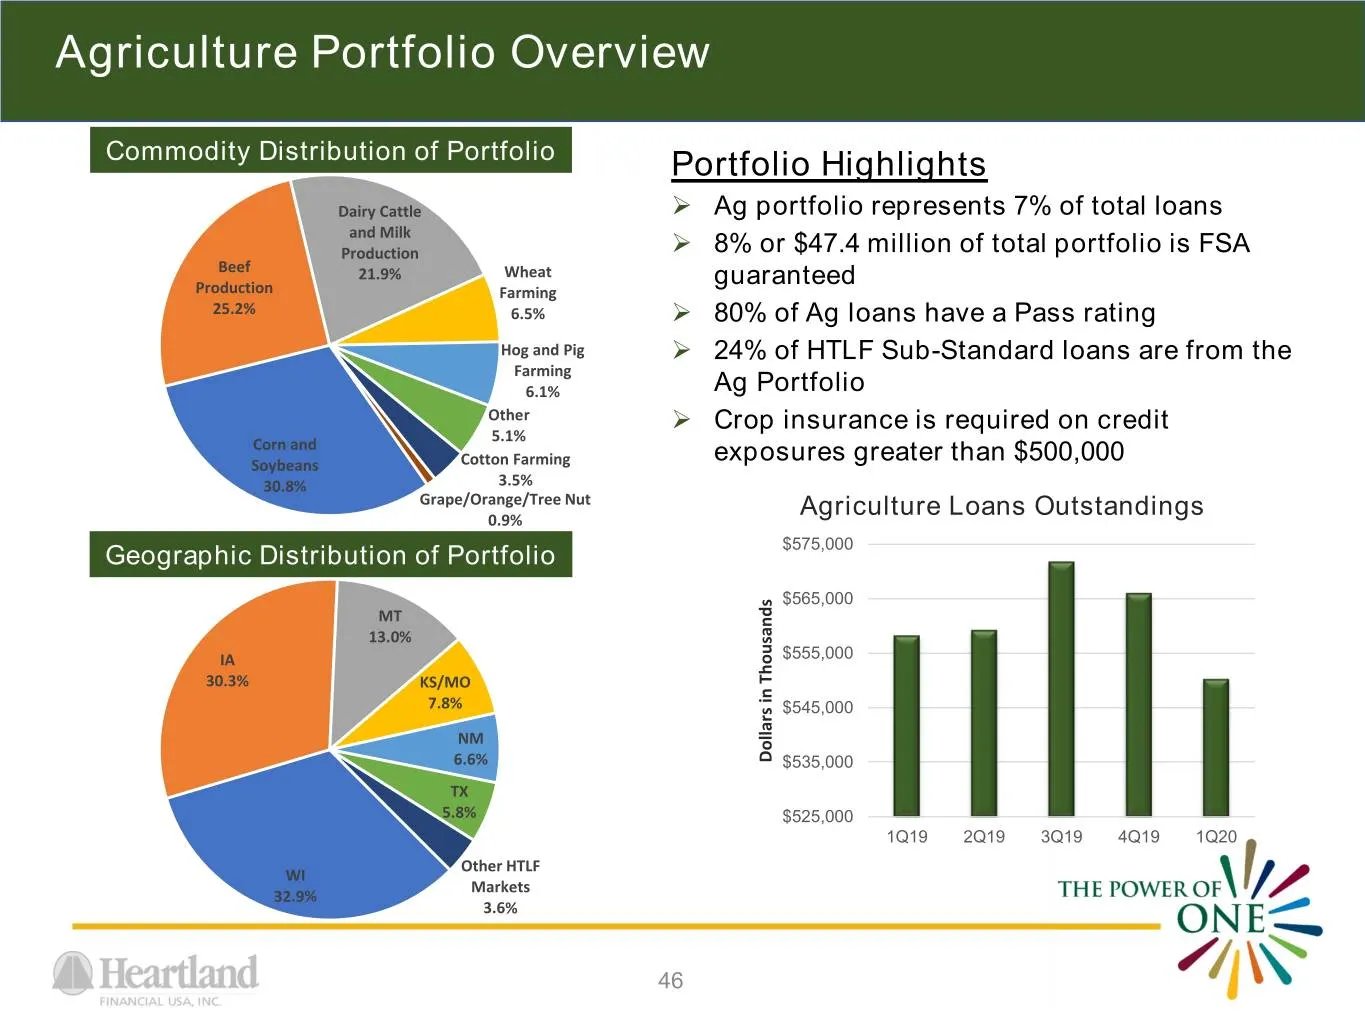
Agriculture Portfolio Overview Commodity Distribution of Portfolio Portfolio Highlights Dairy Cattle Ag portfolio represents 7% of total loans and Milk Production 8% or $47.4 million of total portfolio is FSA Beef 21.9% Wheat guaranteed Production Farming 25.2% 6.5% 80% of Ag loans have a Pass
Slide 47: Non-GAAP Financial Measures
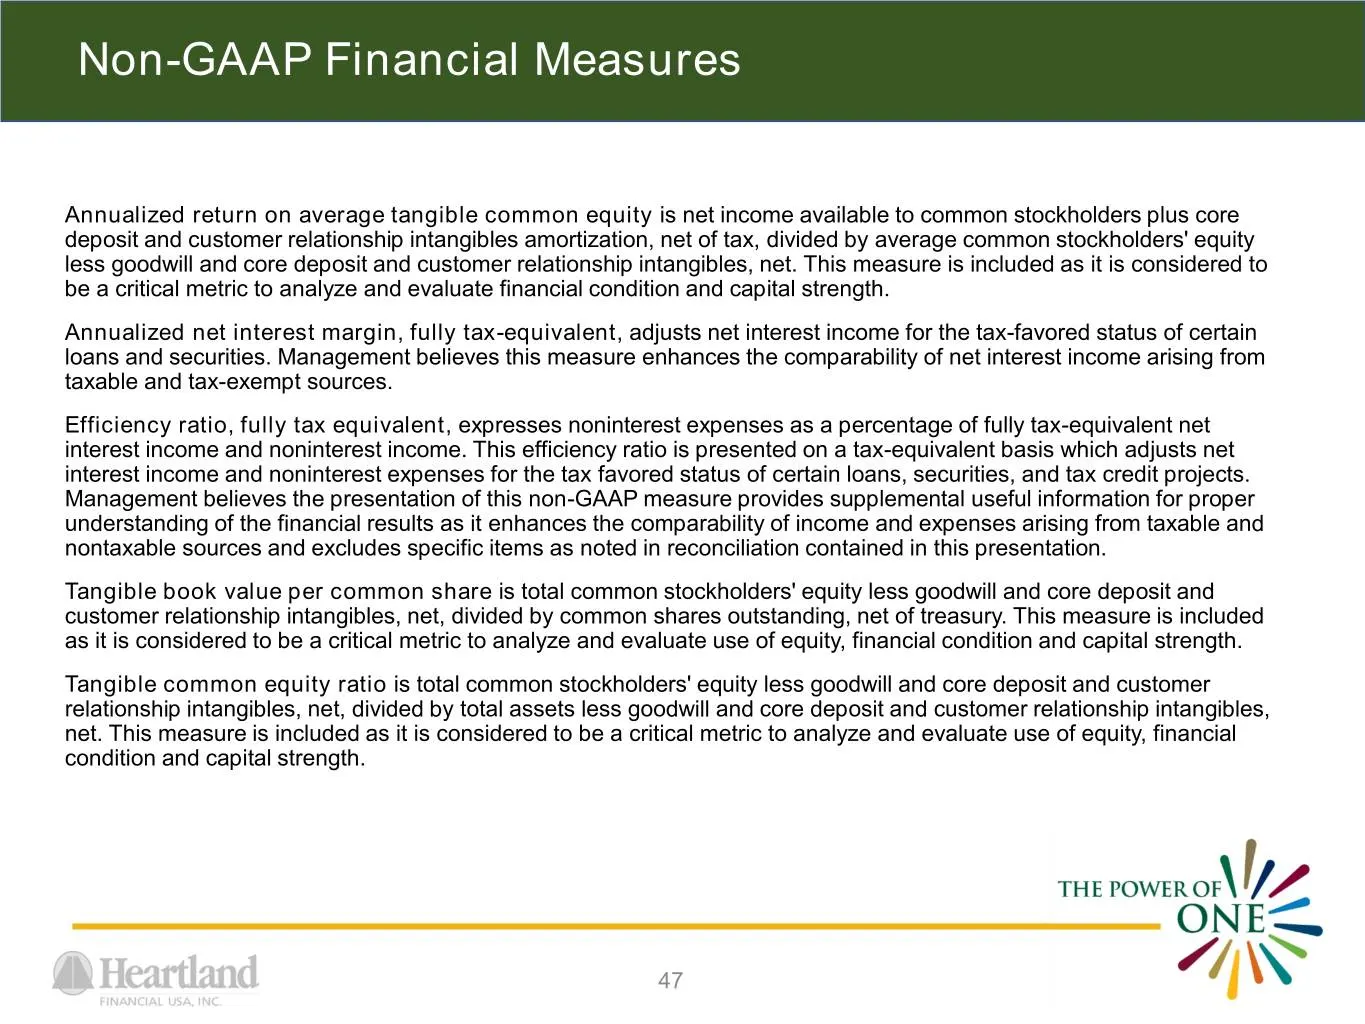
Non-GAAP Financial Measures Annualized return on average tangible common equity is net income available to common stockholders plus core deposit and customer relationship intangibles amortization, net of tax, divided by average common stockholders' equity less goodwill and core deposit and customer
Slide 48: Non-GAAP Reconcilements
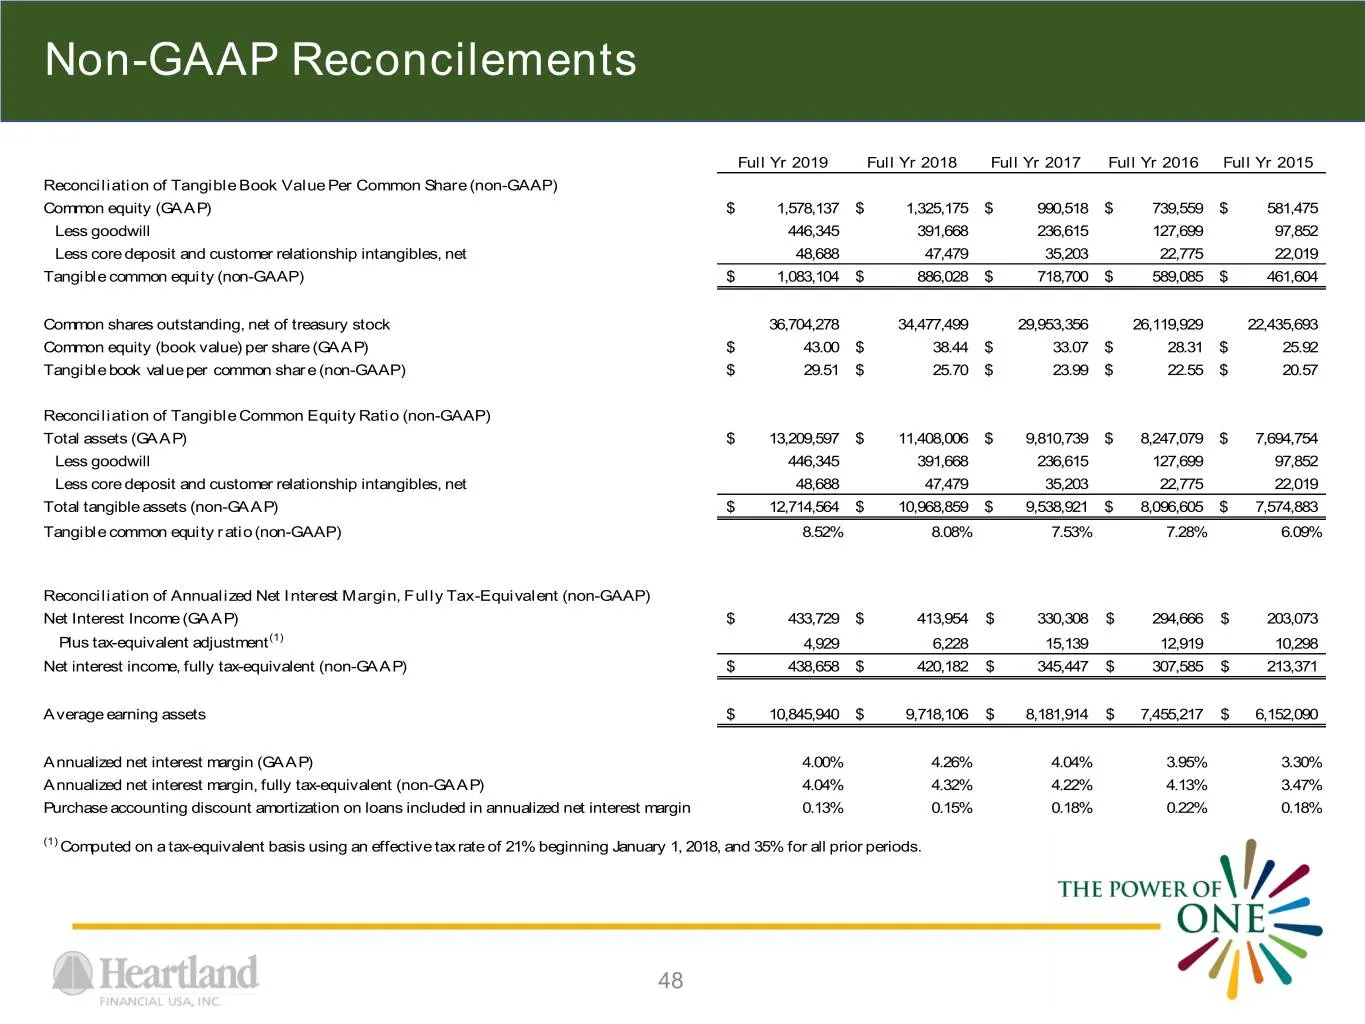
Non-GAAP Reconcilements Full Yr 2019 Full Yr 2018 Full Yr 2017 Full Yr 2016 Full Yr 2015 Reconciliation of Tangible Book Value Per Common Share (non-GAAP) Common equity (GAAP) $ 1,578,137 $ 1,325,175 $ 990,518 $ 739,559 $ 581,475 Less goodwill 446,345 391,668 236,615 127,699 97,852 Less core deposit
Slide 49: Non-GAAP Reconcilements
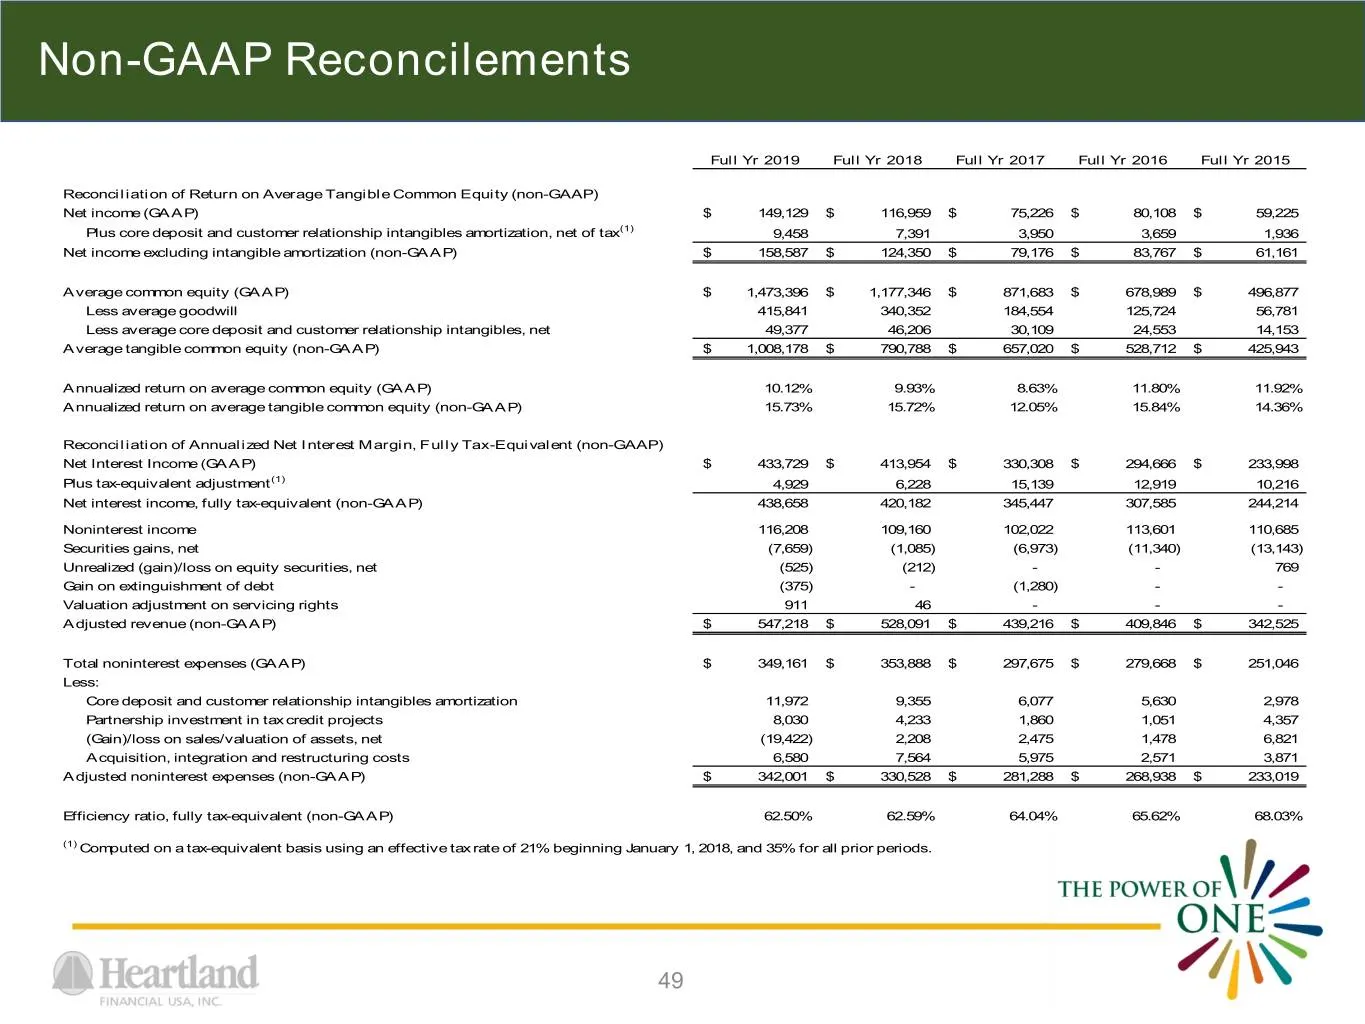
Non-GAAP Reconcilements Full Yr 2019 Full Yr 2018 Full Yr 2017 Full Yr 2016 Full Yr 2015 Reconciliation of Return on Average Tangible Common Equity (non-GAAP) Net income (GAAP) $ 149,129 $ 116,959 $ 75,226 $ 80,108 $ 59,225 Plus core deposit and customer relationship intangibles amortization, net of
Slide 50: Non-GAAP Reconcilements
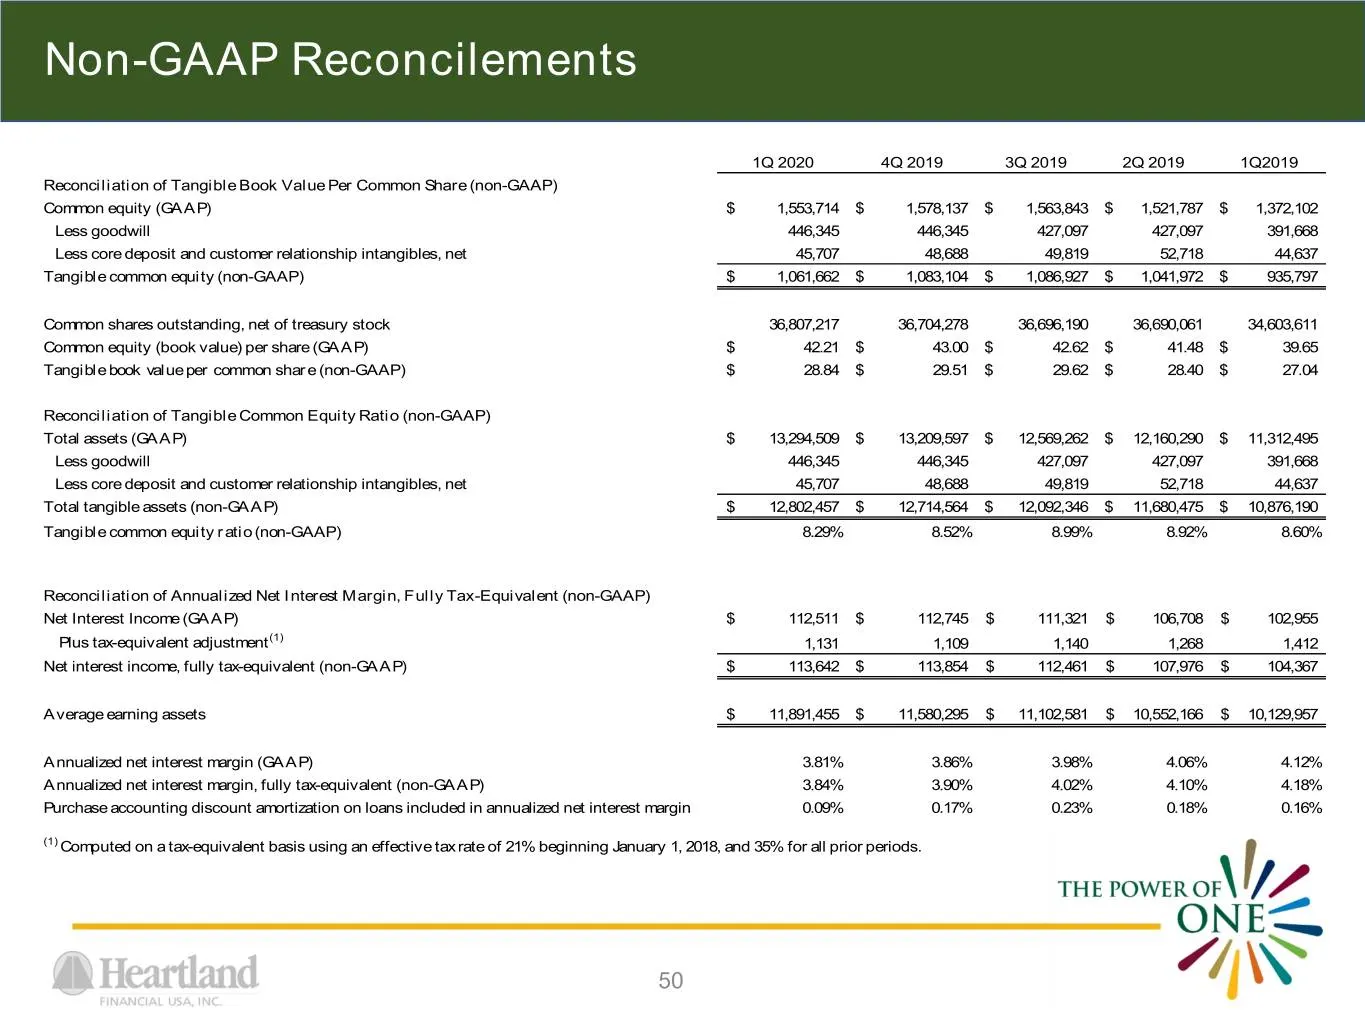
Non-GAAP Reconcilements 1Q 2020 4Q 2019 3Q 2019 2Q 2019 1Q2019 Reconciliation of Tangible Book Value Per Common Share (non-GAAP) Common equity (GAAP) $ 1,553,714 $ 1,578,137 $ 1,563,843 $ 1,521,787 $ 1,372,102 Less goodwill 446,345 446,345 427,097 427,097 391,668 Less core deposit and customer relat
Slide 51: Non-GAAP Reconcilements
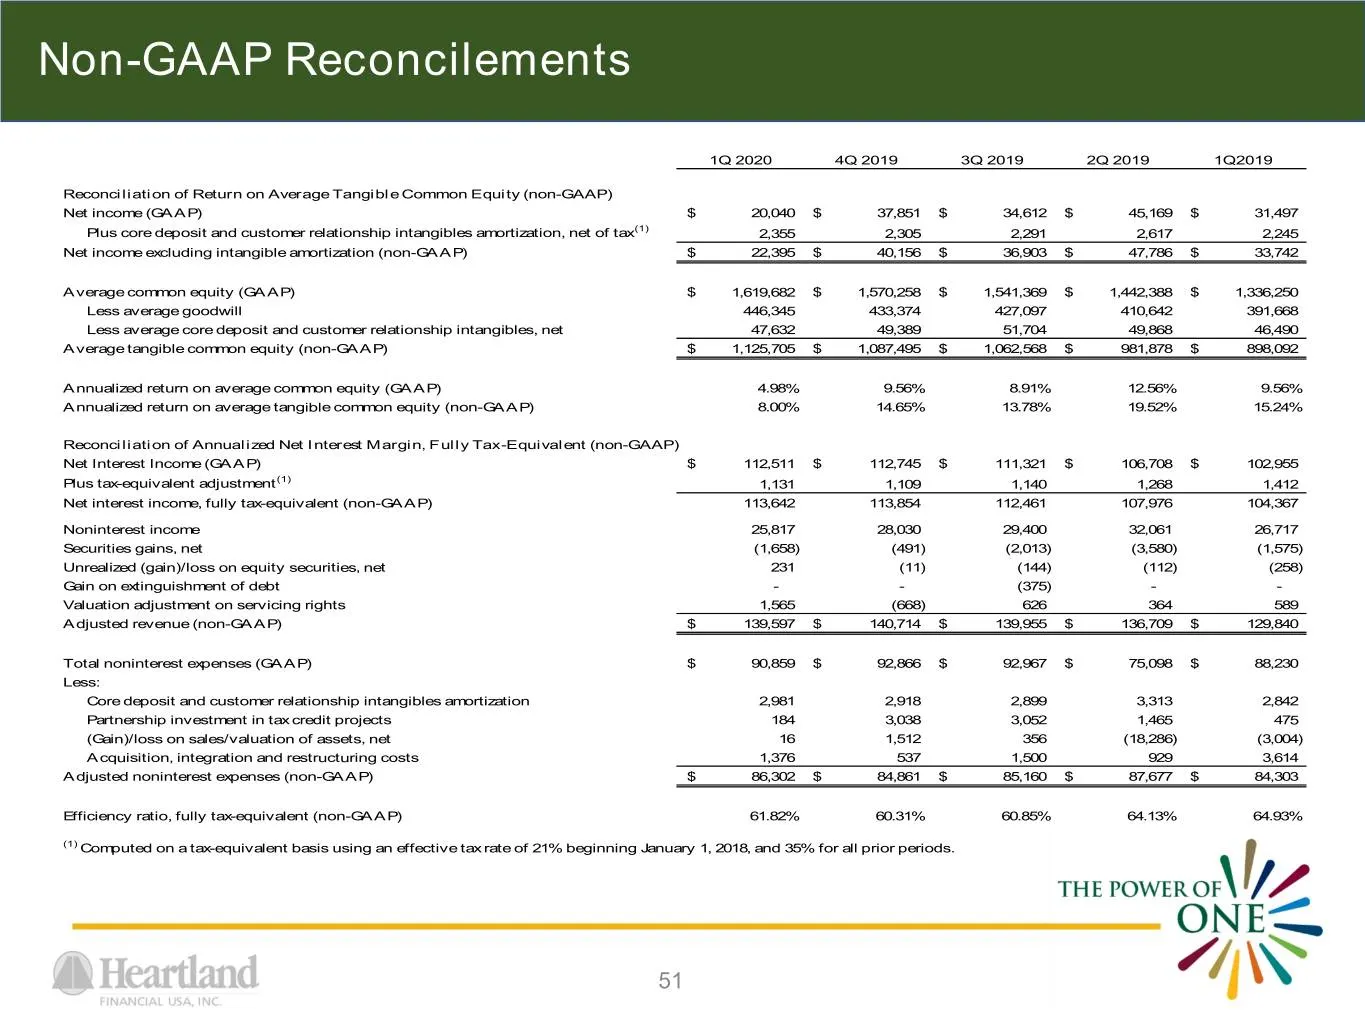
Non-GAAP Reconcilements 1Q 2020 4Q 2019 3Q 2019 2Q 2019 1Q2019 Reconciliation of Return on Average Tangible Common Equity (non-GAAP) Net income (GAAP) $ 20,040 $ 37,851 $ 34,612 $ 45,169 $ 31,497 Plus core deposit and customer relationship intangibles amortization, net of tax(1) 2,355 2,305 2,291 2,
Slide 52: Peer Groups
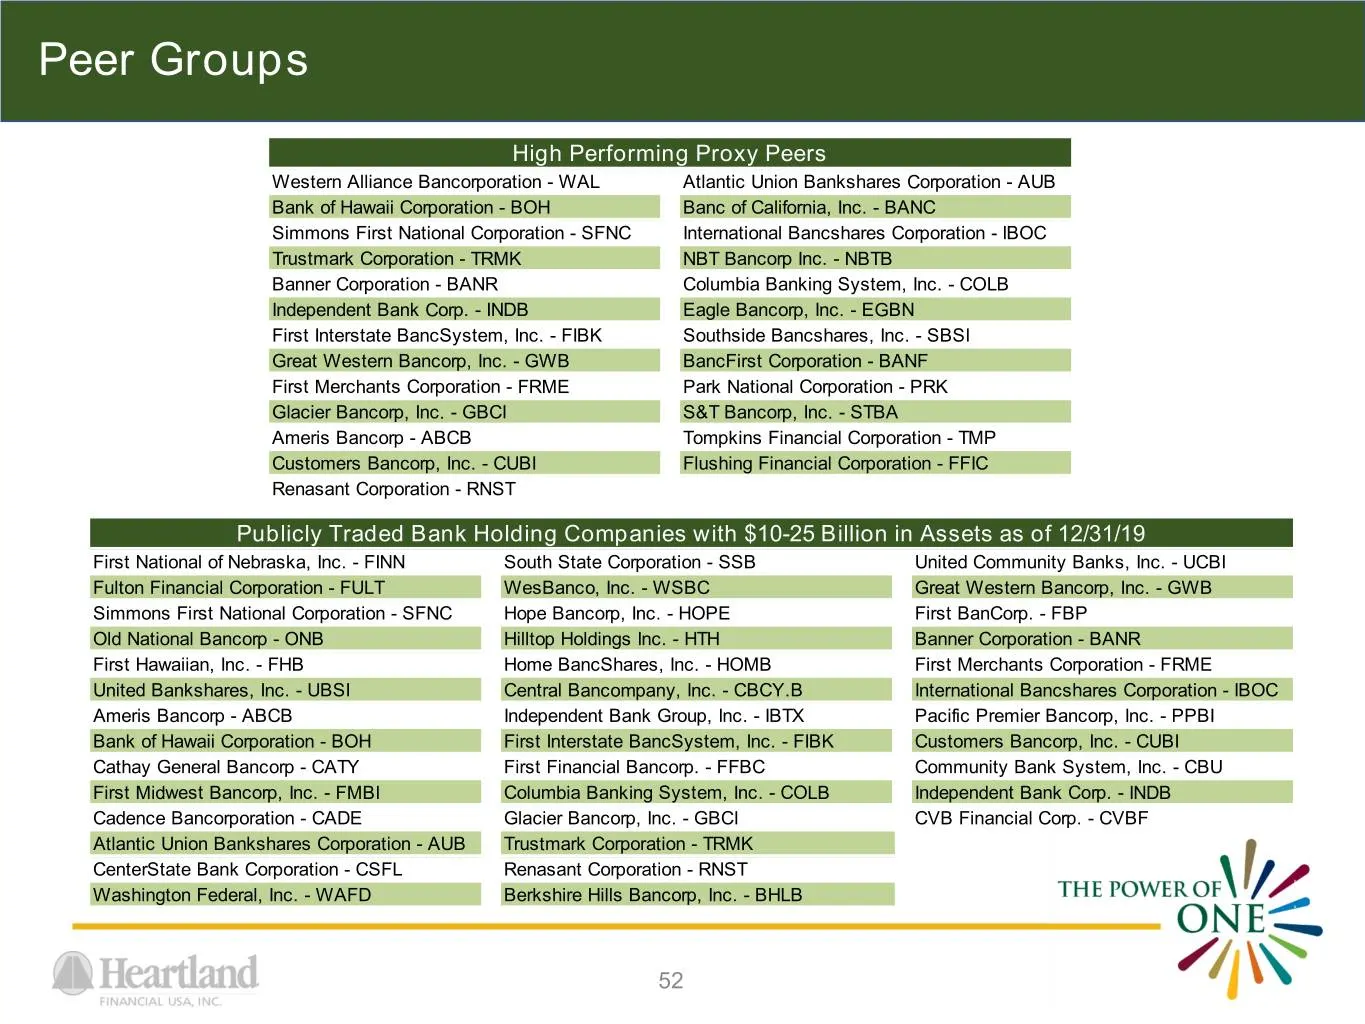
Peer Groups High Performing Proxy Peers Western Alliance Bancorporation - WAL Atlantic Union Bankshares Corporation - AUB Bank of Hawaii Corporation - BOH Banc of California, Inc. - BANC Simmons First National Corporation - SFNC International Bancshares Corporation - IBOC Trustmark Corporation - TRM
Source: SEC EDGAR · 8-K filed May 8, 2020
More decks from Heartland Financial USA Inc
 Merger or Acquisition (July 2024)6 slides · Jul 31, 2024
 Merger or Acquisition (May 2024)6 slides · May 2, 2024
 Merger or Acquisition (May 2024)27 slides · May 2, 2024
 Q4 2023 Earnings Presentation54 slides · Feb 13, 2024
 Q4 2023 Earnings Presentation35 slides · Jan 29, 2024
 Q3 2023 Earnings Presentation55 slides · Nov 15, 2023