Cal Dive International — Q2 2009 Earnings Presentation
11 slides from Cal Dive International's earnings presentation, Jul 30, 2009

Slide 1: Cal Dive International 2nd Quarter 2009 Earnings Conference Call
INTERNATIONAL Cal Dive International 2™4 Quarter 2009 Earnings Conference Call July 30,2009 _ -
Slide 2: Forward-Looking Statements
Forward-Looking Statements This presentation may include “forward-looking” statements that are generally identifiable through our use of words such as “believe,” “expect,” “anticipate,” “intend,” “plan,” “estimate,” “project” and similar expressions and include any statements that we make regarding
Slide 3: Presentation Outline
Presentation Outline @> Summary of 2"¢ Quarter 2009 Results @> Discussion of Financial Results @> Non-GAAP Reconciliations > Questions and Answers >» Cu Dive HTML
Slide 4: Summary of 2Q Results
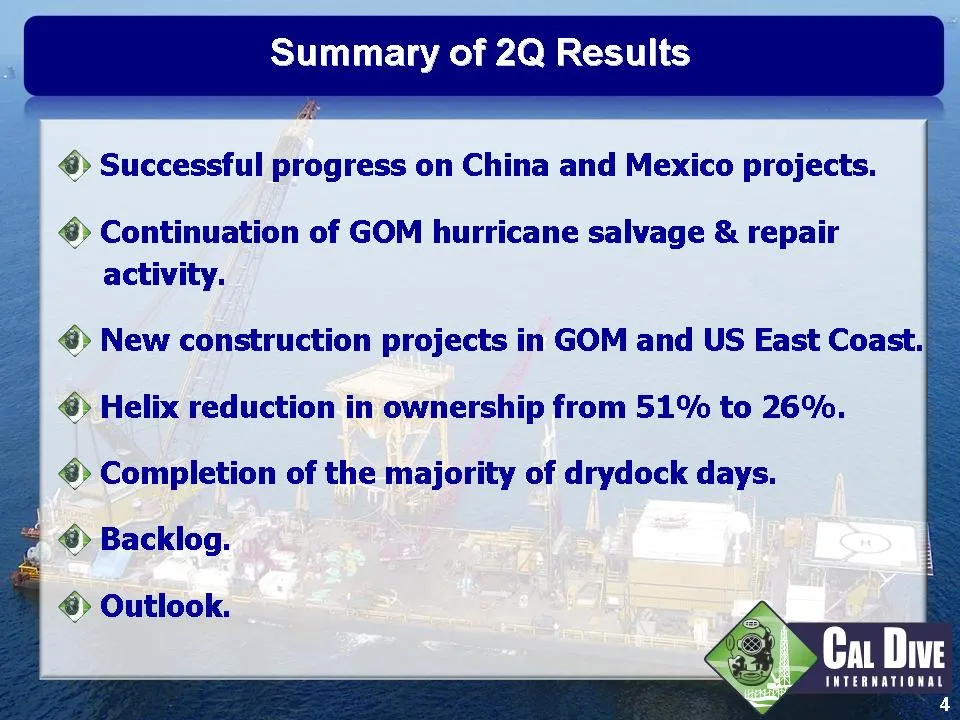
Surnimany of 2Q Results > Successful progress on China and Mexico projects. : . @> Continuation of GOM hurricane salvage & repair activity. > New construction projects in GOM and US East Coast.) Z > Helix reduction in ownership from 51% to 26%. > Completion of the majority of drydock days. » @> Back
Slide 5: Backlog
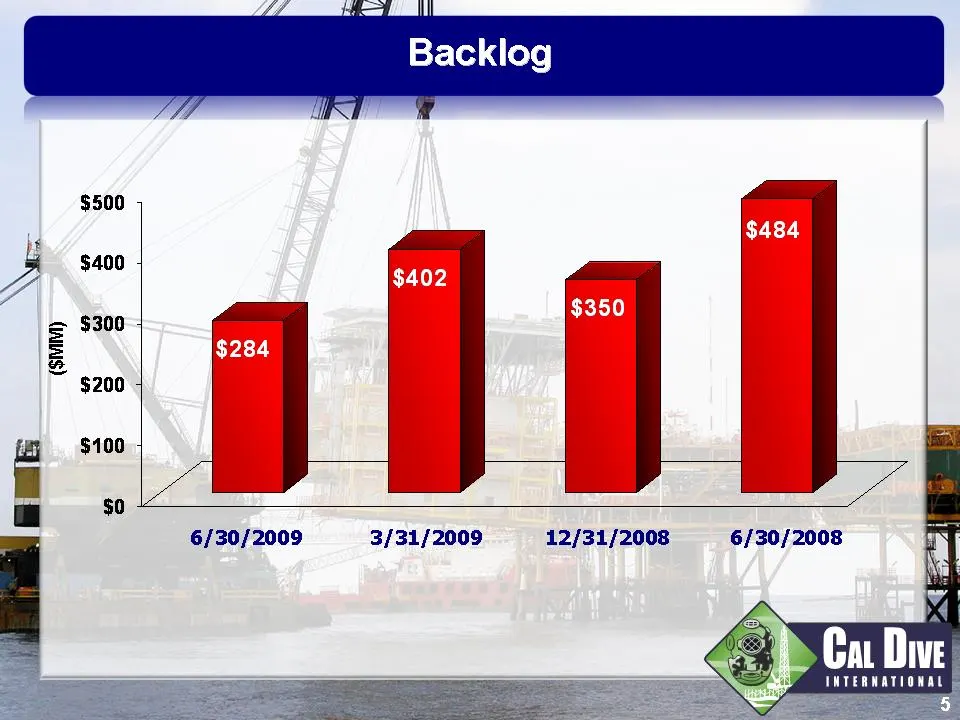
Backlog $500 £ $400 y = $300 5 & $200 = $100 | $0 6/30/2009 3/31/2009 12/31/2008 6/30/2008 Cu Dive INTERWATIO
Slide 6: Second quarter financial results
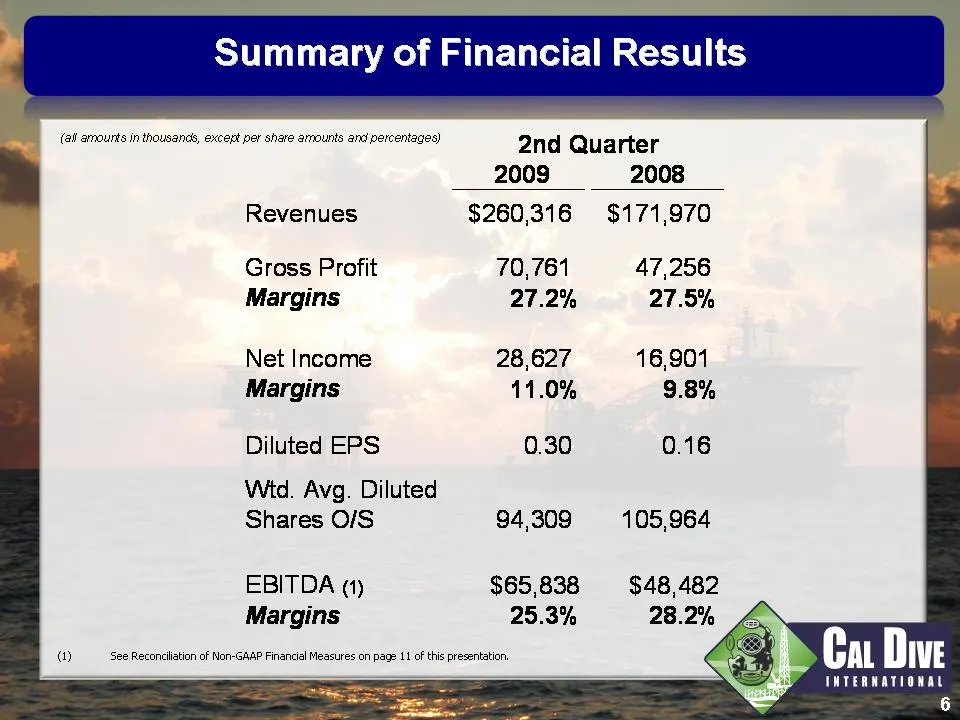
(ail arrourts in thousands, except per share amounts and percentages) Revenues Gross Profit Margins Net Income Margins Diluted EPS Wid. Avg. Diluted Shares O/S EBITDA a) Margins 2nd Quarter 2009 2008 $260,316 $171,970 70,761 47,256 27.2% 27.5% 28,627 16,901 11.0% 9.8% 0.30 0.16 94,309 105,964 $65,83
Slide 7: Key Statistics
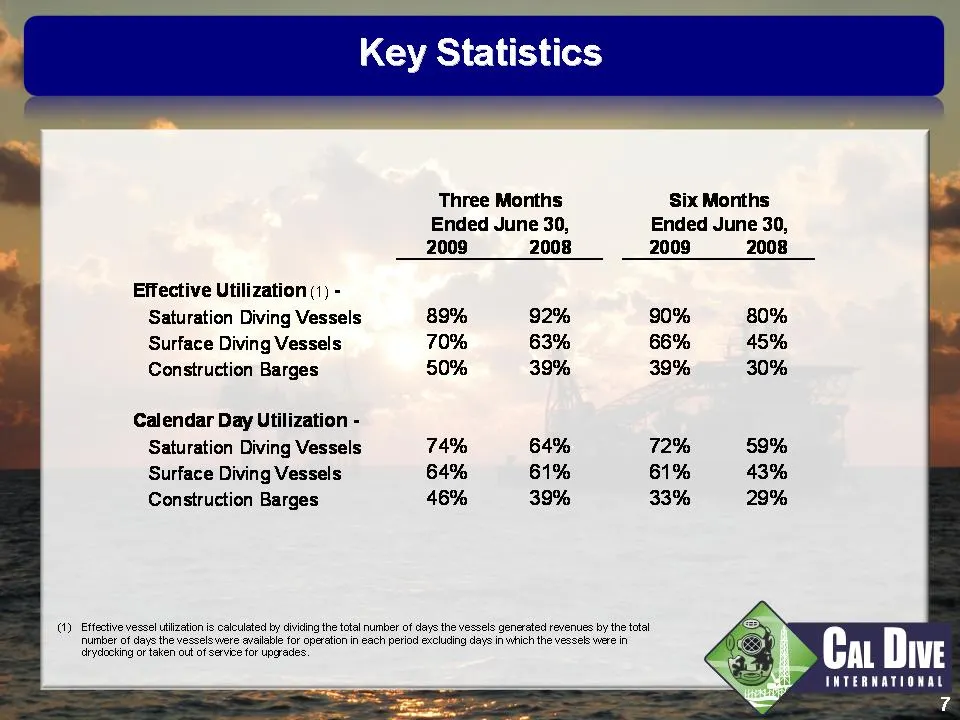
Key Statistics ‘e Three Months Six Months Ended June 30, Ended June 30, 2009 2008 2009 2008 _ Effective Utilization (1) - Saturation Diving Vessels 89% 92% 90% 80% Surface Diving Vessels 70% 63% 66% 45% Construction Barges 50% 39% 39% 30% Calendar Day Utilization - ~- Saturation Diving Vessels 74% 6
Slide 8: International Revenue
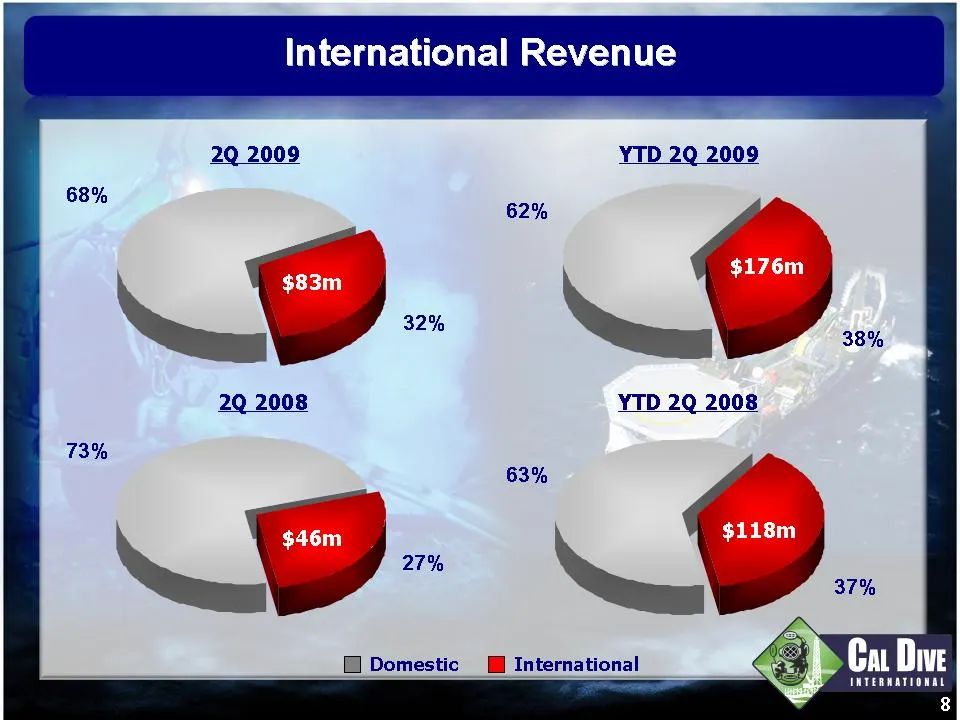
International Revenue YTD 2Q 2009 68% 9. 2Q 200: YTD 2Q 2008 73% 63% 9: 9. i Domestic Mf International Ca Dive INTERNATIONAL 8
Slide 9: Financial Flexibility
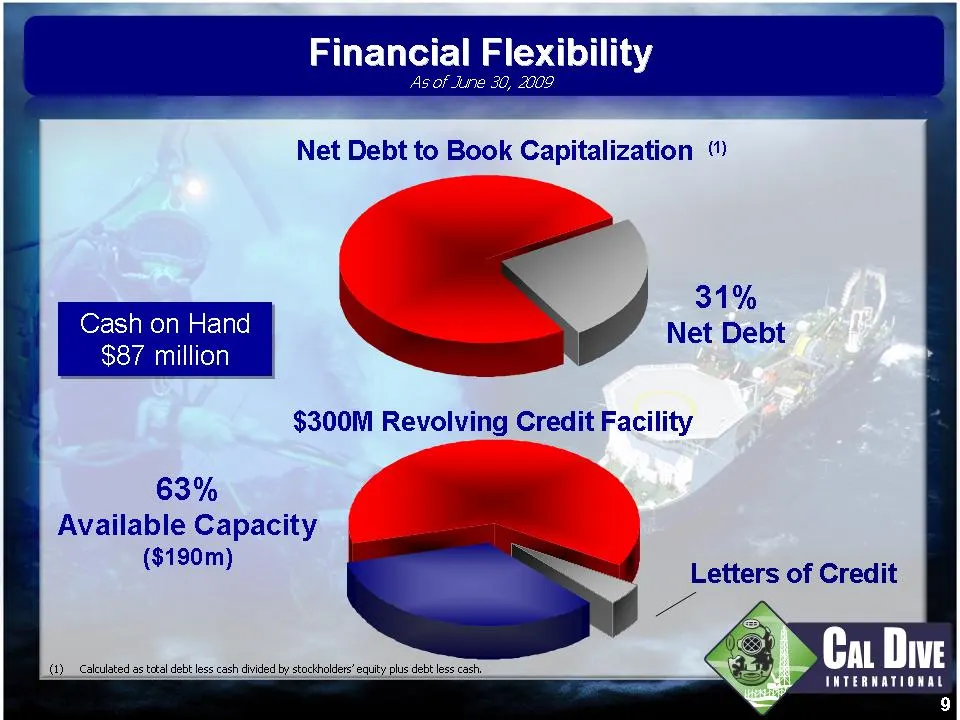
Financial Flexibility $300M Revolving Credit Facility 63% Available Capacity Se uy Letters of Credit Cat Dive ae
Slide 10: > Cu Dive
7 > Cu Dive TMTERMATIONAL 10
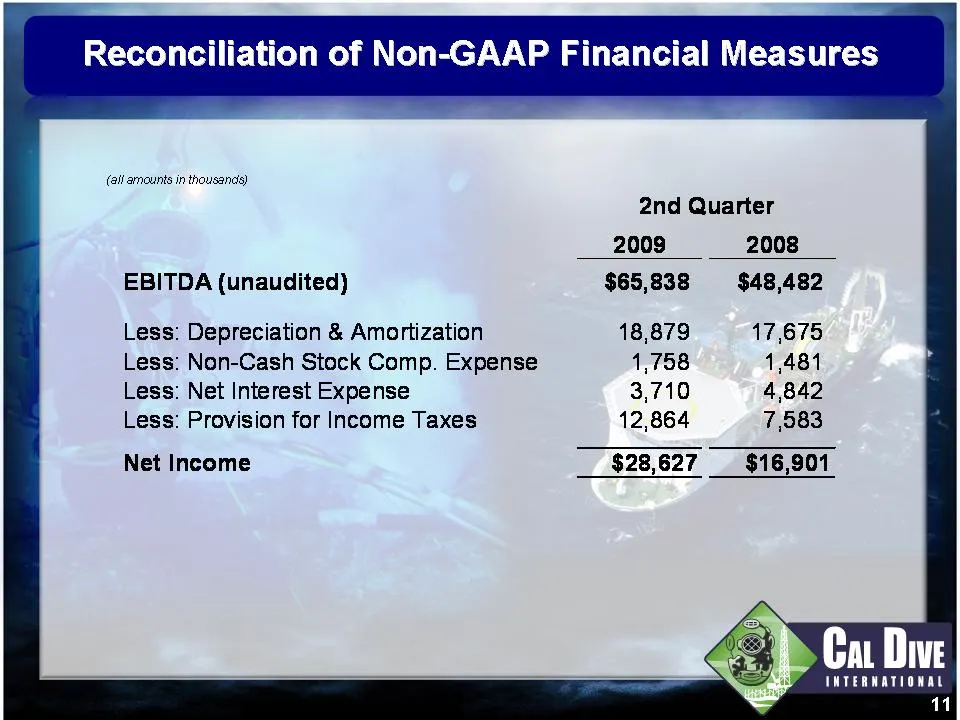
Slide 11: EBITDA reconciliation to net income
(all arnounts in thousands) 2nd Quarter 2009 2008 EBITDA (unaudited) $65,838 $48,482 Less: Depreciation & Amortization 18,879 17,675 Less: Non-Cash Stock Comp. Expense 1,758 1,481 Less: Net Interest Expense 3,710 4,842 Less: Provision for Income Taxes 12,864 7,583 Net Income $28,627 $16,901 Ca Dive
Source: SEC EDGAR · 8-K filed Jul 30, 2009
More decks from Cal Dive International Inc
 Q3 2014 Earnings Presentation12 slides · Nov 6, 2014
 Q2 2014 Earnings Presentation12 slides · Aug 11, 2014
 Q1 2014 Earnings Presentation12 slides · May 9, 2014
 Q4 2013 Earnings Presentation11 slides · Mar 5, 2014
 Q3 2013 Earnings Presentation11 slides · Nov 7, 2013
 Q2 2013 Earnings Presentation11 slides · Aug 8, 2013