Community Banks — Merger or Acquisition (November 2004)
14 slides from Community Banks's merger presentation, Nov 16, 2004
Slide 1: Community Banks and PennRock: A Strategic Affiliation
Banks AND WB eenyrack A STRATEGIC AFFILIATION
Slide 2: Why CommunityBanks
Why CommunityBanks Excellent Strategic Fit Complimentary Business Combination Attractive Financial Implications Low Execution Risk
Slide 3: Overview of Community Banks, Inc.
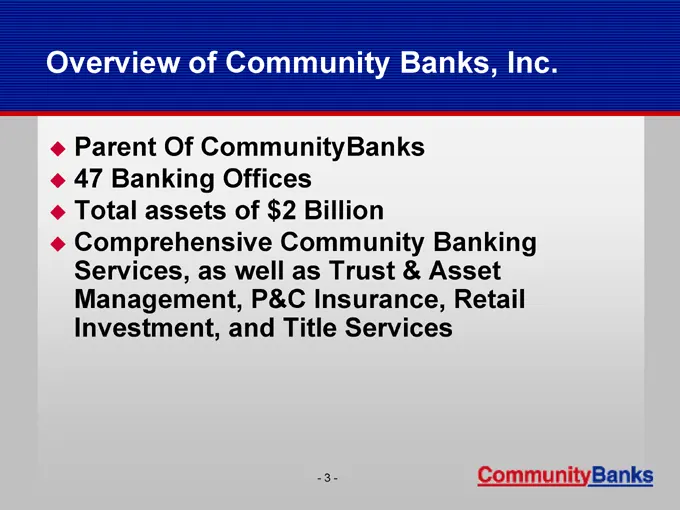
Overview of Community Banks, Inc. Parent Of CommunityBanks 47 Banking Offices Total assets of $2 Billion Comprehensive Community Banking Services, as well as Trust & Asset Management, P&C Insurance, Retail Investment, and Title Services
Slide 4: The CommunityBanks Network
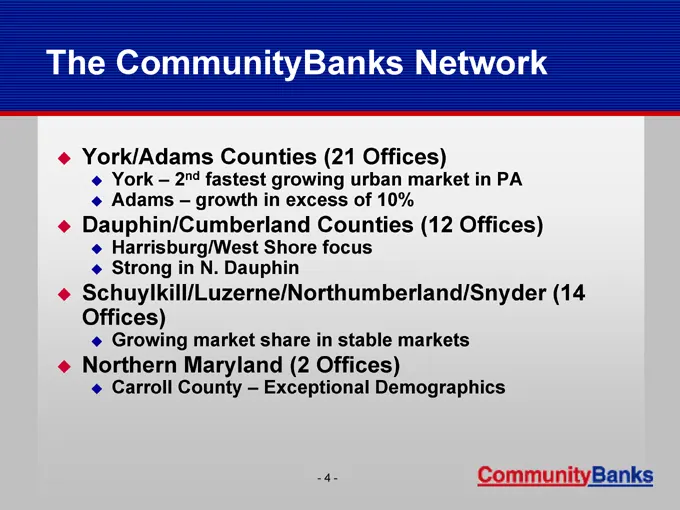
The CommunityBanks Network York/Adams Counties (21 Offices) York – 2nd fastest growing urban market in PA Adams – growth in excess of 10% Dauphin/Cumberland Counties (12 Offices) Harrisburg/West Shore focus Strong in N. Dauphin Schuylkill/Luzerne/Northumberland/Snyder (14 Offices) Growing market sha
Slide 5: Our Vision For CommunityBanks
Our Vision For CommunityBanks Build shareholder value by growing our community banking franchise’s market share in existing markets and expanding (de novo or via affiliation) in new growth markets Management team is young, energetic and motivated to perform for the long term
Slide 6: The Combined Franchise
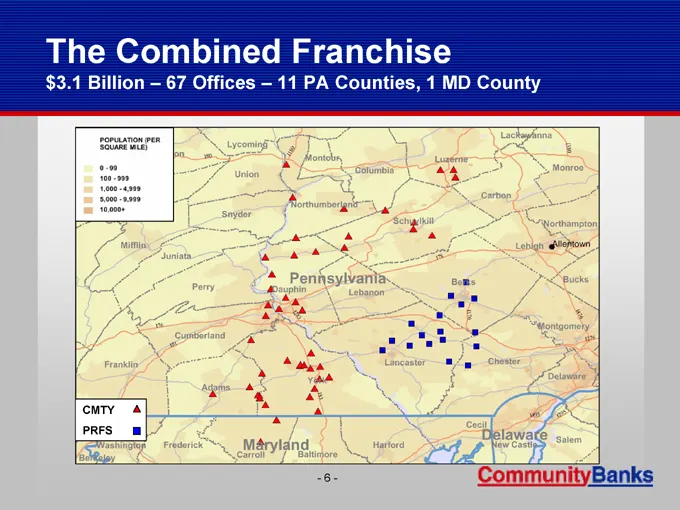
The Combined Franchise $3.1 Billion – 67 Offices – 11 PA Counties, 1 MD County CMTY PRFS
Slide 7: The Combined Company
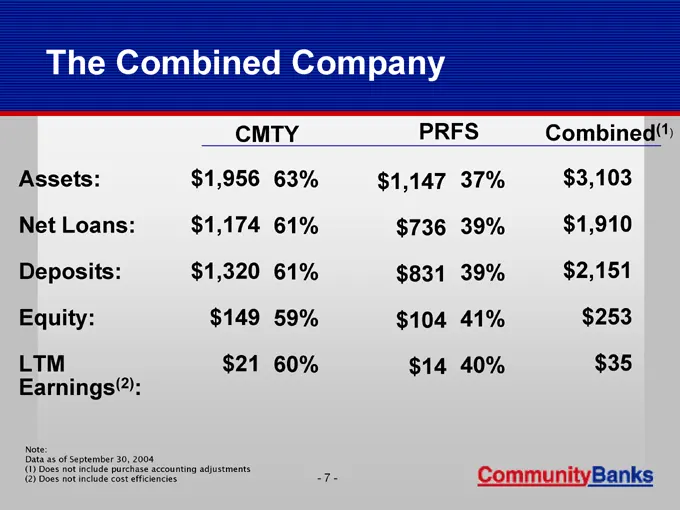
The Combined Company CMTY PRFS Combined(1) Assets: $1,956 63% $1,147 37% $3,103 Net Loans: $1,174 61% $736 39% $1,910 Deposits: $1,320 61% $831 39% $2,151 Equity: $149 59% $104 41% $253 LTM Earnings(2): $21 60% $14 40% $35 Note: Data as of September 30, 2004 (1) Does not include purchase accounting
Slide 8: Where This Puts The Combined Company
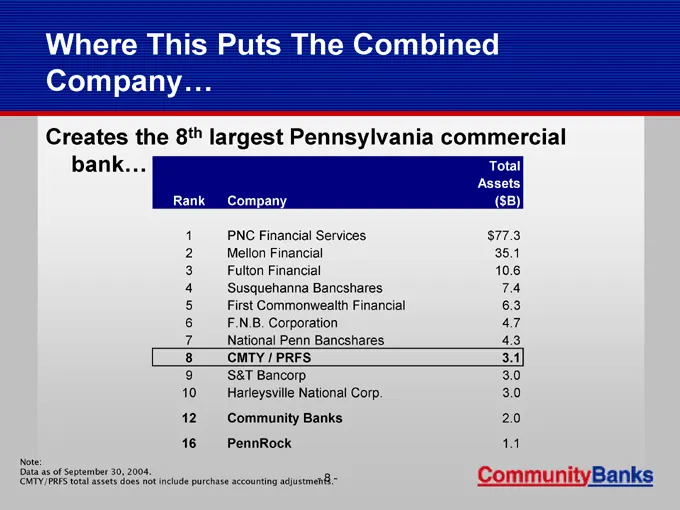
Where This Puts The Combined Company… Creates the 8th largest Pennsylvania commercial bank… Total Assets ($B) Rank Company 1 PNC Financial Services $77.3 2 Mellon Financial 35.1 3 Fulton Financial 10.6 4 Susquehanna Bancshares 7.4 5 First Commonwealth Financial 6.3 6 F.N.B. Corporation 4.7 7 Nationa
Slide 9: Strengthened Demographic Profile
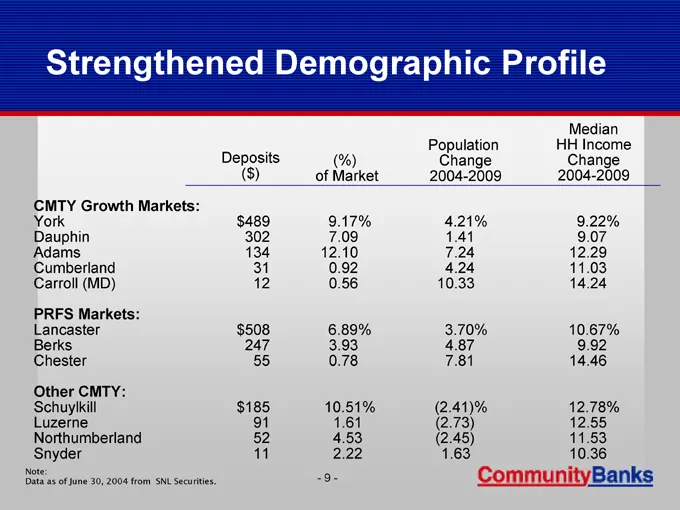
Strengthened Demographic Profile Deposits ( $) (%) of Market Population Change 2004-2009 Median HH Income Change 2004-2009 CMTY Growth Markets: York $ 489 9.17% 4.21% 9.22% Dauphin 302 7.09 1.41 9.07 Adams 134 12.10 7.24 12.29 Cumberland 31 0.92 4.24 11.03 Carroll (MD) 12 0.56 10.33 14.24 PRFS Marke
Slide 10: High Quality Growth Track Record
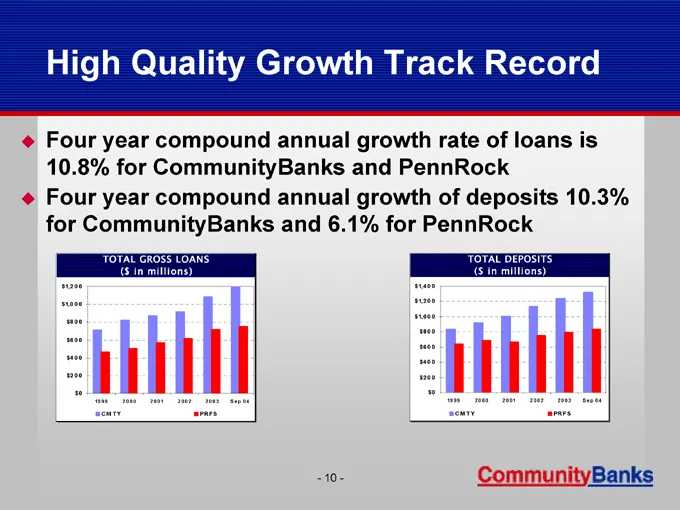
High Quality Growth Track Record Four year compound annual growth rate of loans is 10.8% for CommunityBanks and PennRock Four year compound annual growth of deposits 10.3% for CommunityBanks and 6.1% for PennRock TOTAL GROSS LOANS ($ in millions) TOTAL DEPOSITS ($ in millions) $1,2 0 0 $1,0 0 0 $8 0
Slide 11: Opportunities
Opportunities Combination of growth markets Higher legal lending limit Leveraging of integrated businesses, e.g. retail investment sales, P&C insurance and title services Alignment of investment portfolio strategies
Slide 12: Transaction Summary
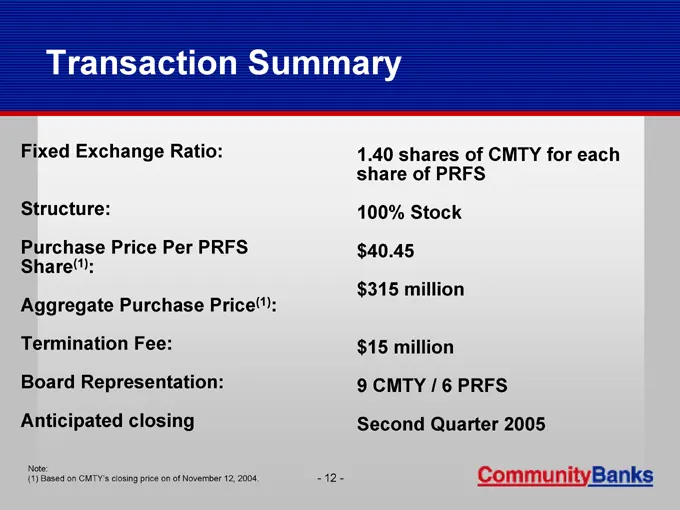
Transaction Summary Fixed Exchange Ratio: 1.40 shares of CMTY for each share of PRFS Structure: 100% Stock Purchase Price Per PRFS Share(1): $ 40.45 Aggregate Purchase Price(1): $ 315 million Termination Fee: $15 million Board Representation: 9 CMTY / 6 PRFS Anticipated closing Second Quarter 2005 N
Slide 13: The Integration Process
The Integration Process Form Integration Team Complete CommunityBanks’ Silverlake Conversion and Consolidate Operating Systems Integrate Loan and Deposit Operations Deposit and IT Operations Primarily Based at Blue Ball Operations Center
Slide 14: The Integration Process
The Integration Process Consolidate Administrative Departments Cultural Integration Product Alignment Policies and Procedures Benefit Plans Identify Revenue Opportunities and Initiate Programs
Source: SEC EDGAR · 8-K filed Nov 16, 2004
More decks from Community Banks Inc
 Community Banks — Merger or Acquisition (June 2007)23 slides · Jun 20, 2007
 Community Banks — Merger or Acquisition (May 2007)31 slides · May 1, 2007
 Ferris, Baker Watts Mid-Atlantic Bank Conference 200620 slides · Jul 27, 2006
 Shareholder Meeting (May 2006)45 slides · May 9, 2006
 Emerald Groundhog Day Investment Forum (February 2006)40 slides · Feb 2, 2006
 Mid-Atlantic SuperCommunity Bank Conference 200528 slides · Nov 8, 2005