Community Banks — Mid-Atlantic SuperCommunity Bank Conference 2005
28 slides from Community Banks's conference presentation, Nov 8, 2005
Slide 1: Mid-Atlantic SuperCommunity Bank Conference
Mid-Atlantic SuperCommunity Bank Conference November 8, (Combining Franchise Expansion with Performance Enhancement)

Slide 2: Disclaimer
Disclaimer This presentation contains “forward looking” information, as defined by the Private Securities Litigation Reform Act of 1995, that is based on Community’s current expectations, estimates and projections about future events and financial trends affecting the financial condition of its busi
Slide 3: Representatives
Mid-Atlantic Super Community Bank Conference Representatives u Eddie L. Dunklebarger Chairman, President and CEO u Donald F. Holt EVP and CFO

Slide 4: The "New" Community Story
The “New” Community Story The Blue Ball Merger—A Look Back and a Look Forward Current Performance Trends Shareholder Issues

Slide 5: Overview of PennRock
Overview of PennRock Headquartered in Blue Ball, PA u Bank Founded in 1906 u Blue Ball Bank Run as a Division of CommunityBanks, Capitalizing on Strong Local Brand Branches u Lancaster, Berks and Chester Counties u Average Size: $49M in Deposits Total Assets of $1.2 Billion u Loans: $745 Million u D

Slide 6: Blue Ball: Transaction Chronology
Blue Ball: Transaction Chronology 11/16/04: Merger Announcement 03/31/05: Employee Notification Completed 05/31/05: Convert Legacy CMTY to Silverlake 07/01/05: Legal Merger 08/31/05: Combine Silverlake Operating Platform 09/30/05: Final Staffing Changes 10/18/05: Announce Combined Results for Q3-200

Slide 7: Announcement Date: Transaction Dynamics
Announcement Date: Transaction Dynamics Strategic Fit u Attractive Partner/Proven Performer u Desirable Market Demographics Complementary Combination u Cultural Fit u Comparable Risk Profile Financial Implications u Accretive by 1/1/2006 u Cost Save Opportunities u Asset/Liability Flexibility Low Ex

Slide 8: Blue Ball: Accomplishments
Blue Ball: Accomplishments Largest Transaction in CMTY History Full Integration (People/Systems) in Less Than 1 Year From Announcement Accretive Results by End of 2005 Increase Franchise Size by Over 50% Franchise Now “Weighted” in Growing South-Central Pennsylvania Market Platform Will Accommodate
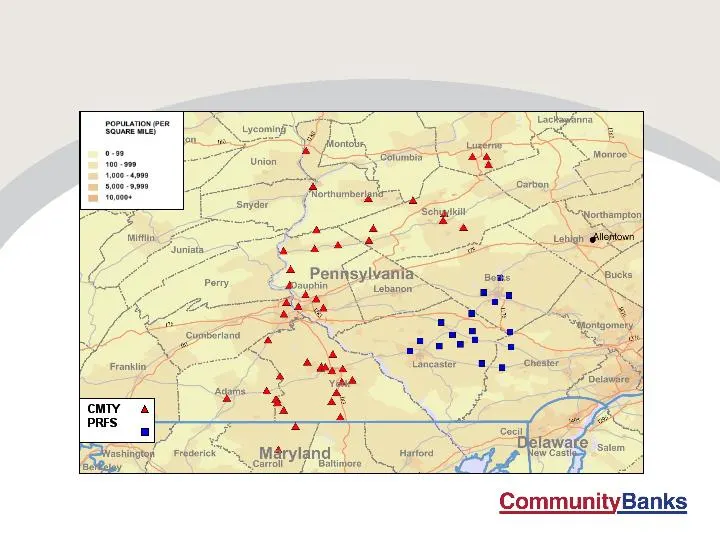
Slide 9: Franchise map
rome (SOX Geomig Gl T nc SH Fillies CMIY & é PRIS x asingey Maryland feta & carnal P Batijore CommunityBanks

Slide 10: Strengthened Demographic Profile
Note: Data as of June 30, 2004 from SNL Securities. Median Population HH Income Deposits (%) Change Change ($) of Market 2004-2009 2004-2009 CMTY Growth Markets: York $489 9.17% 4.21% 9.22% Dauphin 7.09 1.41 9.07 Adams 12.10 7.24 12.29 Cumberland 0.92 4.24 11.03 Carroll (MD) 0.56 10.33 14.24 PRFS Ma

Slide 11: Office Network
of Offices Deposits Rank Lancaster* $560 York/Hanover* $528 Harrisburg/Carlisle* $349 $1,437 Reading $261 Pottsville $190 Other $357 TOTAL $2,245 * 2/3 of franchise in Lancaster, York, Harrisburg MSA Office Network

Slide 12: The "New" Community Story
The “New” Community Story The Blue Ball Merger—A Look Back and a Look Forward Current Performance Trends Shareholder Issues

Slide 13: Statement of Condition
Period End Q3 Q3 % Change Balance Sheet (billions) Assets $3.3 $2.0 68% Loans 2.2 1.2 82% Deposits 2.2 1.3 70% Capital (000’s) Book $481 $149 223% Intangible (258) (5) N/A Tangible $223 $144 55% Tangible Capital to Tangible Assets 7.41% 7.40% Statement of Condition
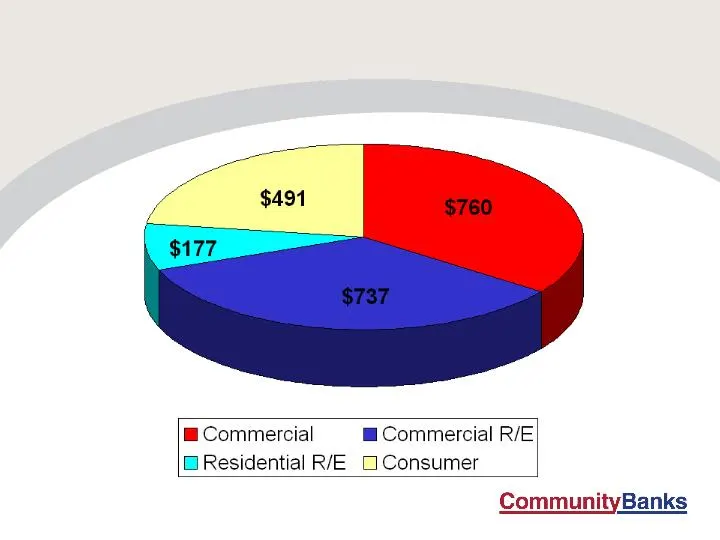
Slide 14: Total Loans at 9/30/2005
(in millions) Total $2.2 Billion Loans at 9/30/2005

Slide 15: Performance Goals: Guideposts
Performance Goals : Guideposts Under Purchase Accounting Minimum Return on Tangible Equity of 15% Annual EPS Growth of 10% Annual Asset Growth of 10% Non-interest Income to 30% Efficiency Ratio Migrate to 55%

Slide 16: 2005: Setting the Stage
Q2 2005: Setting the Stage Conversion ($0.8 million) u Common Platform (Blue Ball’s Current Platform) u Minimized Execution Risk Merger Expenses ($1.3 million) u Minor Spillover in Third Quarter u CMTY Expenses—Operating Costs u PRFS Expenses—Component of Purchase Price

Slide 17: 2005: Setting the Stage (cont'd.)
Q2 2005: Setting the Stage (cont’d.) Restructuring ($6.1 million) u Coordinated Transition for Two Balance Sheets u Focus On : » Reduced Wholesale Funding Costs » Addressed Balance Sheet Sensitivity and Borrowed Funds at Blue Ball » Created Funding Capacity for Core Growth » Liquidation of PennRock

Slide 18: Performance Metrics
Q3 Q3 Change Traditional ROA 1.24% 1.15% + 9 bp ROE 8.52% 15.84% (732) bp Net Interest Margin 3.89% 3.43% + 46 bp Efficiency Ratio 57.86% 59.48% + 162 bp EPS $0.44 $0.45 (2)% Net Income $10.3 $5.7 83% Influenced by Purchase Accounting ROTA 1.43% 1.16% + 27 bp ROTE 19.21% 16.49% + 272 bp Tangible Ope

Slide 19: Q3: A Solid Foundation of Performance
Q3 Asset Yield 6.25% 5.79% Cost of Funds 2.76% 2.68% Net Interest Spread 3.49% 3.11% Net Interest Margin 3.89% 3.43% Change in NIM + 46 bp Q3: A Solid Foundation of Performance Net Interest Income

Slide 20: Credit Quality
Credit Quality: Compatible Metrics / Common Culture (in thousands) Activity for the year: Q3 YTD Net charge-offs ($78) ($416) Provision for loan losses $400 $1,700 Coverage: Allowance to loans 1.05% Allowance to non-accrual 212%
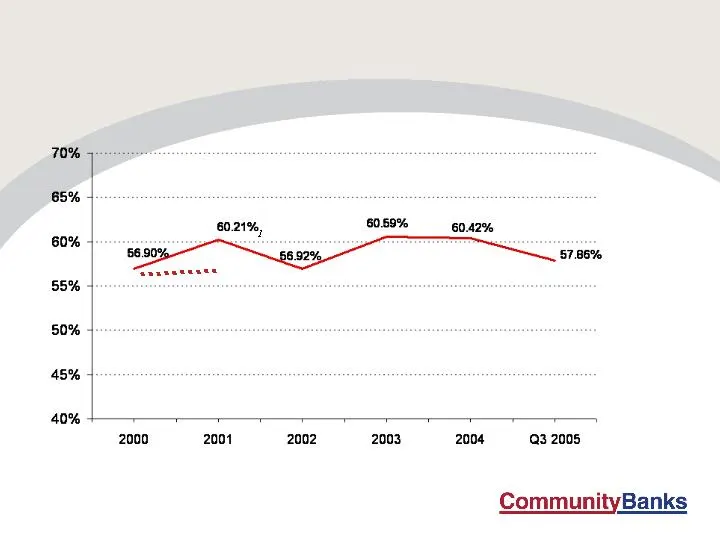
Slide 21: Improved Efficiency from Merger
1 Includes merger costs. 2 Without merger costs. 56.96% Q3 2005: Improved Efficiency from Merger

Slide 22: Overview of Expense Savings
Overview of Expense Savings Operating Run Rate at 12/31/04 “Old” CMTY/Blue Ball Pro Forma Combined $80,000 7% Increase 5,600 Baseline $85,600 Third Quarter, Exclusive of Intangibles $20,205 x = Third Quarter Run Rate $80,820 Fourth Quarter, Estimate (Excluding Tangibles) $19,700 x = Fourth Quarter R

Slide 23: The "New" Community Story
The “New” Community Story The Blue Ball Merger—A Look Back and a Look Forward Current Performance Trends Shareholder Issues
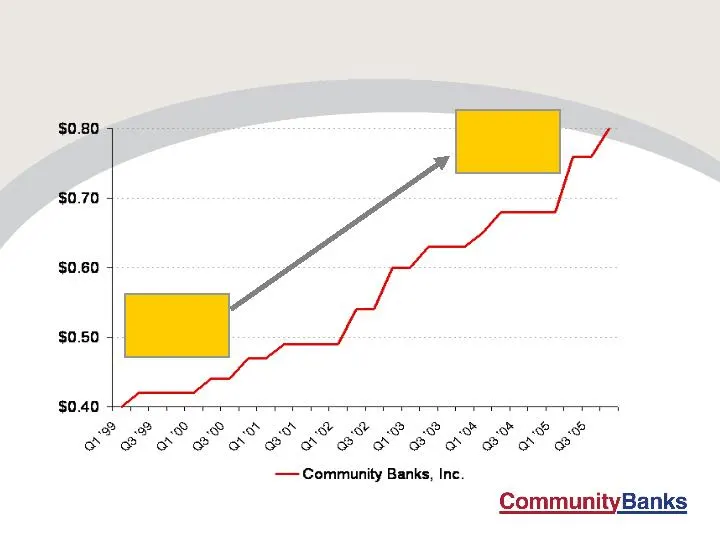
Slide 24: Quarterly Dividend (Annualized)
$.20/share Q4 $.10/share Q1 Quarterly Dividend (Annualized)

Slide 25: Share Repurchase
Share Repurchase 500,000 Share Repurchase Program Announced in August, 2005 and Completed by October, Additional 750,000 Program Announced at October, 2005 Board of Directors Meeting. Completion Will Result in the Equivalent Repurchase of Over 10% of the Incremental Shares Issued in the Merger. Inte

Slide 26: EPS Drives Stock Performance
EPS Drives Stock PERFORMANCE Successful EXECUTION u Follow Through on Cultural Integration/ Leveraging Platform CREDIT QUALITY u Keeping our “Eye on the Ball” u A Critical Cultural “Fit” Interest Rate Environment u Managing in a New Environment u Fortified Balance Sheet Competitors u More Disruption
Slide 27: Branch Expansion
2005/2006 Branch Expansion u February—Willow Street (Lancaster) u March — Spring Grove (York) u July–Lemoyne (Cumberland/Dauphin) u September—Carlisle (Cumberland) u November — Museum Road (Berks) u Late Spring—Hershey (Dauphin) u Delco Plaza—(York) u Mount Joy—(Lancaster) Over 70 Locations Througho

Slide 28: CommunityBanks
CommunityBanks
Source: SEC EDGAR · 8-K filed Nov 8, 2005
More decks from Community Banks Inc
 Community Banks — Merger or Acquisition (June 2007)23 slides · Jun 20, 2007
 Community Banks — Merger or Acquisition (May 2007)31 slides · May 1, 2007
 Ferris, Baker Watts Mid-Atlantic Bank Conference 200620 slides · Jul 27, 2006
 Shareholder Meeting (May 2006)45 slides · May 9, 2006
 Emerald Groundhog Day Investment Forum (February 2006)40 slides · Feb 2, 2006
 Shareholder Meeting (June 2005)51 slides · Jun 1, 2005