Community Banks — Ferris, Baker Watts Mid-Atlantic Bank Conference 2006
20 slides from Community Banks's conference presentation, Jul 27, 2006
Slide 1: Staying The Course
Ferris, Baker Watts, Inc. Mid-Atlantic Bank Conference July 27, 2006 Staying The Course 1
Slide 2: Disclaimer
Disclaimer This presentation contains “forward looking” information, as defined by the Private Securities Litigation Reform Act of 1995, that is based on Community’s current expectations, estimates and projections about future events and financial trends affecting the financial condition of its busi
Slide 3: Performance Goals
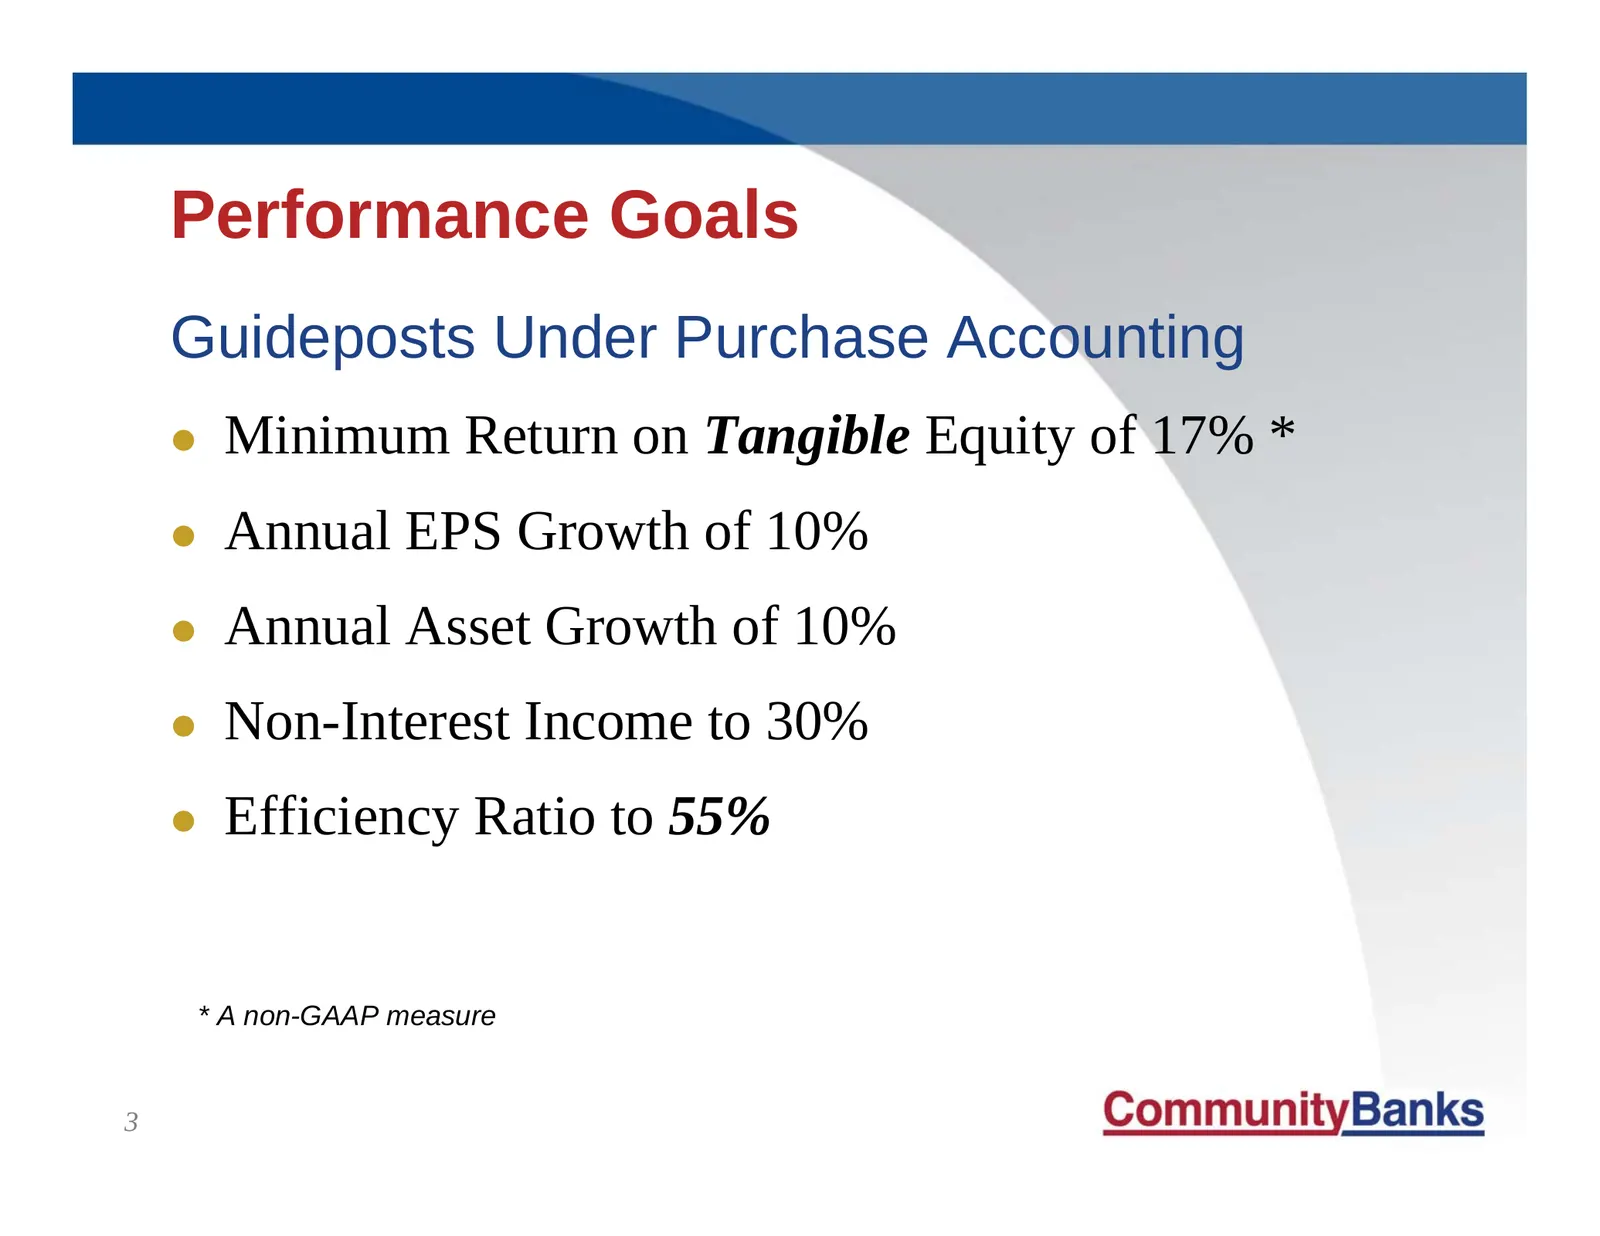
Performance Goals Guideposts Under Purchase Accounting z Minimum Return on Tangible Equity of 17% * z Annual EPS Growth of 10% z Annual Asset Growth of 10% z Non-Interest Income to 30% z Efficiency Ratio to 55% * A non-GAAP measure 3
Slide 4: Goodwill and Other Intangibles
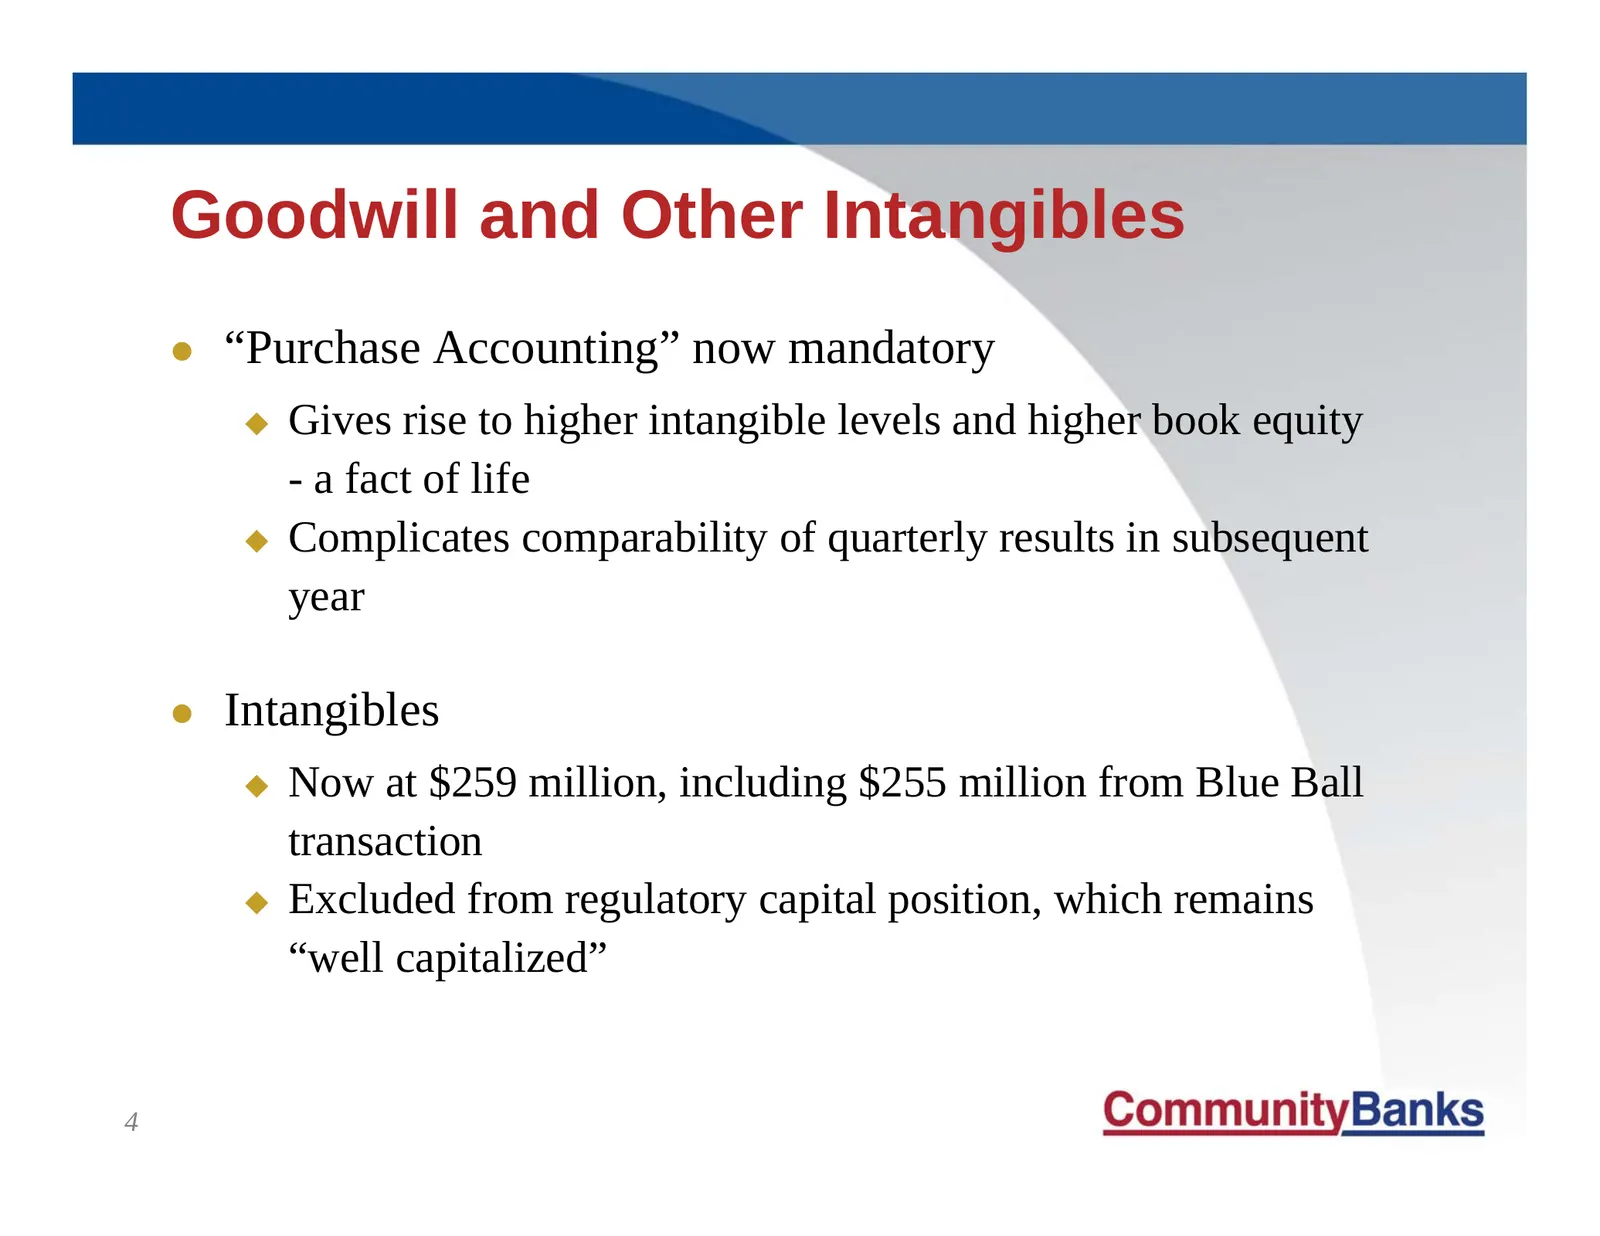
Goodwill and Other Intangibles z “Purchase Accounting” now mandatory Gives rise to higher intangible levels and higher book equity - a fact of life Complicates comparability of quarterly results in subsequent year z Intangibles Now at $259 million, including $255 million from Blue Ball transac
Slide 5: Blue Ball: Purchase Accounting Complexities
Blue Ball: Purchase Accounting Complexities z 2005: Pre-Merger Results (Q1,Q2) - Excludes Blue Ball operations z 2005: Post-Merger Results (Q3, Q4) - Reflects combined operations z 2005: Full Year Results are a hybrid z Historical Results (pre-7/1/05) are not restated 5
Slide 6: Post Merger CMTY
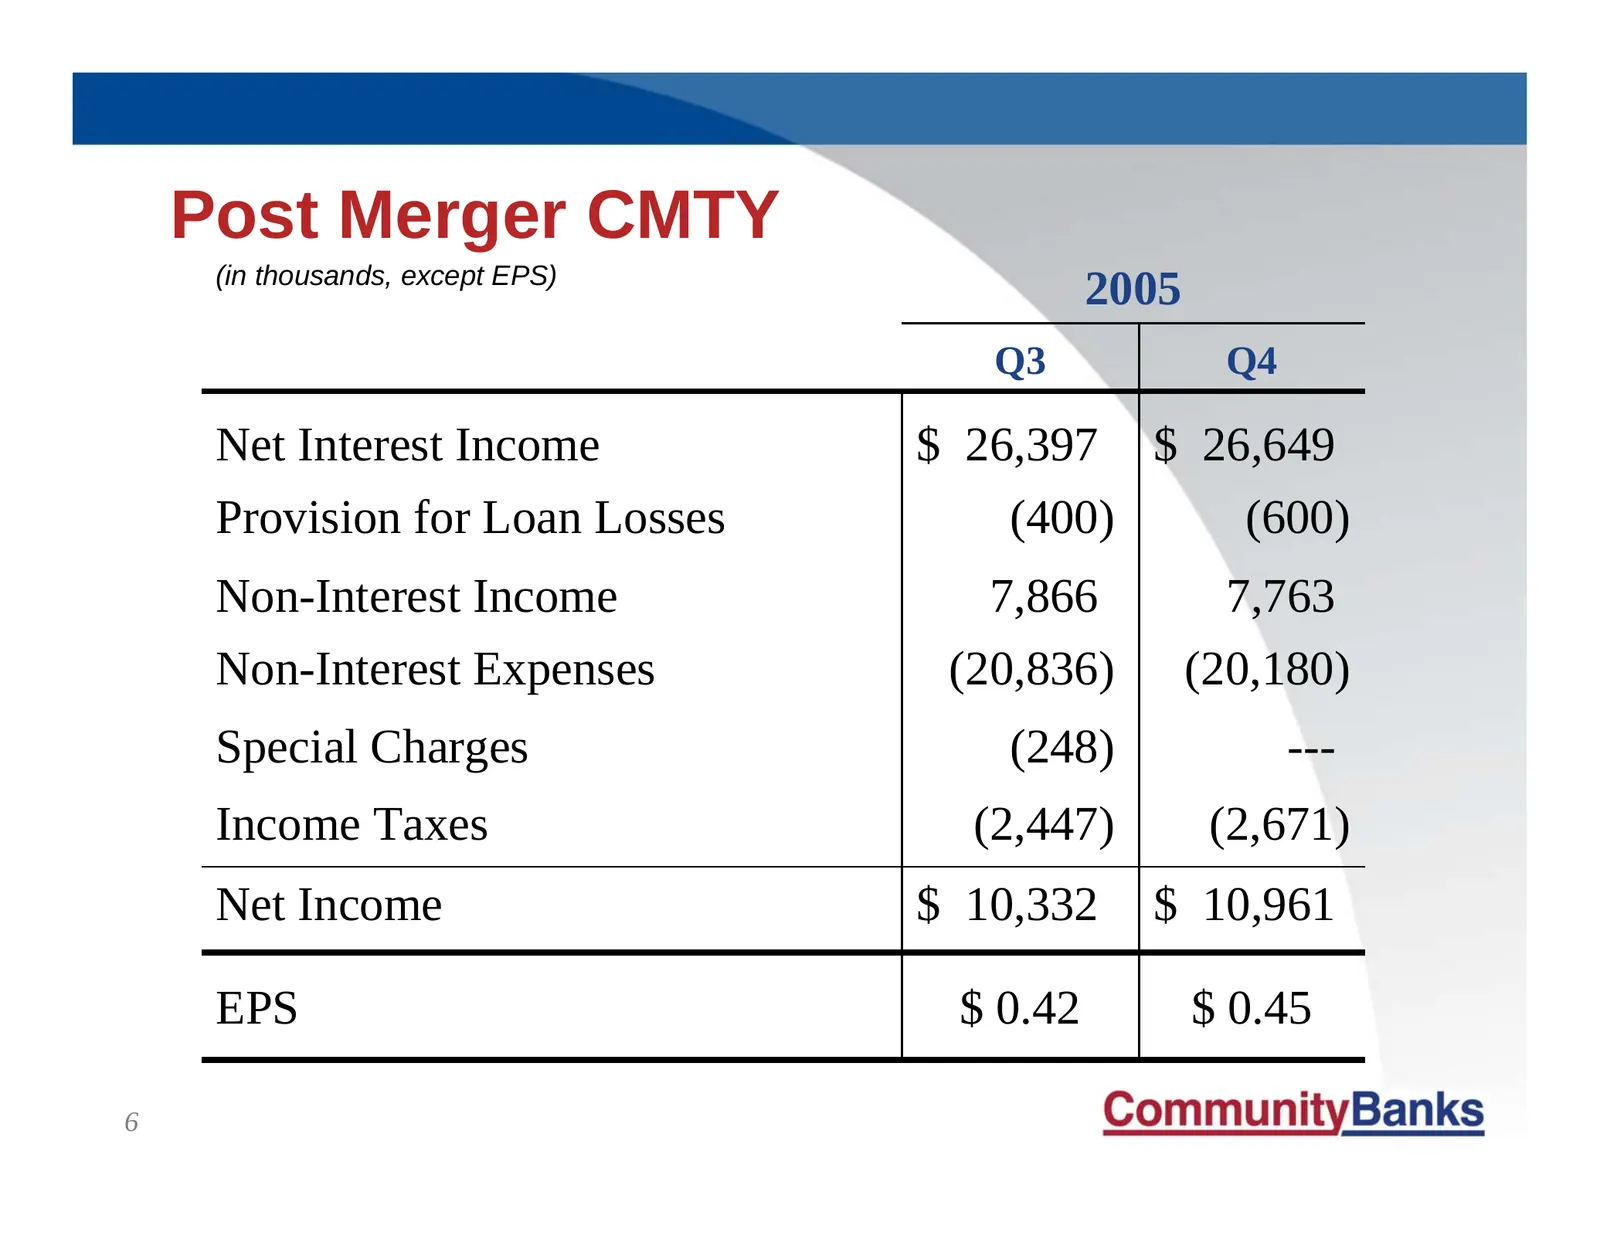
Post Merger CMTY (in thousands, except EPS) 2005 Q3 Q4 Net Interest Income $ 26,397 $ 26,649 Provision for Loan Losses (400) (600) Non-Interest Income 7,866 7,763 Non-Interest Expenses (20,836) (20,180) Special Charges (248) --- Income Taxes (2,447) (2,671) Net Income $ 10,332 $ 10,961 EPS $ 0.42 $
Slide 7: Post Merger CMTY
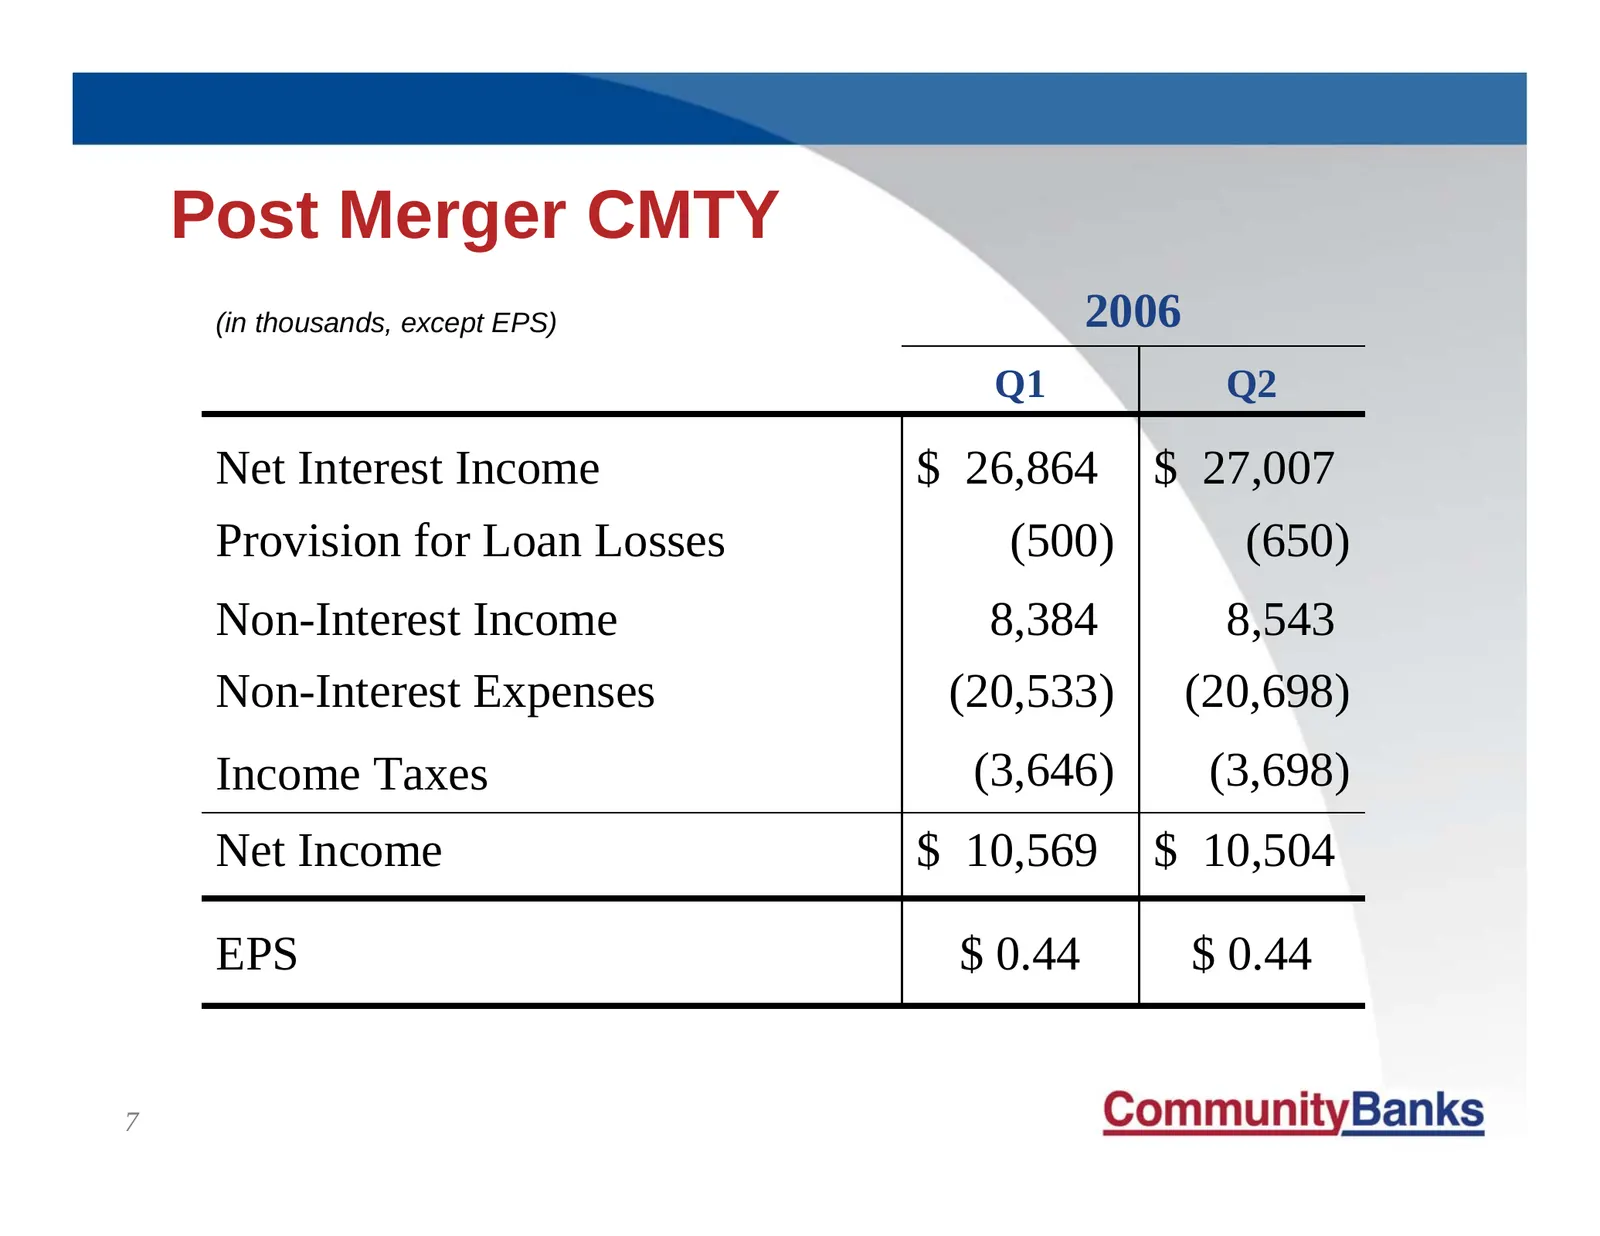
Post Merger CMTY (in thousands, except EPS) 2006 Q1 Q2 Net Interest Income $ 26,864 $ 27,007 Provision for Loan Losses (500) (650) Non-Interest Income 8,384 8,543 Non-Interest Expenses (20,533) (20,698) Income Taxes (3,646) (3,698) Net Income $ 10,569 $ 10,504 EPS $ 0.44 $ 0.44 7
Slide 8: Four Components of Performance
Four Components of Performance z Net Interest Income z Provision for Loan Losses z Non-Interest Income z Non-Interest Expenses 8
Slide 9: Net Interest Income
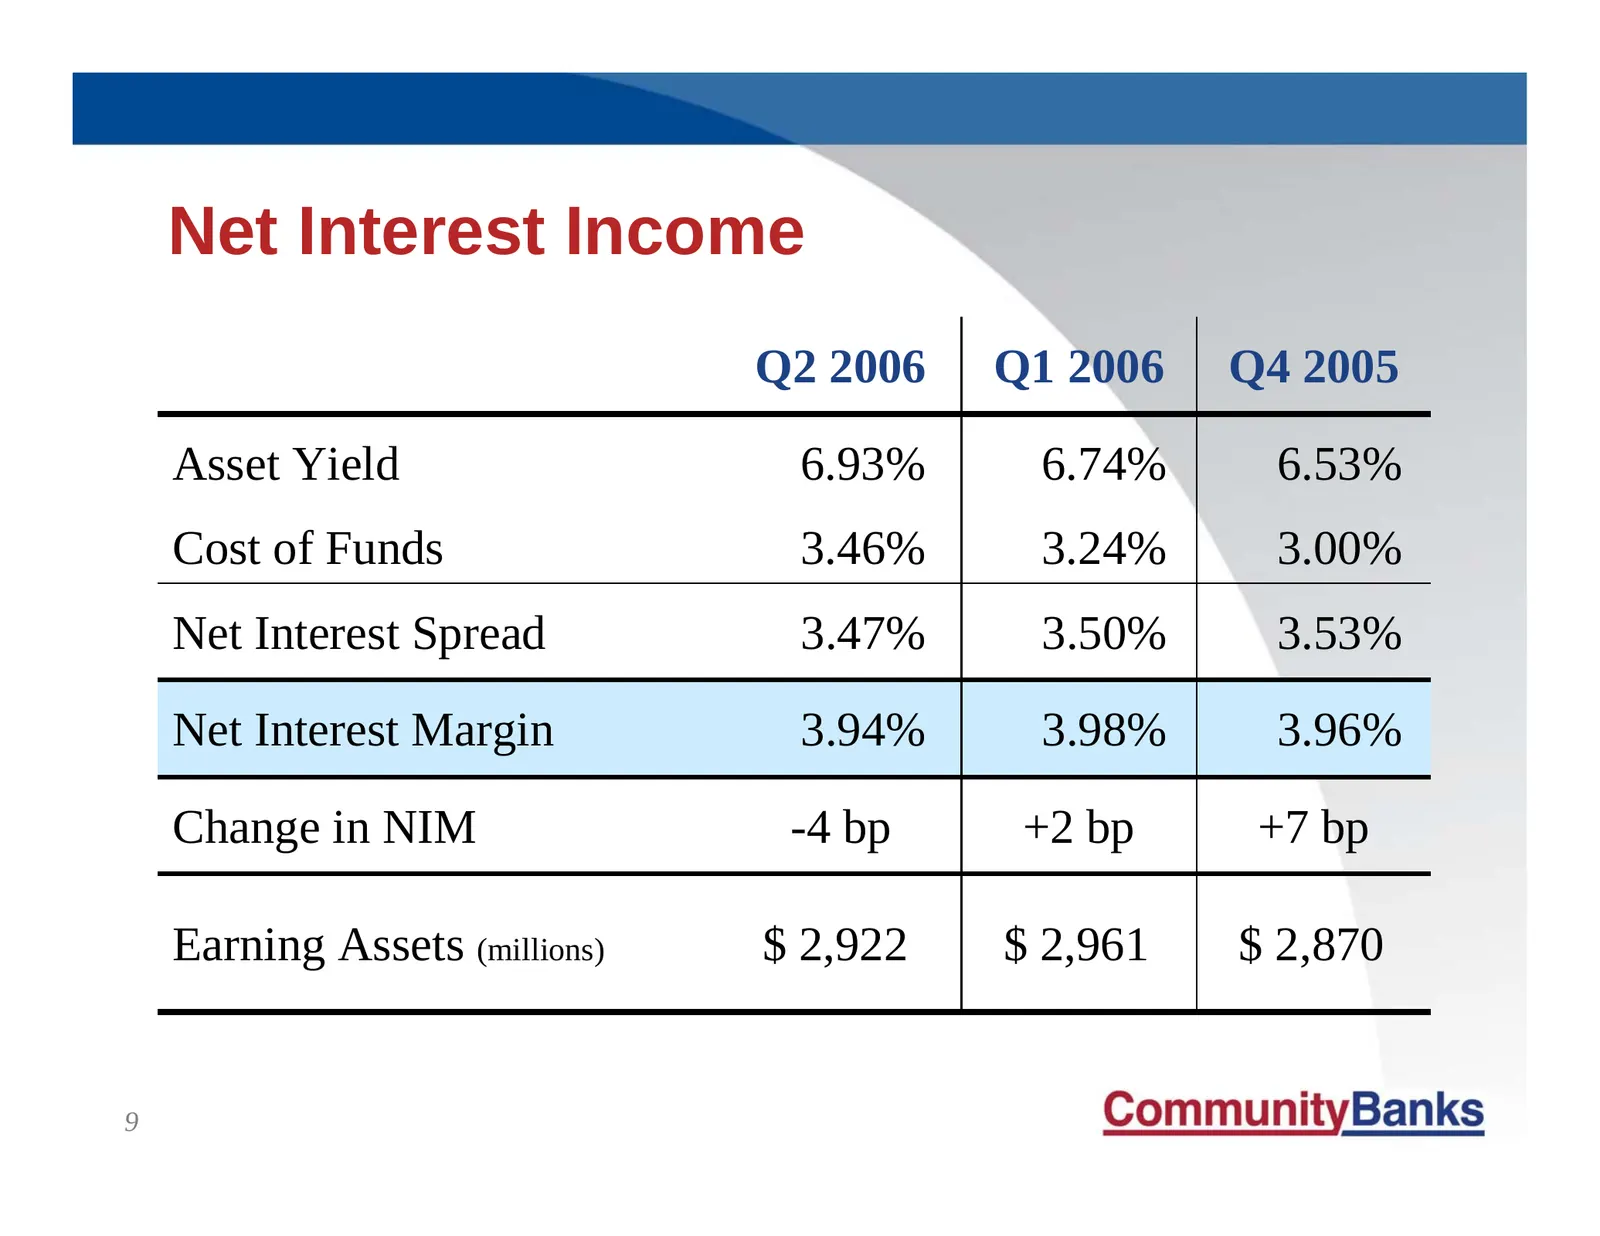
Net Interest Income Q2 2006 Q1 2006 Q4 2005 Asset Yield 6.93% 6.74% 6.53% Cost of Funds 3.46% 3.24% 3.00% Net Interest Spread 3.47% 3.50% 3.53% Net Interest Margin 3.94% 3.98% 3.96% Change in NIM -4 bp +2 bp +7 bp Earning Assets (millions) $ 2,922 $ 2,961 $ 2,870 9
Slide 10: Loans
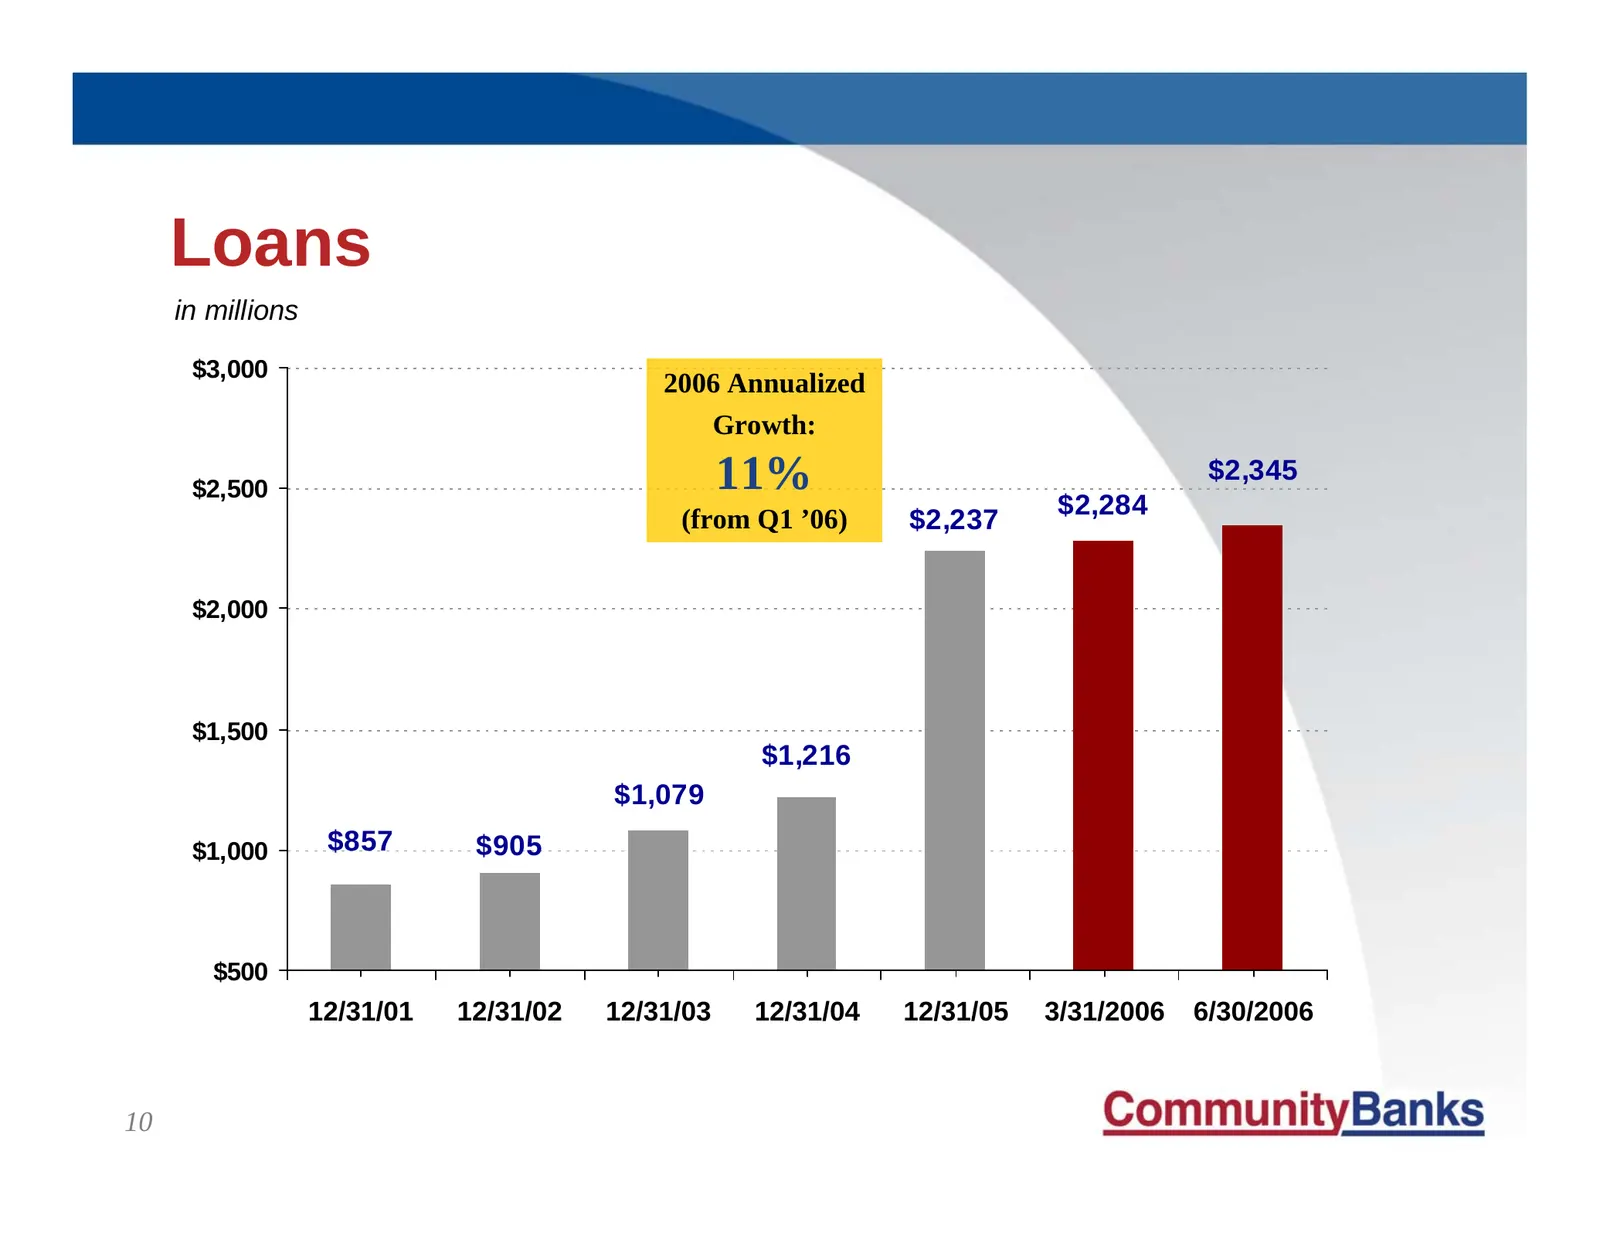
Loans in millions $3,000 2006 Annualized Growth: $2,500 11% $2,345 $2,284 (from Q1 ’06) $2,237 $2,000 $1,500 $1,216 $1,079 $1,000 $857 $905 $500 12/31/01 12/31/02 12/31/03 12/31/04 12/31/05 3/31/2006 6/30/2006 10
Slide 11: Deposits
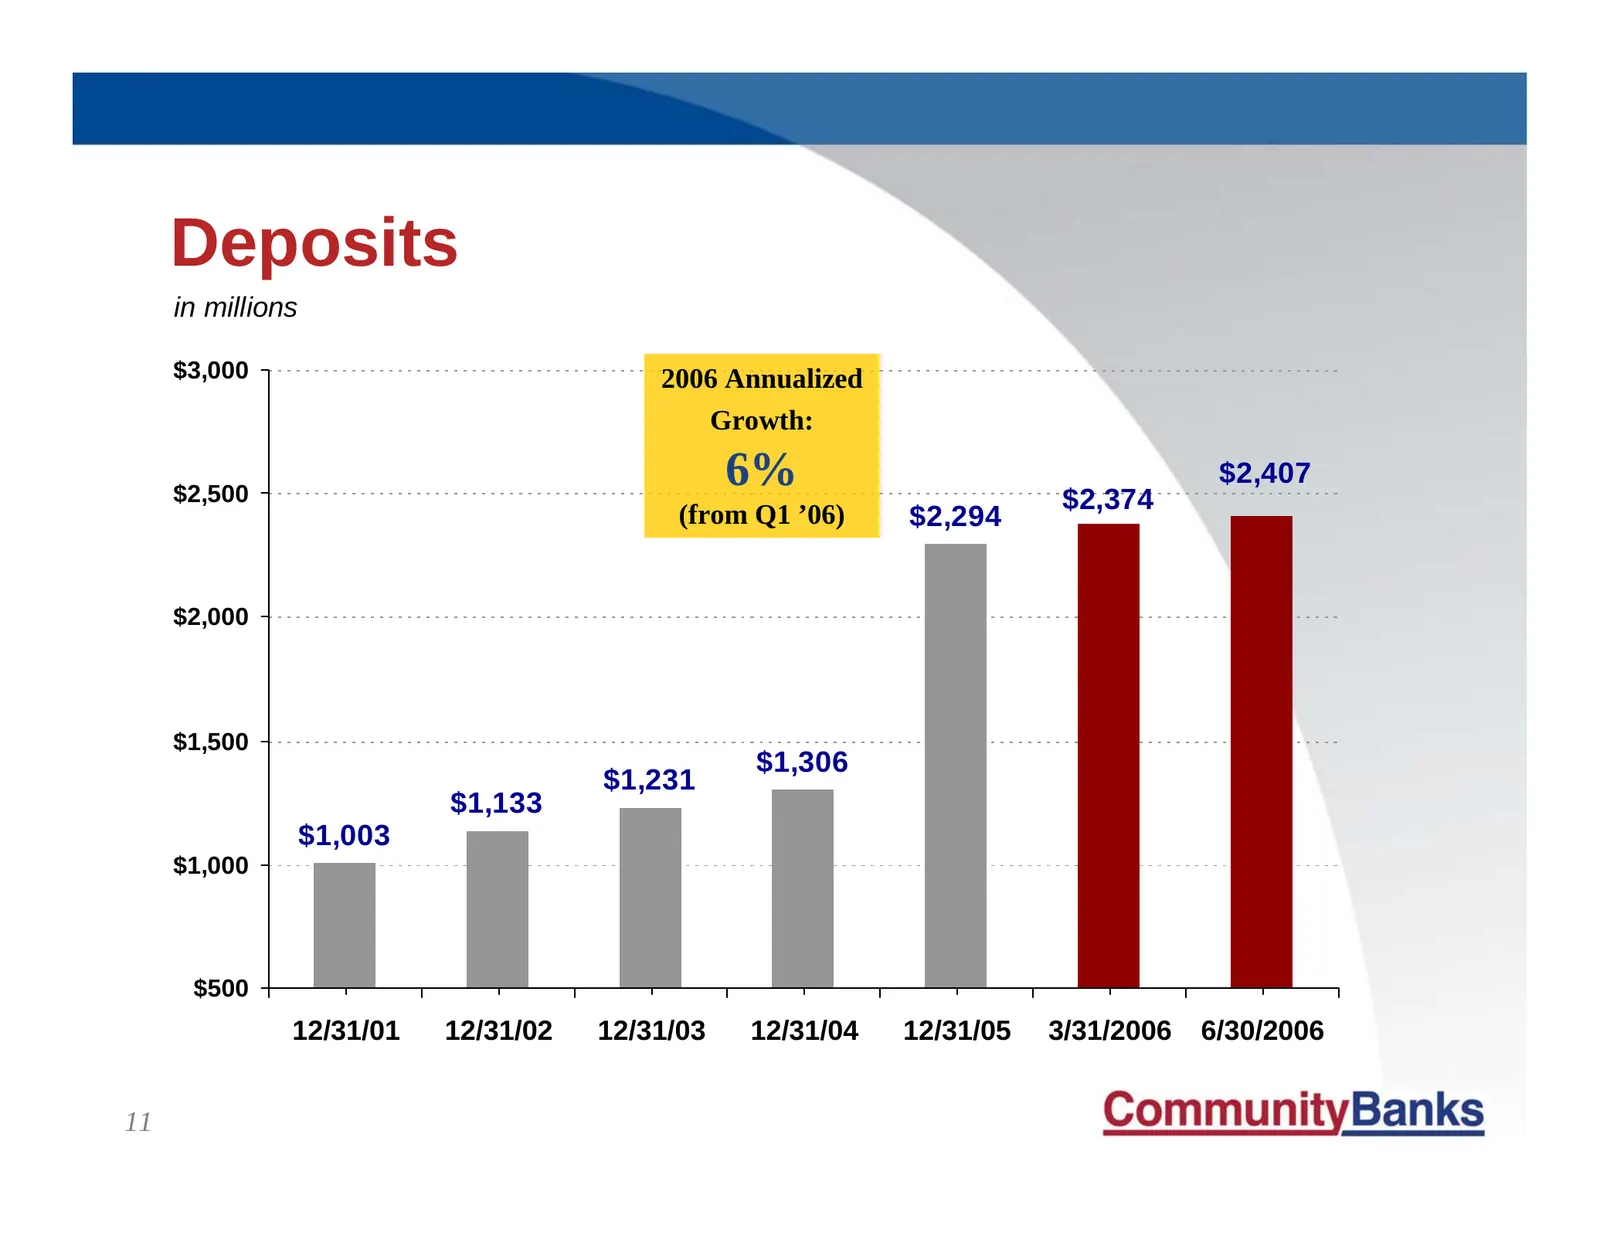
Deposits in millions $3,000 2006 Annualized Growth: $2,500 6% $2,407 (from Q1 ’06) $2,374 $2,294 $2,000 $1,500 $1,306 $1,231 $1,133 $1,003 $1,000 $500 12/31/01 12/31/02 12/31/03 12/31/04 12/31/05 3/31/2006 6/30/2006 11
Slide 12: Charge-Off History
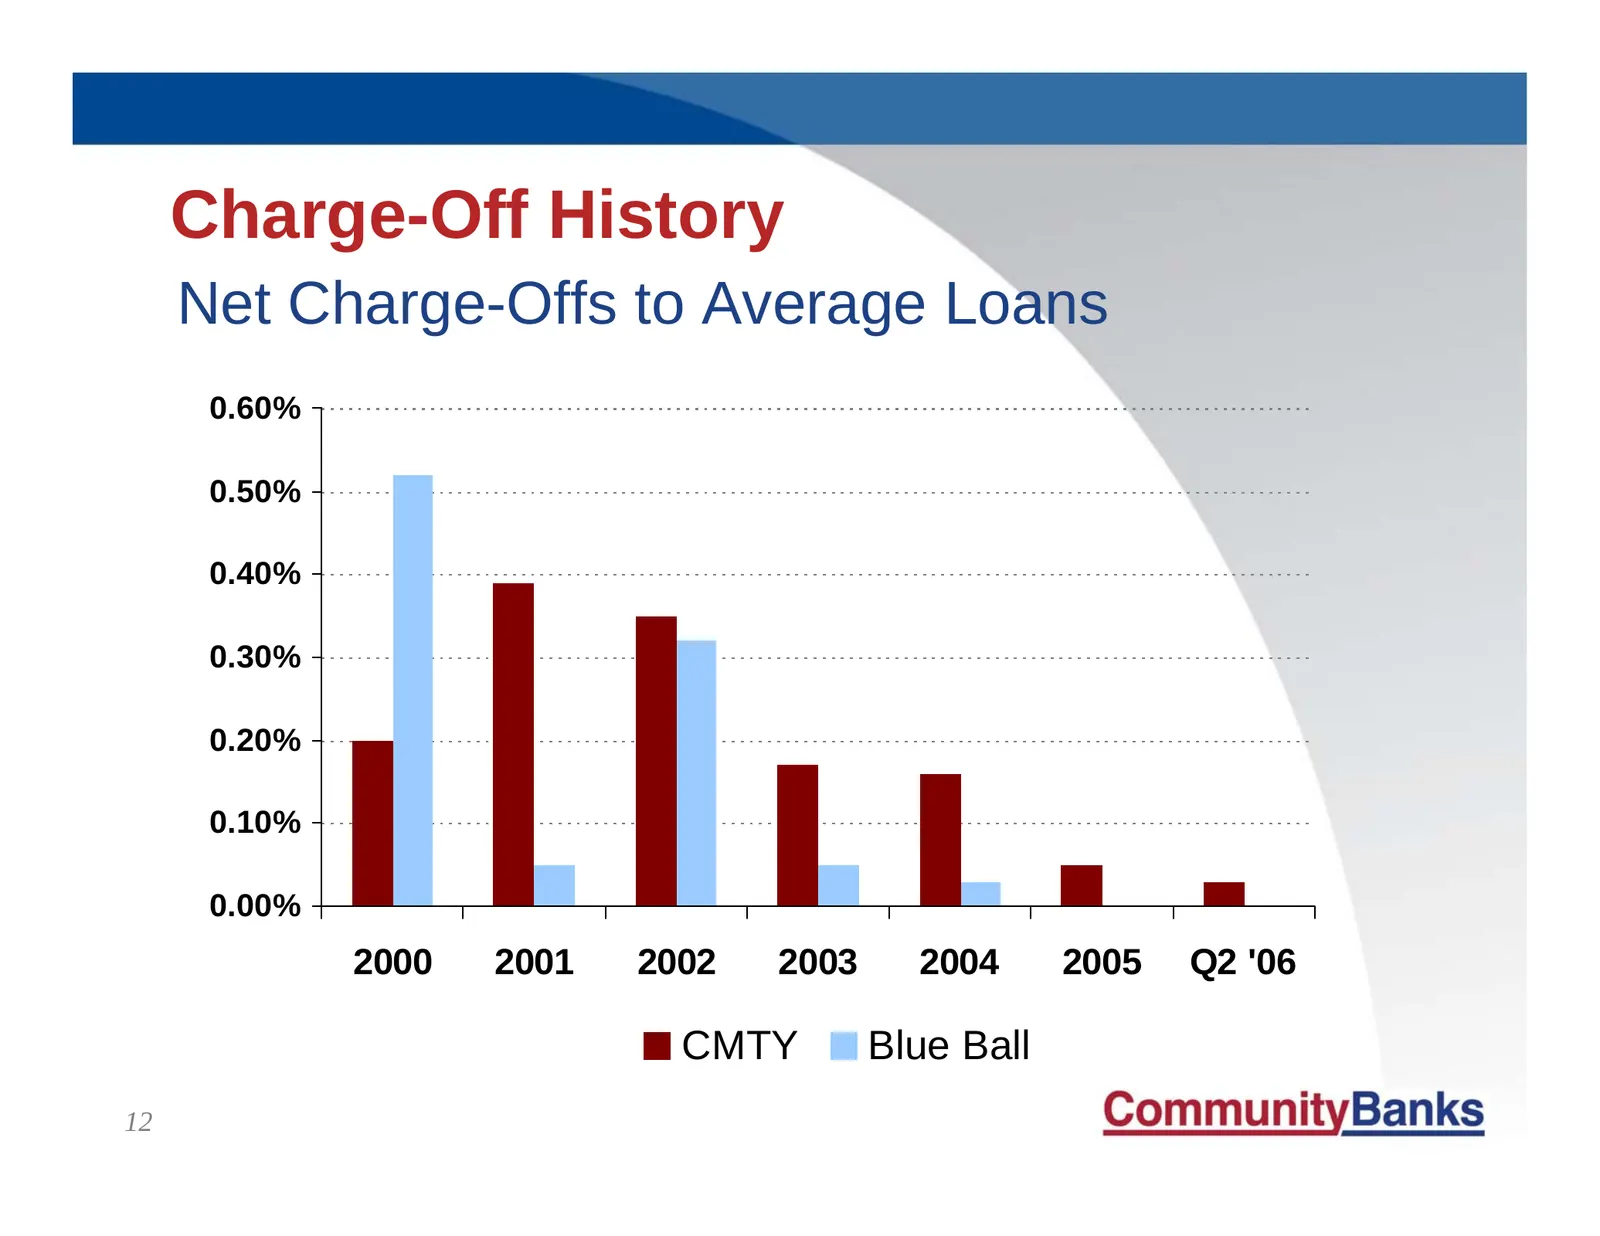
Charge-Off History Net Charge-Offs to Average Loans 0.60% 0.50% 0.40% 0.30% 0.20% 0.10% 0.00% 2000 2001 2002 2003 2004 2005 Q2 '06 CMTY Blue Ball 12
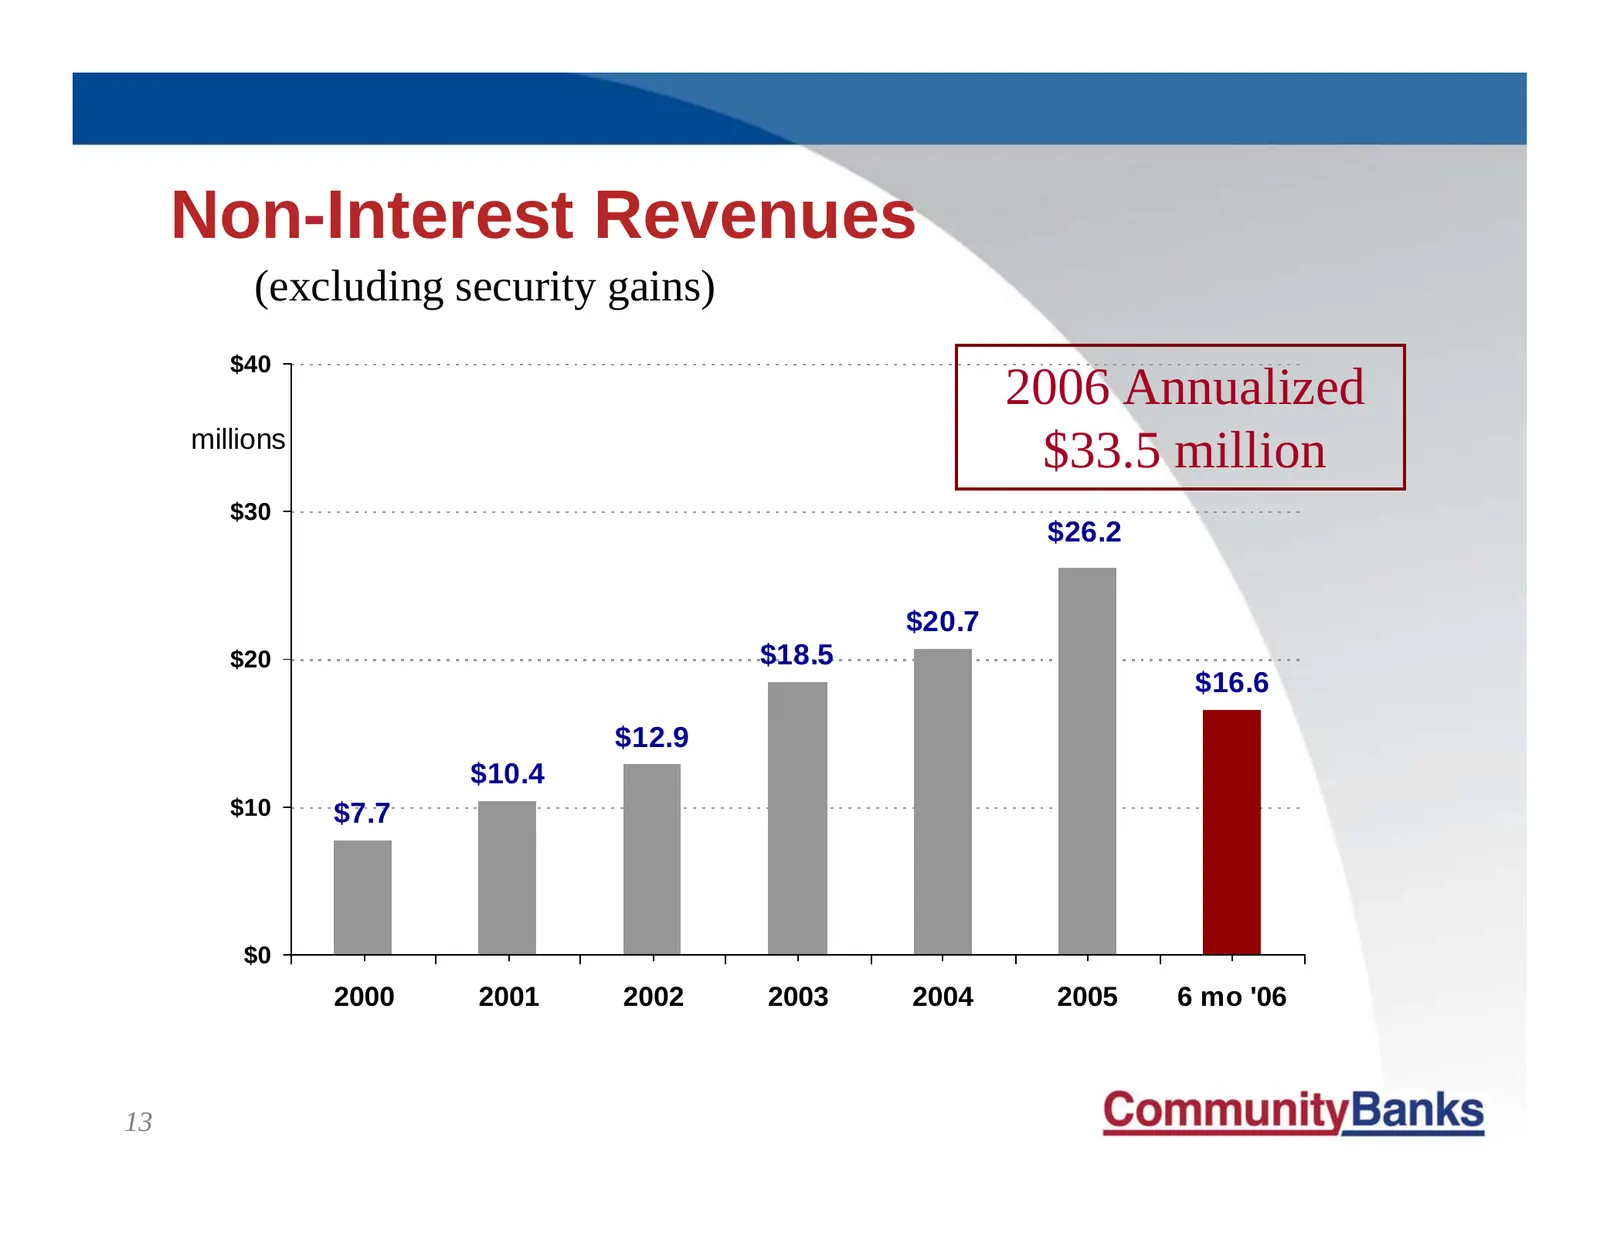
Slide 13: Non-Interest Revenues
Non-Interest Revenues (excluding security gains) $40 2006 Annualized millions $33.5 million $30 $26.2 $20.7 $20 $18.5 $16.6 $12.9 $10.4 $10 $7.7 $0 2000 2001 2002 2003 2004 2005 6 mo '06 13
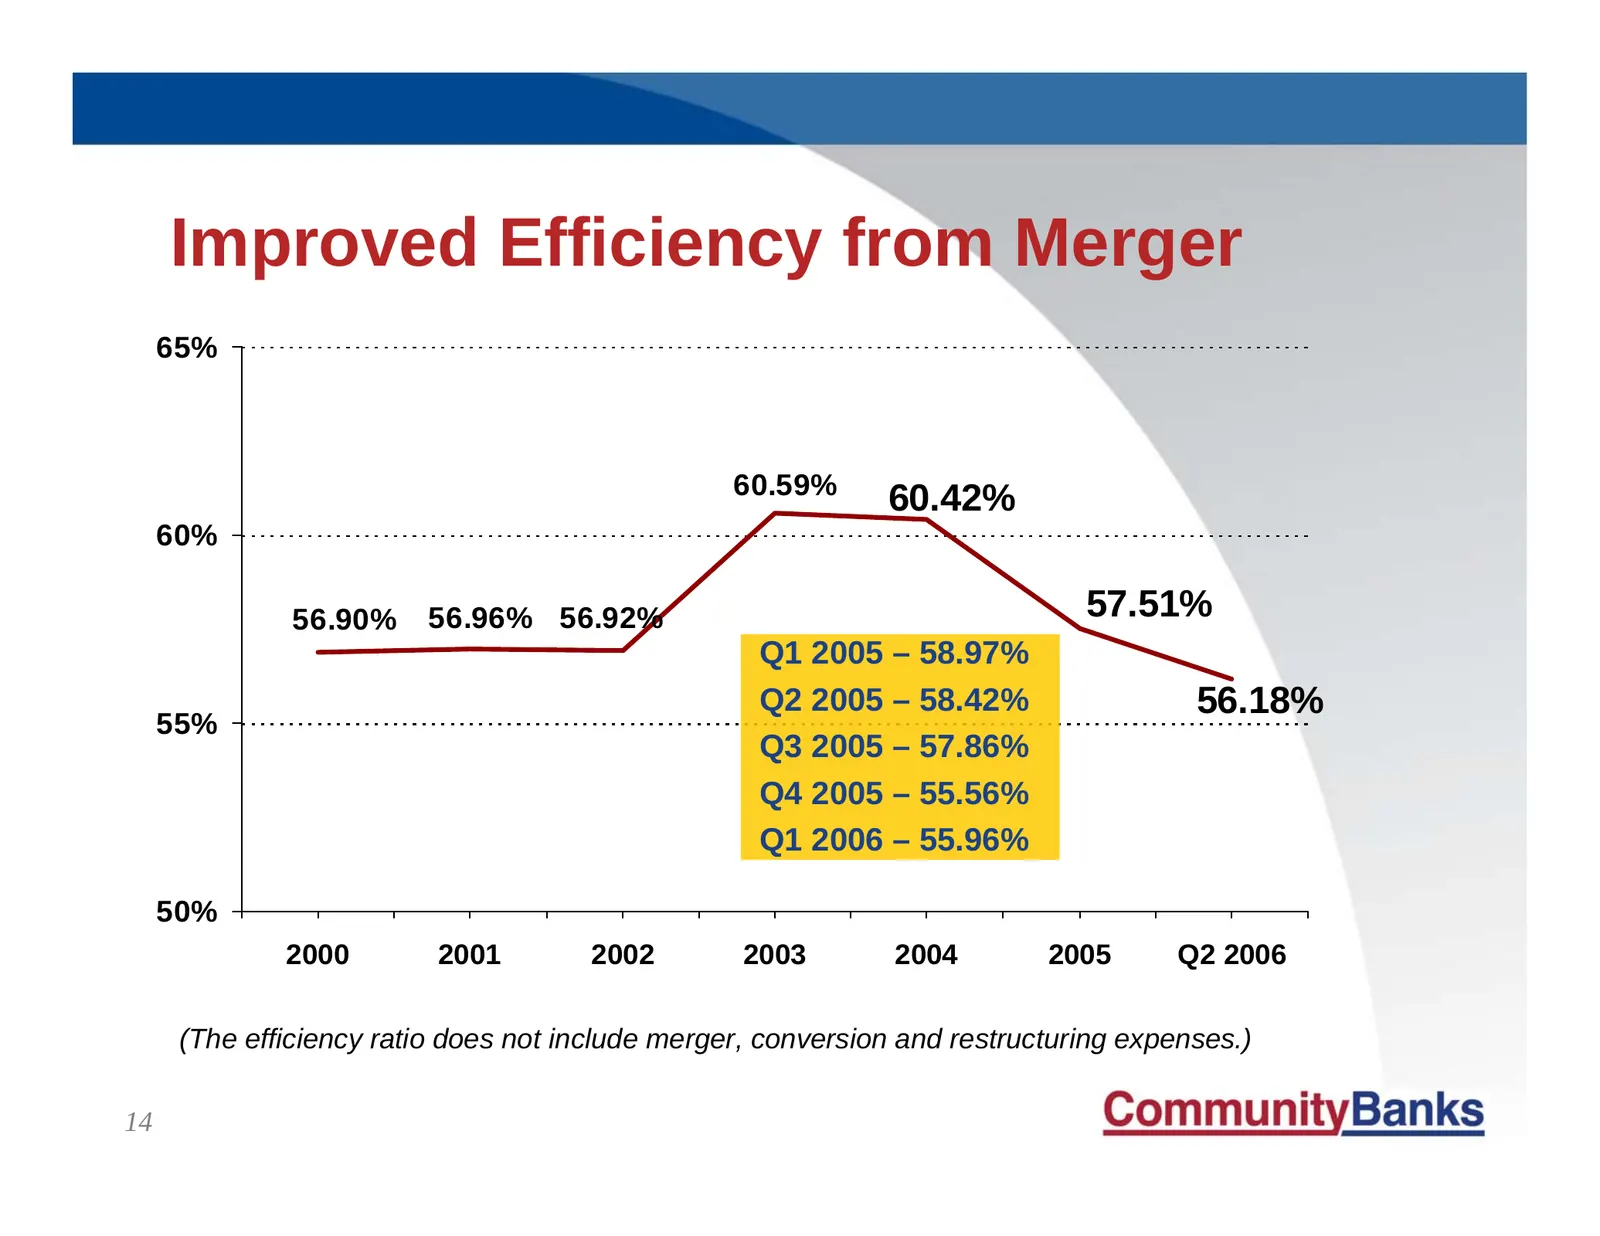
Slide 14: Improved Efficiency from Merger
Improved Efficiency from Merger 65% 60.59% 60.42% 60% 56.90% 56.96% 56.92% 57.51% Q1 2005 – 58.97% Q2 2005 – 58.42% 56.18% 55% Q3 2005 – 57.86% Q4 2005 – 55.56% Q1 2006 – 55.96% 50% 2000 2001 2002 2003 2004 2005 Q2 2006 (The efficiency ratio does not include merger, conversion and restructuring expe
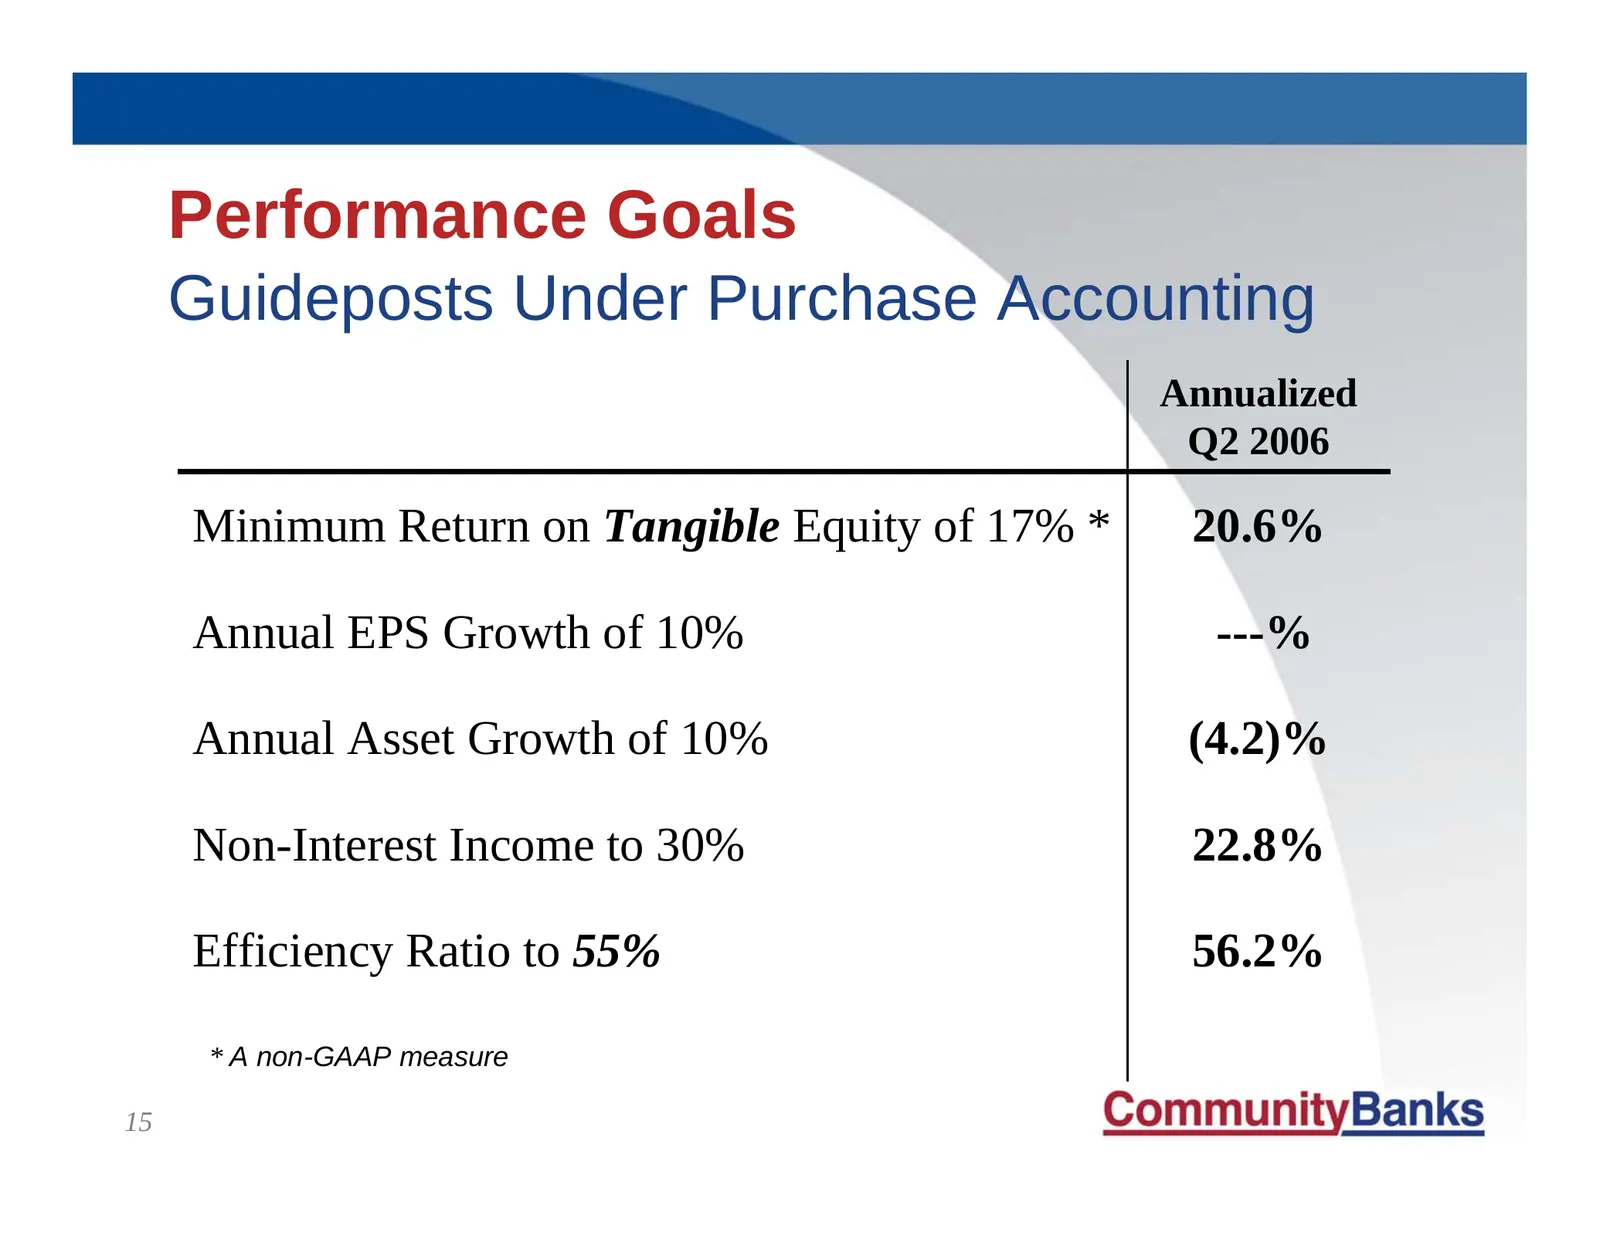
Slide 15: Performance Goals Guideposts Under Purchase Accounting
Performance Goals Guideposts Under Purchase Accounting Annualized Q2 2006 Minimum Return on Tangible Equity of 17% * 20.6% Annual EPS Growth of 10% ---% Annual Asset Growth of 10% (4.2)% Non-Interest Income to 30% 22.8% Efficiency Ratio to 55% 56.2% * A non-GAAP measure 15
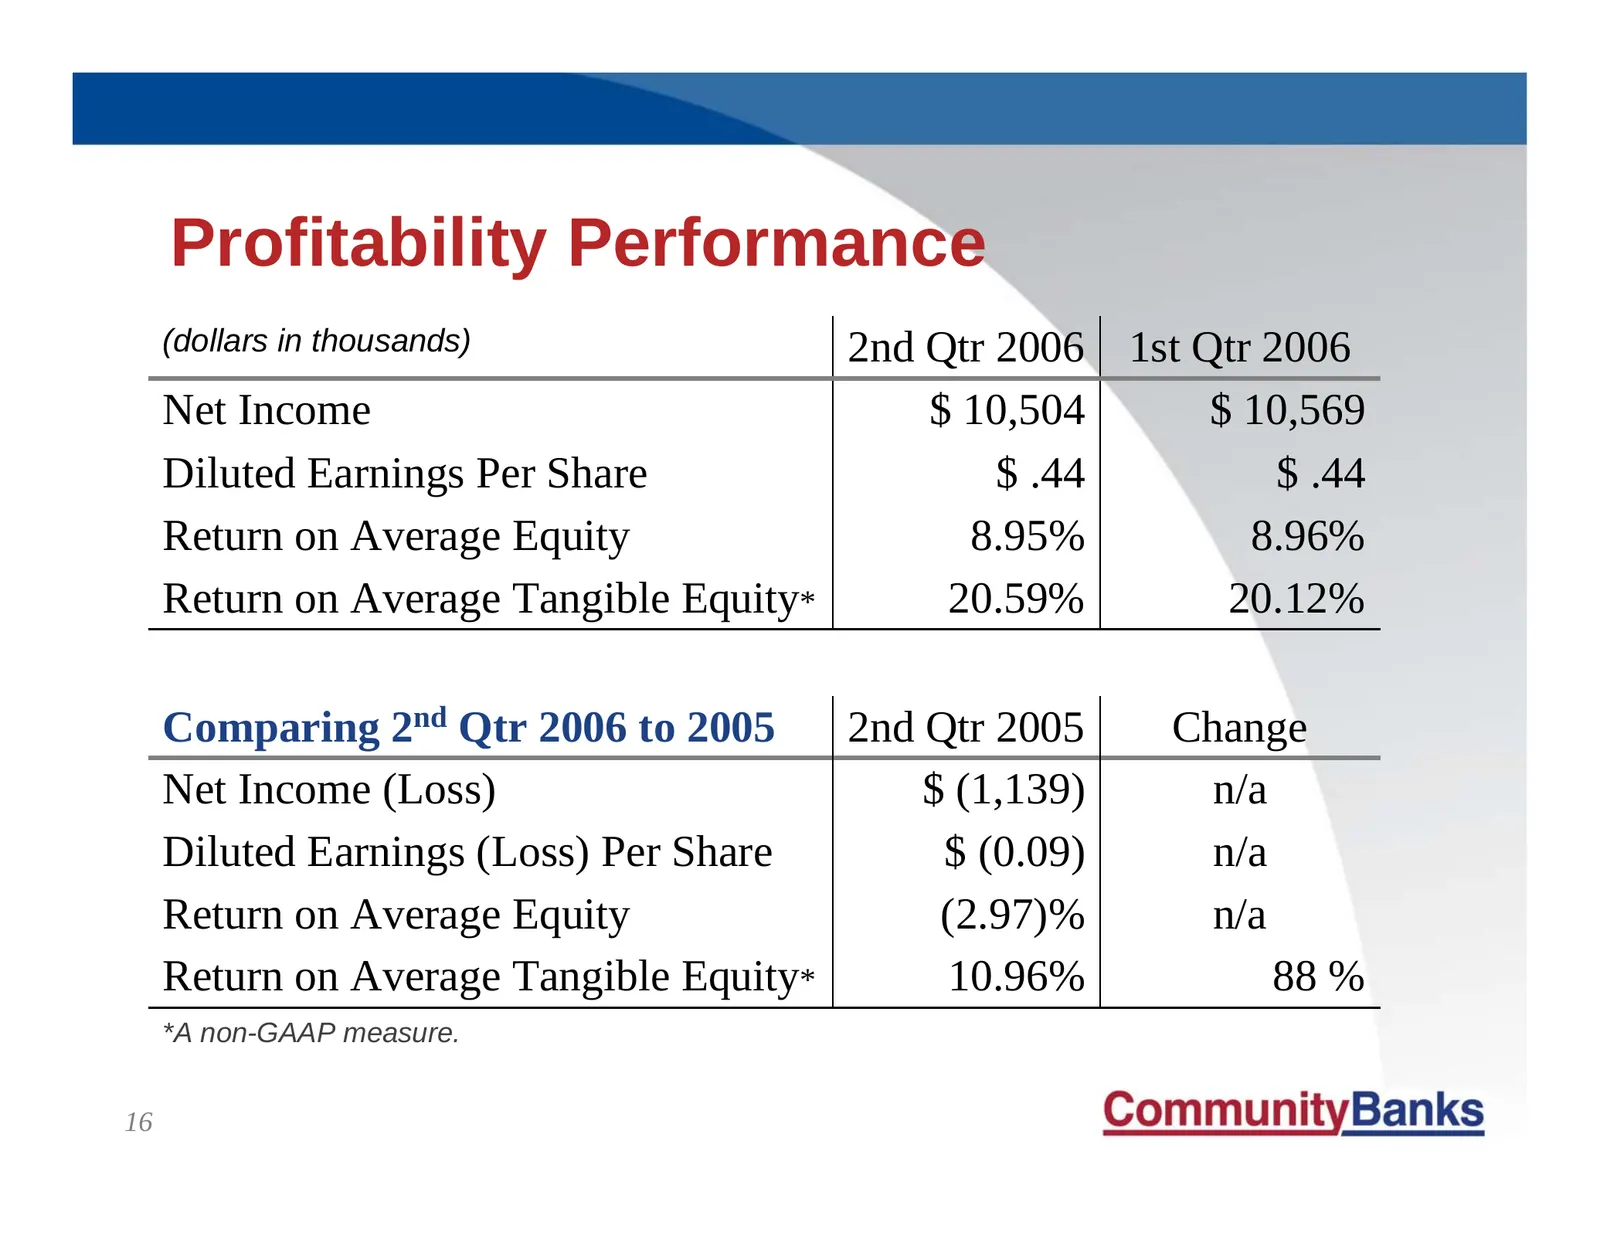
Slide 16: Profitability Performance
Profitability Performance (dollars in thousands) 2nd Qtr 2006 1st Qtr 2006 Net Income $ 10,504 $ 10,569 Diluted Earnings Per Share $ .44 $ .44 Return on Average Equity 8.95% 8.96% Return on Average Tangible Equity* 20.59% 20.12% Comparing 2nd Qtr 2006 to 2005 2nd Qtr 2005 Change Net Income (Loss) $
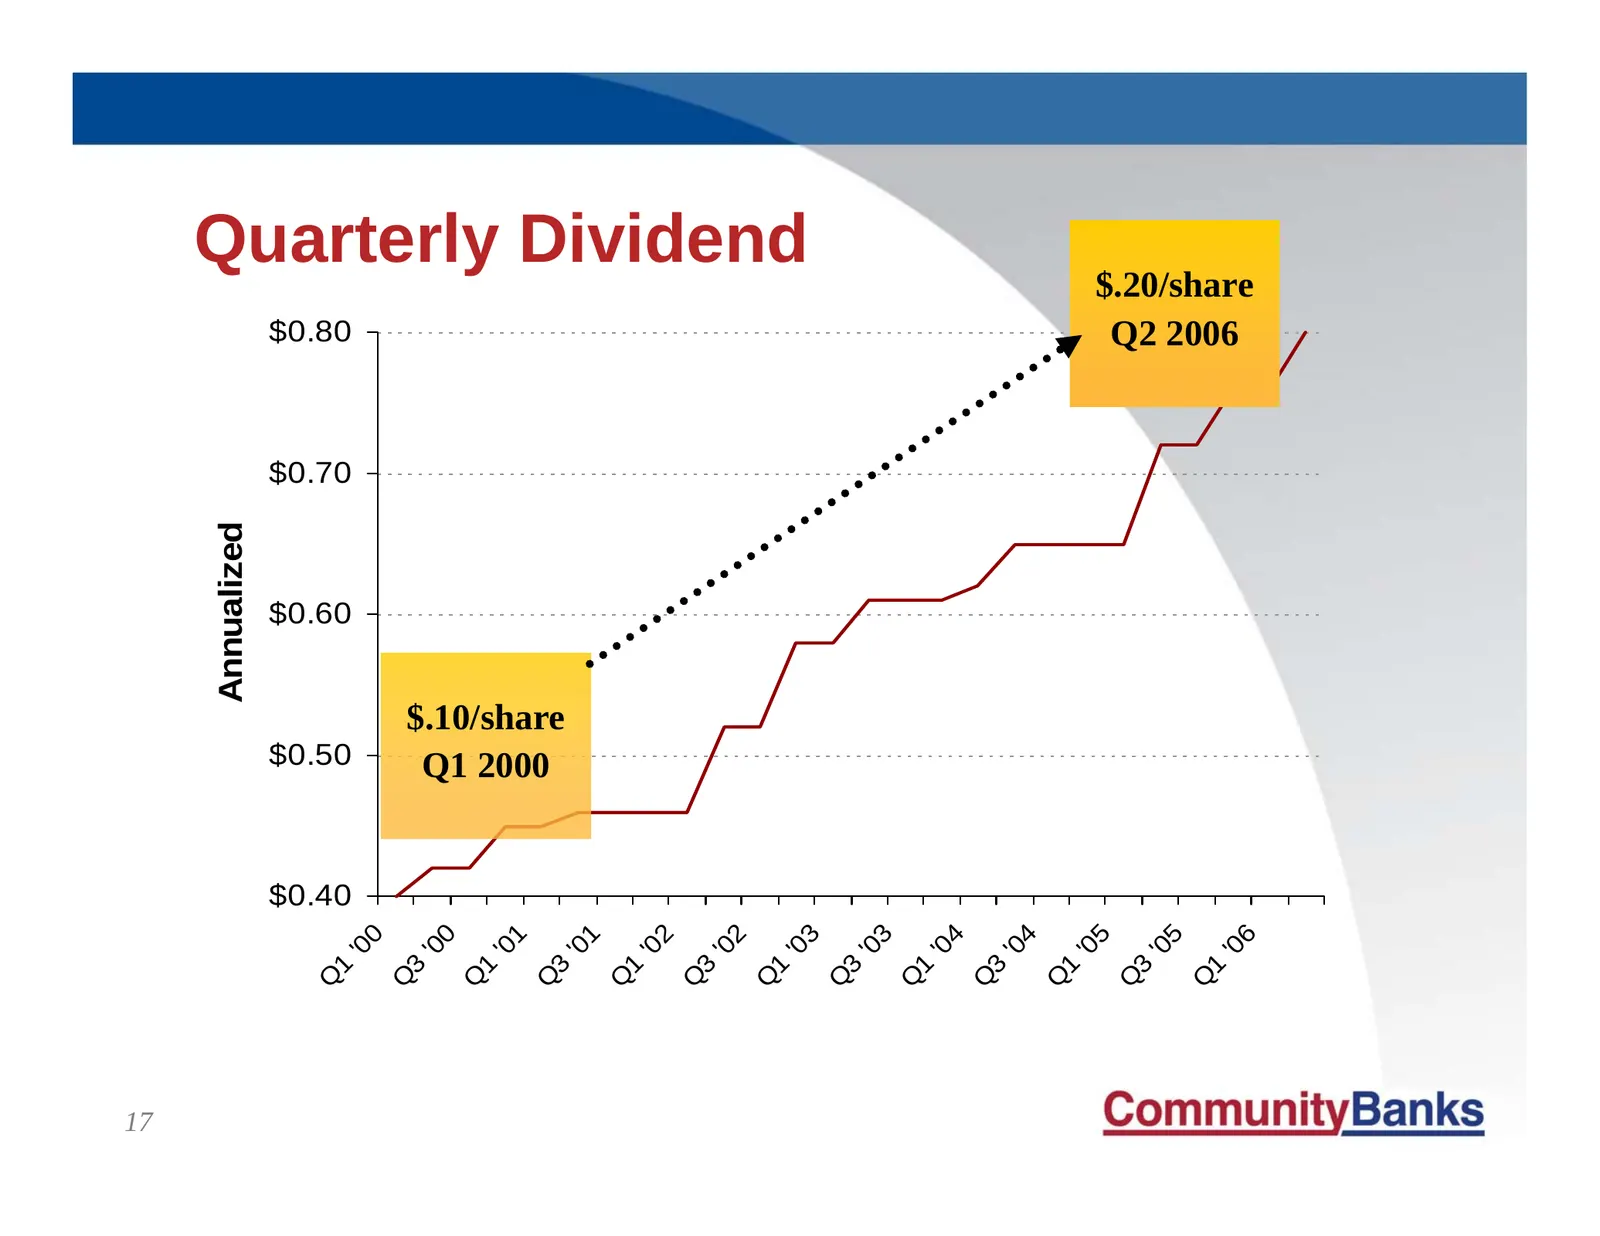
Slide 17: Quarterly Dividend
Quarterly Dividend $.20/share $0.80 Q2 2006 $0.70 Annualized $0.60 $.10/share $0.50 Q1 2000 $0.40 0 0 1 1 2 2 3 3 4 4 5 5 6 '0 '0 '0 '0 '0 '0 '0 '0 '0 '0 '0 '0 '0 1 3 1 3 1 3 1 3 1 3 1 3 1 Q Q Q Q Q Q Q Q Q Q Q Q Q 17
Slide 18: Share Repurchase
Share Repurchase z 500,000 Share Repurchase Program Announced in August, 2005 and Completed by October, 2005 z Additional 787,500 Program - Announced in October, 2005 (Substantially Complete at July 27, 2006) z Completion Will Result in the Equivalent Repurchase of Over 10% of the Incremental Shares
Slide 19: Strategic Vision
Strategic Vision z Our Mission Financial services provider of choice Employer of choice in the communities where we operate Acquisition partner of choice for banks and financial services providers in markets we desire z Industry Consolidation Nearly 80 Financial Institutions with Under $1 Bi
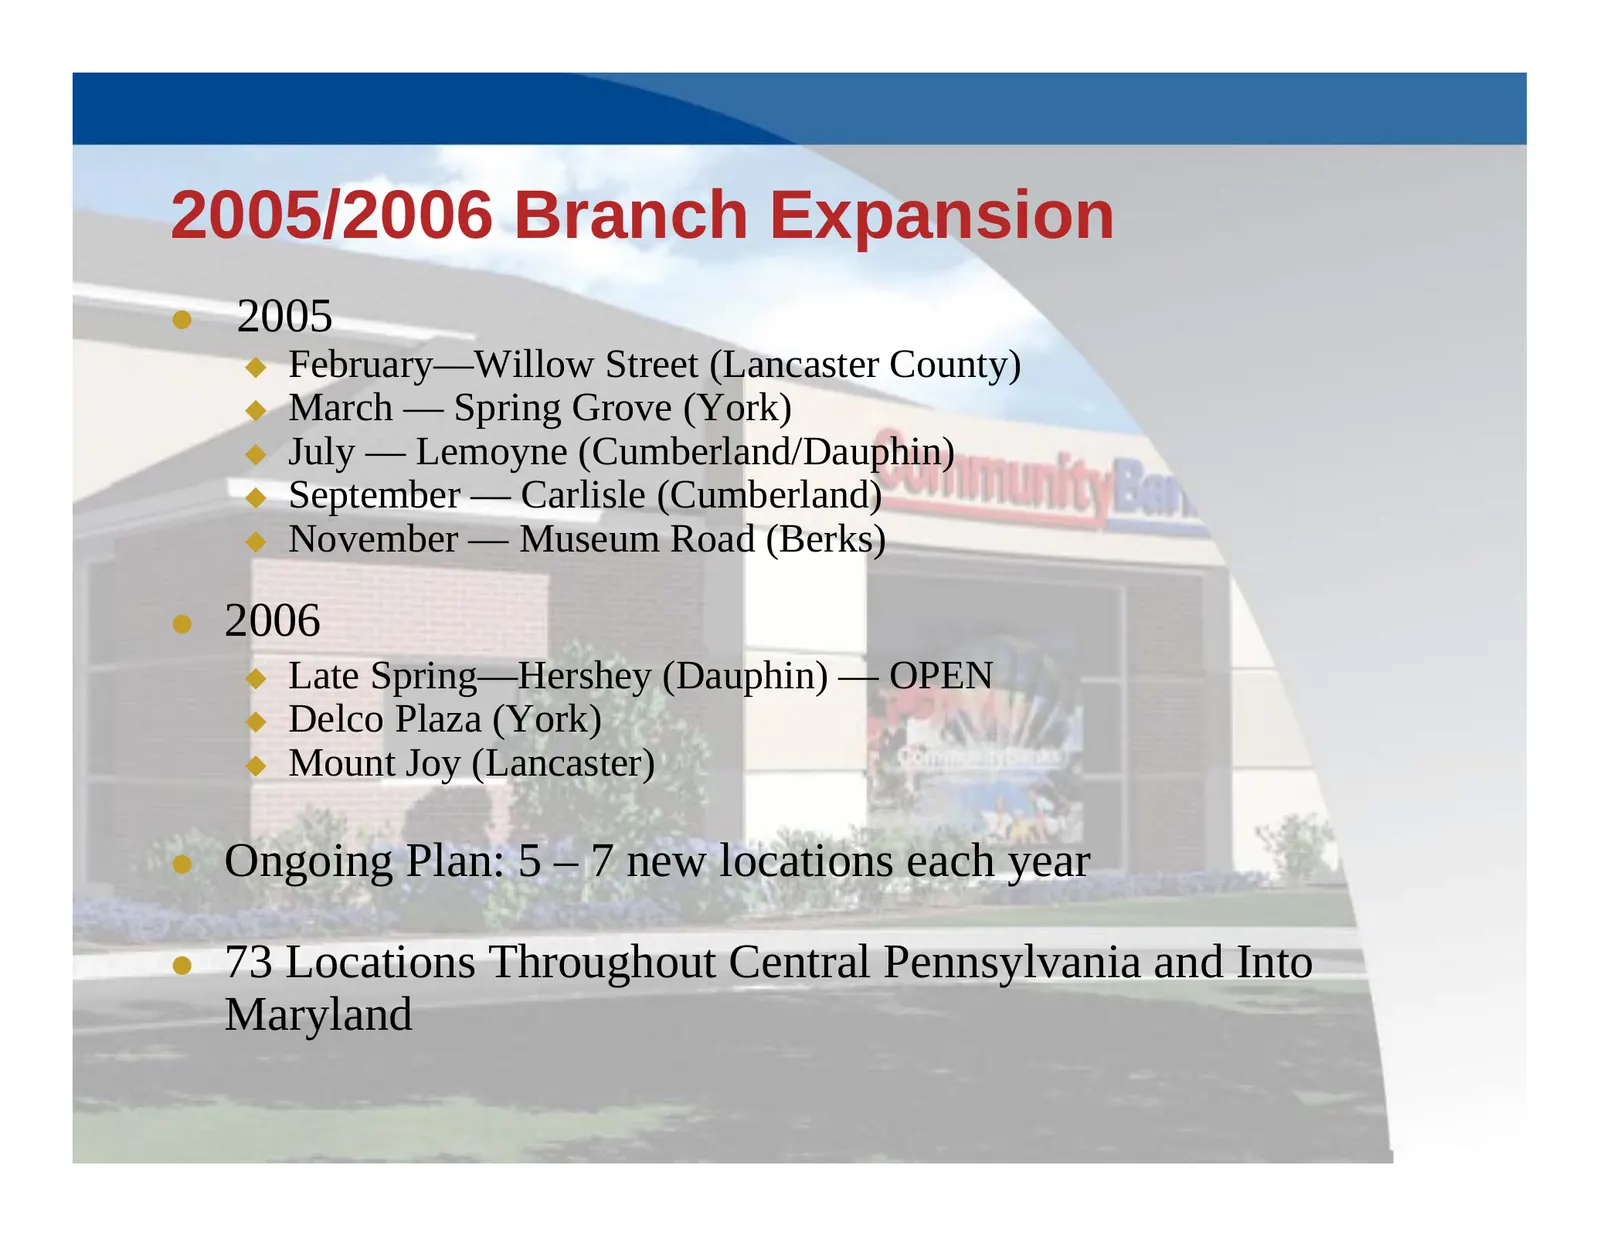
Slide 20: 2005/2006 Branch Expansion
2005/2006 Branch Expansion z 2005 February—Willow Street (Lancaster County) March — Spring Grove (York) July — Lemoyne (Cumberland/Dauphin) September — Carlisle (Cumberland) November — Museum Road (Berks) z 2006 Late Spring—Hershey (Dauphin) — OPEN Delco Plaza (York) Mount Joy (Lanca
Source: SEC EDGAR · 8-K filed Jul 27, 2006
More decks from Community Banks Inc
 Community Banks — Merger or Acquisition (June 2007)23 slides · Jun 20, 2007
 Community Banks — Merger or Acquisition (May 2007)31 slides · May 1, 2007
 Shareholder Meeting (May 2006)45 slides · May 9, 2006
 Emerald Groundhog Day Investment Forum (February 2006)40 slides · Feb 2, 2006
 Mid-Atlantic SuperCommunity Bank Conference 200528 slides · Nov 8, 2005
 Shareholder Meeting (June 2005)51 slides · Jun 1, 2005