Cal Dive International — Q3 2010 Earnings Presentation
12 slides from Cal Dive International's earnings presentation, Oct 28, 2010

Slide 1: Cal Dive International 3Q 2010 Earnings Conference Call
INTERNATIONAL Cal Dive International 3'¢ Quarter 2010 Earnings Conference Call

Slide 2: Forward-Looking Statements
Forward-Looking Statements This presentation may include “forward-looking” statements that are generally identifiable through our use of words such as “believe,” “expect,” “anticipate,” “intend,” “plan,” “estimate,” “project” and similar expressions and include any statements that we make regarding
Slide 3: Presentation Outline
Presentation Outline ®> Summary of 3Q 2010 Results ® Backlog ® Discussion of Financial Results ®> Non-GAAP Reconciliations ® Questions & Answers
Slide 4: Summary of 3Q Results
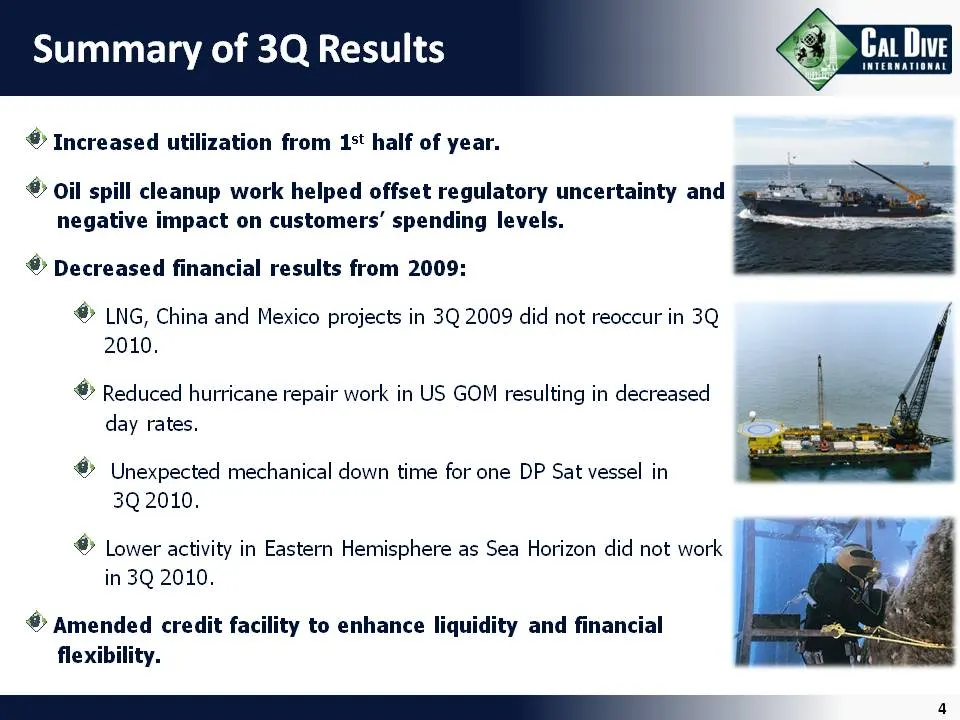
Summary of 3Q Results ® Increased utilization from 1°t half of year. © Oil spill cleanup work helped offset regulatory uncertainty and 4 negative impact on customers’ spending levels. ® Decreased financial results from 2009: ® LNG, China and Mexico projects in 3Q 2009 did not reoccur in 3Q 2010. ® R
Slide 5: Backlog
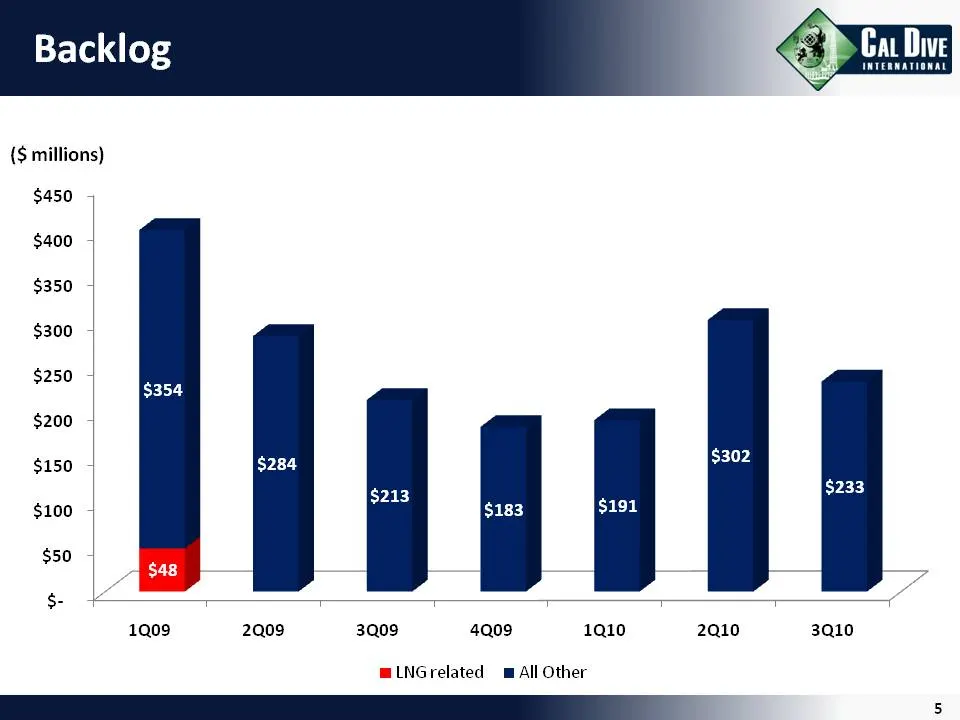
Cat Dive INTERNATIONAL Backlog {$ millions) $450 $400 $350 $300 $250 $200 $150 $100 $50 4 s- + 1Q09 2Q09 3Q09 4Q09 1Q10 2Q10 3Q10 LNGrelated m All Other BO eee 5
Slide 6: Financial Results
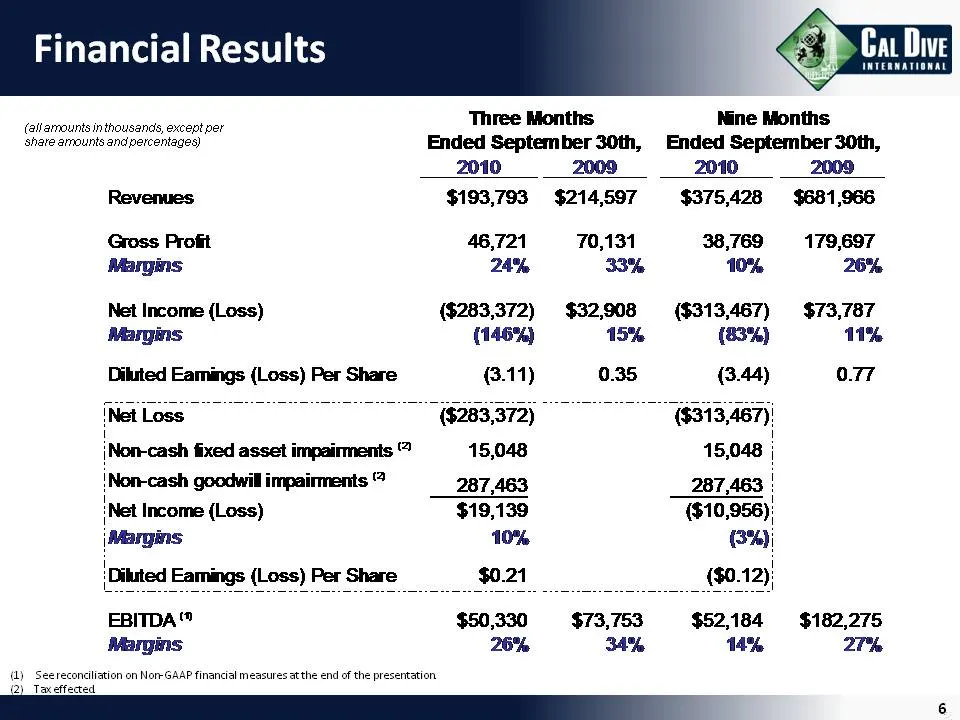
Financial Results {allamounts in thousands, except per Three Months Nine Months share amounts and percentages) Ended September 30th, Ended September 30th, 2010 2009 2010 2009 Revenues $193,793 $214,597 $375,428 $681,966 Gross Profit 46,721 70,131 38,769 179,697 Margins 24% 33% 10% 26% Net Income (Lo
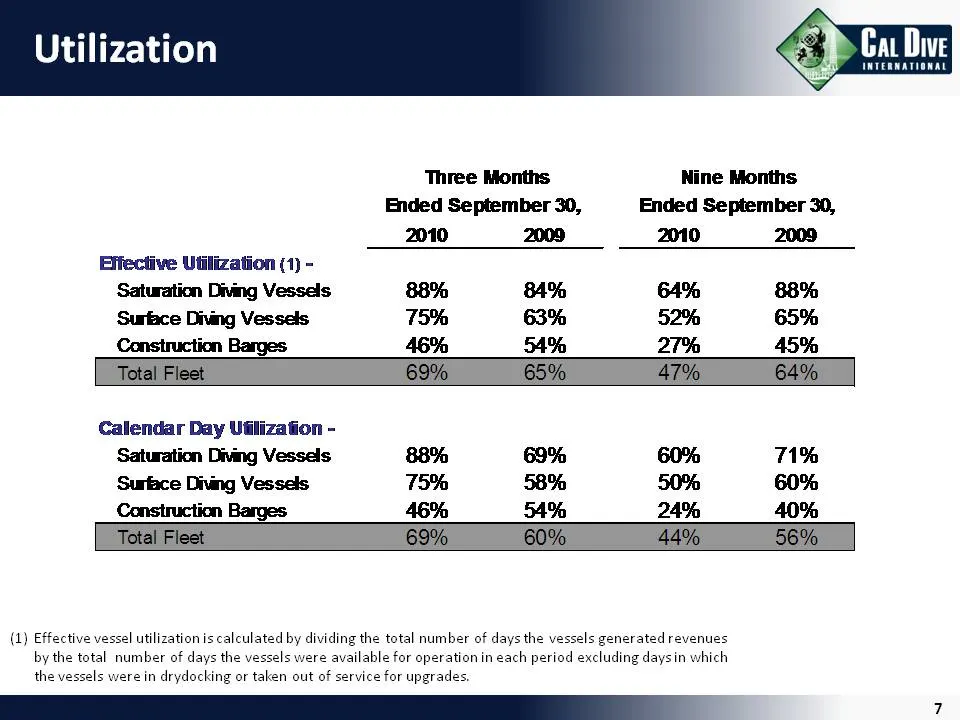
Slide 7: Vessel Utilization
Cat Dive INTERNATIONAL Three Months Nine Months Ended September 30, Ended September 30, 2010 2009 2010 2009 Effective Utilization (1) - ‘Saturation Diving Vessels 88% 34% 64% 88% ‘Surface Dining Vessels 75% 63% 52% 65% Construction Barges 46% 54% 27% 45% [Tisai Fist 69% 65% 47% 4%] Calendar Day Util
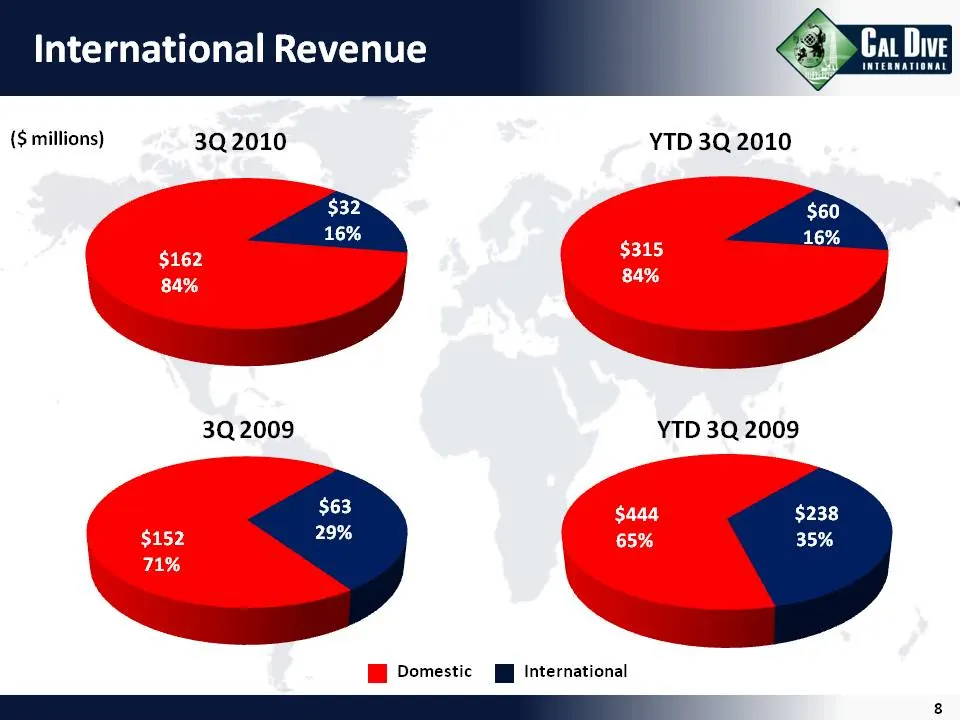
Slide 8: International Revenue
International Revenue = > Ca Due {$ millions) 3Q2010 YTD 3Q 2010 $60 16% 3Q2009 YTD 3Q 2009 Domestic jj International
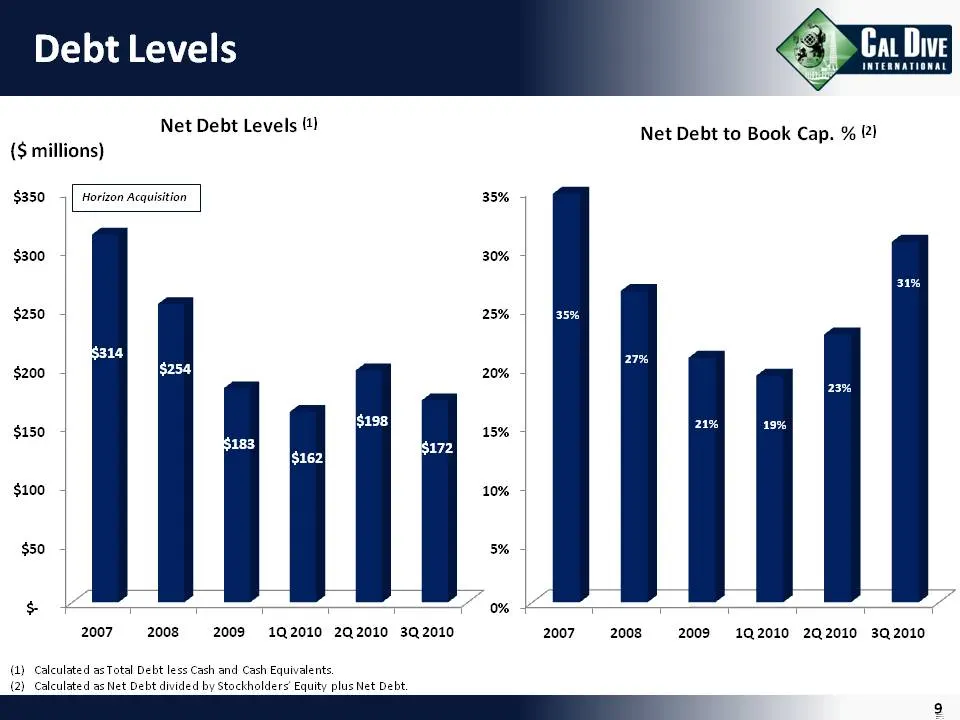
Slide 9: Debt Levels
Cat Dive INTERNATIONAL Debt Levels Net Debt Levels () Net Debt to Book Cap. % (2) ({$ millions) $350 | Horizon Acquisition 35% $300 30% $250 25% - $200 $254) 20% - 198 $150 iF 15% i 172 $100 10% + $50 5% So - ¥ : “0% + , — 2007 2008 «© -2009-«1Q2010 2Q2010 3Q2010 2007 2008 «2009: 1Q2010 202010 32010
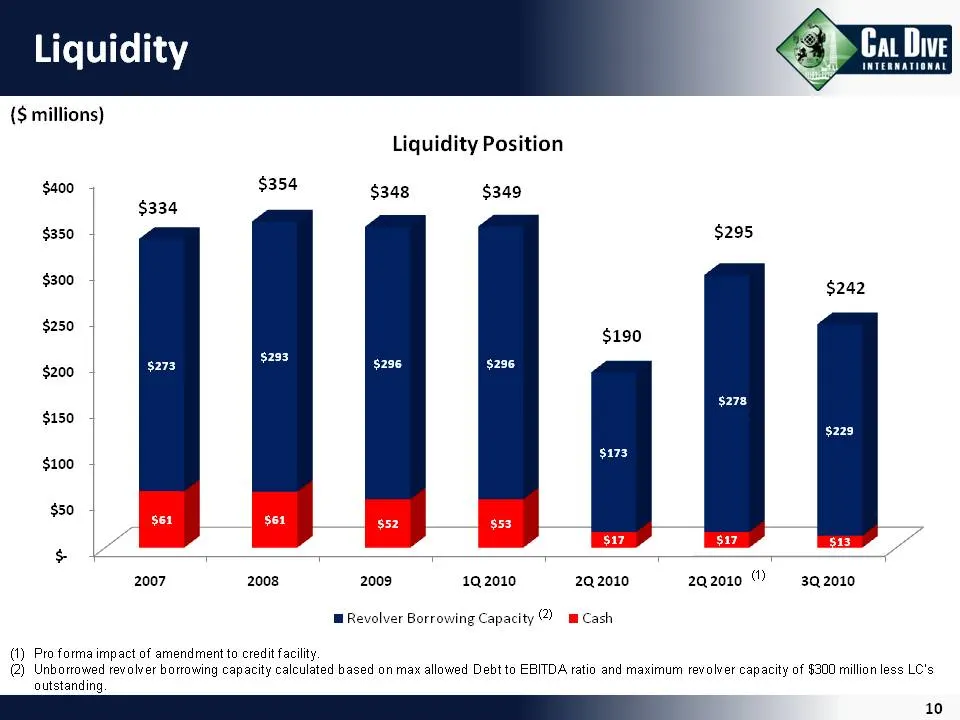
Slide 10: Liquidity
Cat Dive INTERNATIONAL Liquidity {$ millions) Liquidity Position $400 $354 $348 $349 $334 $350 $295 $300 $242 230 $190 $200 $150 $100 $50 / d 4 4 4 y s17 od ? $ : Hs ss — 2007 2008 2009 1Q2010 202010 2q2010 — 3q.2010 W Revolver Borrowing Capacity 2) m Cash (1) Proforma impact of amendment to credit
Slide 11: Non-GAAP Reconciliations
— i al ~y Non-GAAP Reconciliations INTERNATIONAL
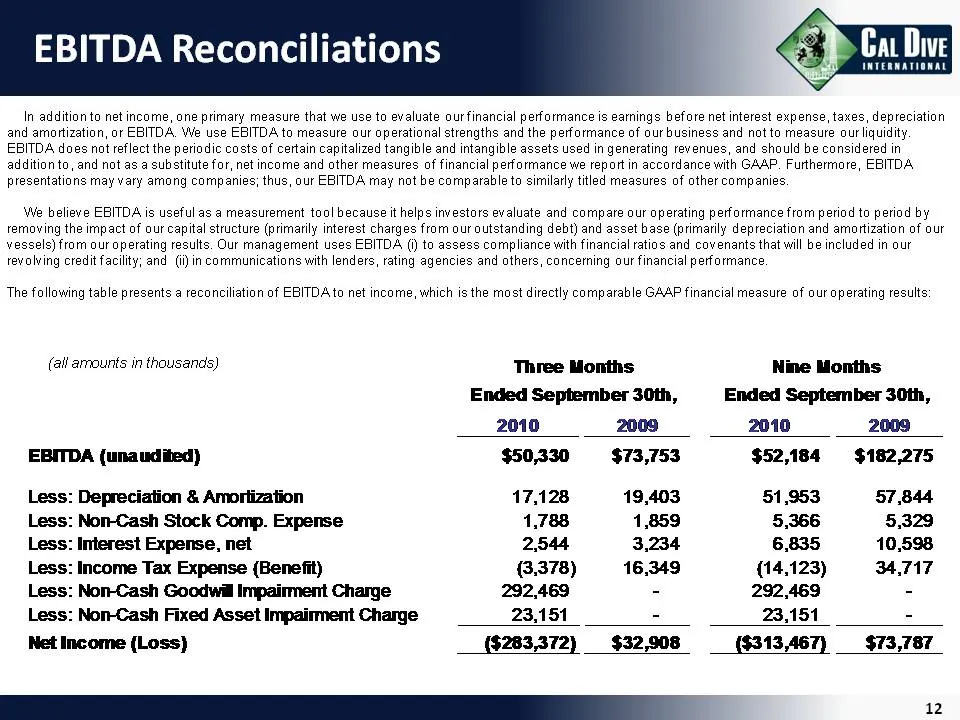
Slide 12: EBITDA Reconciliations
Cat Dive INTERNATIONAL EBITDA Reconciliations In addition to net income, one primary measure that we use to evaluate ourfinancial performance is eamings before net interest expense, taxes, depreciation and amortization, or EBITDA, We use EBITDA ta measure our operational strengths and the performanc
Source: SEC EDGAR · 8-K filed Oct 28, 2010
More decks from Cal Dive International Inc
 Q3 2014 Earnings Presentation12 slides · Nov 6, 2014
 Q2 2014 Earnings Presentation12 slides · Aug 11, 2014
 Q1 2014 Earnings Presentation12 slides · May 9, 2014
 Q4 2013 Earnings Presentation11 slides · Mar 5, 2014
 Q3 2013 Earnings Presentation11 slides · Nov 7, 2013
 Q2 2013 Earnings Presentation11 slides · Aug 8, 2013