Emclaire Financial — Shareholder Meeting (April 2016)
47 slides from Emclaire Financial's shareholder meeting presentation, Apr 27, 2016
Slide 1: 2016 Annual Meeting of Shareholders
2016 ANNUAL MEETING OF SHAREHOLDERS Farmers LJ! National EMCLAIRE FINANCIAL CORP Bank PARENT COMPANY OF: THE FARMERS NATIONAL BANK OF EMLENTON
Slide 2: Agenda & Contents
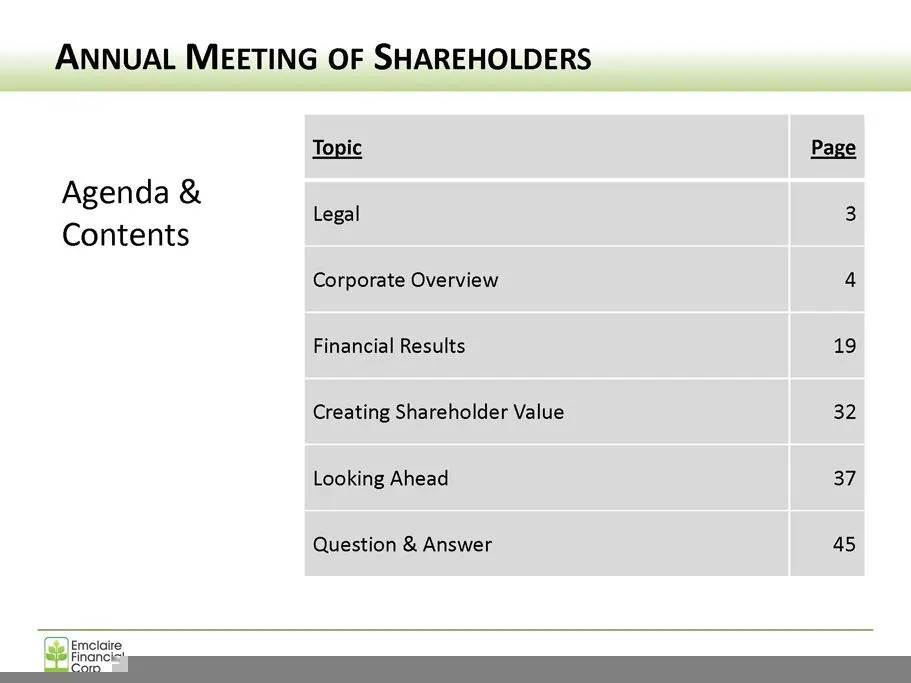
ANNUAL MEETING OF SHAREHOLDERS Topic Page Agenda & Legal 3 Contents Corporate Overview 4 Financial Results 19 Creating Shareholder Value 32 Looking Ahead ey Question & Answer 45 Emelaire, Financict
Slide 3: Legal
LEGAL This presentation contains certain forward-looking statements and information relating to the Company that are based on the beliefs of management as well as assumptions made by and information currently available to management. These forward-looking statements relate to, among other things, ex
Slide 4: Corporate Overview: 2015 Snapshot
CORPORATE OVERVIEW 2015 Snapshot Balance Sheet Growth Economy & ry Strategic Expansion Wimeiaire
Slide 5: Corporate Overview: Mission
CORPORATE OVERVIEW MISSION Mission Statement... Delivery quality financial products & services Remain a strong, independent community bank Offer personal attention through highly- motivated, well-trained employees Realize profitable growth Expand our franchise to satisfy customers Make a positive im
Slide 6: Corporate Overview: Vision
CORPORATE OVERVIEW VISION Vision Statement... ¢ Five year outlook * Reach total assets of $750 million to $1 billion * Achieve ROAA of 0.70% or better and ROACE of 8.00% or better * Continue sensible expansion of our branch network * Maintain a traditional capital structure * Leverage our capital, f
Slide 7: Corporate Overview: 2015 Snapshot
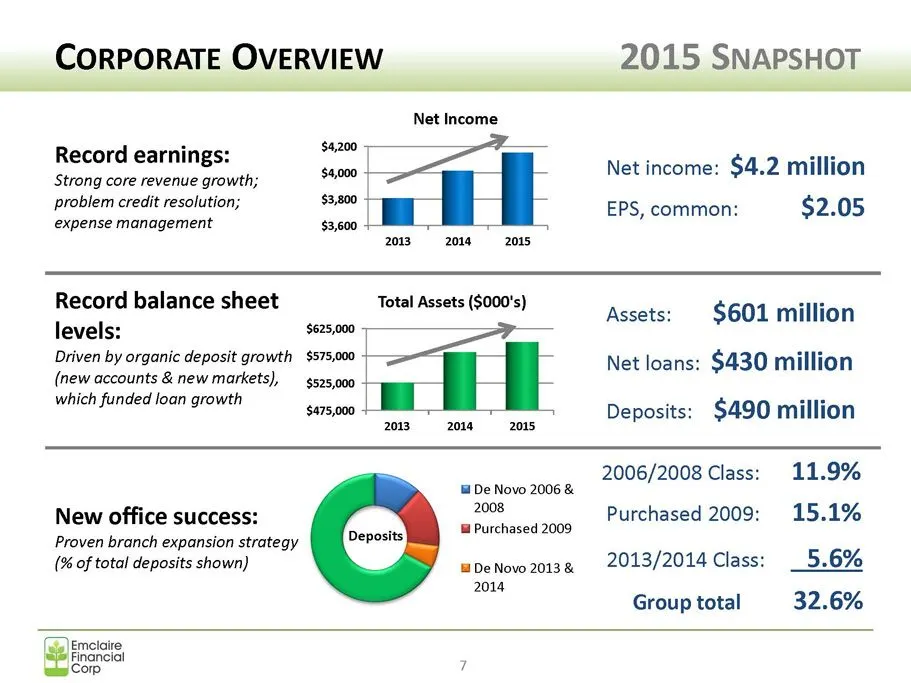
CORPORATE OVERVIEW 2015 SNAPSHOT Net Income Record earnings: $4200 - as Segoe aie $4,000 Net income: $4.2 million problem credit resolution; $3,800 EPS, common: $2.05 expense management $3,600 7 , ° 201320142015 re in Total Assets ($000': TH Record balance sheet fotal Assets ($000's) Assets: $601 mi
Slide 8: Corporate Overview: 2015 Snapshot
CORPORATE OVERVIEW 2015 SNAPSHOT * Record earnings * Strong loan growth * Strong asset quality * Strong capital position — Increase in common equity (Offering) — Decrease in preferred equity (SBLF Redemption) * Strategic expansion (transformative) — United-American Savings Bank merger announced — As
Slide 9: Corporate Overview: Balance Sheet Growth
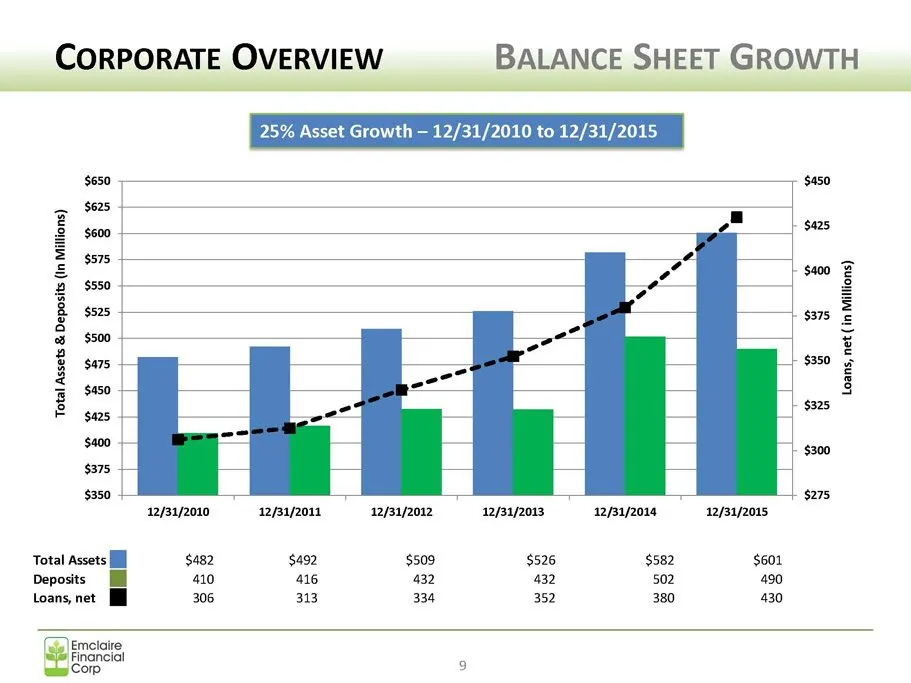
CORPORATE OVERVIEW BALANCE SHEET GROWTH 25% Asset Growth — 12/31/2010 to 12/31/2015 Loans, net (in Millions) Total Assets & Deposits (In Millions) 32/31/2010 32/31/2011 12/31/2012 12/31/2013 12/31/2014 32/31/2015 Total Assets [ill $482 $492 $509 $526 $582 $601 Deposits [i 410 416 432 432 502 490 loa
Slide 10: Corporate Overview: Economy
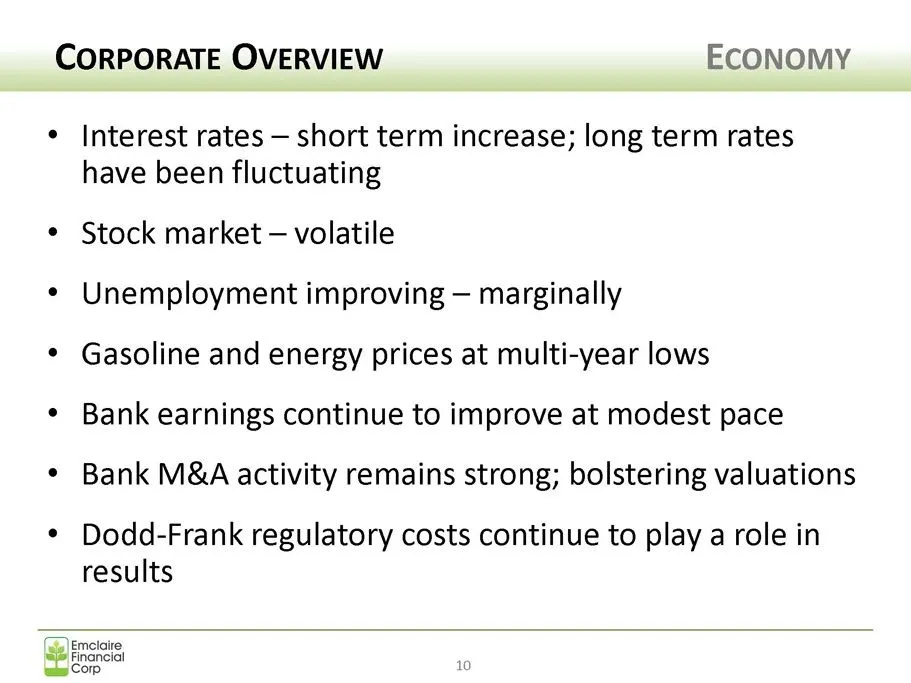
CORPORATE OVERVIEW ECONOMY * Interest rates — short term increase; long term rates have been fluctuating * Stock market — volatile * Unemployment improving — marginally * Gasoline and energy prices at multi-year lows * Bank earnings continue to improve at modest pace * Bank M&A activity remains stro
Slide 11: Corporate Overview: Industry
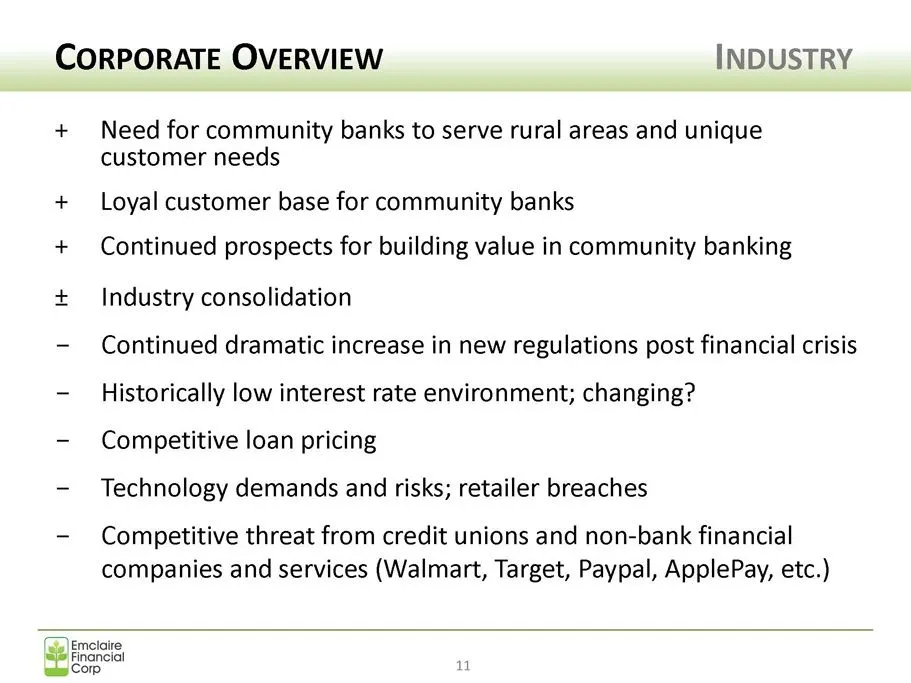
CORPORATE OVERVIEW INDUSTRY Need for community banks to serve rural areas and unique customer needs Loyal customer base for community banks Continued prospects for building value in community banking Industry consolidation Continued dramatic increase in new regulations post financial crisis Historic
Slide 12: Corporate Overview: Industry Consolidation
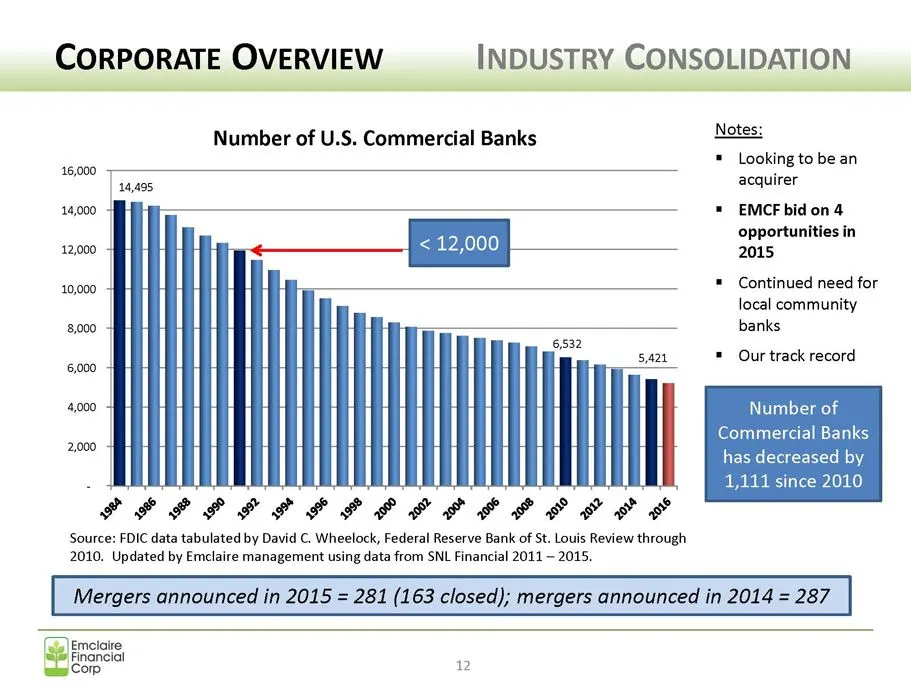
CORPORATE OVERVIEW INDUSTRY CONSOLIDATION Notes: Number of U.S. Commercial Banks = Looking to be an acquirer = EMCF bid on 4 opportunities in 2015, * Continued need for local community banks = Our track record Number of Commercial Banks has decreased by 1,111 since 2010 Source: FDIC data tabulated b
Slide 13: Corporate Overview: Industry Consolidation
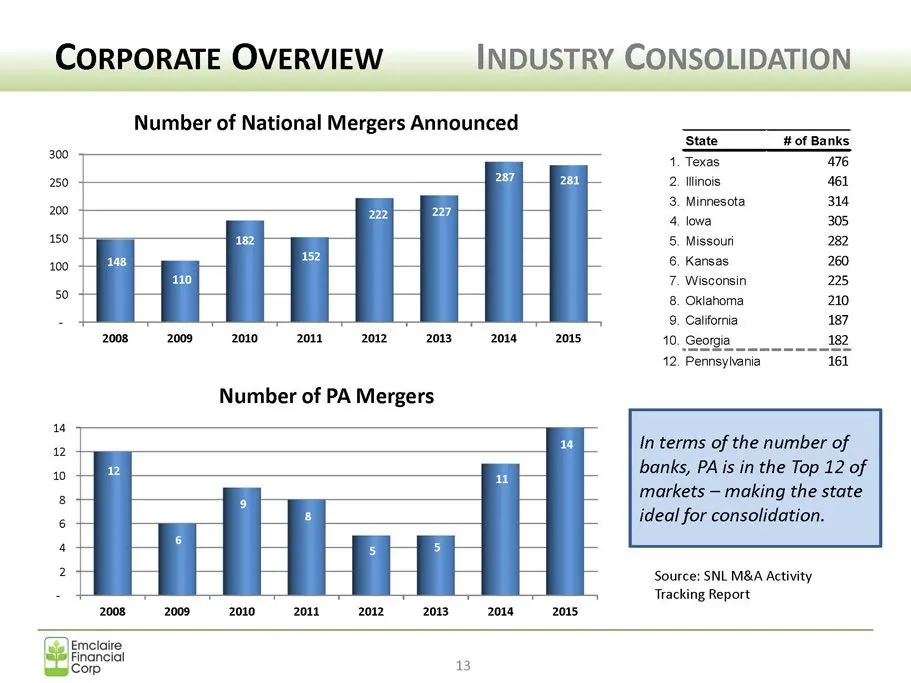
CORPORATE OVERVIEW INDUSTRY CONSOLIDATION Number of National Mergers Announced State # of Banks 4. Texas 476 2. Ilinois 461 3. Minnesota 314 4, lowa 305 5. Missouri 282 6. Kansas 260 7. Wisconsin 225 8. Oklahoma 210 9. California 187 2008 = 2009«S 2010S 2011S 2012201320120 10. Georgia 182 12. Pennsy
Slide 14: Corporate Overview: UASB Merger
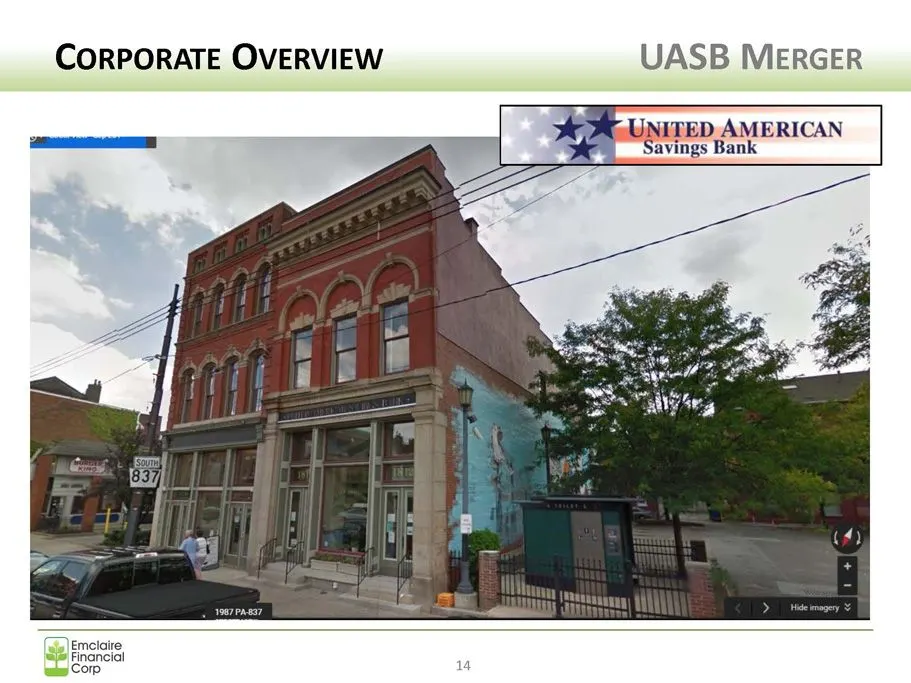
CORPORATE OVERVIEW UASB MERGER \ »AMERICAN Savings Bank a = =e Emelaire Financial Corp 14
Slide 15: United-American branch — Southside (Pittsburgh, PA)
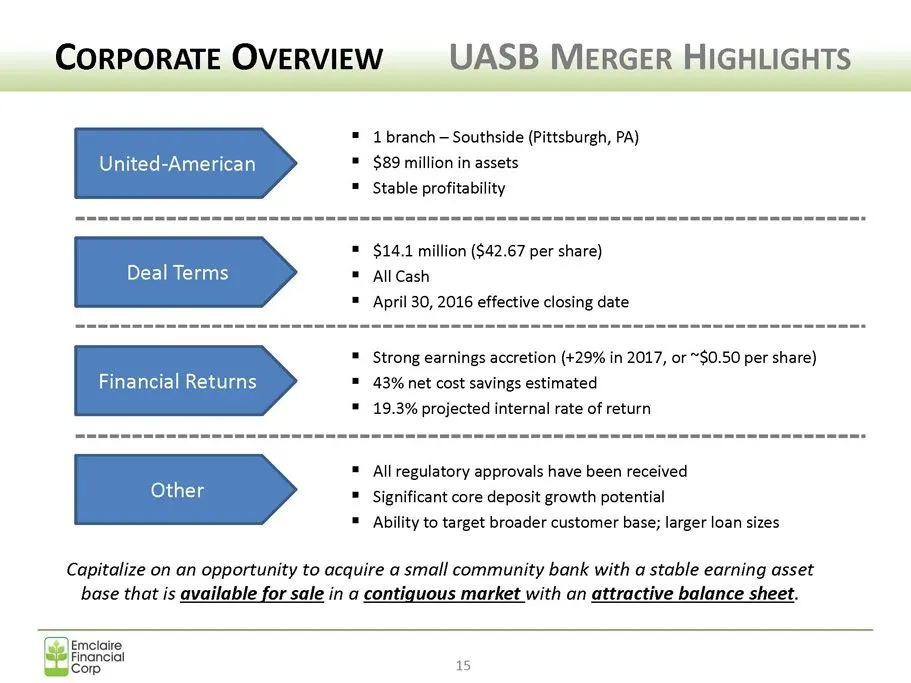
United-American 1 branch — Southside (Pittsburgh, PA) $89 million in assets Stable profitability Deal Terms $14.1 million ($42.67 per share) All Cash April 30, 2016 effective closing date Financial Returns Strong earnings accretion (+29% in 2017, or ~$0.50 per share) 43% net cost savings estimated 1
Slide 16: Pro Forma Balance Sheet Data
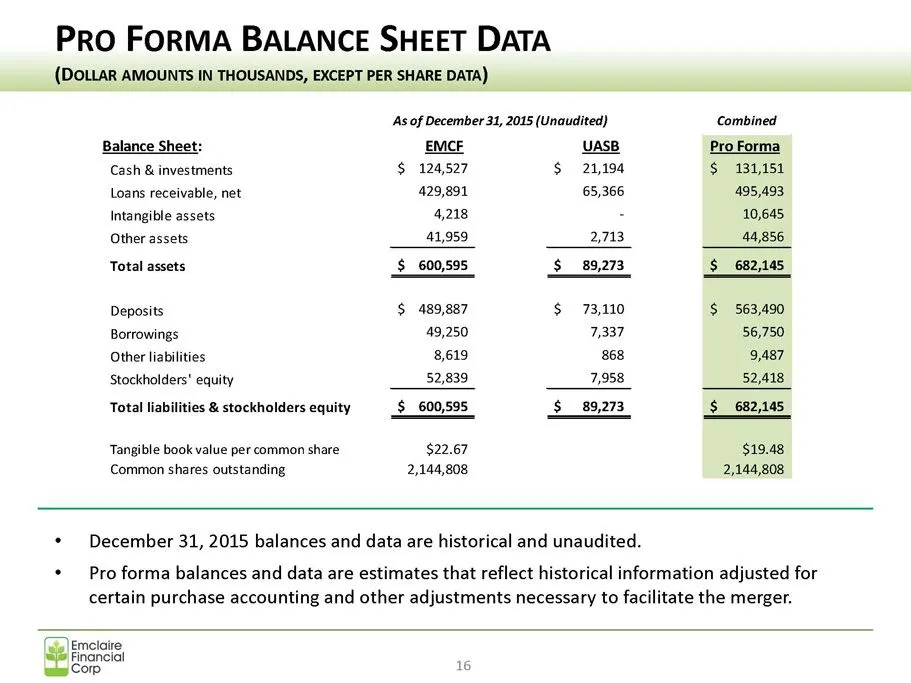
PRO FORMA BALANCE SHEET DATA (DOLLAR AMOUNTS IN THOUSANDS, EXCEPT PER SHARE DATA) As of December 31, 2015 (Unaudited) Combined Balance Sheet: EMCE UASB Pro Forma Cash & investments $ 124,527 $21,194 $ 131,151 Loans receivable, net 429,891 65,366 495,493 Intangible assets 4,218 - 10,645, Other assets
Slide 17: Pro Forma Income Statement Data
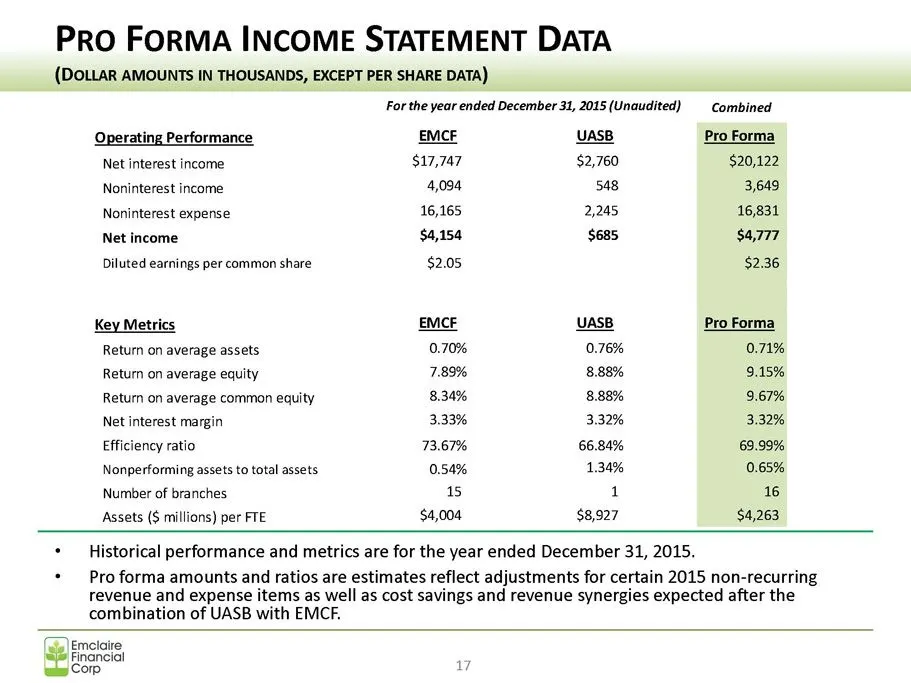
PRO FORMA INCOME STATEMENT DATA (DOLLAR AMOUNTS IN THOUSANDS, EXCEPT PER SHARE DATA) For the year ended December 31, 2015 (Unaudited) Combined Operating Performance EMCE UASB Pro Forma Net interest income $17,747 $2,760 $20,122 Noninterest income 4,094 548 3,649 Noninterest expense 16,165 2,245 16,8
Slide 18: Corporate Overview: Aspinwall Branch
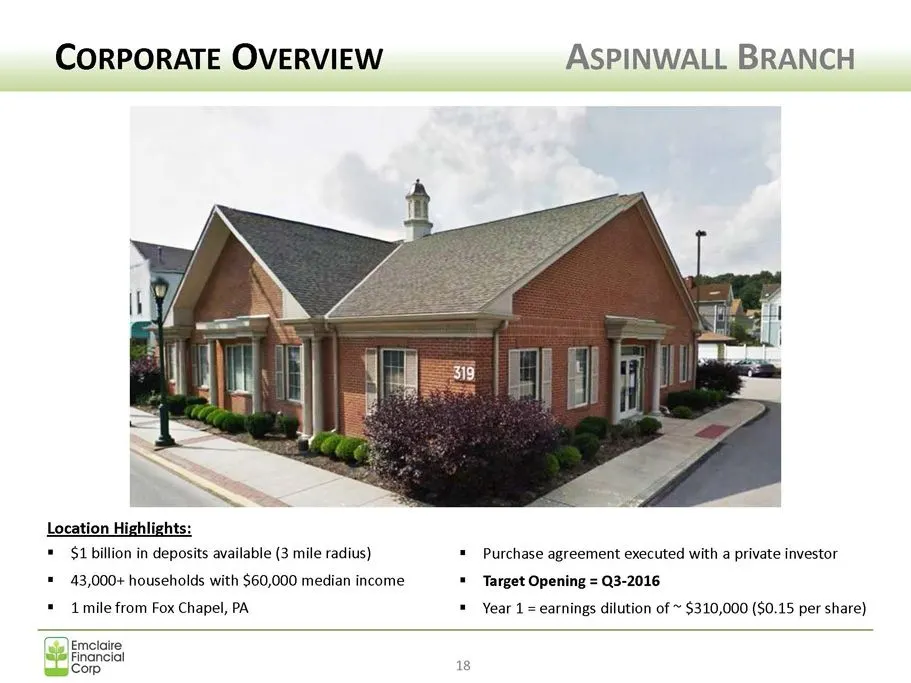
CORPORATE OVERVIEW ASPINWALL BRANCH Location Highlights: * $1 billion in deposits available (3 mile radius) * Purchase agreement executed with a private investor = 43,000+ households with $60,000 median income "Target Opening = Q3-2016 * 1 mile from Fox Chapel, PA = Year 1 = earnings dilution of ~ $
Slide 19: Financial Results
FINANCIAL RESULTS 2) Emetaire Financ
Slide 20: Consolidated Financial Highlights
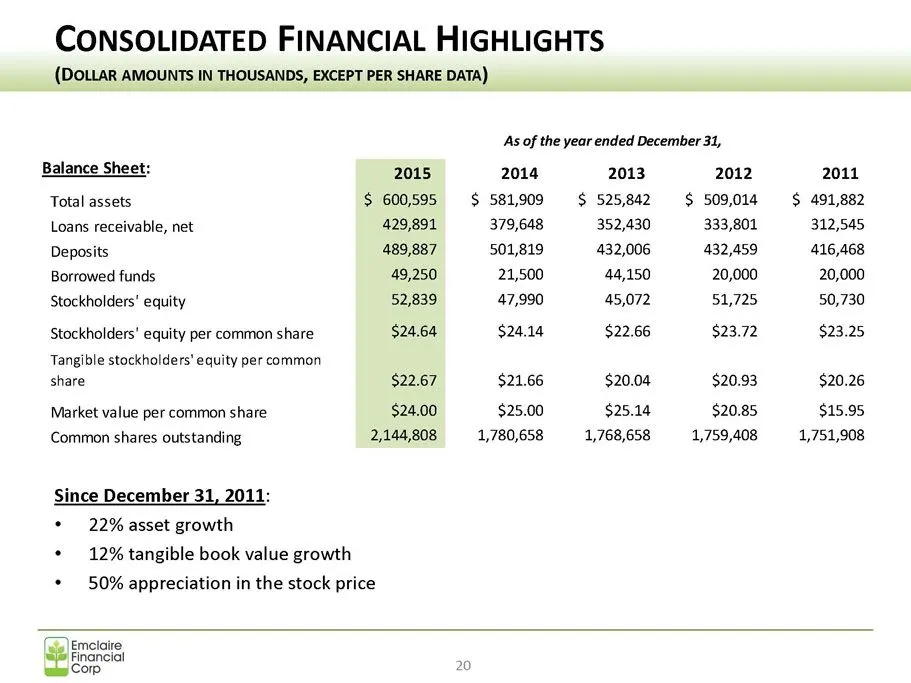
CONSOLIDATED FINANCIAL HIGHLIGHTS (DOLLAR AMOUNTS IN THOUSANDS, EXCEPT PER SHARE DATA) Balance Sheet: Total assets Loans receivable, net Deposits Borrowed funds Stockholders’ equity Stockholders’ equity per common share Tangible stockholders’ equity per common share Market value per common share Com
Slide 21: Consolidated Financial Highlights
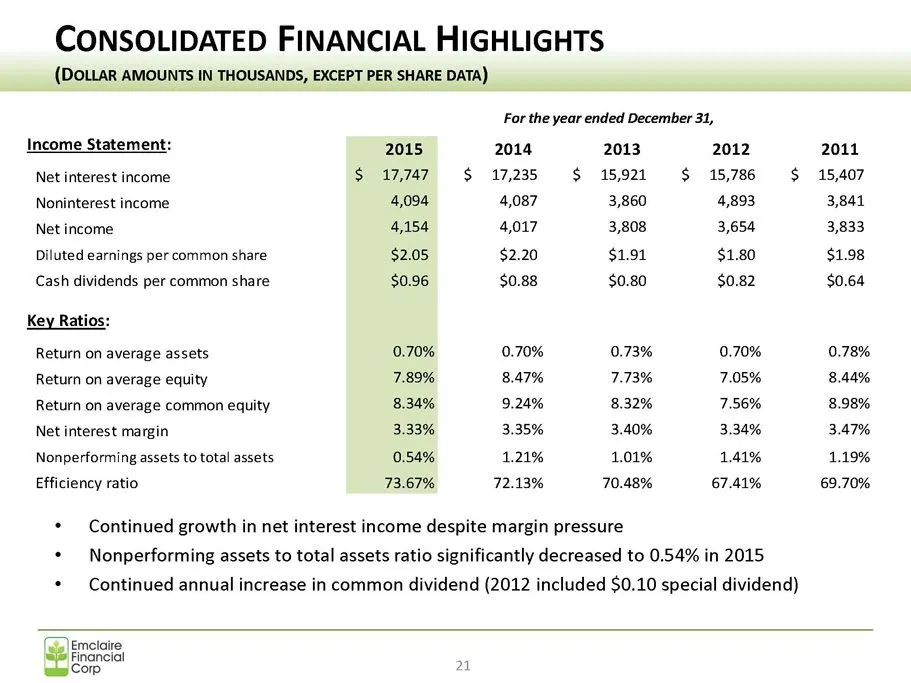
CONSOLIDATED FINANCIAL HIGHLIGHTS (DOLLAR AMOUNTS IN THOUSANDS, EXCEPT PER SHARE DATA) Income Statement: Net interest income Noninterest income Net income Diluted earnings per common share Cash dividends per common share Key Rati Return on average assets Return on average equity Return on average co
Slide 22: Earnings 2015 Compared to 2014
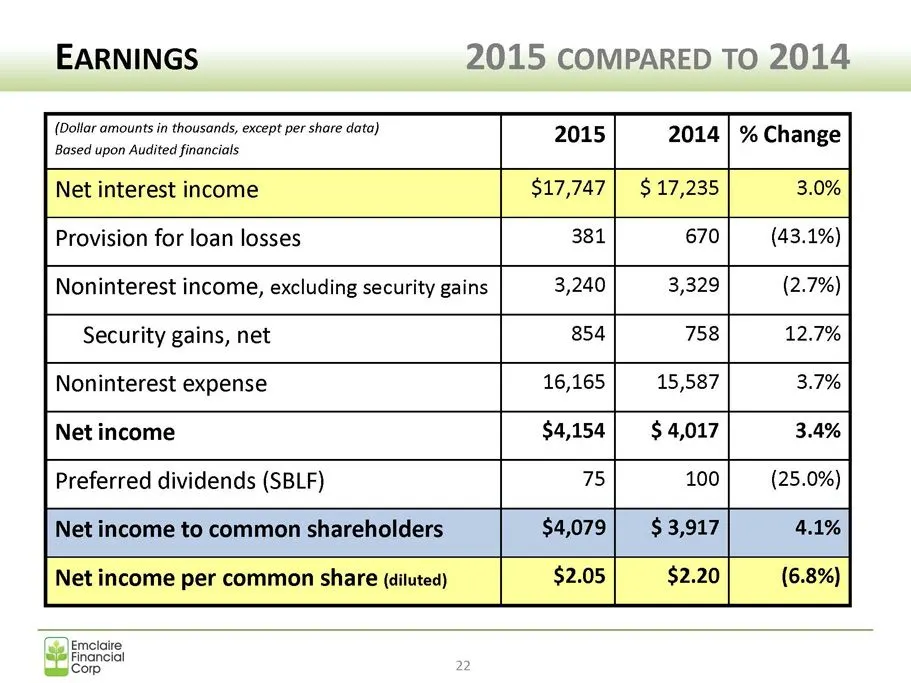
EARNINGS 2015 COMPARED TO 2014 na 2015] 2014] % Change Provision for loan losses | 381 670| (43.1%) Noninterest income, excluding security gains 3,240 3,329 (2.7%) Security gains, net 854 758 12.7% Noninterest expense 16,165 15,587 3.7% Net income $4,154] $4,017 3.4% Preferred dividends (SBLF) 1S 10
Slide 23: Earnings 2015 Compared to 2014
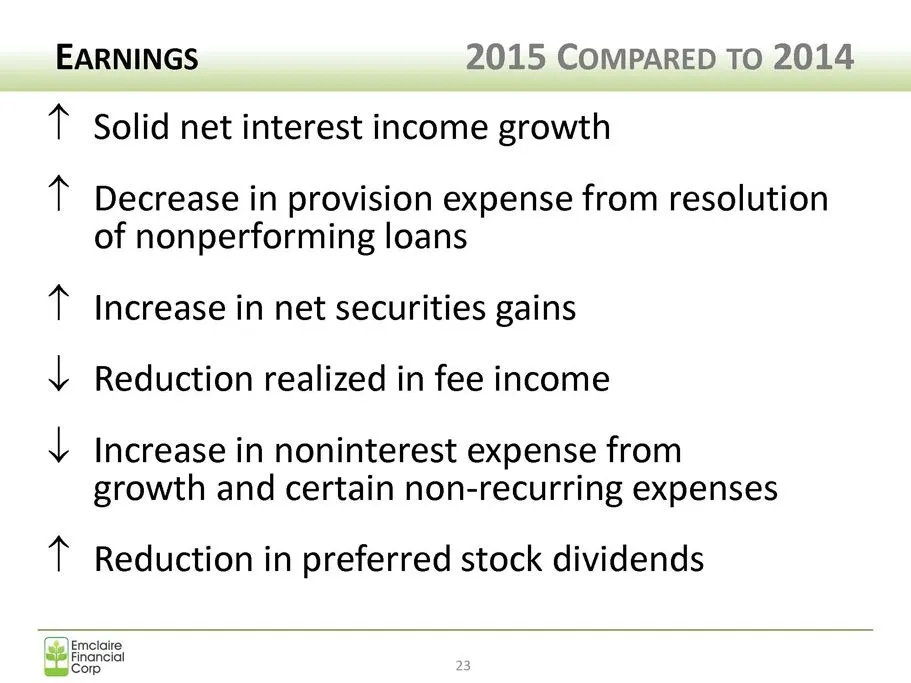
EARNINGS 2015 CompareED TO 2014 t Solid net interest income growth T Decrease in provision expense from resolution of nonperforming loans t Increase in net securities gains { Reduction realized in fee income 4 Increase in noninterest expense from growth and certain non-recurring expenses t Reduction
Slide 24: Earnings: Business Development — 2015
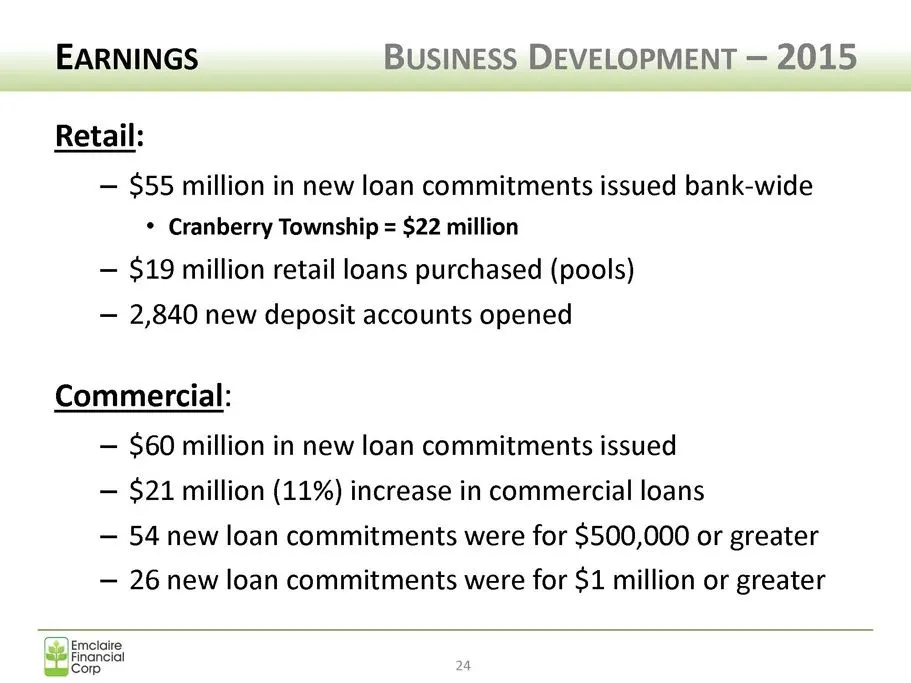
EARNINGS BUSINESS DEVELOPMENT — 2015 Retail: — $55 million in new loan commitments issued bank-wide * Cranberry Township = $22 million — $19 million retail loans purchased (pools) — 2,840 new deposit accounts opened Commercial: — $60 million in new loan commitments issued — §21 million (11%) increas
Slide 25: Asset Quality Overview
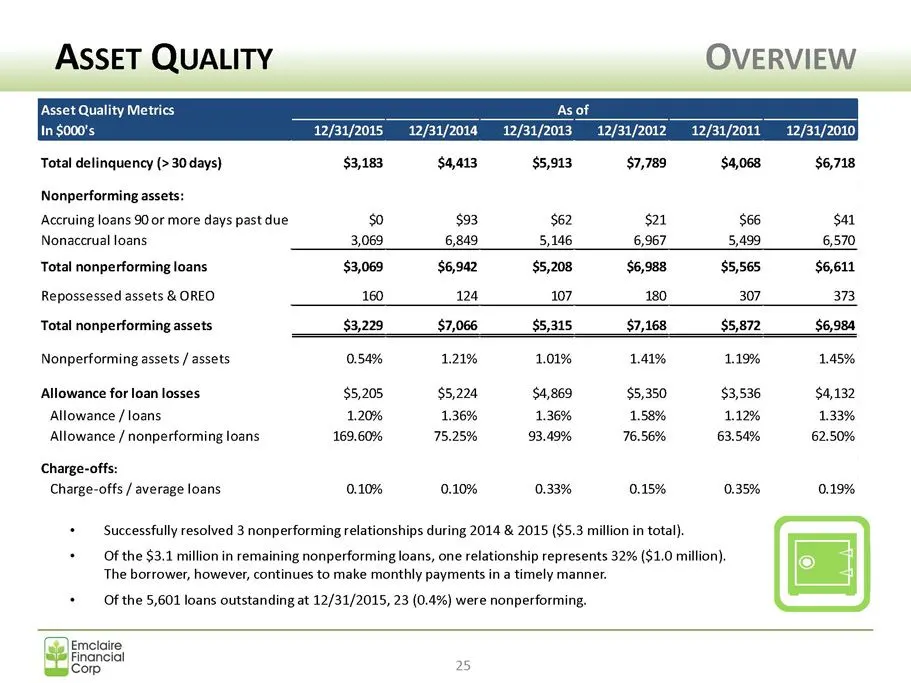
ASSET QUALITY OVERVIEW Asset Quality Metrics As of In $000" 12/31/2015 __12/31/2014__12/31/2013__12/31/2012_12/31/2011_12/31/2010| Total delinquency (> 30 days) $3,183 $4,413 $5,913 $7,789 $4,068 $6,718 Nonperforming assets: Accruing loans 90 or more days past due $0 $93 $62 $21 $66 san Nonaccrual l
Slide 26: Asset Quality: Nonperforming Assets
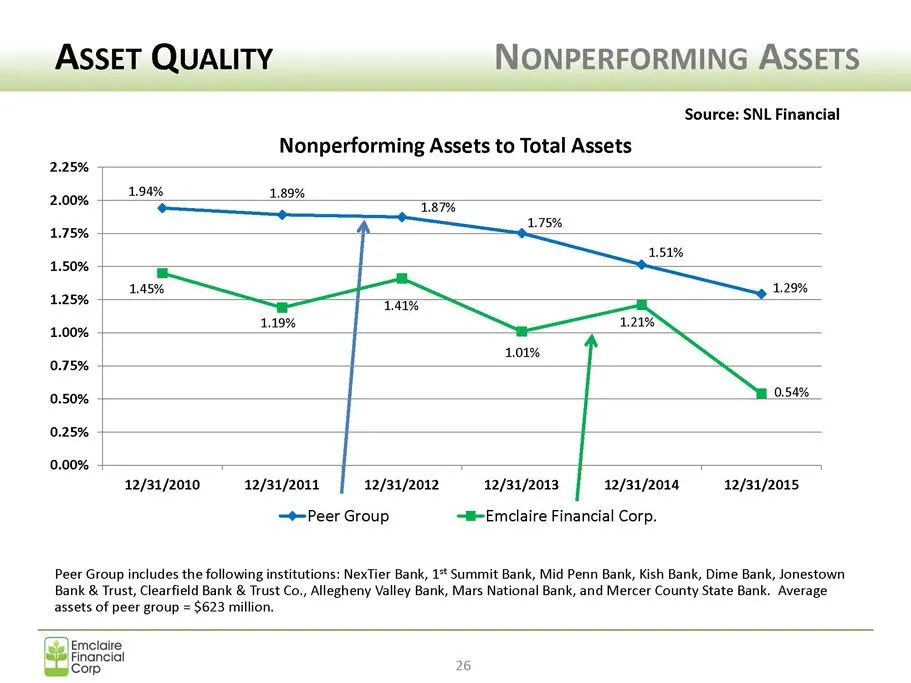
ASSET QUALITY NONPERFORMING ASSETS Source: SNL Financial Nonperforming Assets to Total Assets 2.25% 2.00% |__194% 1.89% tare 1.75% _ an 1.50% ASY 1.29% aasy% 4% Tae es 1.19% 1.21% ose | rom f 0.50% | a 0.54% 0.25% | | 0.00% 12/31/2010 12/31/2011 | 12/31/2012 12/31/2013 | 12/31/2014 12/31/2015 Peer G
Slide 27: Capital: Historic Levels
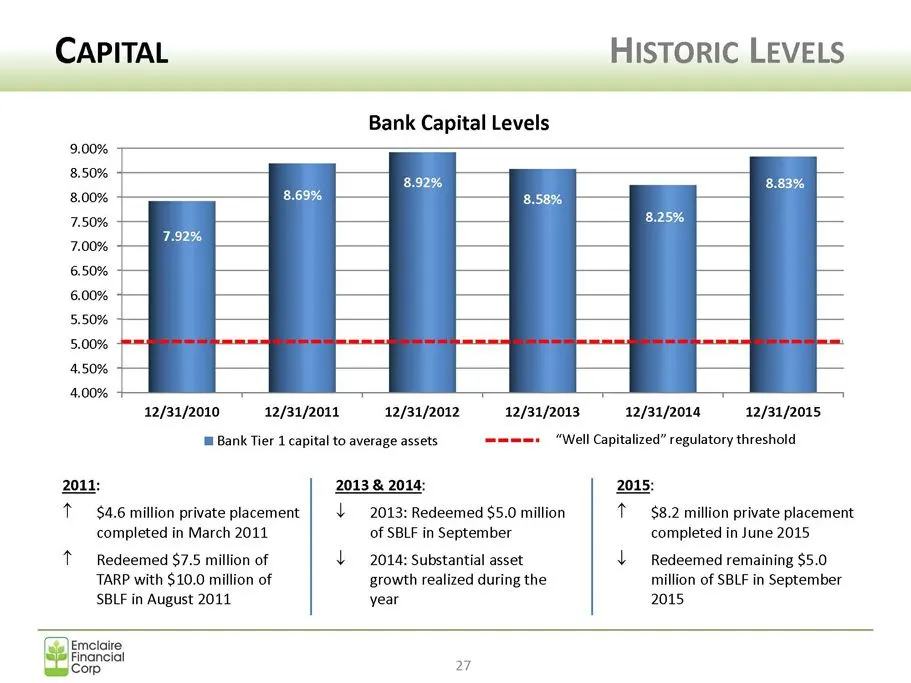
CAPITAL Historic LEVELS Bank Capital Levels Son ; 8.92% 8.83% 8.00% 8.69% 8.58% 7.50% 8.25% 7.00% 6.50% 6.00% 5.50% 5.00% 4.50% 4.00% 12/31/2010 12/31/2011 12/31/2012 12/31/2013 12/31/2014 12/31/2015 1m Bank Tier 1 capital to average assets ===: "Well Capitalized” regulatory threshold 2011: 2013 & 2
Slide 28: Q1-2016 Results: Balance Sheet
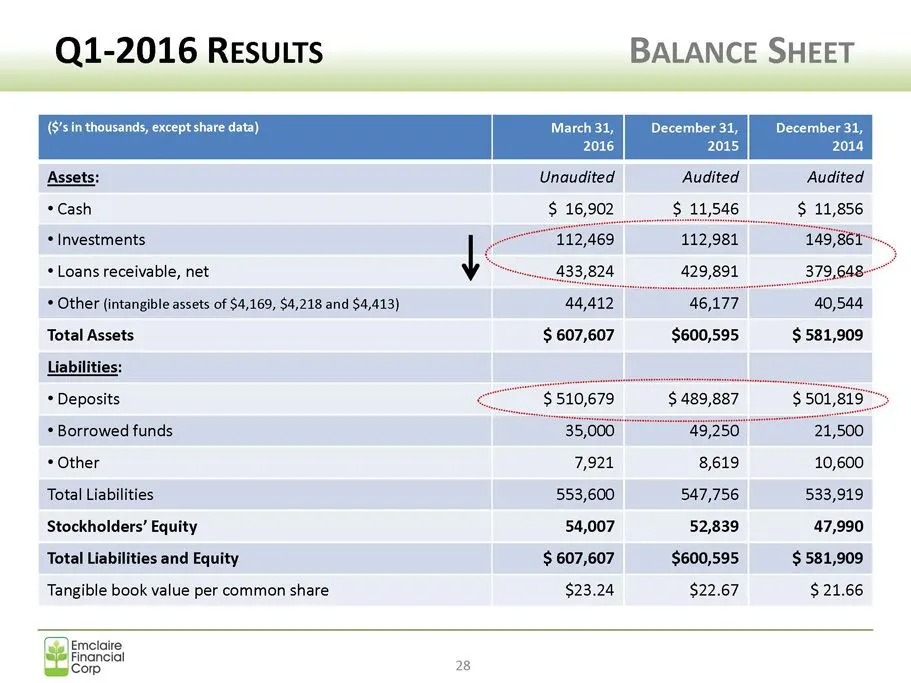
Q1-2016 RESULTS BALANCE SHEET ($'sin thousands, except share data) March 31, | December 31, December 31, 2016 2015 2014 Unaudited Audited Audited *Cash $ 16,902 $ 11,546 $ 11,856 "992,469 112,981 "145,861. 433,824 429,891 379,648" i * Investments * Loans receivable, net * Other (intangible assets of
Slide 29: Q1-2016 Results: Balance Sheet
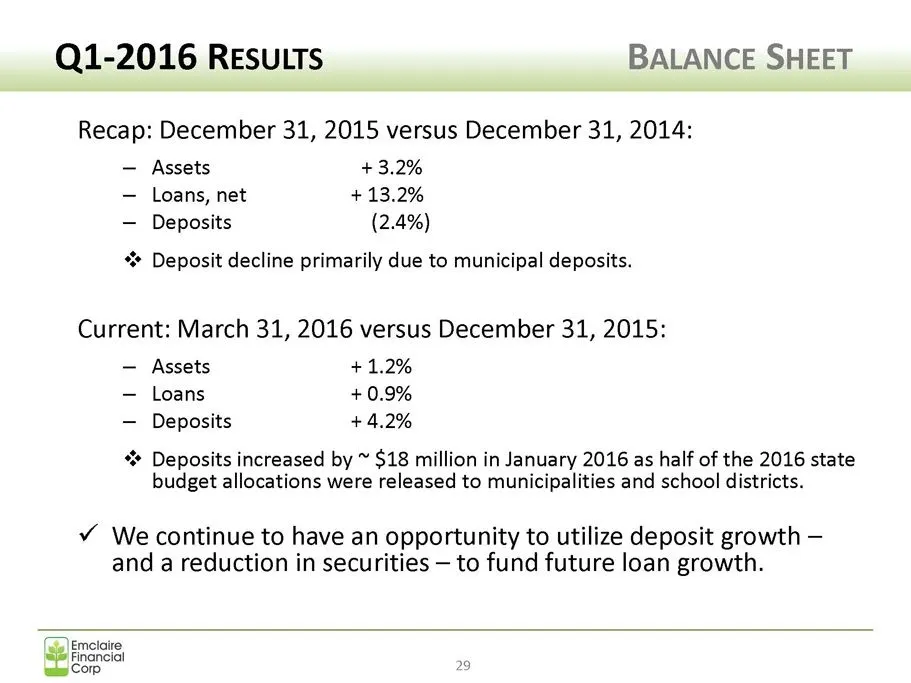
Q1-2016 RESULTS BALANCE SHEET Recap: December 31, 2015 versus December 31, 2014: — Assets + 3.2% — Loans, net + 13.2% — Deposits (2.4%) “* Deposit decline primarily due to municipal deposits. Current: March 31, 2016 versus December 31, 2015: — Assets +1.2% — Loans + 0.9% — Deposits +4.2% * Deposits
Slide 30: Earnings 1Q 2016 vs. 1Q 2015
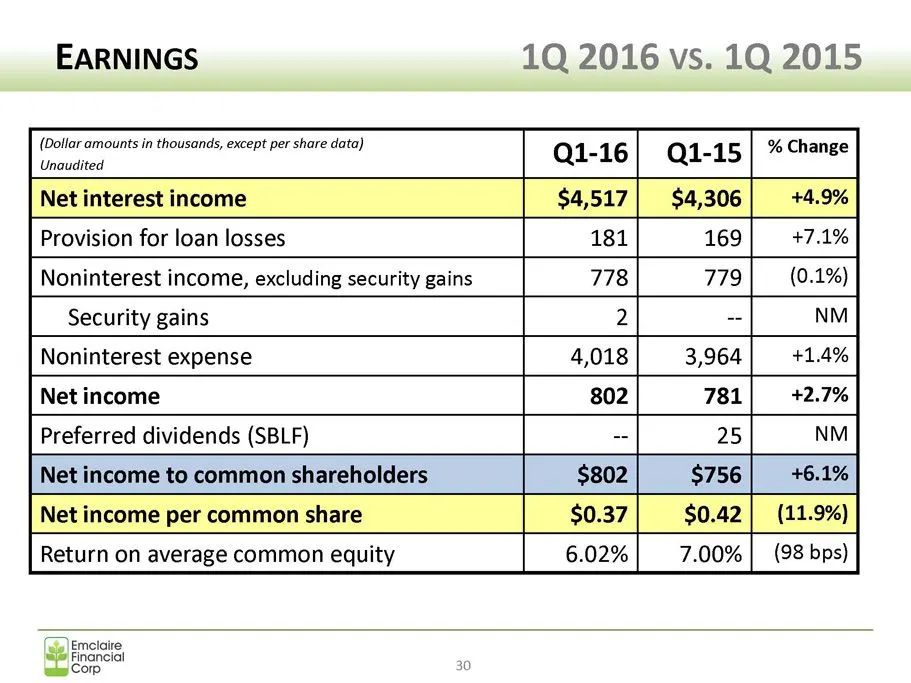
EARNINGS 1Q 2016 vs. 1Q 2015 (Dollar amounts in thousands, except per share data) Q1-16| Q1-15 % Change Provision for loan losses 181 169 +7.1% Noninterest income, excluding security gains 778 779 (0.1%) Security gains 2 - NM Noninterest expense 4,018 3,964 Net income 802 781 Preferred dividends (SB
Slide 31: Earnings 1Q 2016 vs. 1Q 2015
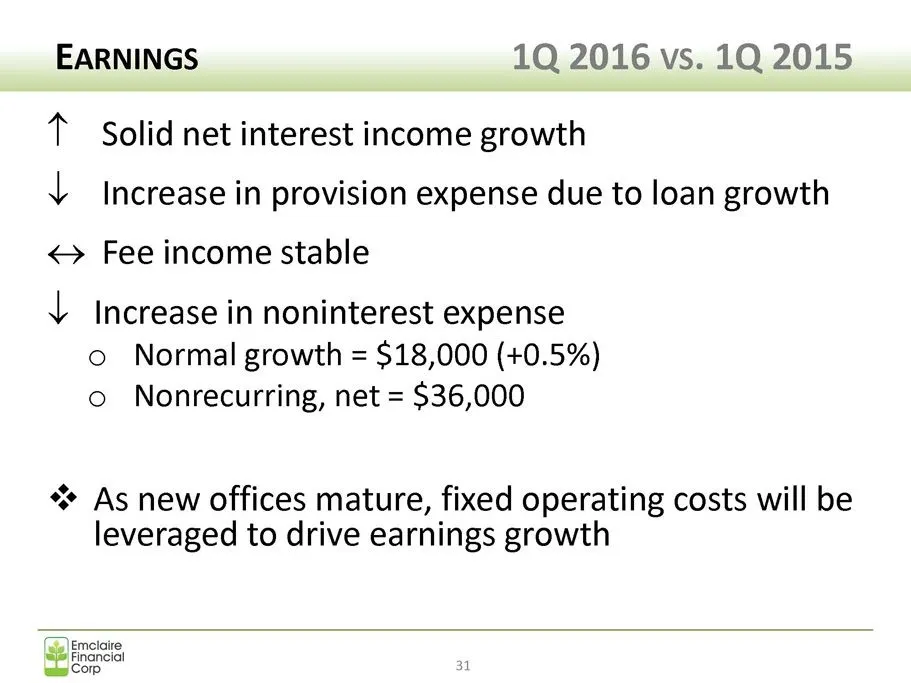
EARNINGS 1Q 2016 vs. 1Q 2015 t Solid net interest income growth {Increase in provision expense due to loan growth < Fee income stable \ Increase in noninterest expense o Normal growth = $18,000 (+0.5%) o Nonrecurring, net = $36,000 + As new offices mature, fixed operating costs will be leveraged to
Slide 32: Creating Shareholder Value
CREATING SHAREHOLDER VALUE ‘| Emclaire Fingy
Slide 33: Creating Shareholder Value: Value Proposition
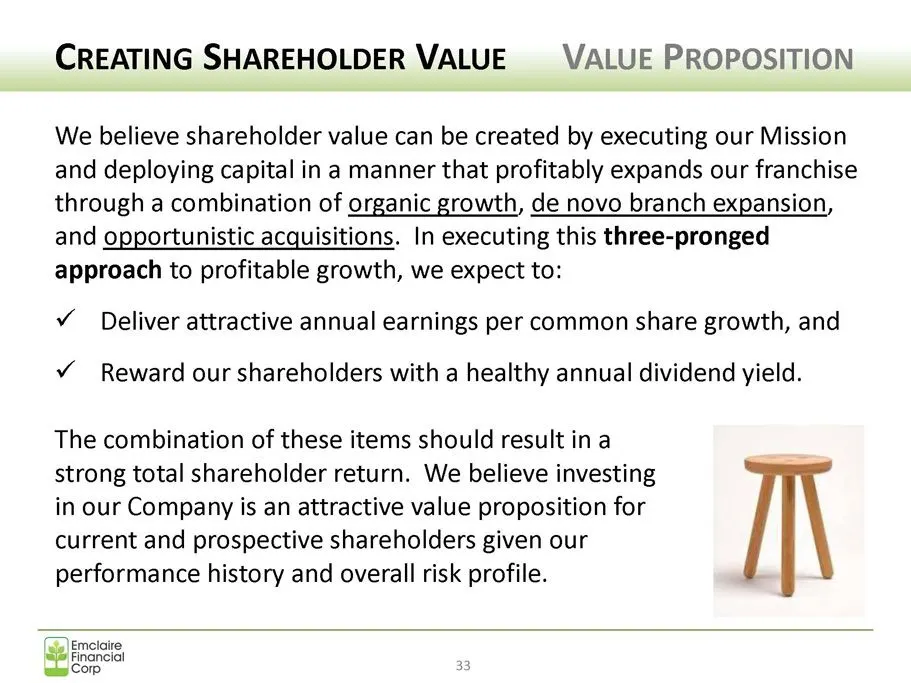
CREATING SHAREHOLDER VALUE VALUE PROPOSITION We believe shareholder value can be created by executing our Mission and deploying capital in a manner that profitably expands our franchise through a combination of organic growth, de novo branch expansion and opportunistic acquisitions. In executing thi
Slide 34: Stock Performance: Long Term
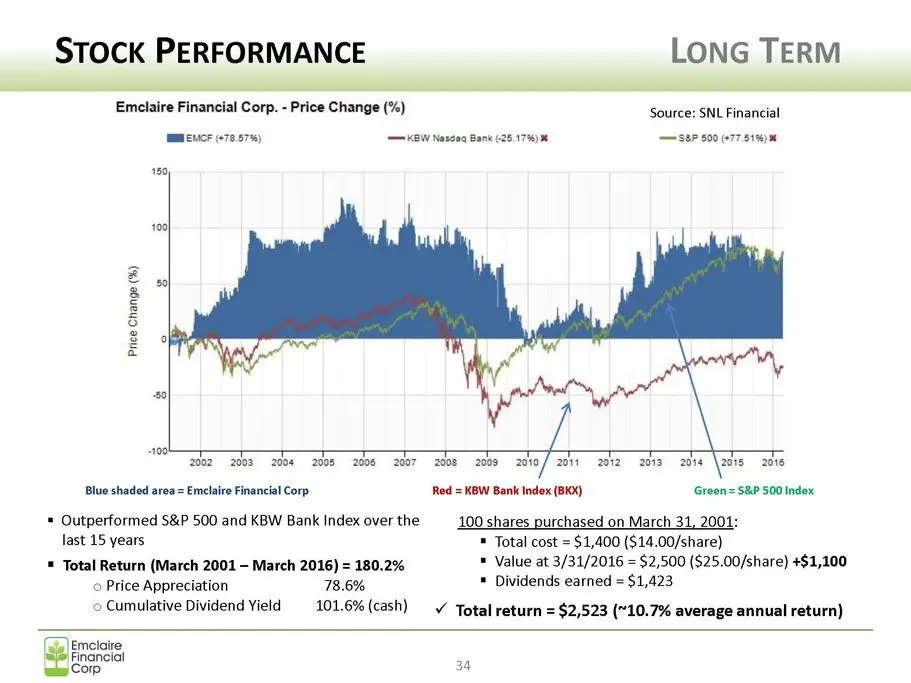
STOCK PERFORMANCE LONG TERM ——————————————————————— Emclaire Financial Corp. - Price Change (%) Source: SNL Financial MmMENCE (78.57%) KW Nasdng Bank (26.17%) 8 SEP 500 (677.514) 159) Price Change (%) | A 2002 2003 2004 2005 2008 «2007 | 2008-2008 2010/2011 201220132014 Fe 2016 Blue shaded area = Em
Slide 35: Stock Performance: Last Five Years
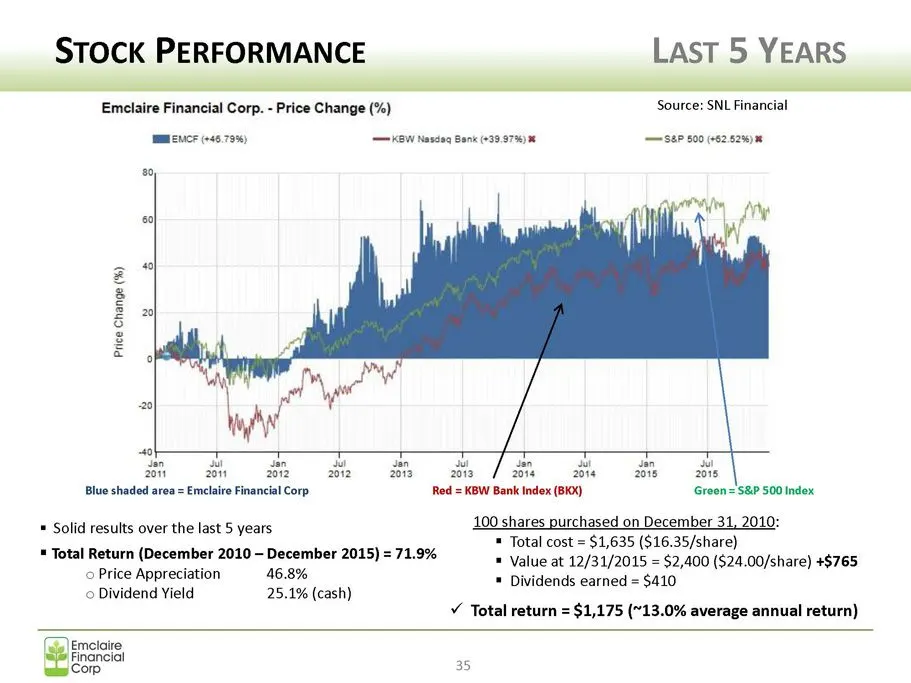
STOCK PERFORMANCE LAST 5 YEARS SSS Emelaire Financial Corp. - Price Change (%) Source: SNL ncial MMMENCE (+46.79%) KEW Nadng Bank or ser 500 (662.526) Price Change (%) ian a an Wu an nM / an My an Ju Bn ene Be ota / ake Bk Blue shaded area = Emclaire Financial Corp: Red = KBW Bank Index (BKX) Green
Slide 36: Dividend Recap
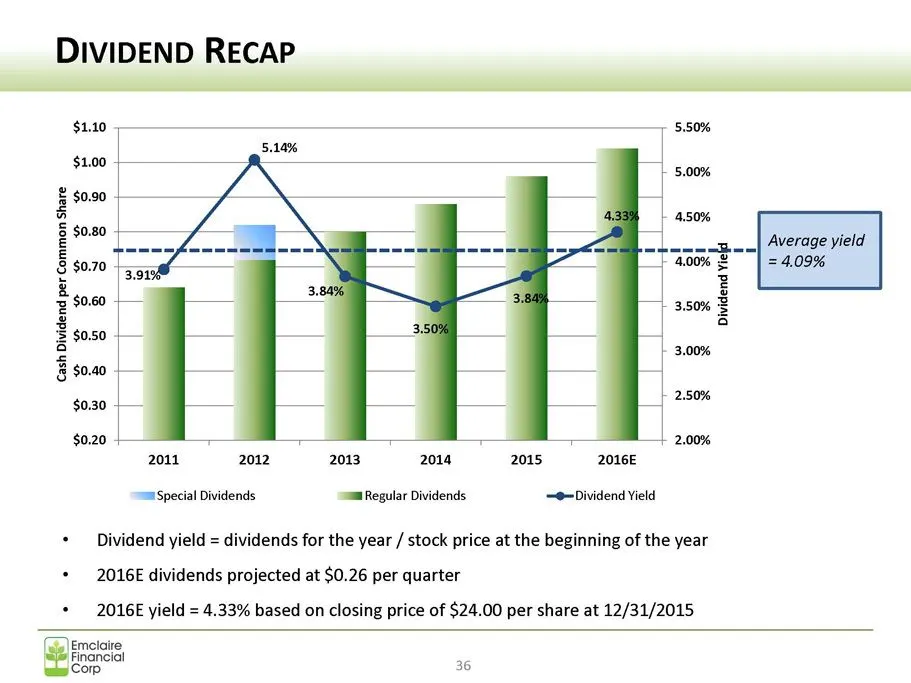
DIVIDEND RECAP $1.10 $1.00 8 $0.90 % S $0.80 — § $0.70 Ke 3 $0.50 a 3 8 $0.0 $0.30 $0.20 2011 2012 2013 2014 2015 2016E Special Dividends am Regular Dividends -@Dividend Yield + Dividend yield = dividends for the year / stock price at the beginning of the year + 2016E dividends projected at $0.26 pe
Slide 37: Looking Ahead
LOOKING AHEAD 23 Emelaire
Slide 38: Our Franchise: Franchise Map
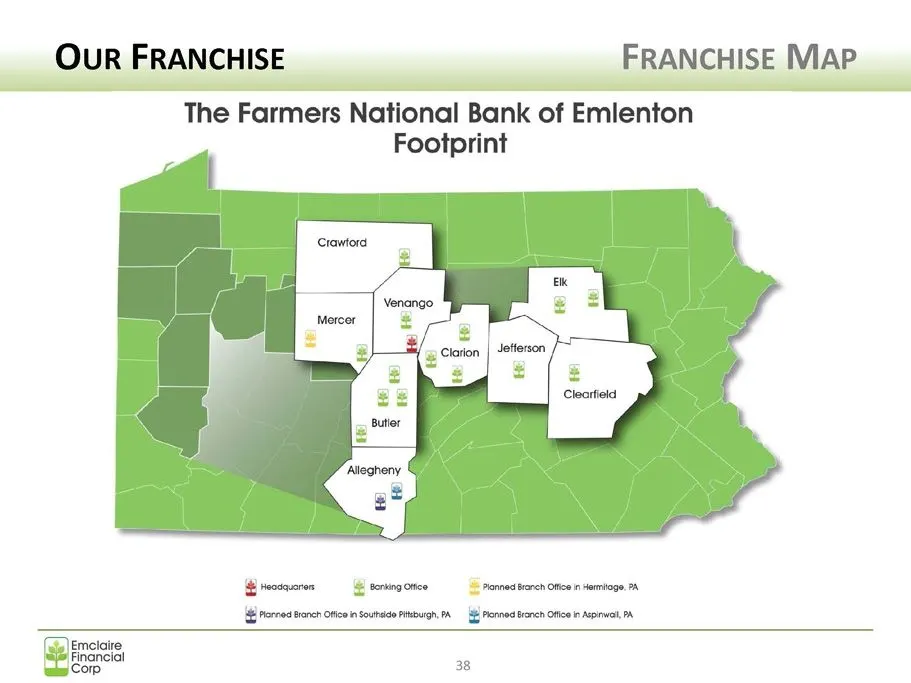
Our FRANCHISE FRANCHISE MAP The Farmers National Bank of Emlenton Footprint { reoaqores Boring ortce Prnned ranch fee in Hemioge,°A {porno ranch oftcein surge Ptibugh, A Porno Branch Ofice ln Aspnwal, PA Emelaire Financial Corp 38
Slide 39: Market Assessment
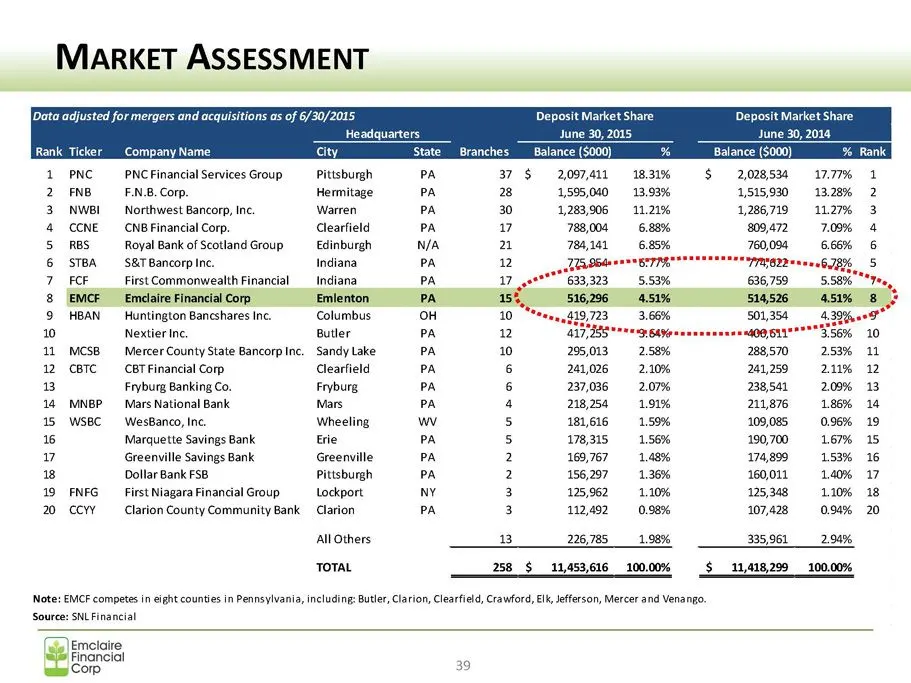
MARKET ASSESSMENT Data adjusted for mergers and acquisitions as of 6/30/2015 Deposit Market Share Deposit Market Share Headquarters June 30, 2015 June 30, 2014 Rank Ticker _ Company Name city State Branches Balance (3000) Balance ($000) PNC —PNCFinancial Services Group Pittsburgh PA 37 $2,097,411 1
Slide 40: Market Assessment
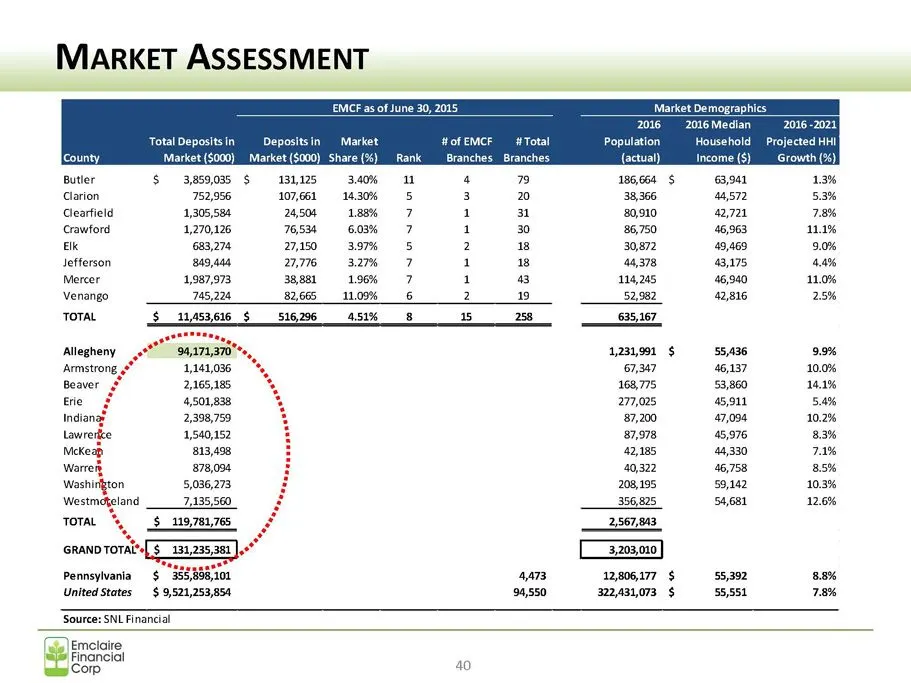
MARKET ASSESSMENT EMCF as of June 30, 2015 Market Demographics: 20162016 Median Total Deposits in _Depositsin Market Hof EMF — #Total Population Household ‘Market ($000) _ Market ($000) Share (%) Rank Branches Branches (actual) income ($) Butler $3,859,085 $ 134225 3.40% 4 cz 186,664 $63,941 iarion
Slide 41: Human Capital Highlights
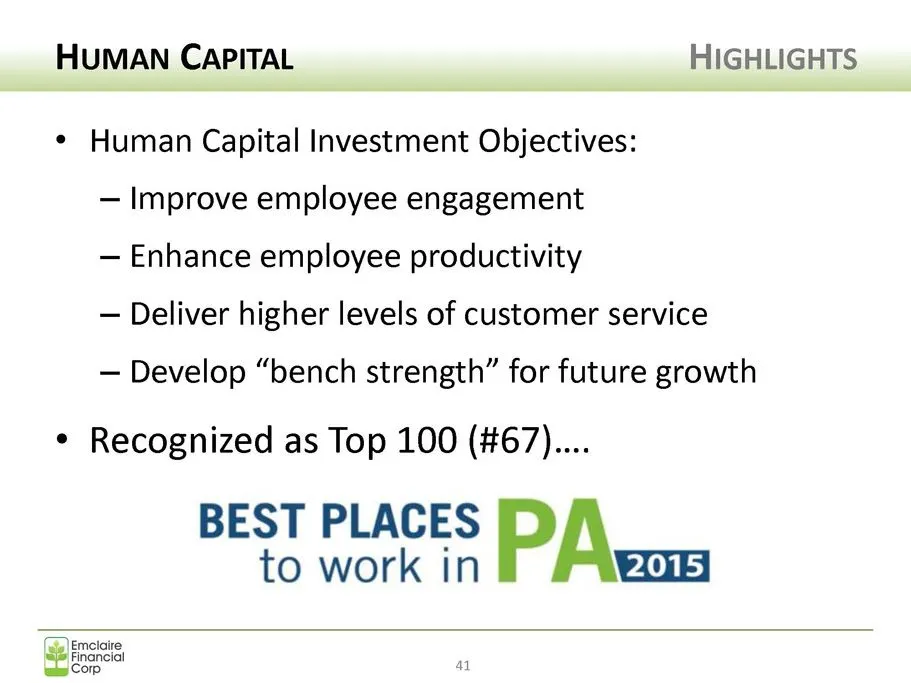
HUMAN CAPITAL HIGHLIGHTS * Human Capital Investment Objectives: — Improve employee engagement — Enhance employee productivity — Deliver higher levels of customer service — Develop “bench strength” for future growth * Recognized as Top 100 (#67)... BEST PLACES to work in PAus
Slide 42: Technology: Mobile Banking Update
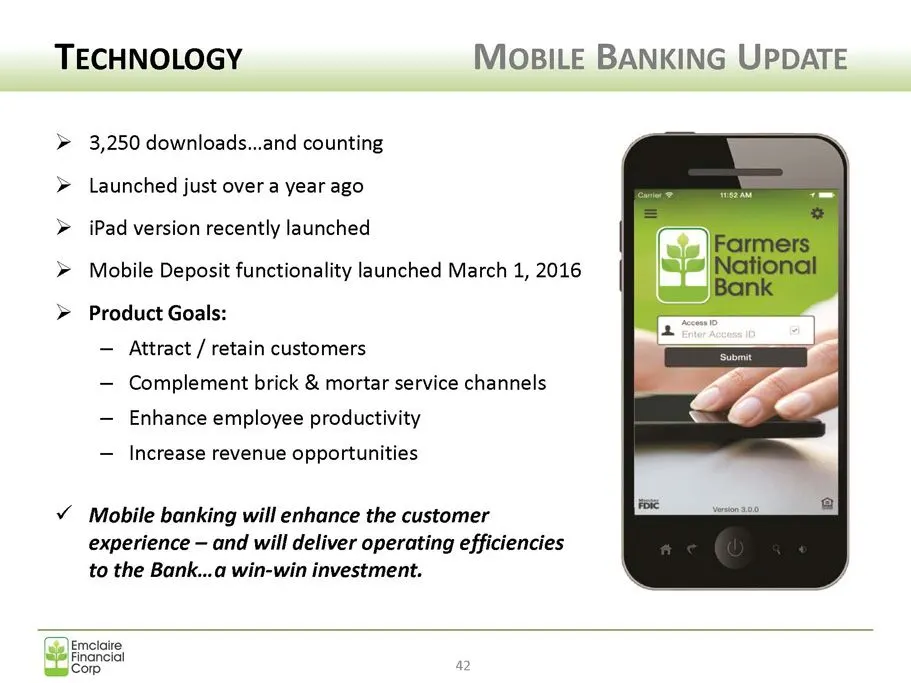
TECHNOLOGY Mobile BANKING UPDATE v 3,250 downloads...and counting > Launched just over a year ago > iPad version recently launched > Mobile Deposit functionality launched March 1, 2016 > Product Goals: Attract / retain customers Complement brick & mortar service channels — Enhance employee productiv
Slide 43: Strategy Recap
STRATEGY RECAP * Corporate growth & expansion — UASB integration — Aspinwall branch open — Next opportunity... * Continued focus on earnings growth * Continued focus on balance sheet growth & mix * Maintain strong asset quality ¢ Improvement in systems, personnel and technology * Focus on key regula
Slide 44: Well Positioned
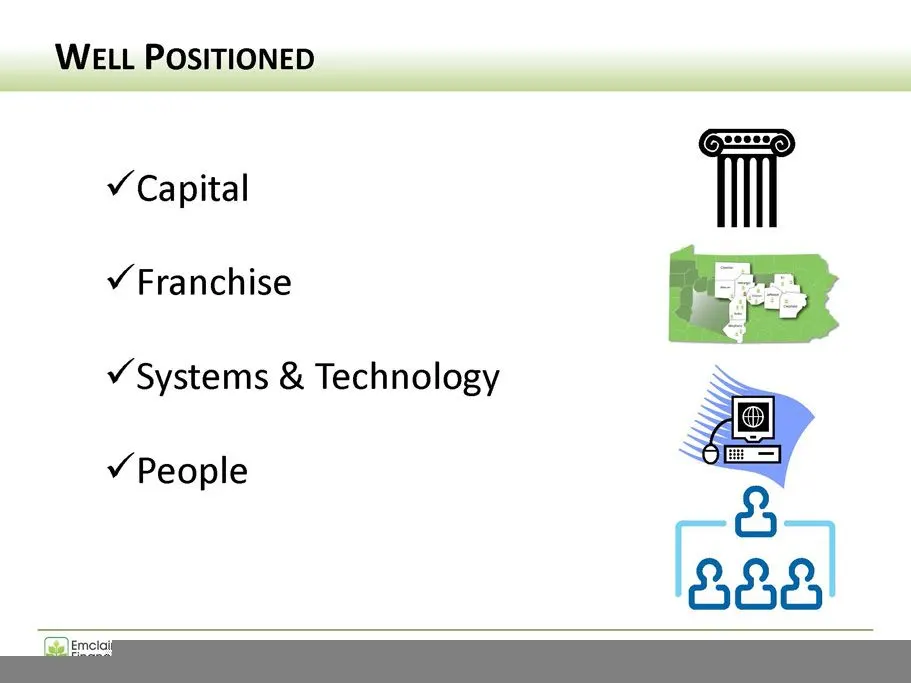
WELL POSITIONED Y¥ Capital ¥ Franchise v Systems & Technology 7a ¥ People i
Slide 45: Q&A Session
Q&A SESSION Questions and Answers
Slide 46: In Memoriam
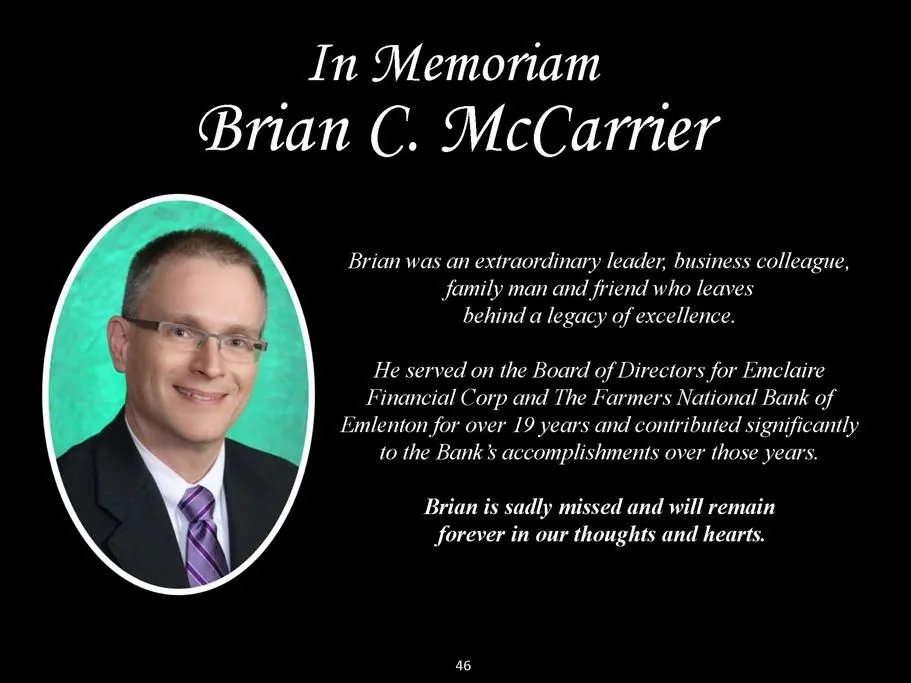
In Memoriam Brian C. McCarner Brian was an extraordinary leader, business colleague, family man and friend who leaves behind a legacy of excellence. He served on the Board of Directors for Emclaire Financial Corp and The Farmers National Bank of Emlenton for over 19 years and contributed significant
Slide 47: Closing and Thank You
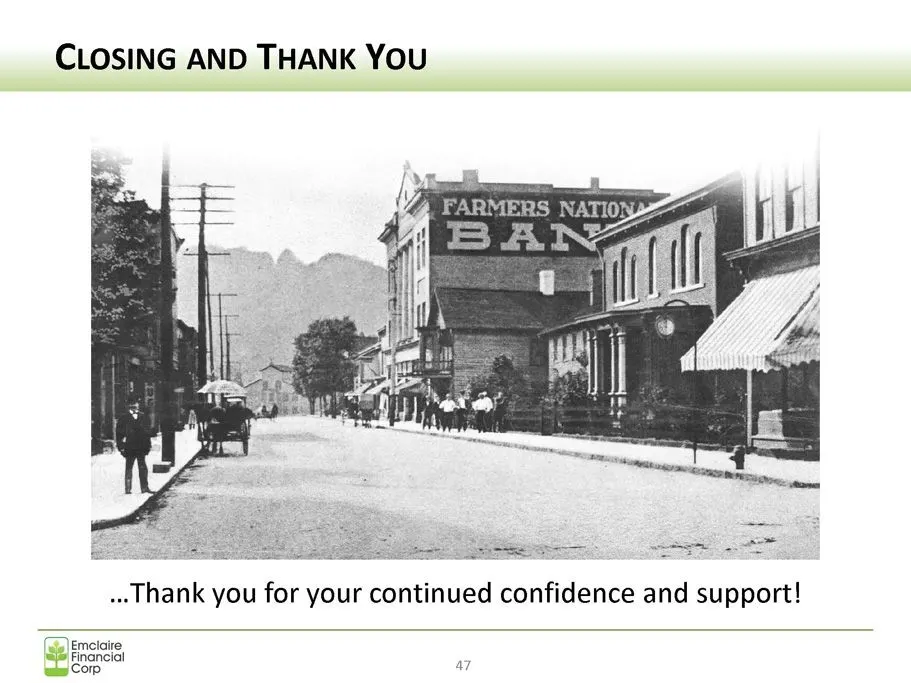
CLOSING AND THANK YOu .. Thank you for your continued confidence and support! Emelaire Financial Corp a7
Source: SEC EDGAR · 8-K filed Apr 27, 2016
More decks from Emclaire Financial Corp
 Merger or Acquisition (March 2022)13 slides · Mar 24, 2022
 Shareholder Meeting (April 2021)36 slides · Apr 21, 2021
 Shareholder Meeting (April 2020)32 slides · Apr 22, 2020
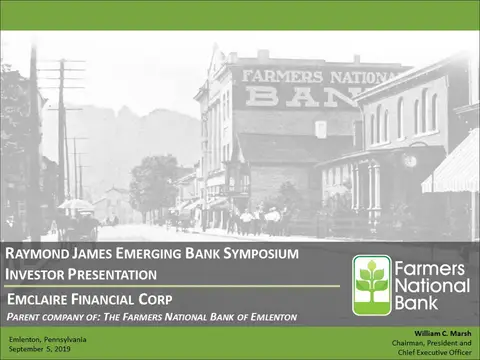 Raymond James Emerging Bank Symposium (September 2019)23 slides · Sep 4, 2019
 Shareholder Meeting (April 2019)32 slides · Apr 24, 2019
 Shareholder Meeting (April 2018)28 slides · Apr 25, 2018