Emclaire Financial — Shareholder Meeting (April 2019)
32 slides from Emclaire Financial's shareholder meeting presentation, Apr 24, 2019
Slide 1: 2019 Annual Meeting of Shareholders
2019 ANNUAL MEETING OF SHAREHOLDERS EMCLAIRE FINANCIAL CORP PARENT COMPANY OF: THE FARMERS NATIONAL BANK OF EMLENTON Presented by: William C. Marsh Chairman, President and Chief Executive Officer Emlenton, Pennsylvania + April 24, 2019 Emelaire Financial ‘Corp
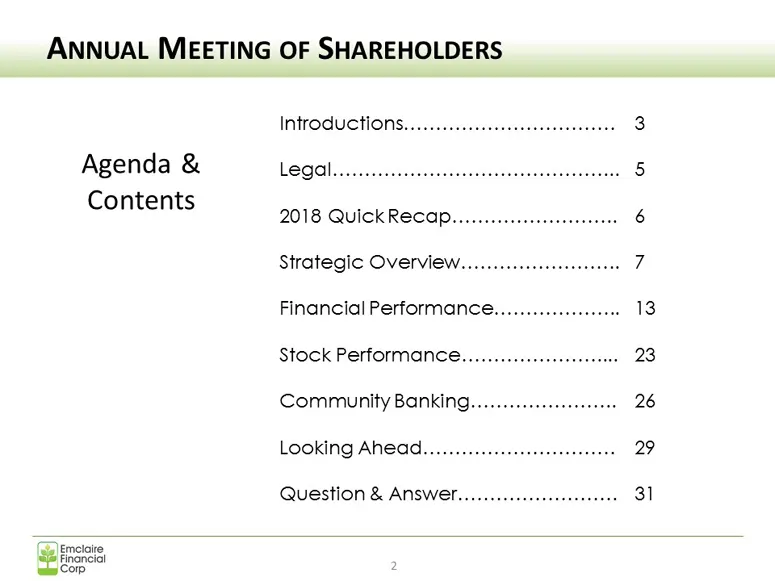
Slide 2: Agenda & Contents
ANNUAL MEETING OF SHAREHOLDERS Agenda & Contents INtOGUCTIONS......eeeeeeeeeeeeeeteeeteeteeee 3 LEGON sscssecscereeasezeeeerasererceiseazevescray 5 2018 Quick Recap. 6 Strategic OVErVIEW.......ccccceeeeeeeeeees ch Financial Perfor mance....... eerie 13 STOCK Performance... eee 23 Community BANKING..
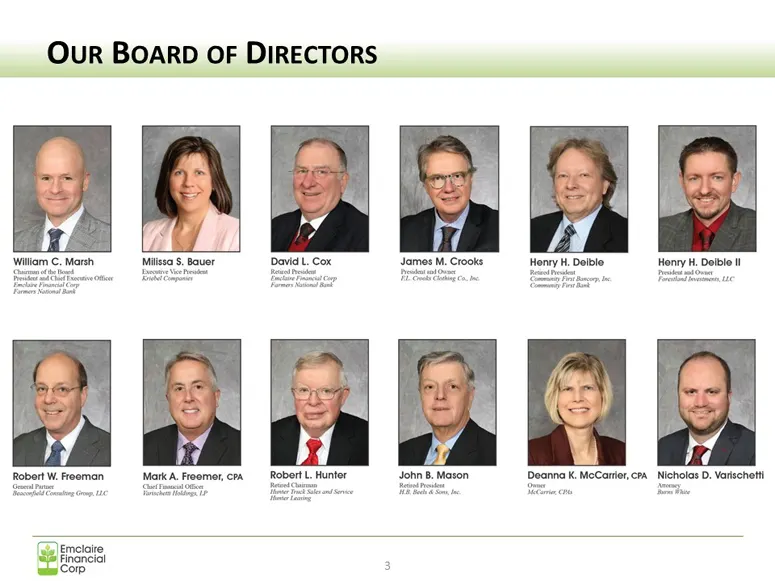
Slide 3: Our Board of Directors
Our Boarp OF DIRECTORS Deanna K. MeCarter,cPA Nicholas D. Varschetti

Slide 4: Our Executive Management Team
Our EXecuTIvE MANAGEMENT TEAM
Slide 5: Legal
LEGAL This presentation contains certain forward-looking statements and information relating to the Company that are based on the beliefs of management as well as assumptions made by and information currently available to management. These forward-looking statements relate to, among other things, ex
Slide 6: 2018 Quick Recap
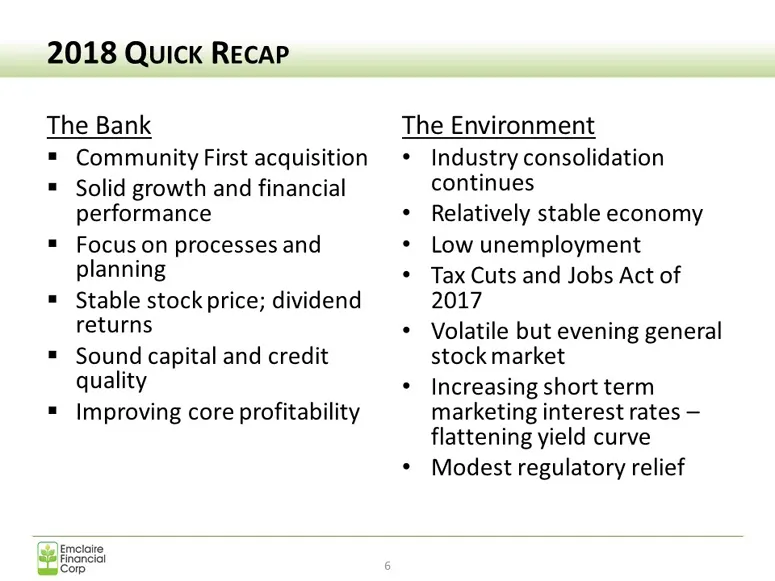
2018 Quick RECAP The Bank Community First acquisition Solid growth and financial performance Focus on processes and planning Stable stock price; dividend returns Sound capital and credit quality Improving core profitability The Environment * Industry consolidation continues * Relatively stable econo
Slide 7: Strategic Overview
--+ Strategic Overview ---
Slide 8: Strategic Overview: Achieving Scale
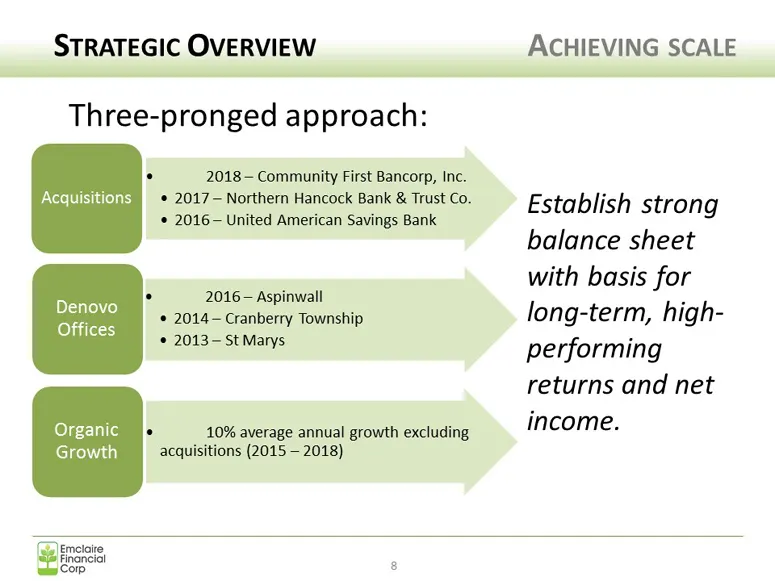
STRATEGIC OVERVIEW ACHIEVING SCALE Three-pronged approach: . 2018 - Community First Bancorp, Inc. TNS isu) © 2017 — Northern Hancock Bank & Trust Co. 2016— United American Savings Bank . 2016 ~ Aspinwall + 2014- Cranberry Township * 2013- St Marys Organic 6 10% average annual growth excluding Growth
Slide 9: Strategic Overview: Consistent Growth
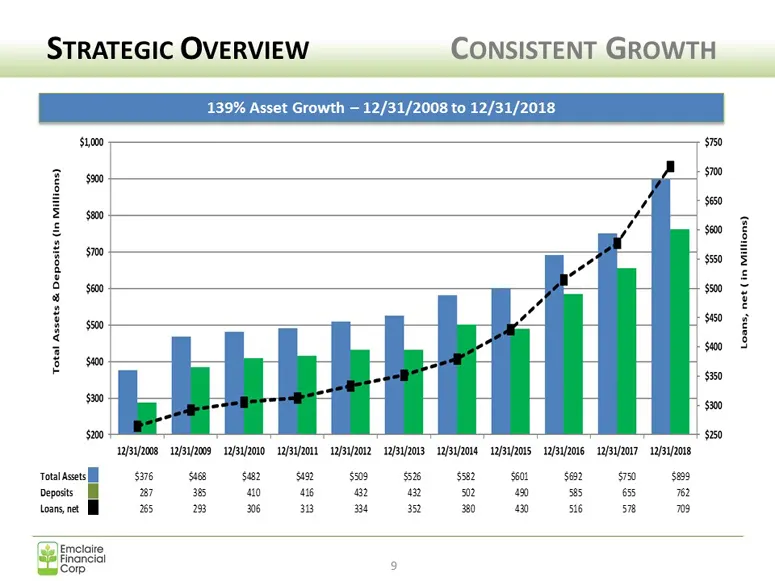
STRATEGIC OVERVIEW CONSISTENT GROWTH 139% Asset Growth — 12/31/2008 to 12/31/2018 sto j= 2 sso g 3 $700 8 8 sen a) a 3 3 se s0 sino UpYOe NPM LENO YAN NEIAM BAyOS NPM NEOs Pyne wpIANT LpsROE Total Assets| $36 $8 $482. 2 $309 $526 $382 ‘$601 $2 790 $09 Depots ee ee ee ee ee ee ee ee ee toot oe ee ee
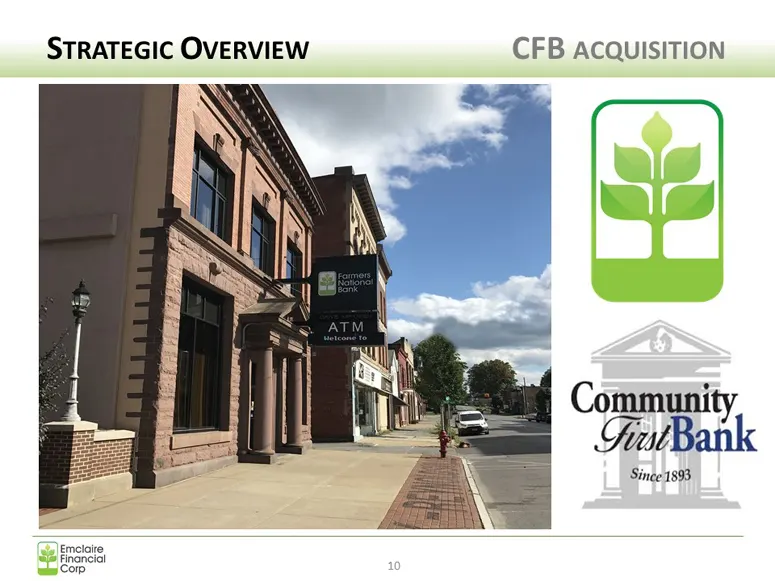
Slide 10: Strategic Overview: CFB Acquisition
STRATEGIC OVERVIEW CFB ACQUISITION
Slide 11: Strategic Overview: CFB Acquisition
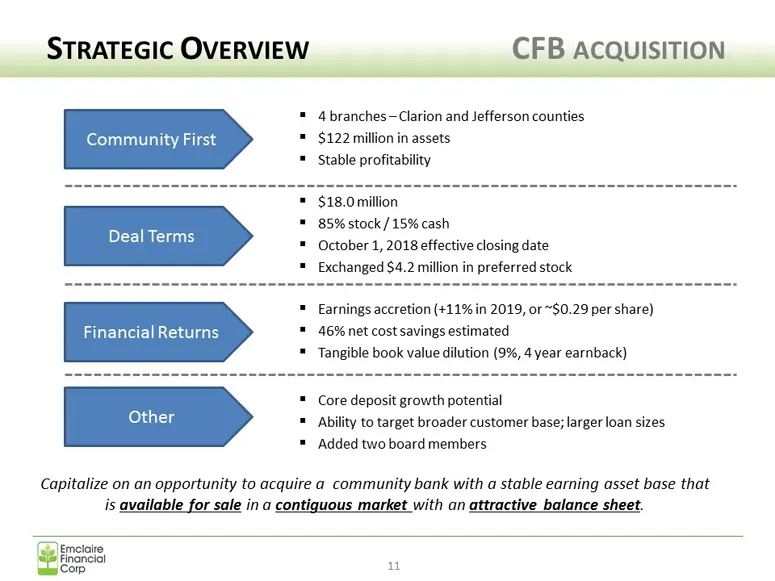
ERVI FB TIO! "4 branches—Clarion and Jefferson counties * $122million in assets = Stable profitability Community First = $18.0million = 85% stock /15% cash "October 1, 2018 effective closing date = Earnings accretion (+11% in 2019, or ~$0.29 per share) = 46% net cost savings estimated = Tangible boo
Slide 12: Strategic Overview: Our Combined Franchise
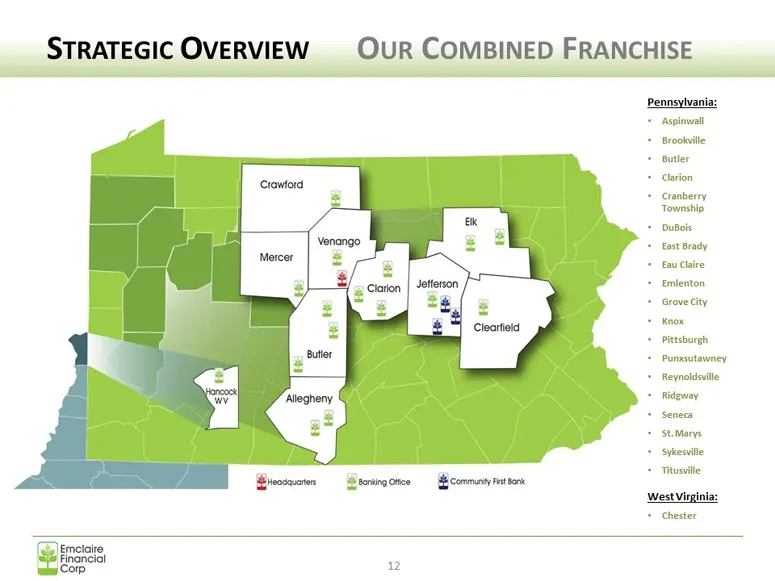
STRATEGIC OVERVIEW OUR COMBINED FRANCHISE Pennsylvania: + cranberry Township. + Grovecity + Pitsburgh + Reynotdsvile Ridgway marys + Sykesville + Ttunvite Bicones Brering once comma Fattone B)Emectaire Financial . ‘Corp 2
Slide 13: Financial Performance
-++ Financial Performance .-.-- lEmclake Financial
Slide 14: Financial Performance
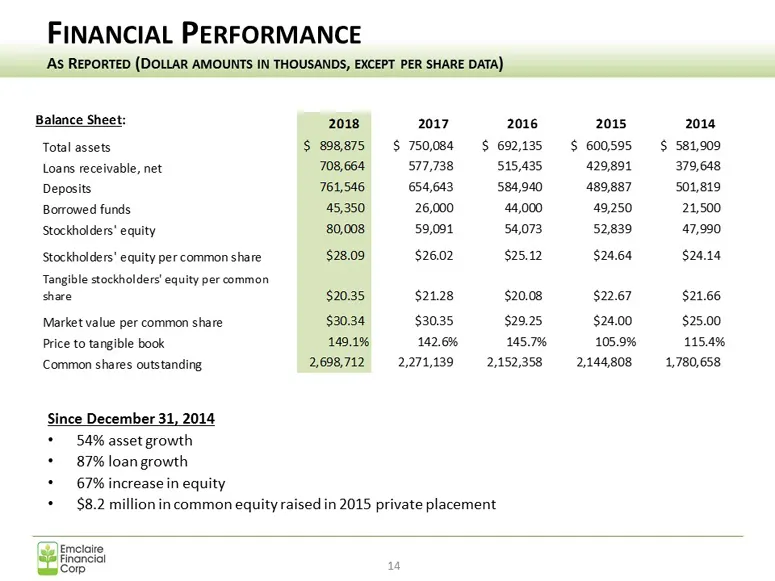
FINANCIAL PERFORMANCE JSANDS, EXCEPT PER SHARE DATA AS REPORTED (DOLLAR Balance Shee! Total assets Loans receivable, net Deposits Borrowed funds ‘Stockholders’ equity ‘Stockholders’ equity per common share Tangible stockholders’ equity per common share Market value per common share Price to tangible
Slide 15: Financial Performance
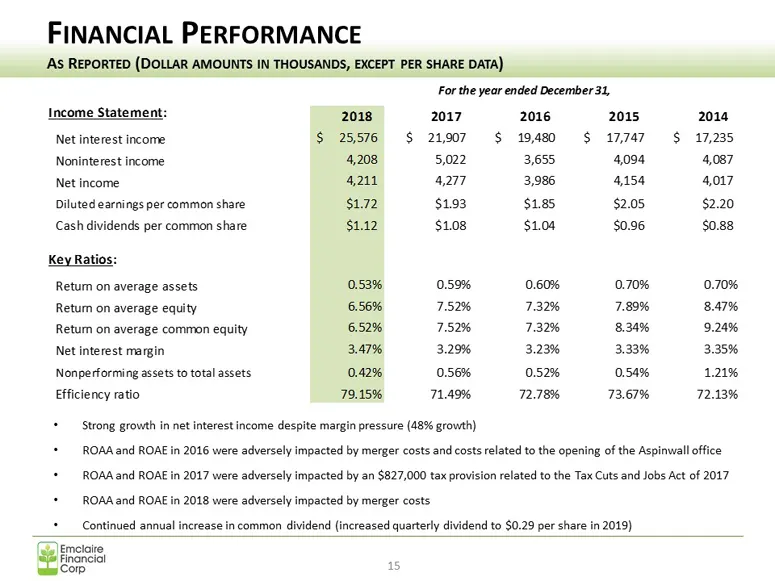
FINANCIAL PERFORMANCE )RTED (DOLLAR AMOUNTS IN THOUSANDS, EXCEPT PER Dati For the year ended December 31, Income Statement: 2018 2017 2016 2015 2014 Net interest income $ 25576 $ 21907 $ 19,480 $ 17,747 $ 17,235 Noninterest income 4,208 5,022 3,655, 4,094 4,087 Net income 4211 4277 3,986 4154 4017 D
Slide 16: Financial Performance
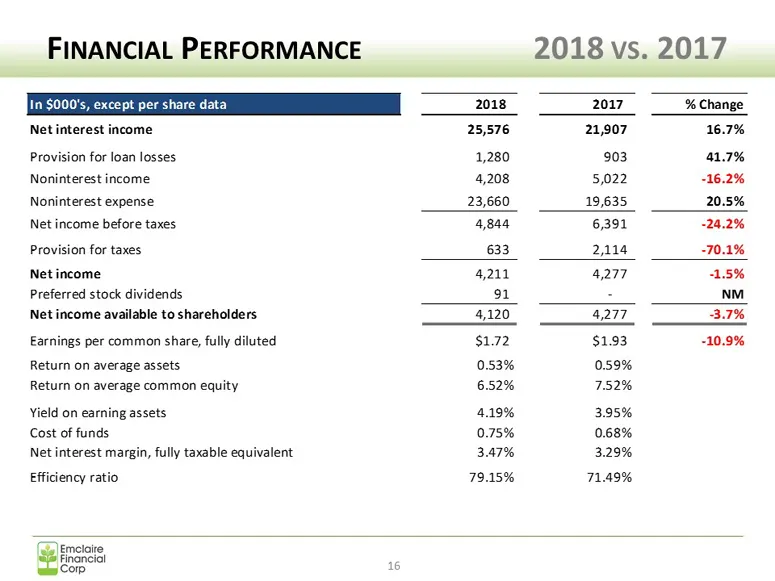
FINANCIAL PERFORMANCE Net interest income Provision for loan losses Noninterest income Noninterest expense Net income before taxes Provision for taxes Net income Preferred stock dividends Net income available to shareholders Earnings per common share, fully diluted Return on average assets Return on
Slide 17: Financial Performance 2018 vs. 2017
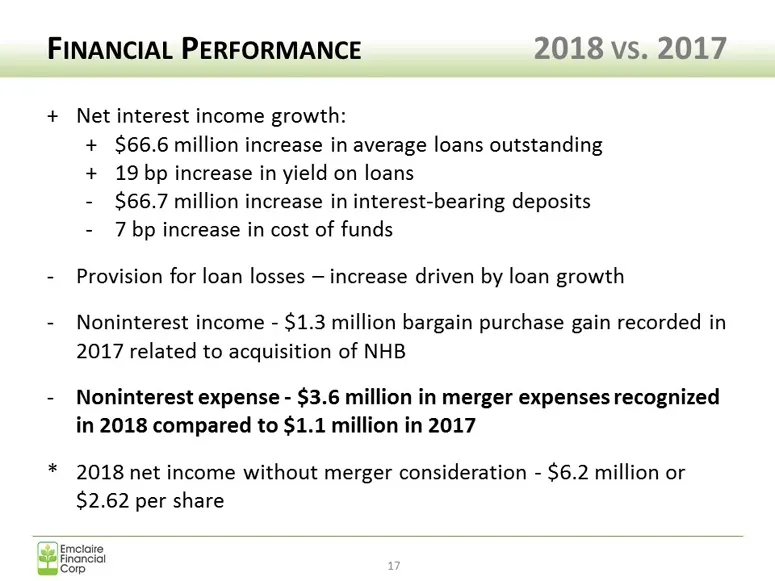
FINANCIAL PERFORMANCE 2018 vs. 2017 + Net interest income growth: + $66.6 million increase in average loans outstanding + 19 bp increase in yield on loans - $66.7 million increase in interest-bearing deposits - 7 bp increase in cost of funds - Provision for loan losses — increase driven by loan grow
Slide 18: Financial Performance: Asset Quality
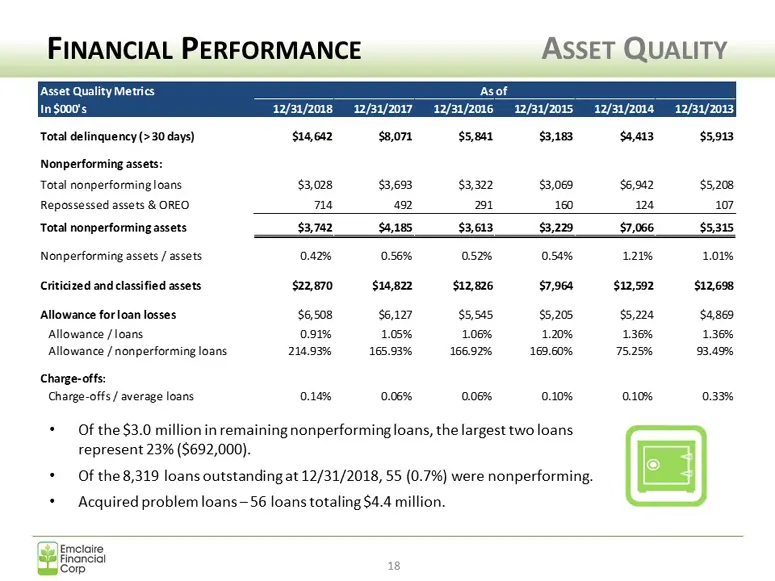
FINANCIAL PERFORMANCE Asset Quality ASSET QUALITY Ins000's mis 32/31/2017 32/31/26 12/33/2015 12/31/2014 12/33/2003 Total delinquency (>30 days) $14,622 saon $5,081 $3,183 $4413 $5913 Nonperforming assets: Total nonperforming loans $3,008 $3,693, $3,322 $3,069 $6,982 $5,208 Repossessed assets & OREO
Slide 19: Financial Performance: Nonperforming Assets
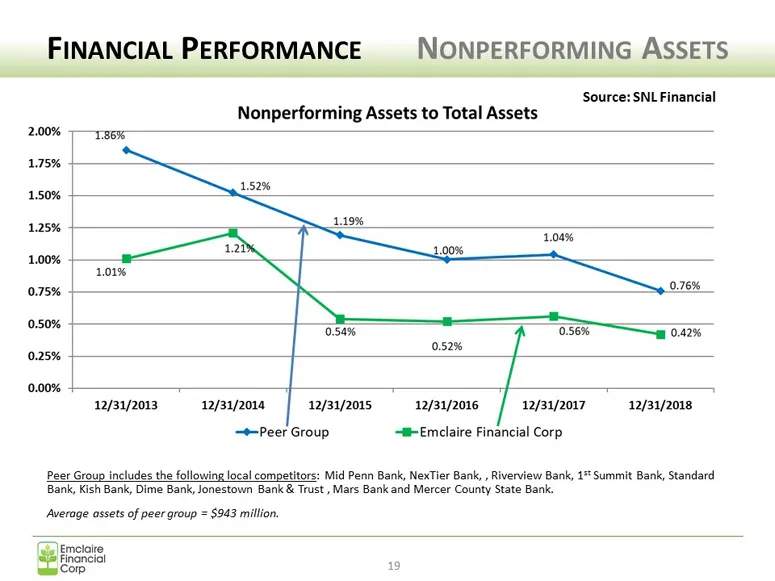
FINANCIAL PERFORMAN' NONPERFORMING ASSETS . Source: SNL Financial Nonperforming Assets to Total Assets 56% 1.75% — 152% 150% _ 1.19% er = , : 20% 101% Bee 0.75% Lei iS —.— Las 0.54% 0.56% 0.42% 052% 0.25% 0.00% 12/31/2013 12/31/2014 12/31/2015 12/31/2016 12/31/2017 12/31/2018 Peer Group ‘~@Emelaire
Slide 20: Financial Performance Q1-2019 Balance Sheet
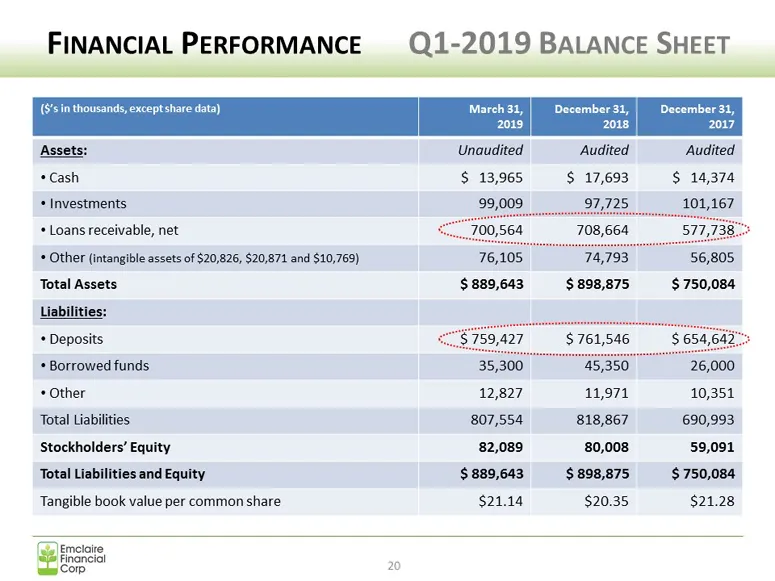
FINANCIAL PERFORMANCE Q1-2019 BALANCE SHEET Unaudited Audited Audited $ 13,965 $ 17,693 $ 14,374 7,7 167 + Investments + Loans receivable, net + Other (intangible assets of $20,826, $20,871 and $10,769) 76,105 2 56,805, Total Assets $ 889,643 $898,875 $750,084 + Deposits + Borrowed funds 35,300 45,3
Slide 21: Financial Performance: Q1-2019 Earnings
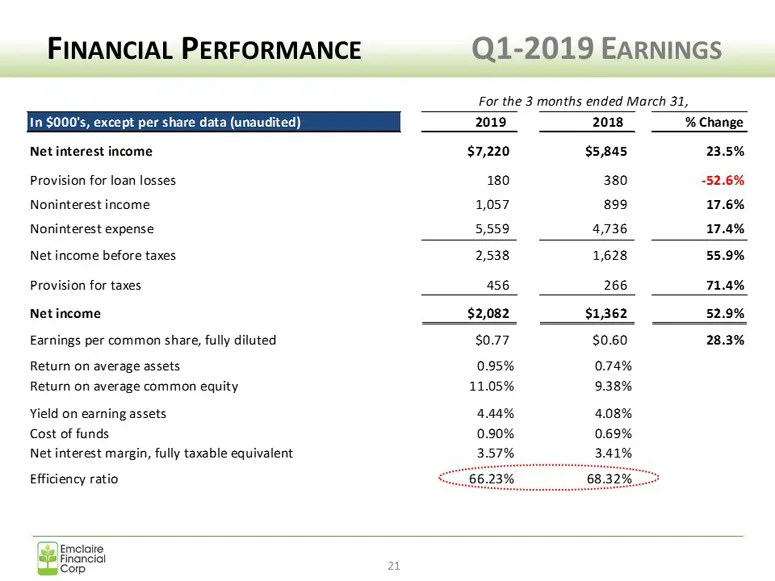
FINANCIAL PERFORMANCE In $000's, except per share data (unaudited) Net interest income Provision for loan losses Noninterest income Noninterest expense Net income before taxes Provision for taxes Net income Earnings per common share, fully diluted Return on average assets Return on average common eq
Slide 22: Financial Performance Q1-19 vs. Q1-18
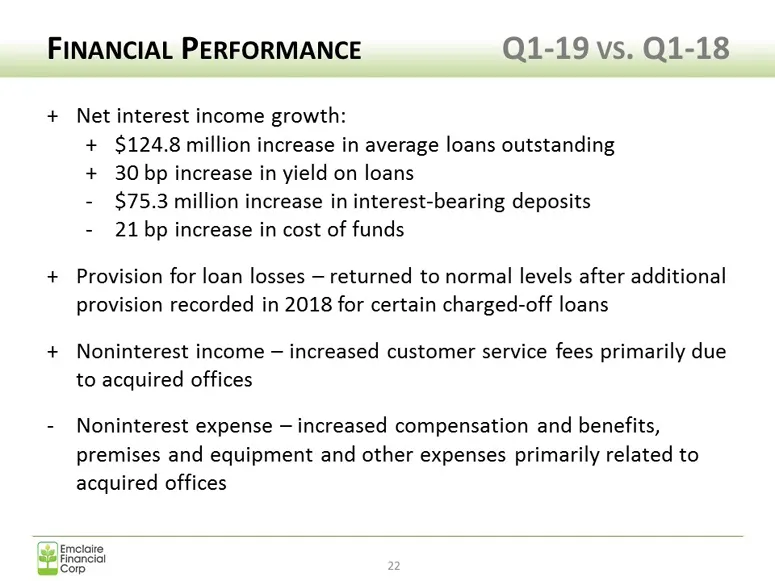
FINANCIAL PERFORMANCE Q1-19 vs. Q1-18 + Net interest income growth: + $124.8 million increase in average loans outstanding + 30 bp increase in yield on loans - $75.3 million increase in interest-bearing deposits - 21 bp increase in cost of funds + Provision for loan losses — returned to normal level
Slide 23: Stock Performance
Stock Performance lEmclake Financial
Slide 24: Corporate Overview: Stock Performance
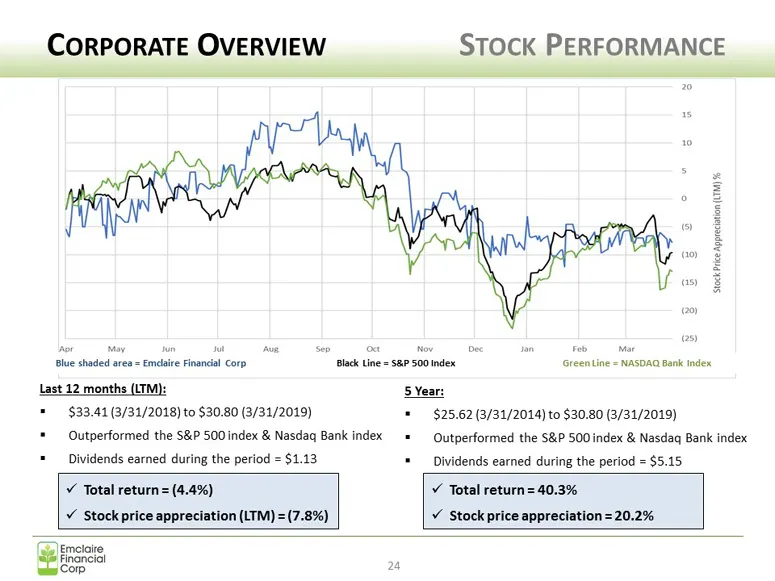
CORPORATE OVERVIEW STOCK PERFORMANCE Fi the shaded oem Fn Corp ak ine = SAP So0index sieentine= Last 12 months (LT SYear: = $33.41 (3/31/2018) to $30.80 (3/31/2019) © $25.62 (3/31/2014) to $30.80 (3/31/2019) + Outperformed the S&P 500 index & Nasdaq Bank index = —_Outperformed the S&P S00 index & Na
Slide 25: Dividend Recap
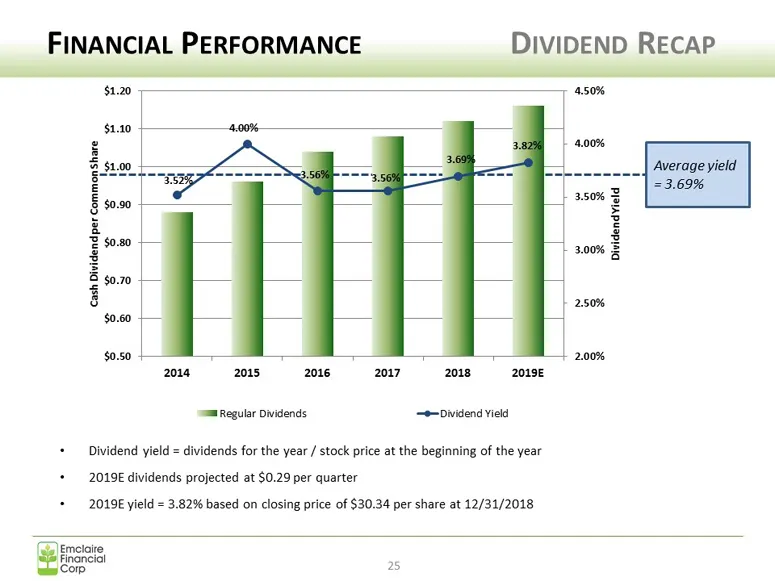
FINANCIAL PERFORMANCE $1.20 $1.10 i ot z § $0: & Z so. 3 8 $0 i $0.60 $0.50 21a 201520162017 201820198 sm regular DWvidends —eDWvidend veld ividends for the year / stock price at the beginning of the year + 2019E dividends projected at $0.29 per quarter + 20198 yield = 3.82% based on closing price o
Slide 26: Community Banking
--+ Community Banking --- lEmclake Financial
Slide 27: Our Employees
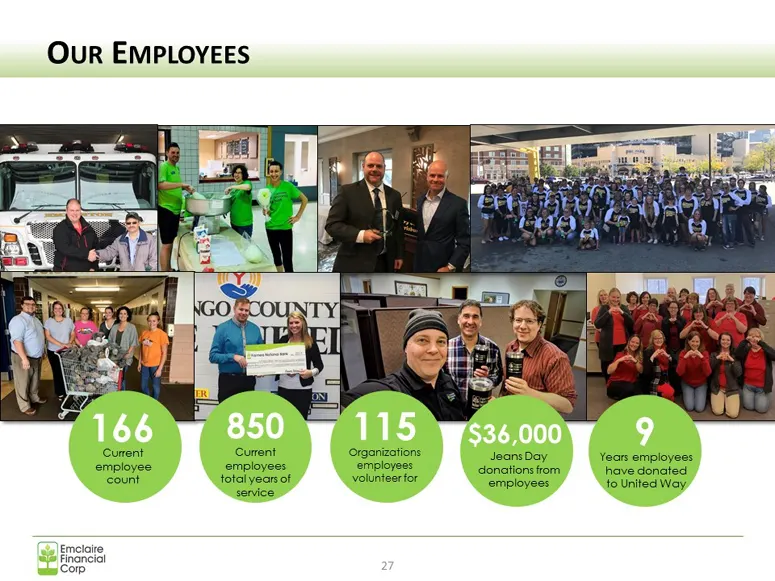
Our EmpPLoyees Curent Curent Crgonizations pees Rect erineer employee employees employees donations from have donated count totalyeors of volunteer for enpiieel to United Way senice Emelaire Financial Corp
Slide 28: Our Communities
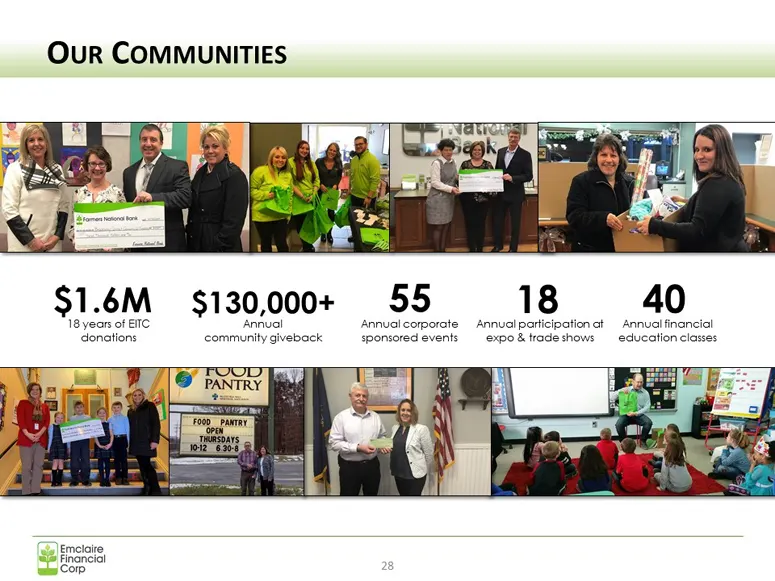
Our COMMUNITIES $1.6M $130,000: 55 18 40
Slide 29: Looking Ahead
- Looking Ahead
Slide 30: Strategic Elements for Success
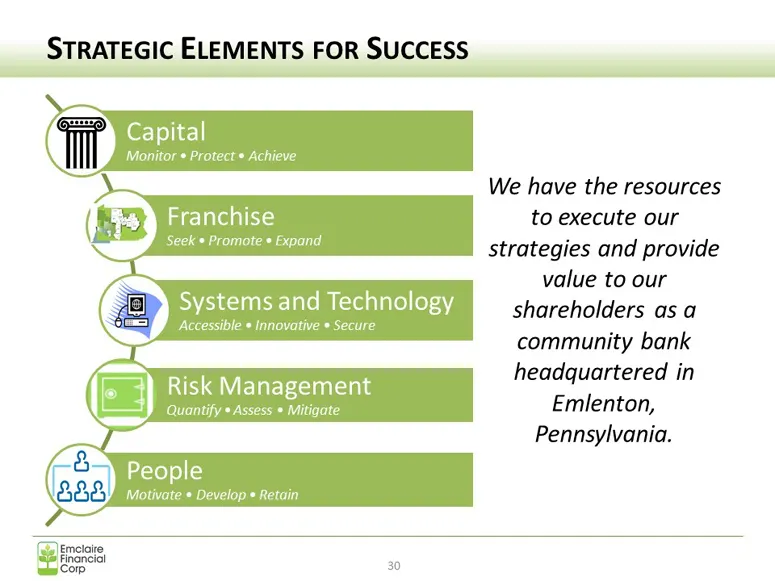
STRATEGIC ELEMENTS FOR SUCCESS Capital Monitor * Protect * Achieve We have the resources Franchise to execute our a strategies and provide value to our Systems and Technology shareholders asa Accessible * Innovative * Secure community bank headquartered in Risk Management Quantify * Assess « Mitigat
Slide 31: Q&A Session
Q&A SESSION Questions and Answers Emelaire Financial ‘Corp at
Slide 32: Closing and Thank You
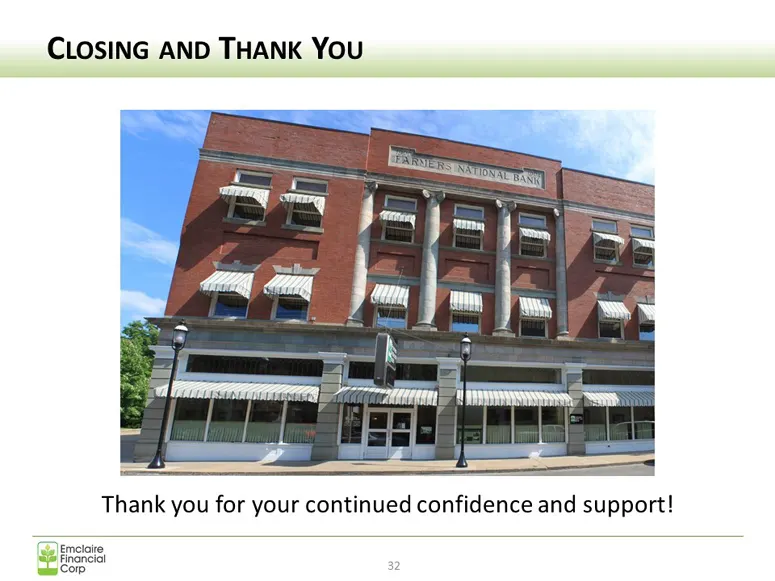
CLOSING AND THANK YOu Thank you for your continued confidence and support! D)Emectaire Financial ‘Corp
Source: SEC EDGAR · 8-K filed Apr 24, 2019
More decks from Emclaire Financial Corp
 Merger or Acquisition (March 2022)13 slides · Mar 24, 2022
 Shareholder Meeting (April 2021)36 slides · Apr 21, 2021
 Shareholder Meeting (April 2020)32 slides · Apr 22, 2020
 Raymond James Emerging Bank Symposium (September 2019)23 slides · Sep 4, 2019
 Shareholder Meeting (April 2018)28 slides · Apr 25, 2018
 Investor Presentation (December 2017)21 slides · Dec 6, 2017