Emclaire Financial — Shareholder Meeting (April 2018)
28 slides from Emclaire Financial's shareholder meeting presentation, Apr 25, 2018
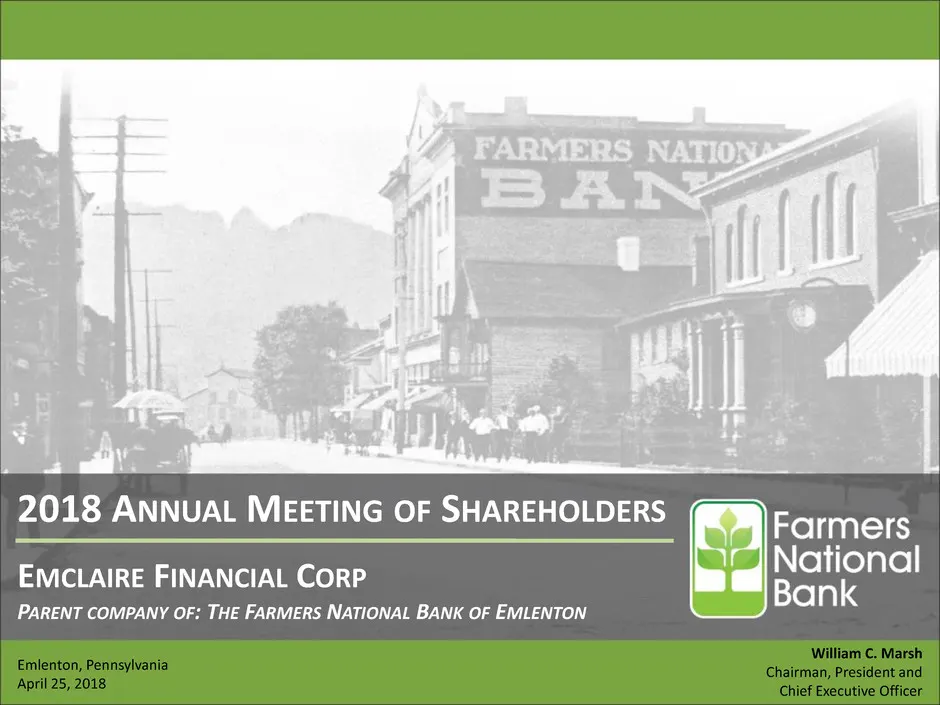
Slide 1: 2018 Annual Meeting of Shareholders
2018 ANNUAL MEETING OF SHAREHOLDERS EMCLAIRE FINANCIAL CORP PARENT COMPANY OF: THE FARMERS NATIONAL BANK OF EMLENTON Emlenton, Pennsylvania April 25, 2018 William C. Marsh Chairman, President and Chief Executive Officer
Slide 2: Agenda & Contents
ANNUAL MEETING OF SHAREHOLDERS Agenda & Contents 2 Topic Page Legal 3 Corporate Overview 4 Financial Performance 11 Looking Ahead 20 Question & Answer 26
Slide 3: Legal
This presentation contains certain forward-looking statements and information relating to the Company that are based on the beliefs of management as well as assumptions made by and information currently available to management. These forward-looking statements relate to, among other things, expectat
Slide 4: Corporate Overview
4 Corporate Overview• • • • • •
Slide 5: Corporate Overview: History
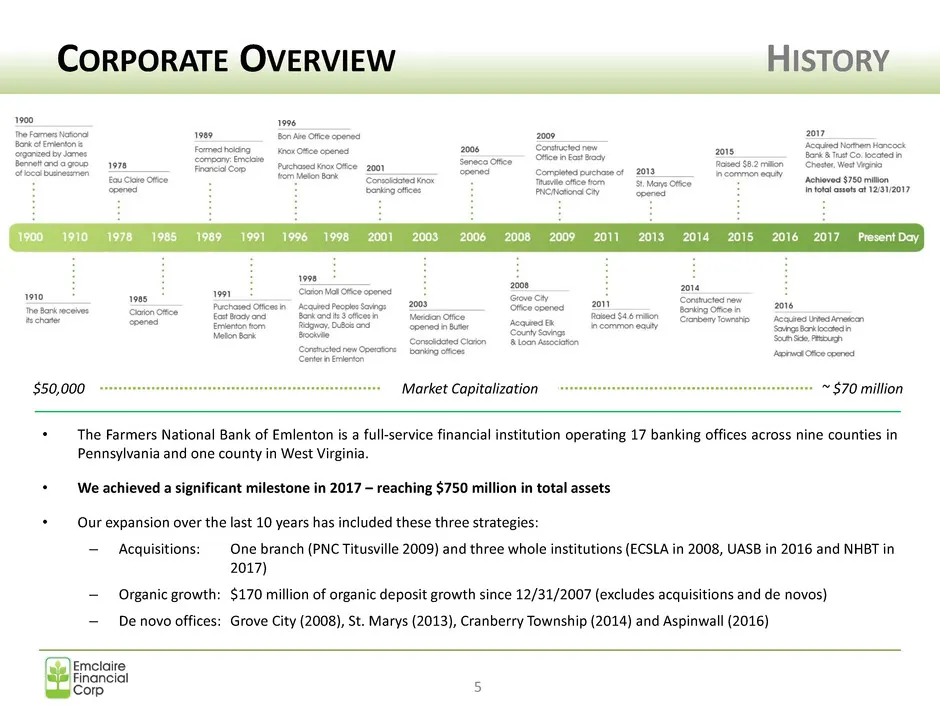
CORPORATE OVERVIEW HISTORY 5 • The Farmers National Bank of Emlenton is a full-service financial institution operating 17 banking offices across nine counties in Pennsylvania and one county in West Virginia. • We achieved a significant milestone in 2017 – reaching $750 million in total assets • Our
Slide 6: Corporate Overview: Mission, Vision, Culture
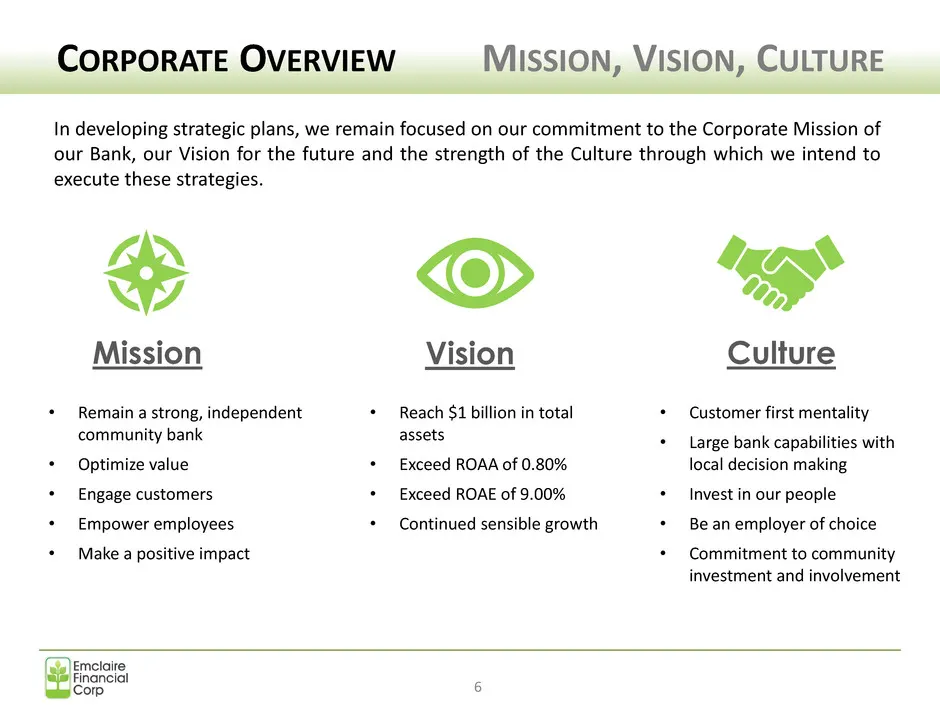
CORPORATE OVERVIEW MISSION, VISION, CULTURE 6 In developing strategic plans, we remain focused on our commitment to the Corporate Mission of our Bank, our Vision for the future and the strength of the Culture through which we intend to execute these strategies. Mission • Remain a strong, independent
Slide 7: Corporate Overview: 2017 Snapshot
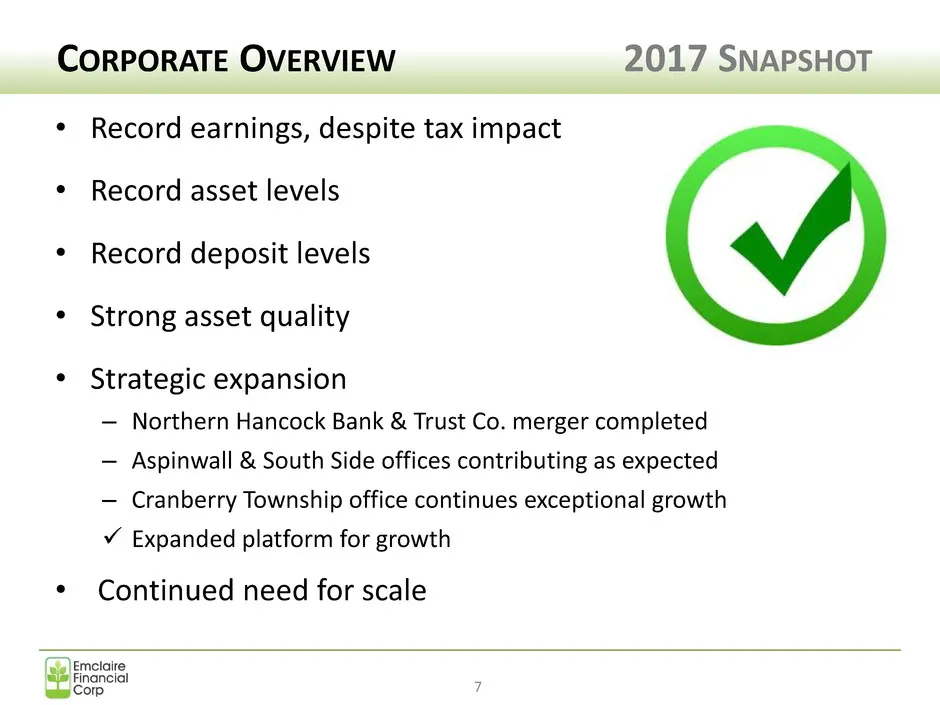
• Record earnings, despite tax impact • Record asset levels • Record deposit levels • Strong asset quality • Strategic expansion – Northern Hancock Bank & Trust Co. merger completed – Aspinwall & South Side offices contributing as expected – Cranberry Township office continues exceptional growth ✓ E
Slide 8: Corporate Overview: Consistent Growth
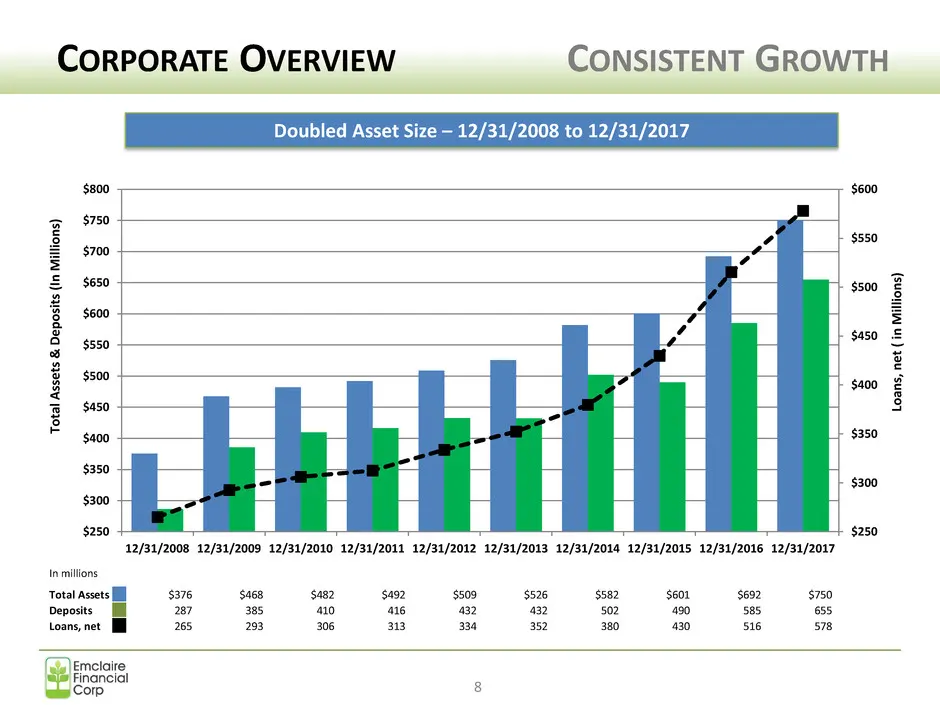
$250 $300 $350 $400 $450 $500 $550 $600 $250 $300 $350 $400 $450 $500 $550 $600 $650 $700 $750 $800 12/31/2008 12/31/2009 12/31/2010 12/31/2011 12/31/2012 12/31/2013 12/31/2014 12/31/2015 12/31/2016 12/31/2017 Lo an s, n e t ( in M ill io n s) To ta l A ss et s & De p o si ts ( In M ill io n s) CORP
Slide 9: Corporate Overview: Economy
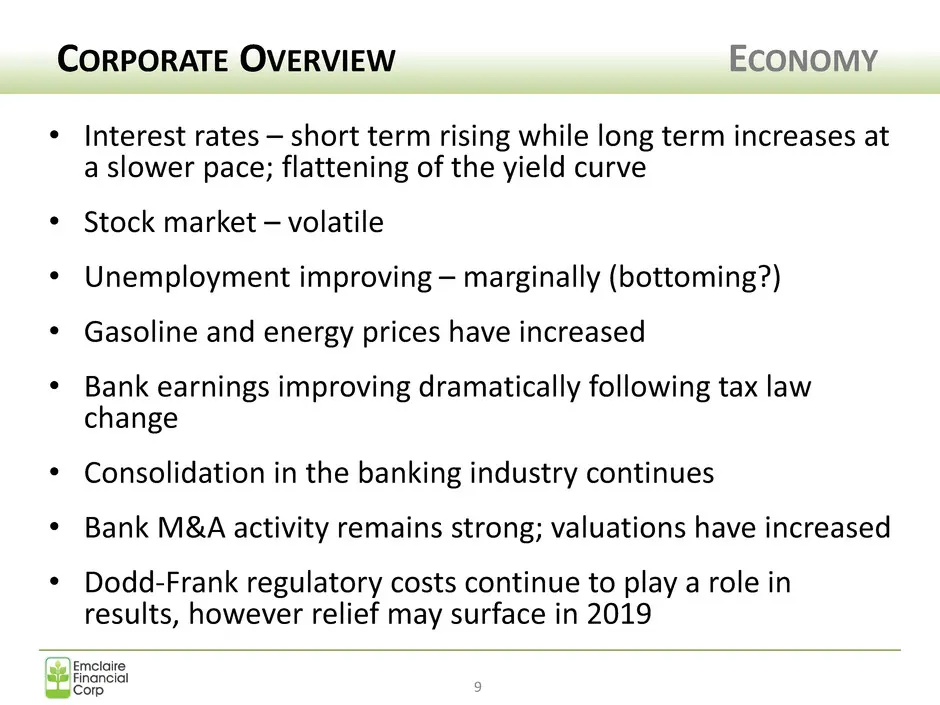
• Interest rates – short term rising while long term increases at a slower pace; flattening of the yield curve • Stock market – volatile • Unemployment improving – marginally (bottoming?) • Gasoline and energy prices have increased • Bank earnings improving dramatically following tax law change • Co
Slide 10: Corporate Overview: Stock Performance
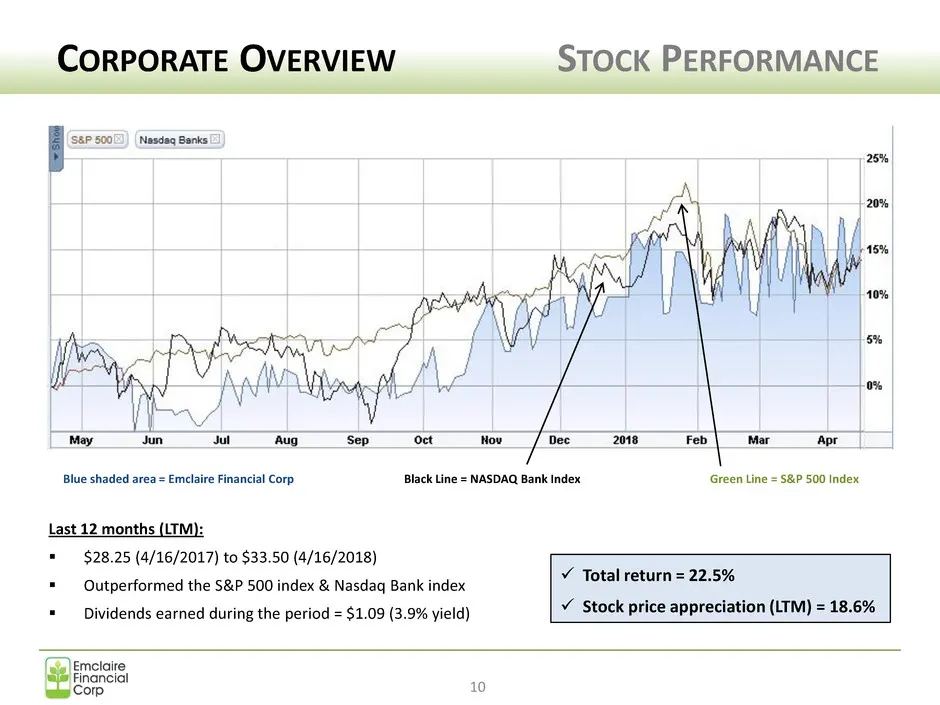
Last 12 months (LTM): ▪ $28.25 (4/16/2017) to $33.50 (4/16/2018) ▪ Outperformed the S&P 500 index & Nasdaq Bank index ▪ Dividends earned during the period = $1.09 (3.9% yield) CORPORATE OVERVIEW STOCK PERFORMANCE 10 ✓ Total return = 22.5% ✓ Stock price appreciation (LTM) = 18.6% Blue shaded area = E
Slide 11: Financial Performance
11 Financial Performance• • • • • •
Slide 12: Financial Performance: As Reported (Balance Sheet)
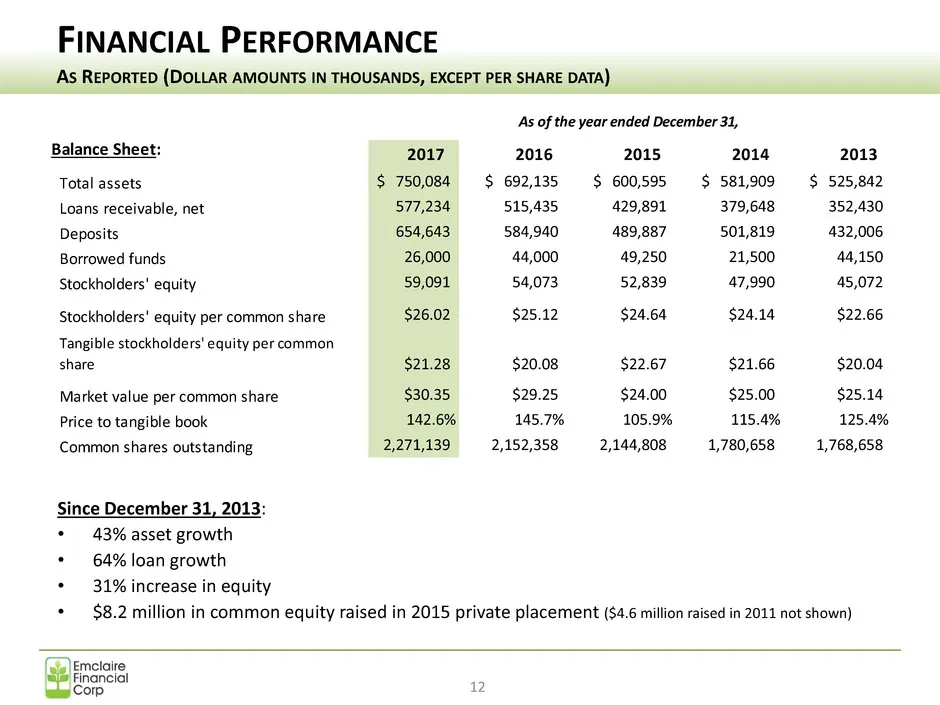
Since December 31, 2013: • 43% asset growth • 64% loan growth • 31% increase in equity • $8.2 million in common equity raised in 2015 private placement ($4.6 million raised in 2011 not shown) FINANCIAL PERFORMANCE AS REPORTED (DOLLAR AMOUNTS IN THOUSANDS, EXCEPT PER SHARE DATA) 12 2017 2016 2015 201
Slide 13: Financial Performance: As Reported (Earnings)
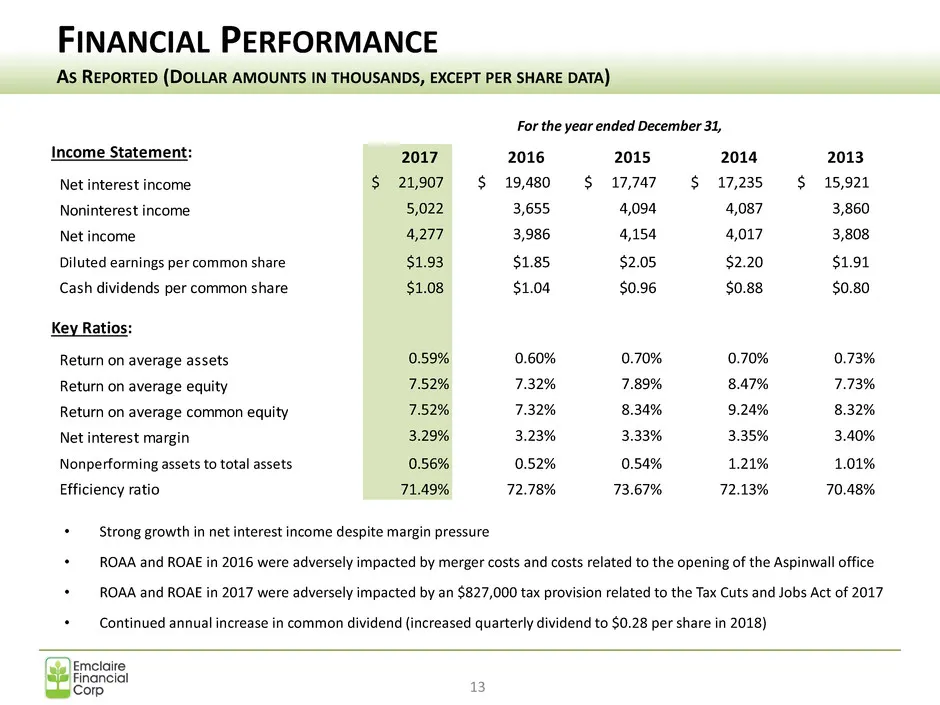
• Strong growth in net interest income despite margin pressure • ROAA and ROAE in 2016 were adversely impacted by merger costs and costs related to the opening of the Aspinwall office • ROAA and ROAE in 2017 were adversely impacted by an $827,000 tax provision related to the Tax Cuts and Jobs Act of
Slide 14: Financial Performance: 2017 vs. 2016
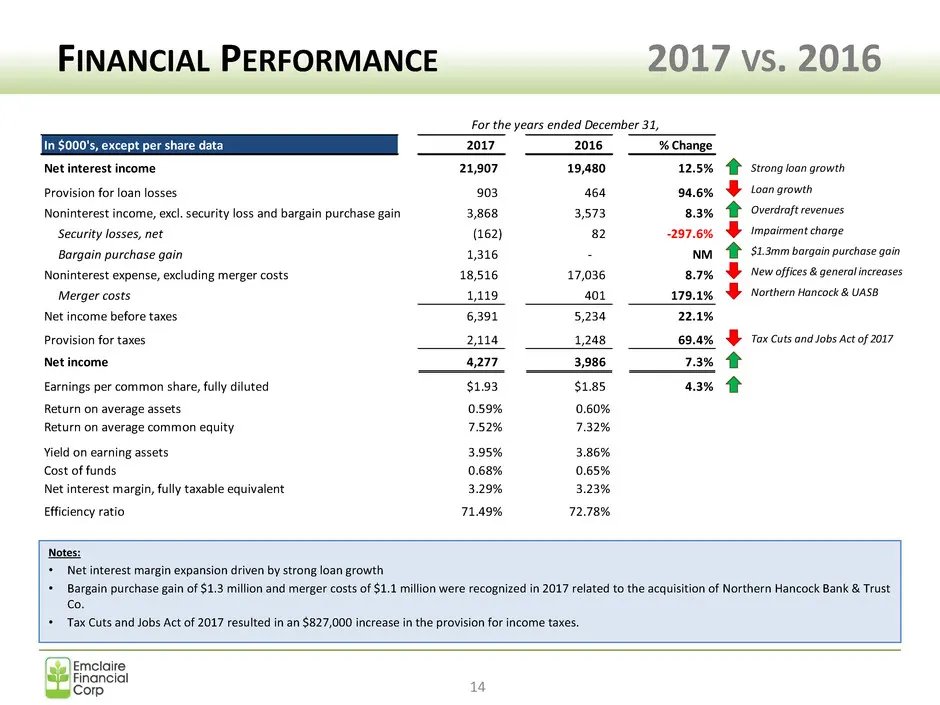
FINANCIAL PERFORMANCE 2017 VS. 2016 14 Notes: • Net interest margin expansion driven by strong loan growth • Bargain purchase gain of $1.3 million and merger costs of $1.1 million were recognized in 2017 related to the acquisition of Northern Hancock Bank & Trust Co. • Tax Cuts and Jobs Act of 2017
Slide 15: Financial Performance: Asset Quality
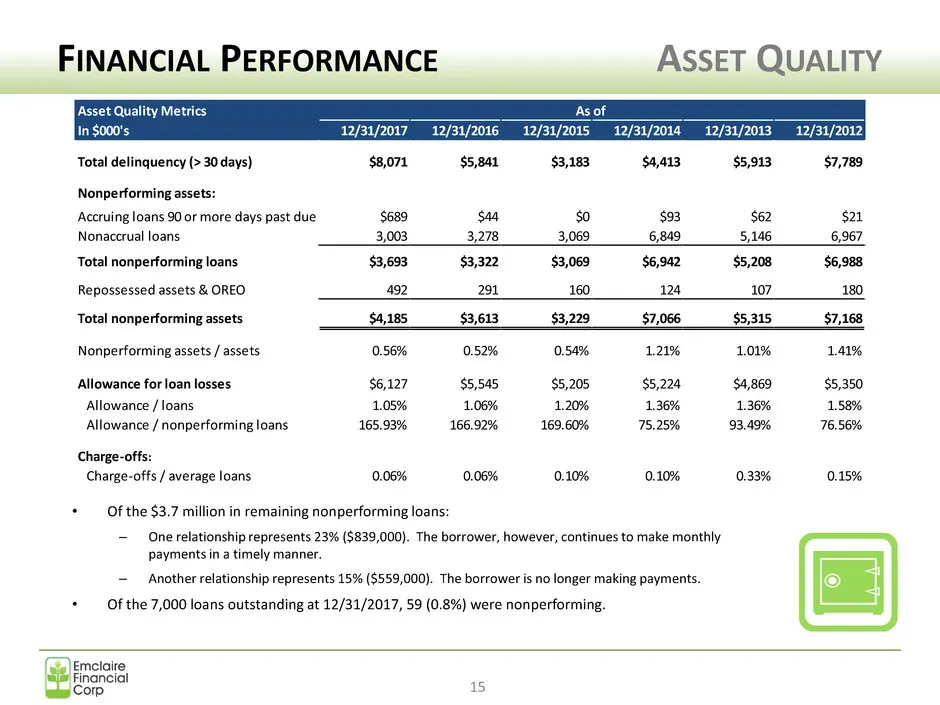
FINANCIAL PERFORMANCE ASSET QUALITY 15 • Of the $3.7 million in remaining nonperforming loans: – One relationship represents 23% ($839,000). The borrower, however, continues to make monthly payments in a timely manner. – Another relationship represents 15% ($559,000). The borrower is no longer makin
Slide 16: Financial Performance: Nonperforming Assets
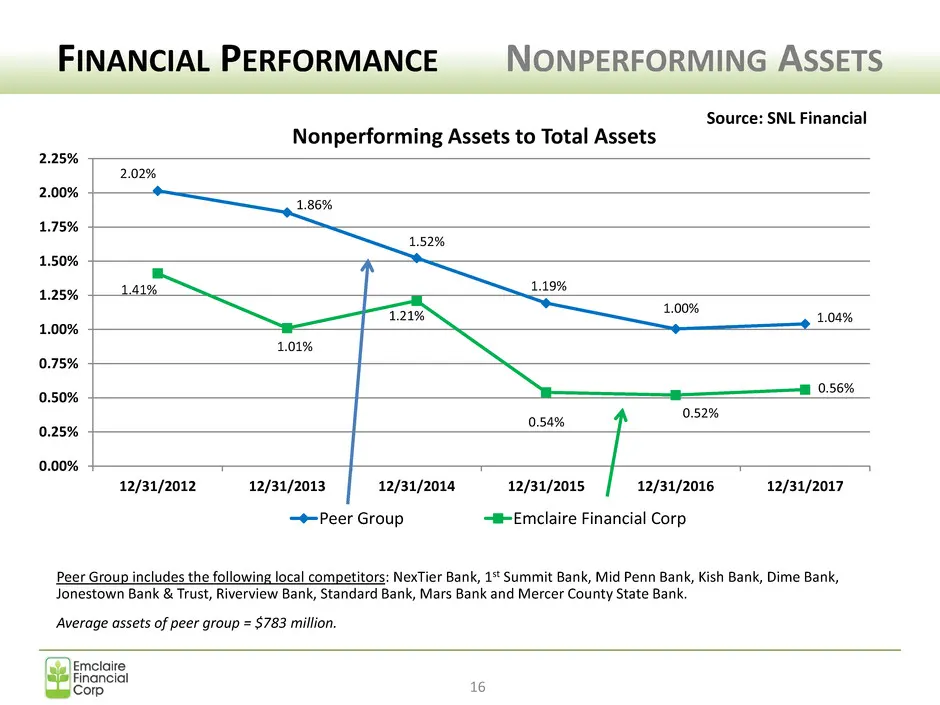
2.02% 1.86% 1.52% 1.19% 1.00% 1.04% 1.41% 1.01% 1.21% 0.54% 0.52% 0.56% 0.00% 0.25% 0.50% 0.75% 1.00% 1.25% 1.50% 1.75% 2.00% 2.25% 12/31/2012 12/31/2013 12/31/2014 12/31/2015 12/31/2016 12/31/2017 Nonperforming Assets to Total Assets Peer Group Emclaire Financial Corp FINANCIAL PERFORMANCE NONPERFO
Slide 17: Financial Performance: Dividend Recap
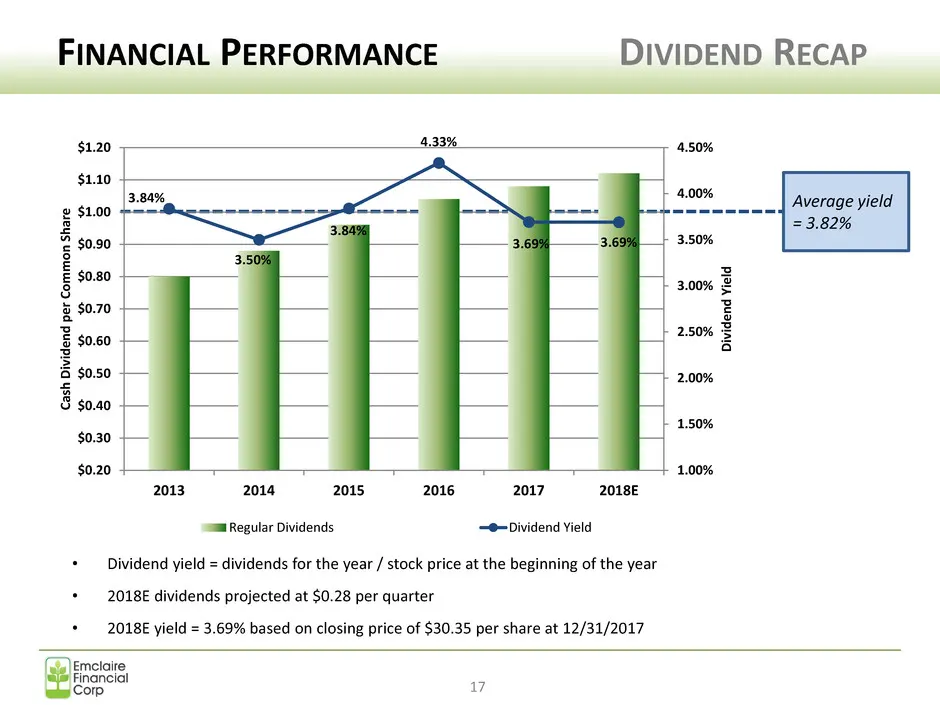
FINANCIAL PERFORMANCE DIVIDEND RECAP 17 • Dividend yield = dividends for the year / stock price at the beginning of the year • 2018E dividends projected at $0.28 per quarter • 2018E yield = 3.69% based on closing price of $30.35 per share at 12/31/2017 Average yield = 3.82% 3.84% 3.50% 3.84% 4.33% 3
Slide 18: Financial Performance: Q1-2018 Balance Sheet
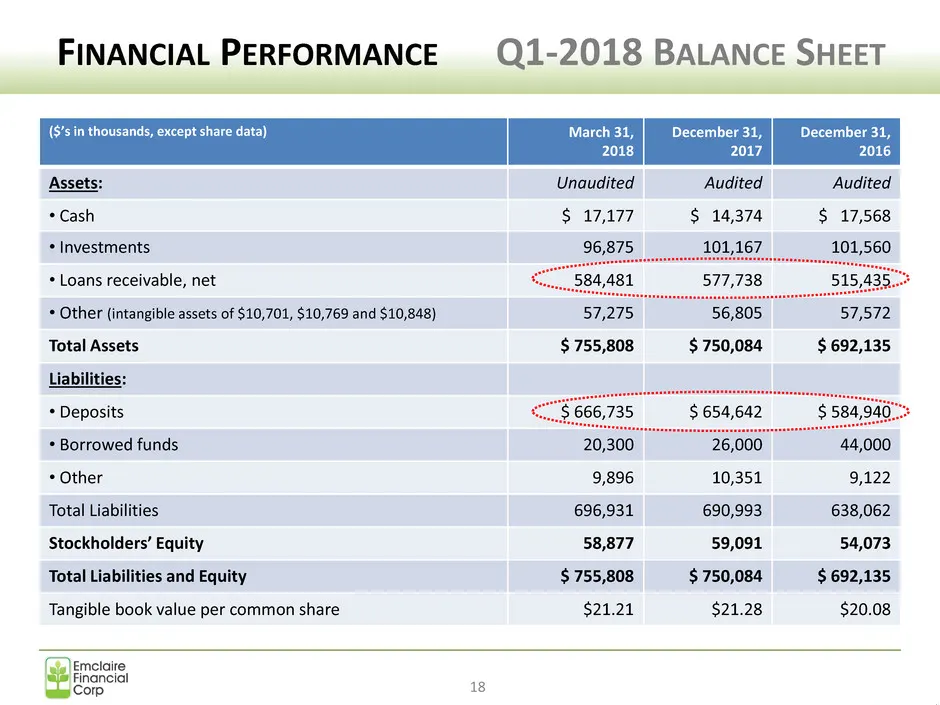
FINANCIAL PERFORMANCE Q1-2018 BALANCE SHEET 18 ($’s in thousands, except share data) March 31, 2018 December 31, 2017 December 31, 2016 Assets: Unaudited Audited Audited • Cash $ 17,177 $ 14,374 $ 17,568 • Investments 96,875 101,167 101,560 • Loans receivable, net 584,481 577,738 515,435 • Other (in
Slide 19: Financial Performance: Q1-2018 Earnings
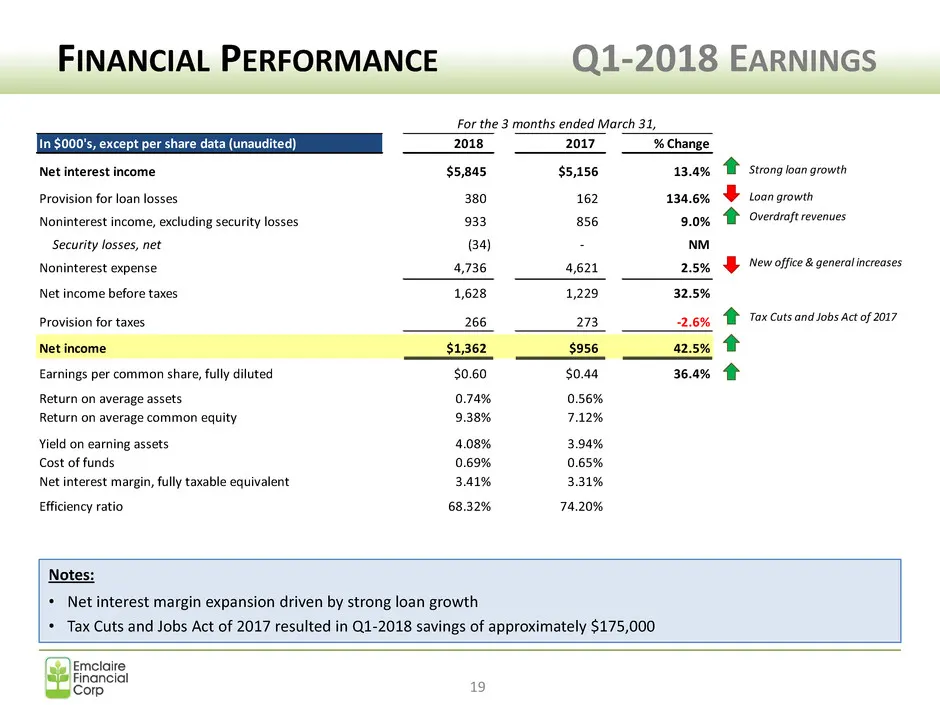
FINANCIAL PERFORMANCE Q1-2018 EARNINGS 19 Notes: • Net interest margin expansion driven by strong loan growth • Tax Cuts and Jobs Act of 2017 resulted in Q1-2018 savings of approximately $175,000 In $000's, except per share data (unaudited) 2018 2017 % Change Net interest income $5,845 $5,156 13.4%

Slide 20: Looking Ahead
20 Looking Ahead• • • • • •
Slide 21: Our Franchise
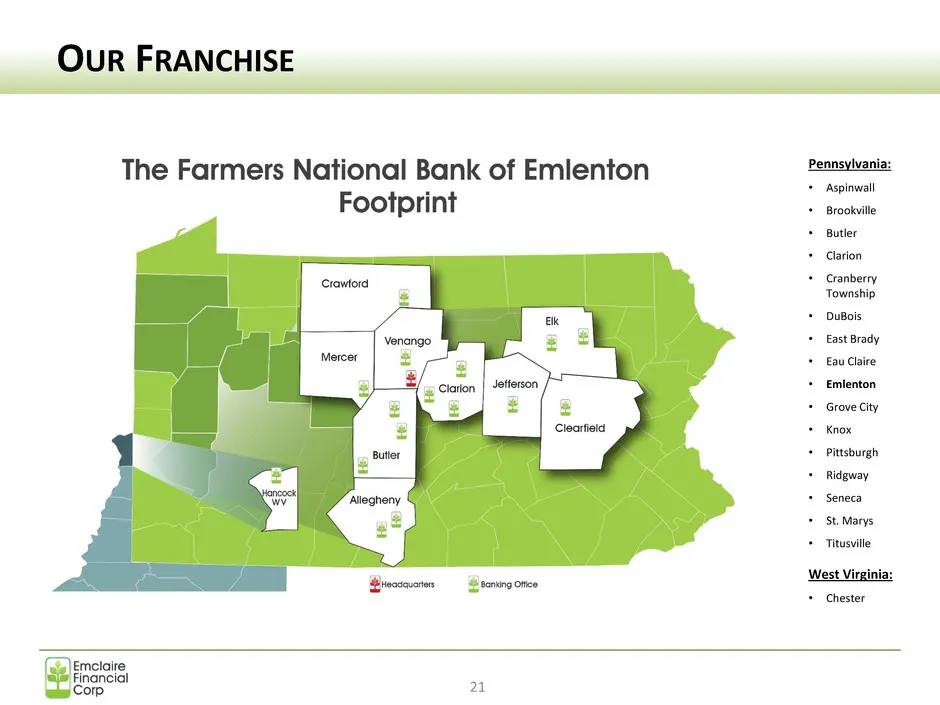
OUR FRANCHISE 21 Pennsylvania: • Aspinwall • Brookville • Butler • Clarion • Cranberry Township • DuBois • East Brady • Eau Claire • Emlenton • Grove City • Knox • Pittsburgh • Ridgway • Seneca • St. Marys • Titusville West Virginia: • Chester
Slide 22: Market Assessment: Current Counties
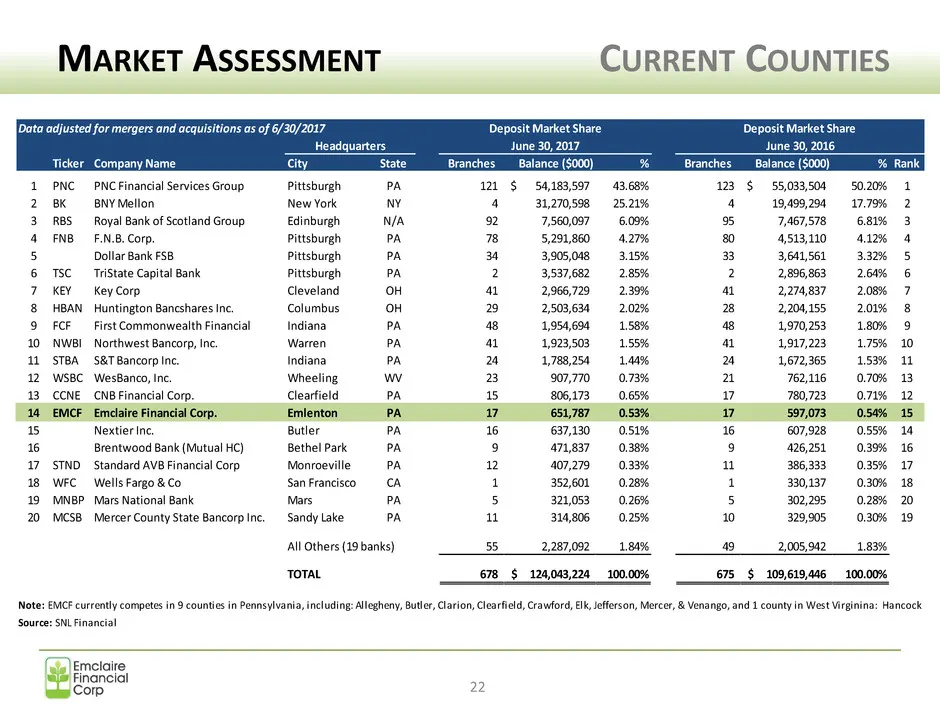
MARKET ASSESSMENT CURRENT COUNTIES Data adjusted for mergers and acquisitions as of 6/30/2017 Ticker Company Name City State Branches Balance ($000) % Branches Balance ($000) % Rank 1 PNC PNC Financial Services Group Pittsburgh PA 121 54,183,597$ 43.68% 123 55,033,504$ 50.20% 1 2 BK BNY Mellon New Y
Slide 23: Market Assessment: County Data
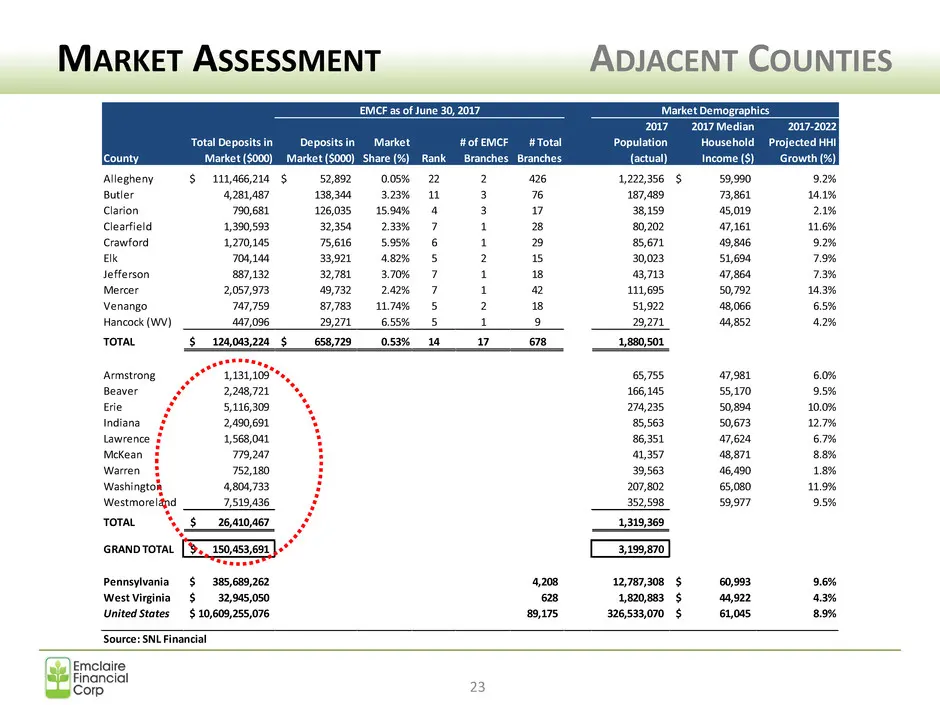
County Allegheny 111,466,214$ 52,892$ 0.05% 22 2 426 1,222,356 59,990$ 9.2% Butler 4,281,487 138,344 3.23% 11 3 76 187,489 73,861 14.1% Clarion 790,681 126,035 15.94% 4 3 17 38,159 45,019 2.1% Clearfield 1,390,593 32,354 2.33% 7 1 28 80,202 47,161 11.6% Crawford 1,270,145 75,616 5.95% 6 1 29 85,671
Slide 24: Strategy Recap
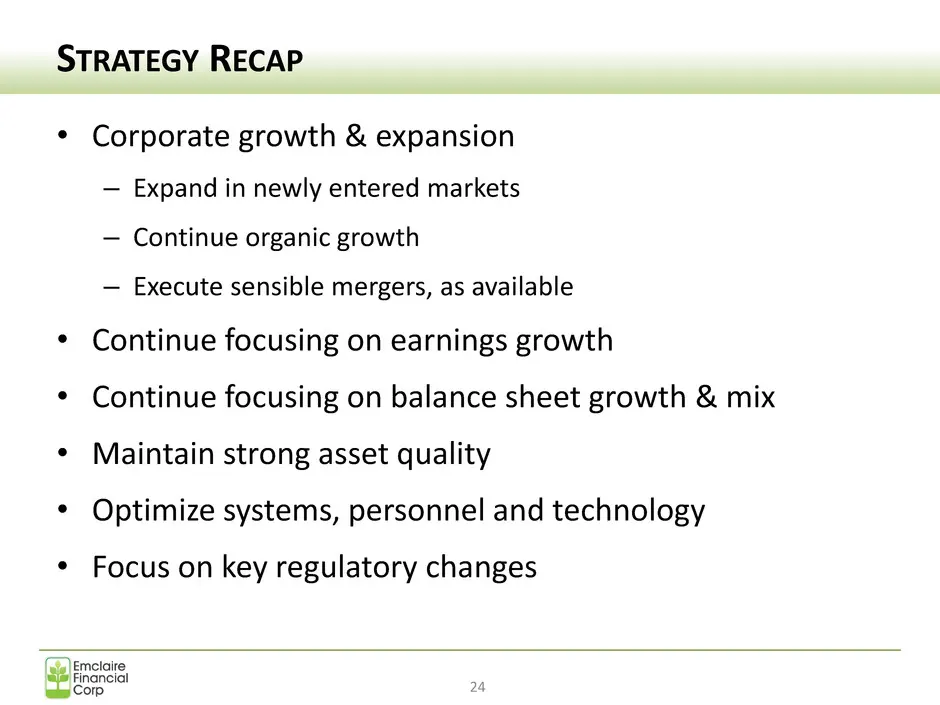
STRATEGY RECAP • Corporate growth & expansion – Expand in newly entered markets – Continue organic growth – Execute sensible mergers, as available • Continue focusing on earnings growth • Continue focusing on balance sheet growth & mix • Maintain strong asset quality • Optimize systems, personnel an
Slide 25: Strategic Elements for Success
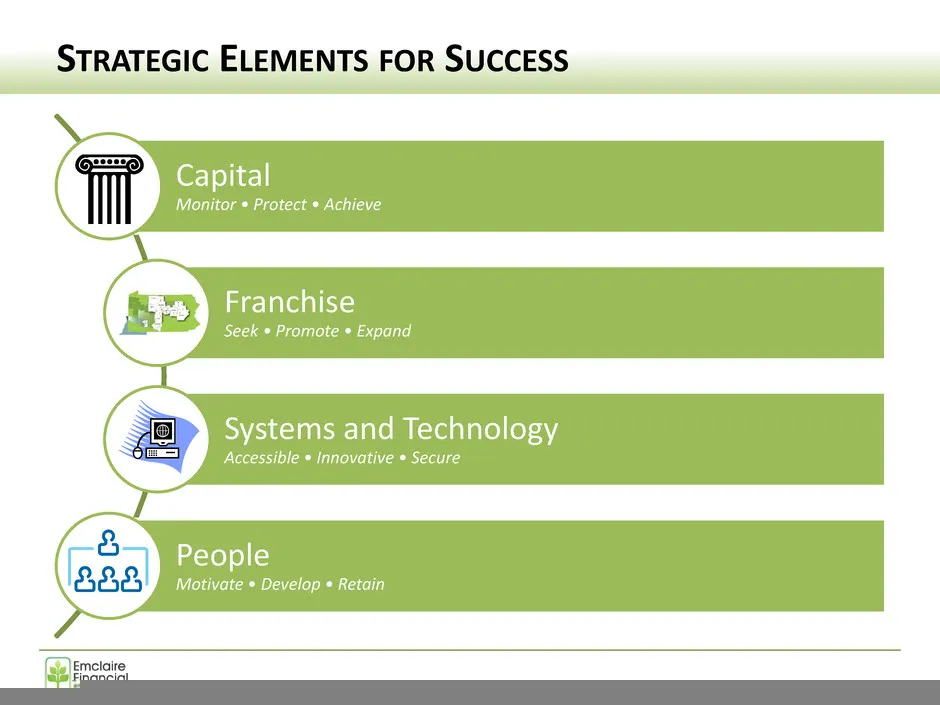
STRATEGIC ELEMENTS FOR SUCCESS 25 Capital Monitor • Protect • Achieve Franchise Seek • Promote • Expand Systems and Technology Accessible • Innovative • Secure People Motivate • Develop • Retain
Slide 26: Questions and Answers
Questions and Answers Q&A SESSION 26
Slide 27: Closing and Thank You
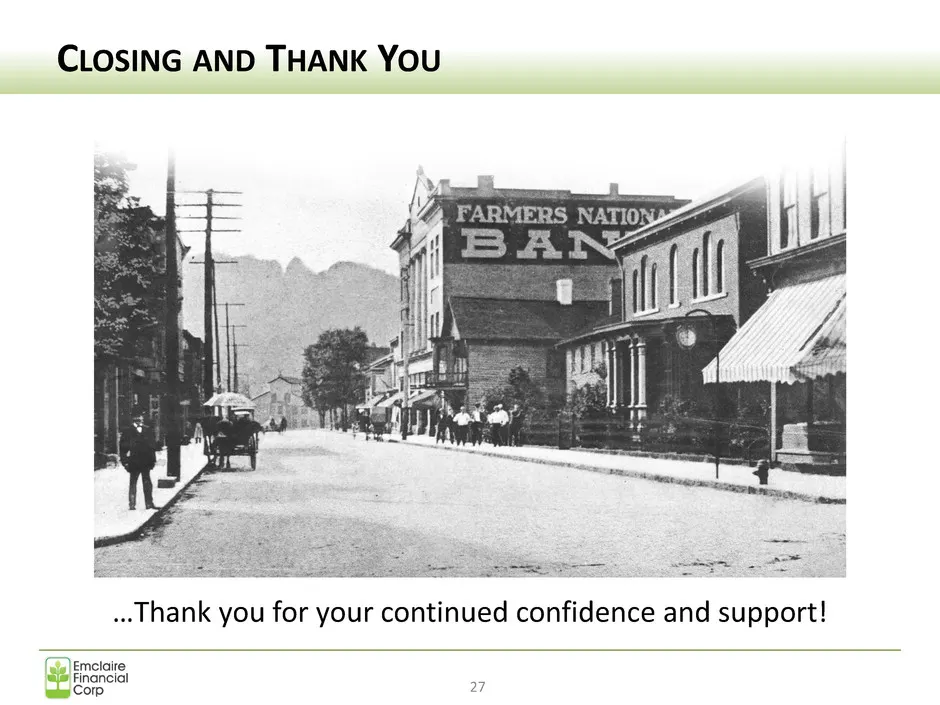
CLOSING AND THANK YOU 27 …Thank you for your continued confidence and support!
Slide 28: Special Thank You
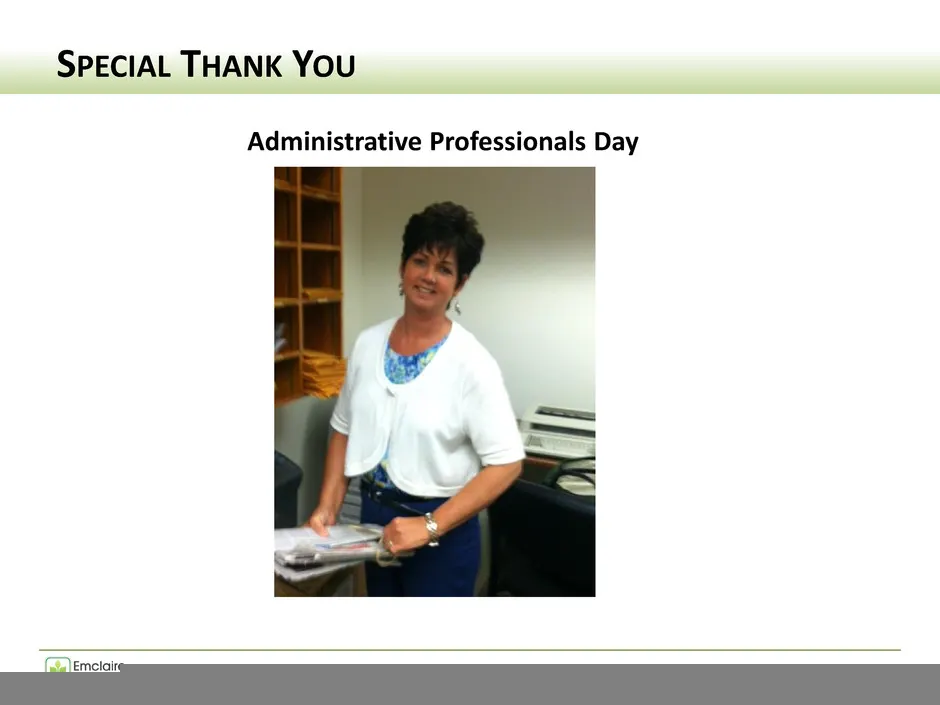
SPECIAL THANK YOU Administrative Professionals Day 28
Source: SEC EDGAR · 8-K filed Apr 25, 2018
More decks from Emclaire Financial Corp
 Merger or Acquisition (March 2022)13 slides · Mar 24, 2022
 Shareholder Meeting (April 2021)36 slides · Apr 21, 2021
 Shareholder Meeting (April 2020)32 slides · Apr 22, 2020
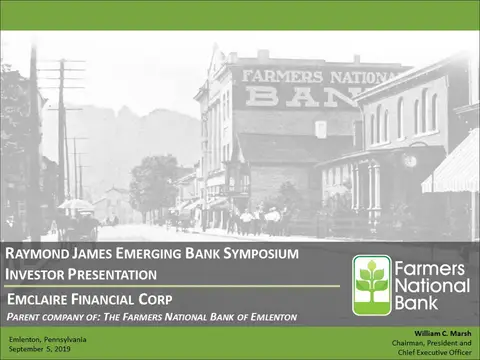 Raymond James Emerging Bank Symposium (September 2019)23 slides · Sep 4, 2019
 Shareholder Meeting (April 2019)32 slides · Apr 24, 2019
 Investor Presentation (December 2017)21 slides · Dec 6, 2017