Consumers Energy Company · NYSE:CMS/PB
Consumers Energy — Deutsche Bank Clean Technology, Utilities & Power Conference 2013
41 slides from Consumers Energy's conference presentation, May 13, 2013
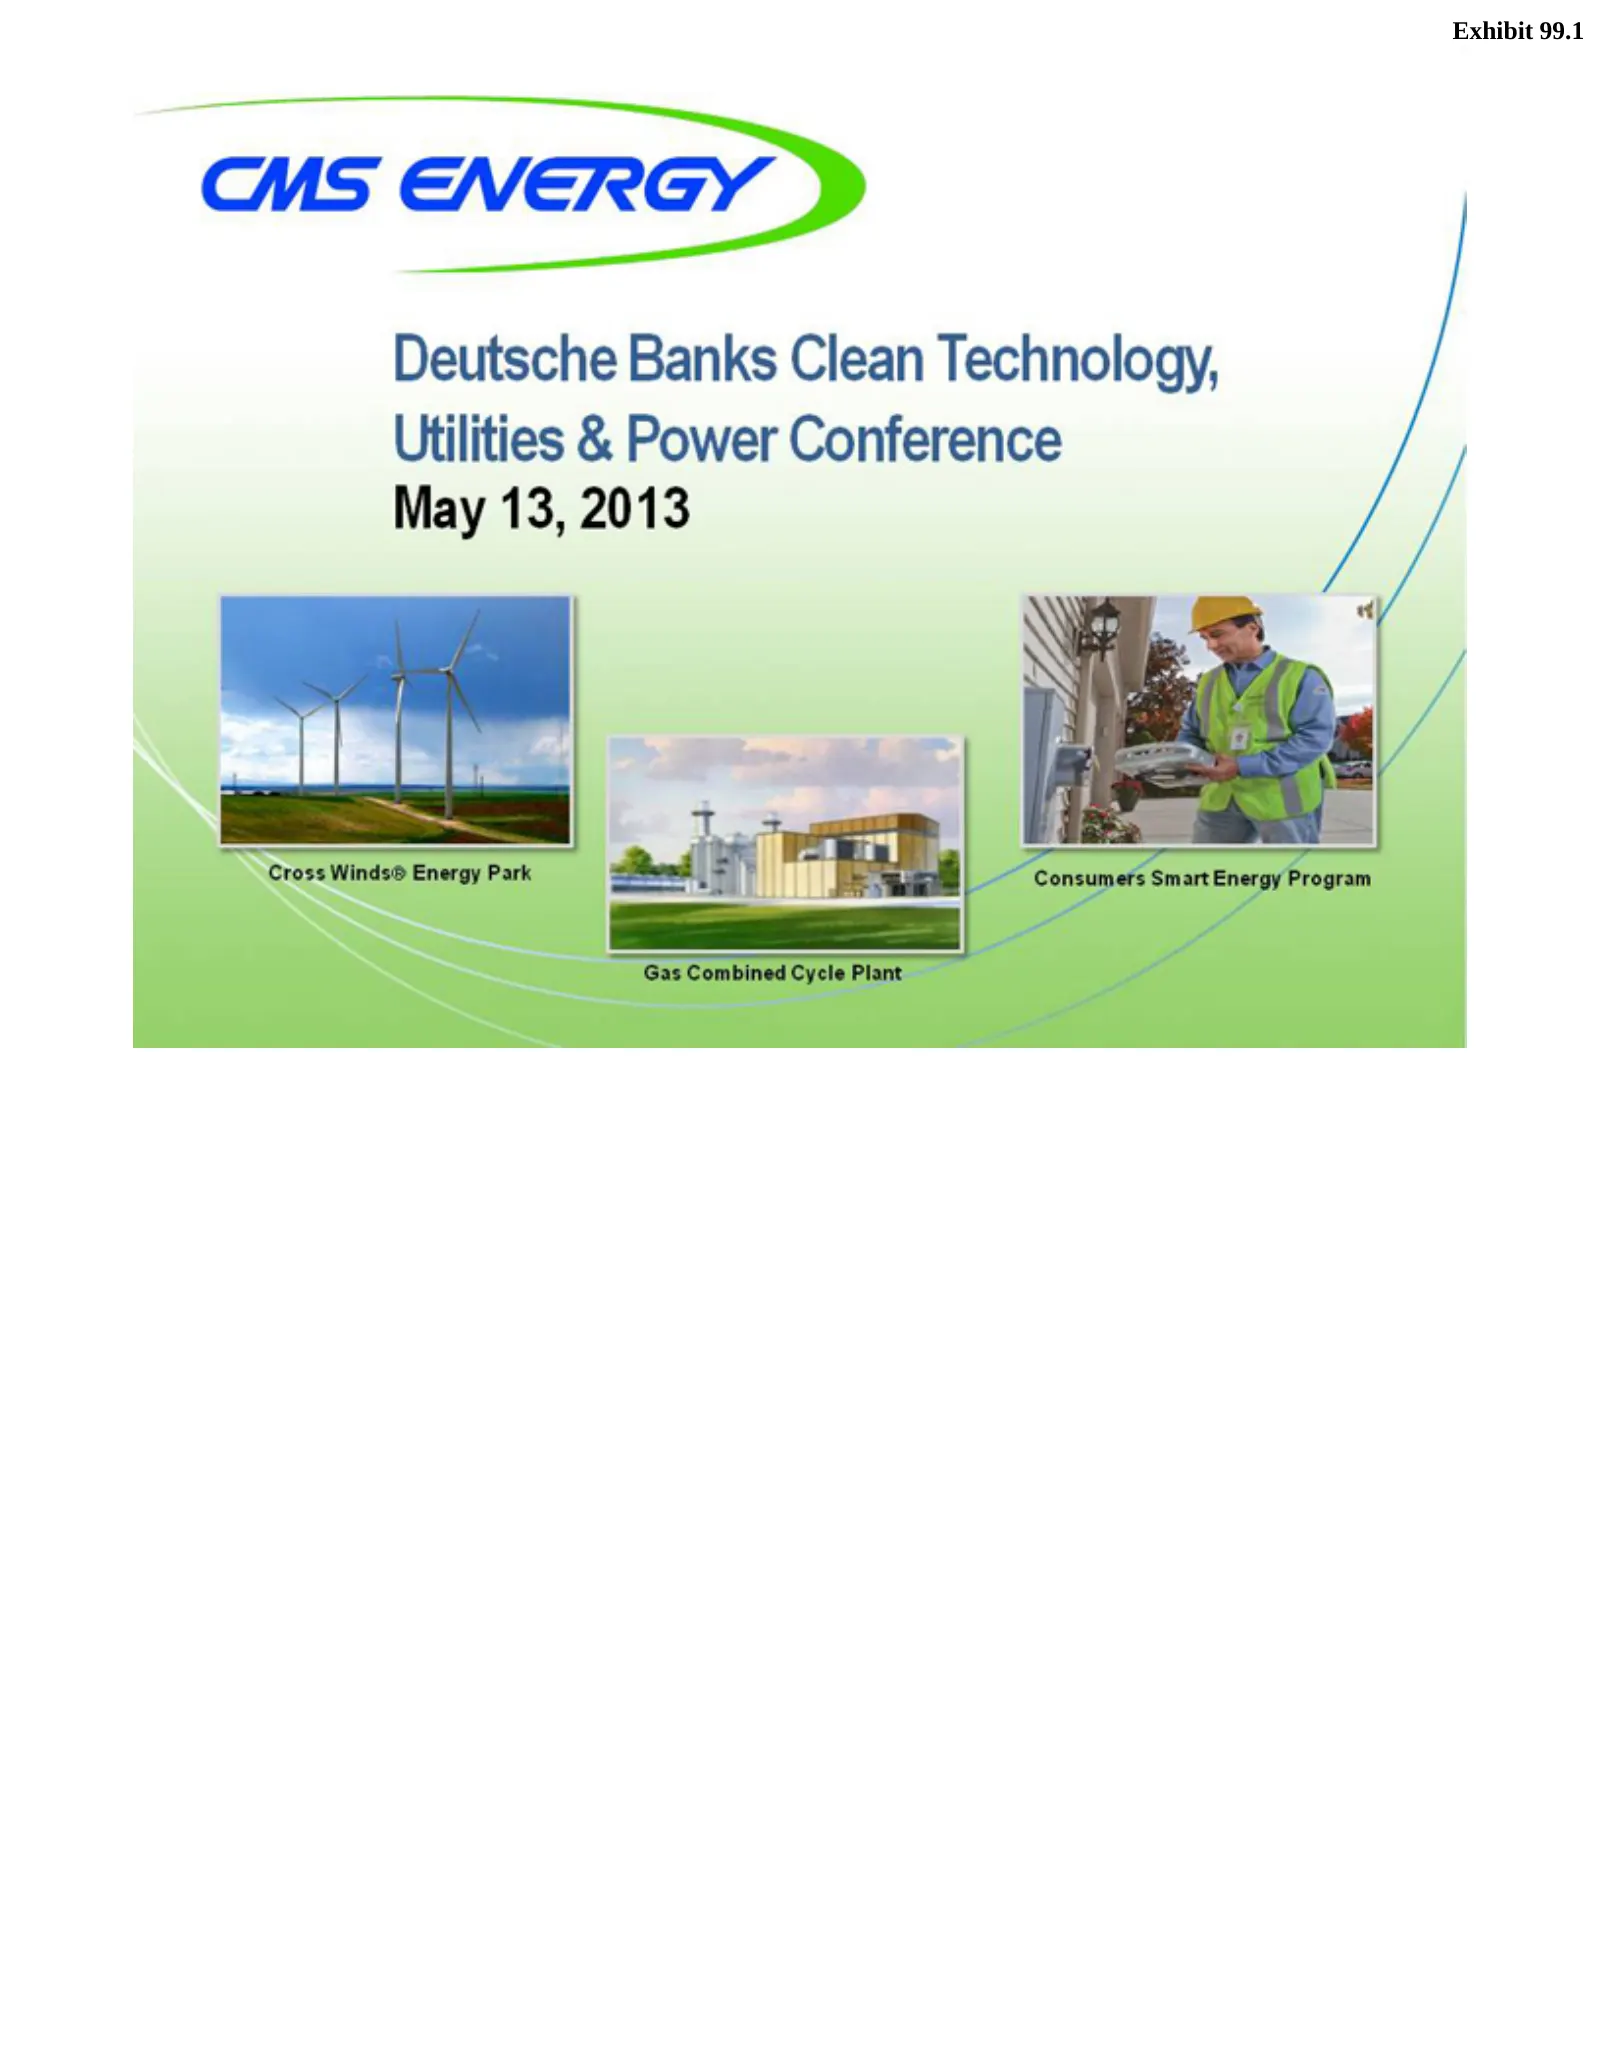
Slide 1: Deutsche Bank Clean Technology, Utilities & Power Conference
Exhibit 99.1 CMSCombined Deutsche May Cross Gas Consumers 13, ENERGY Winds® 2013 Banks Smart Energy Cycle Clean Energy Plant Park Technology, Program Utilities & Power Conference
Slide 2: Forward-Looking Statements and Information
Thisyear Securities They the sections statements. The comparable CMS company’s potential 1 guidance. presentation presentation should ENERGY Energy ended are toExchange present CMS impact, GAAP incorporated be provides December read also Energy isoperating measure favorably made Act inincludes finan
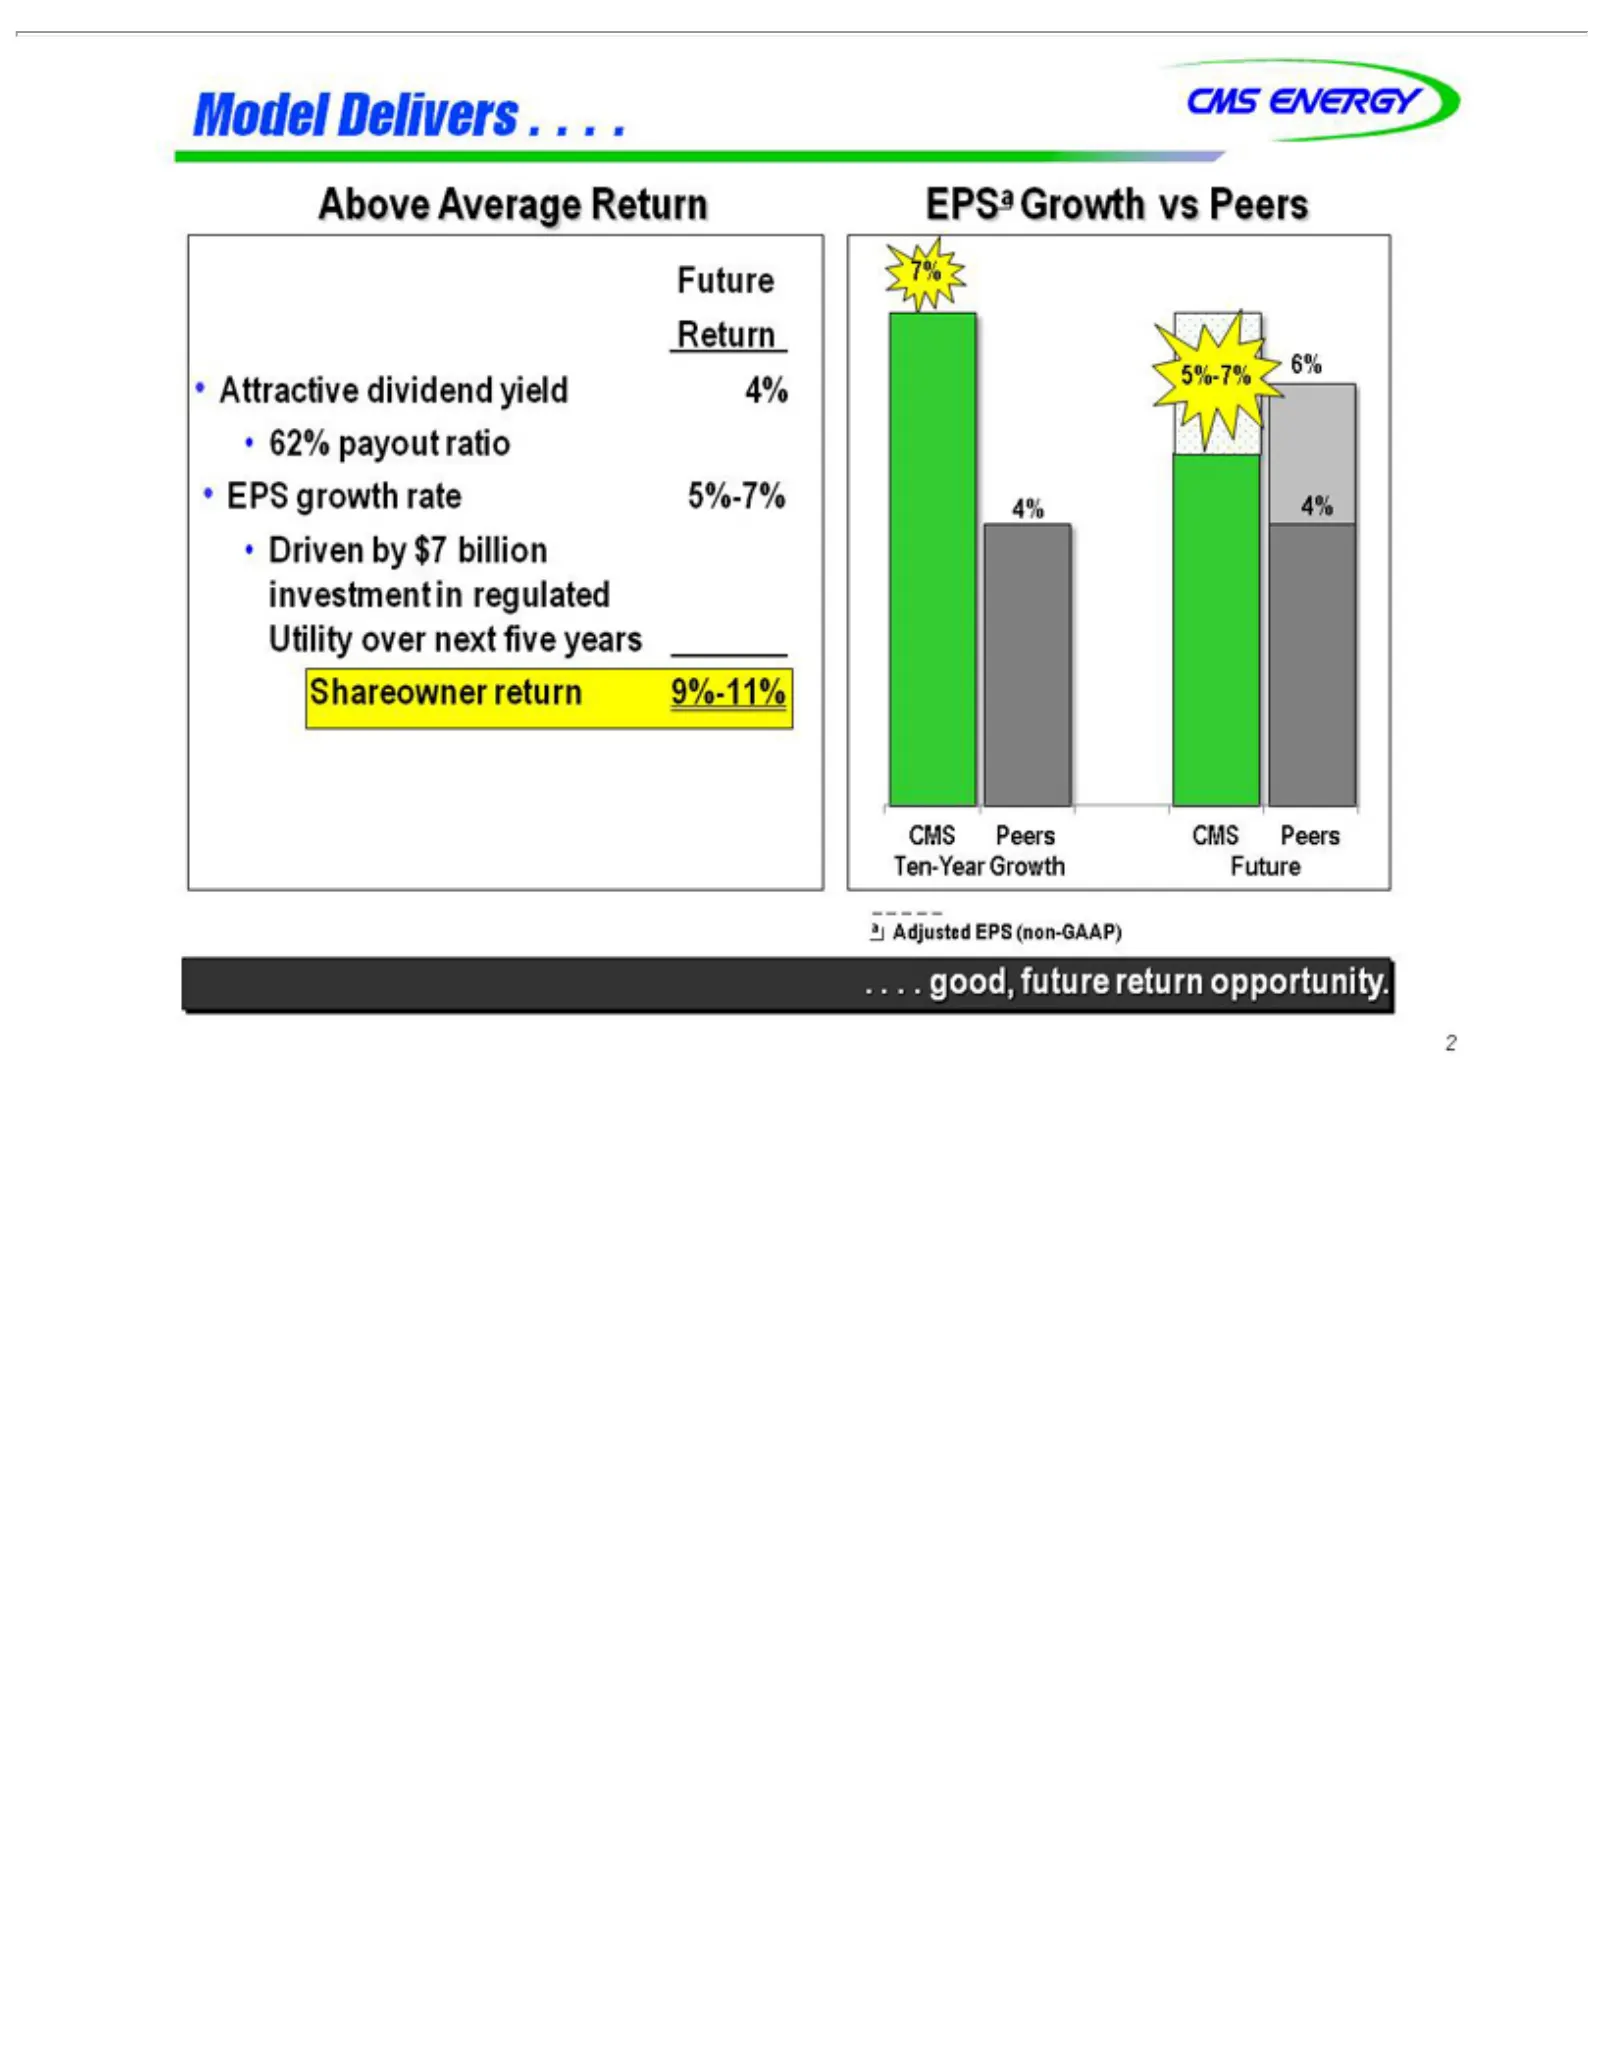
Slide 3: CMS Energy Delivers Above-Average Return Model
Model Above Return •Future investment Utility Shareowner EPSa 5%-7% 7% 4% .aCMS 2 .Attractive 62% EPS Driven Adjusted . .4% good, ENERGY Peers Growth growth payout Average Delivers over 6% byEPS future in CMS dividend 5% $7 next return ratio rate regulated vsbillion Return (non-GAAP) . five Peers .r
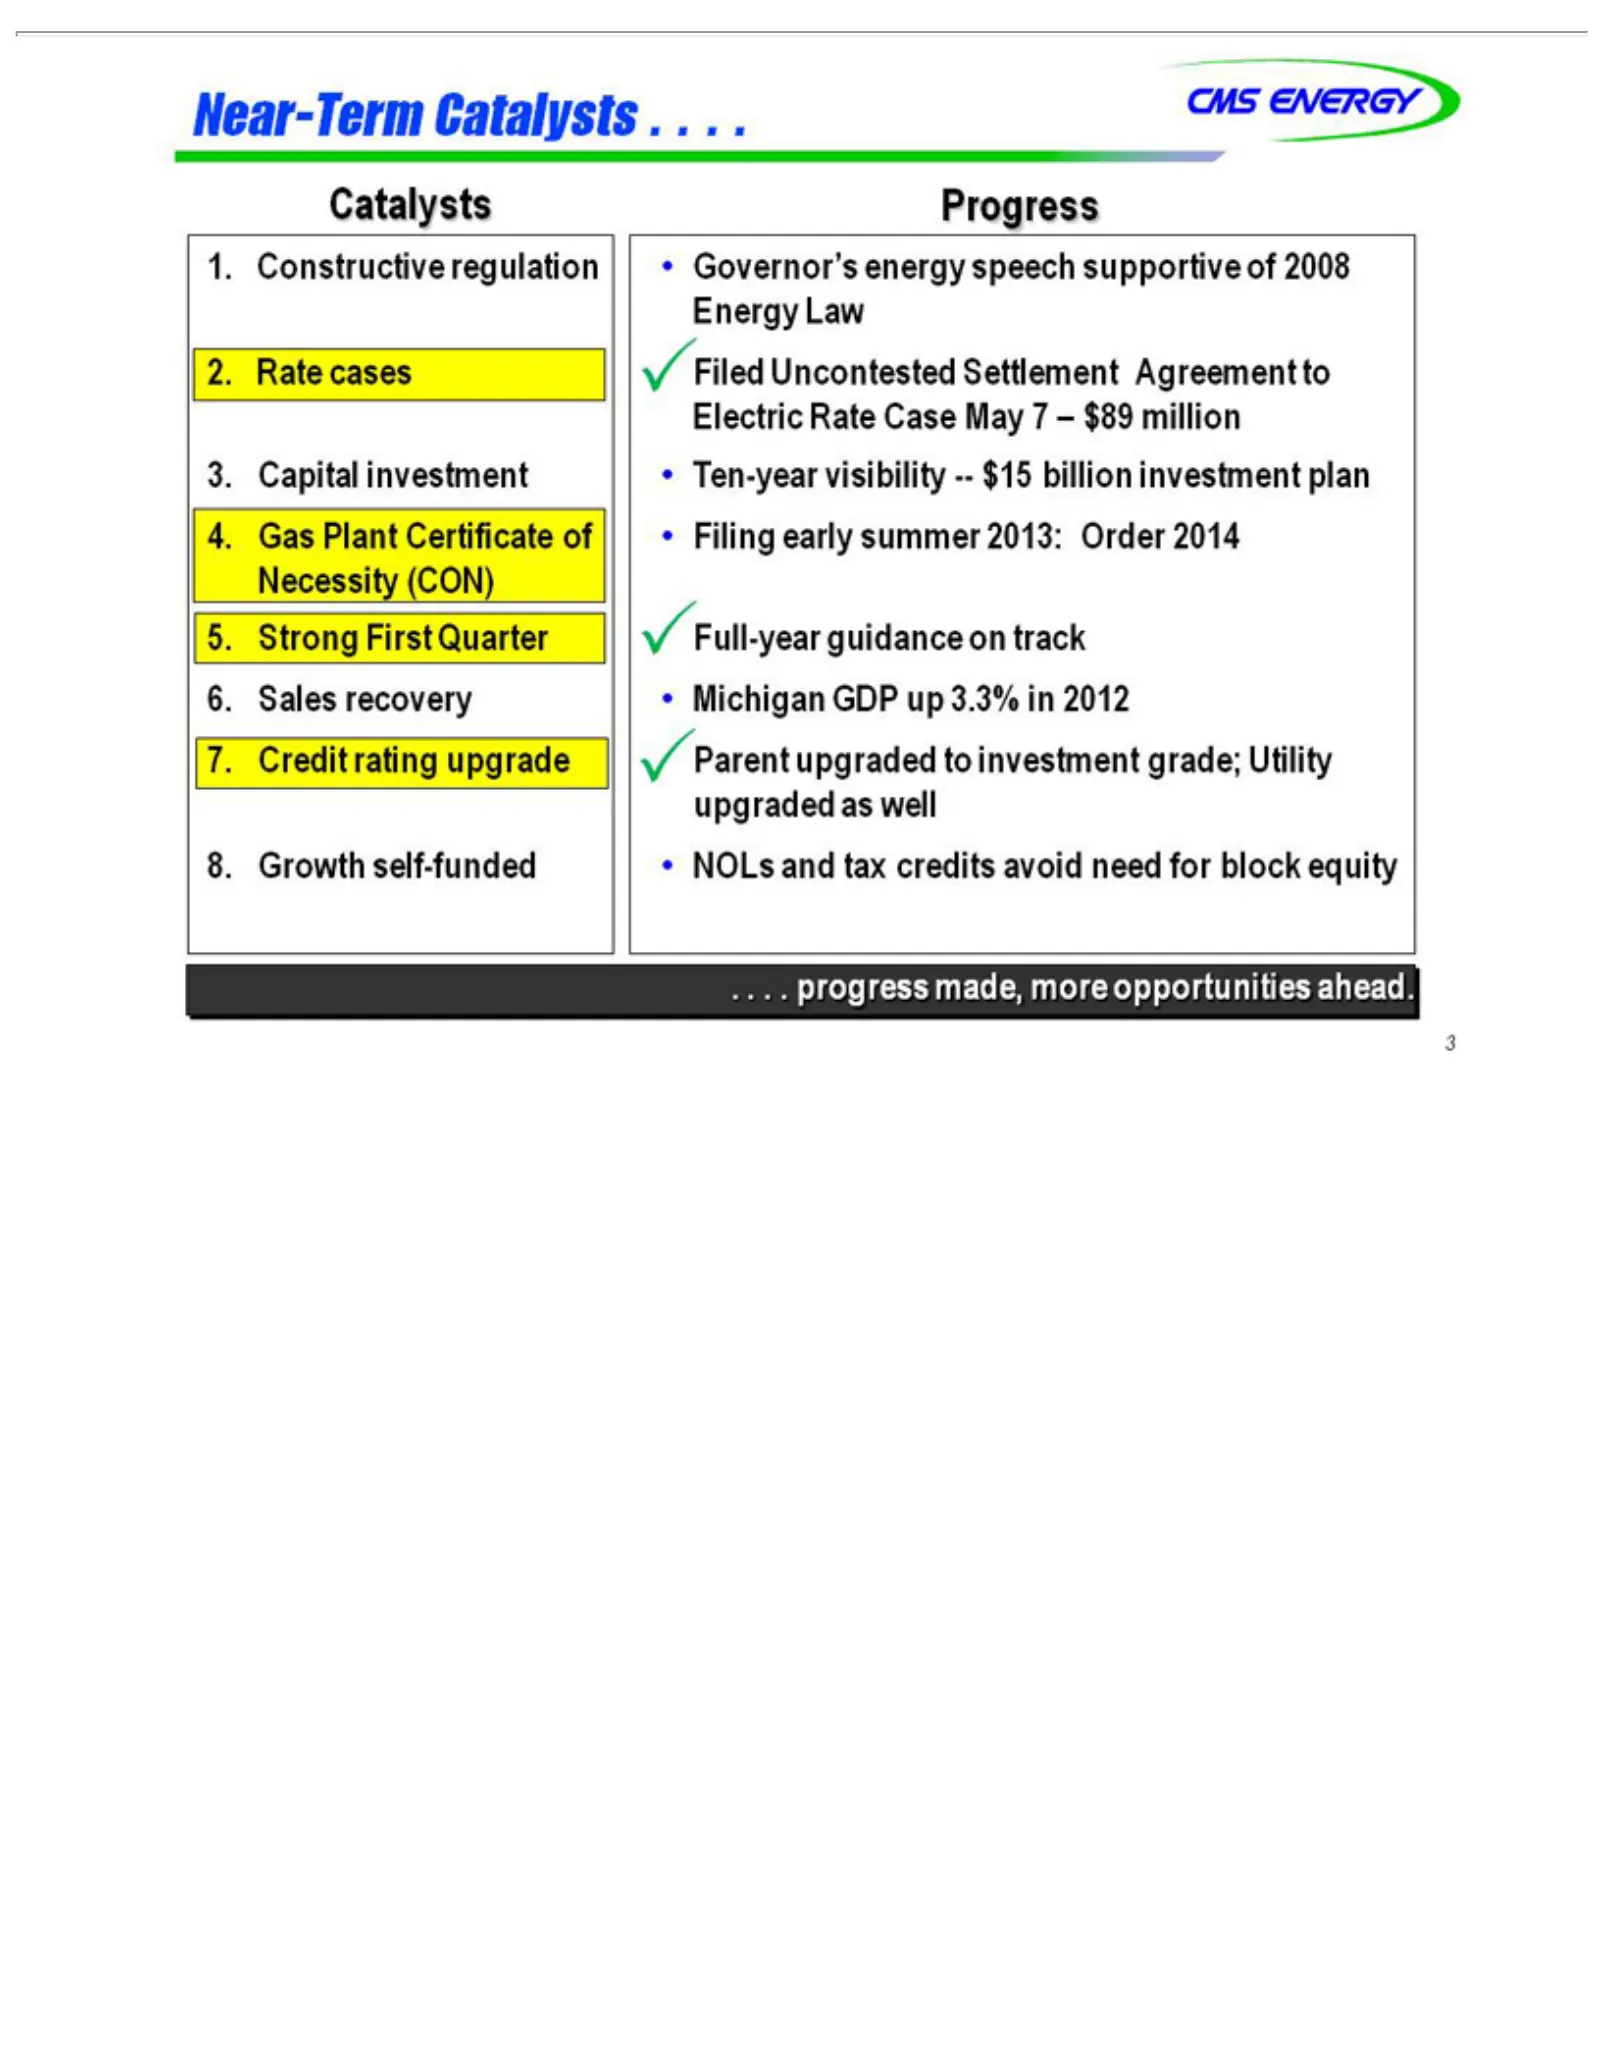
Slide 4: Near-Term CMS Catalysts
Near-Term CMS 1. Catalysts 2. 3. 4. 5. 6. 7. 8. Progress .•ü 3 .Ten-year Governor’s Filing Michigan NOLs Filed Full-year Parent Constructive Rate Capital Gas Strong Sales Credit .Growth . progress ENERGY Plant Uncontested cases early and recovery upgraded rating First investment self-funded visibili
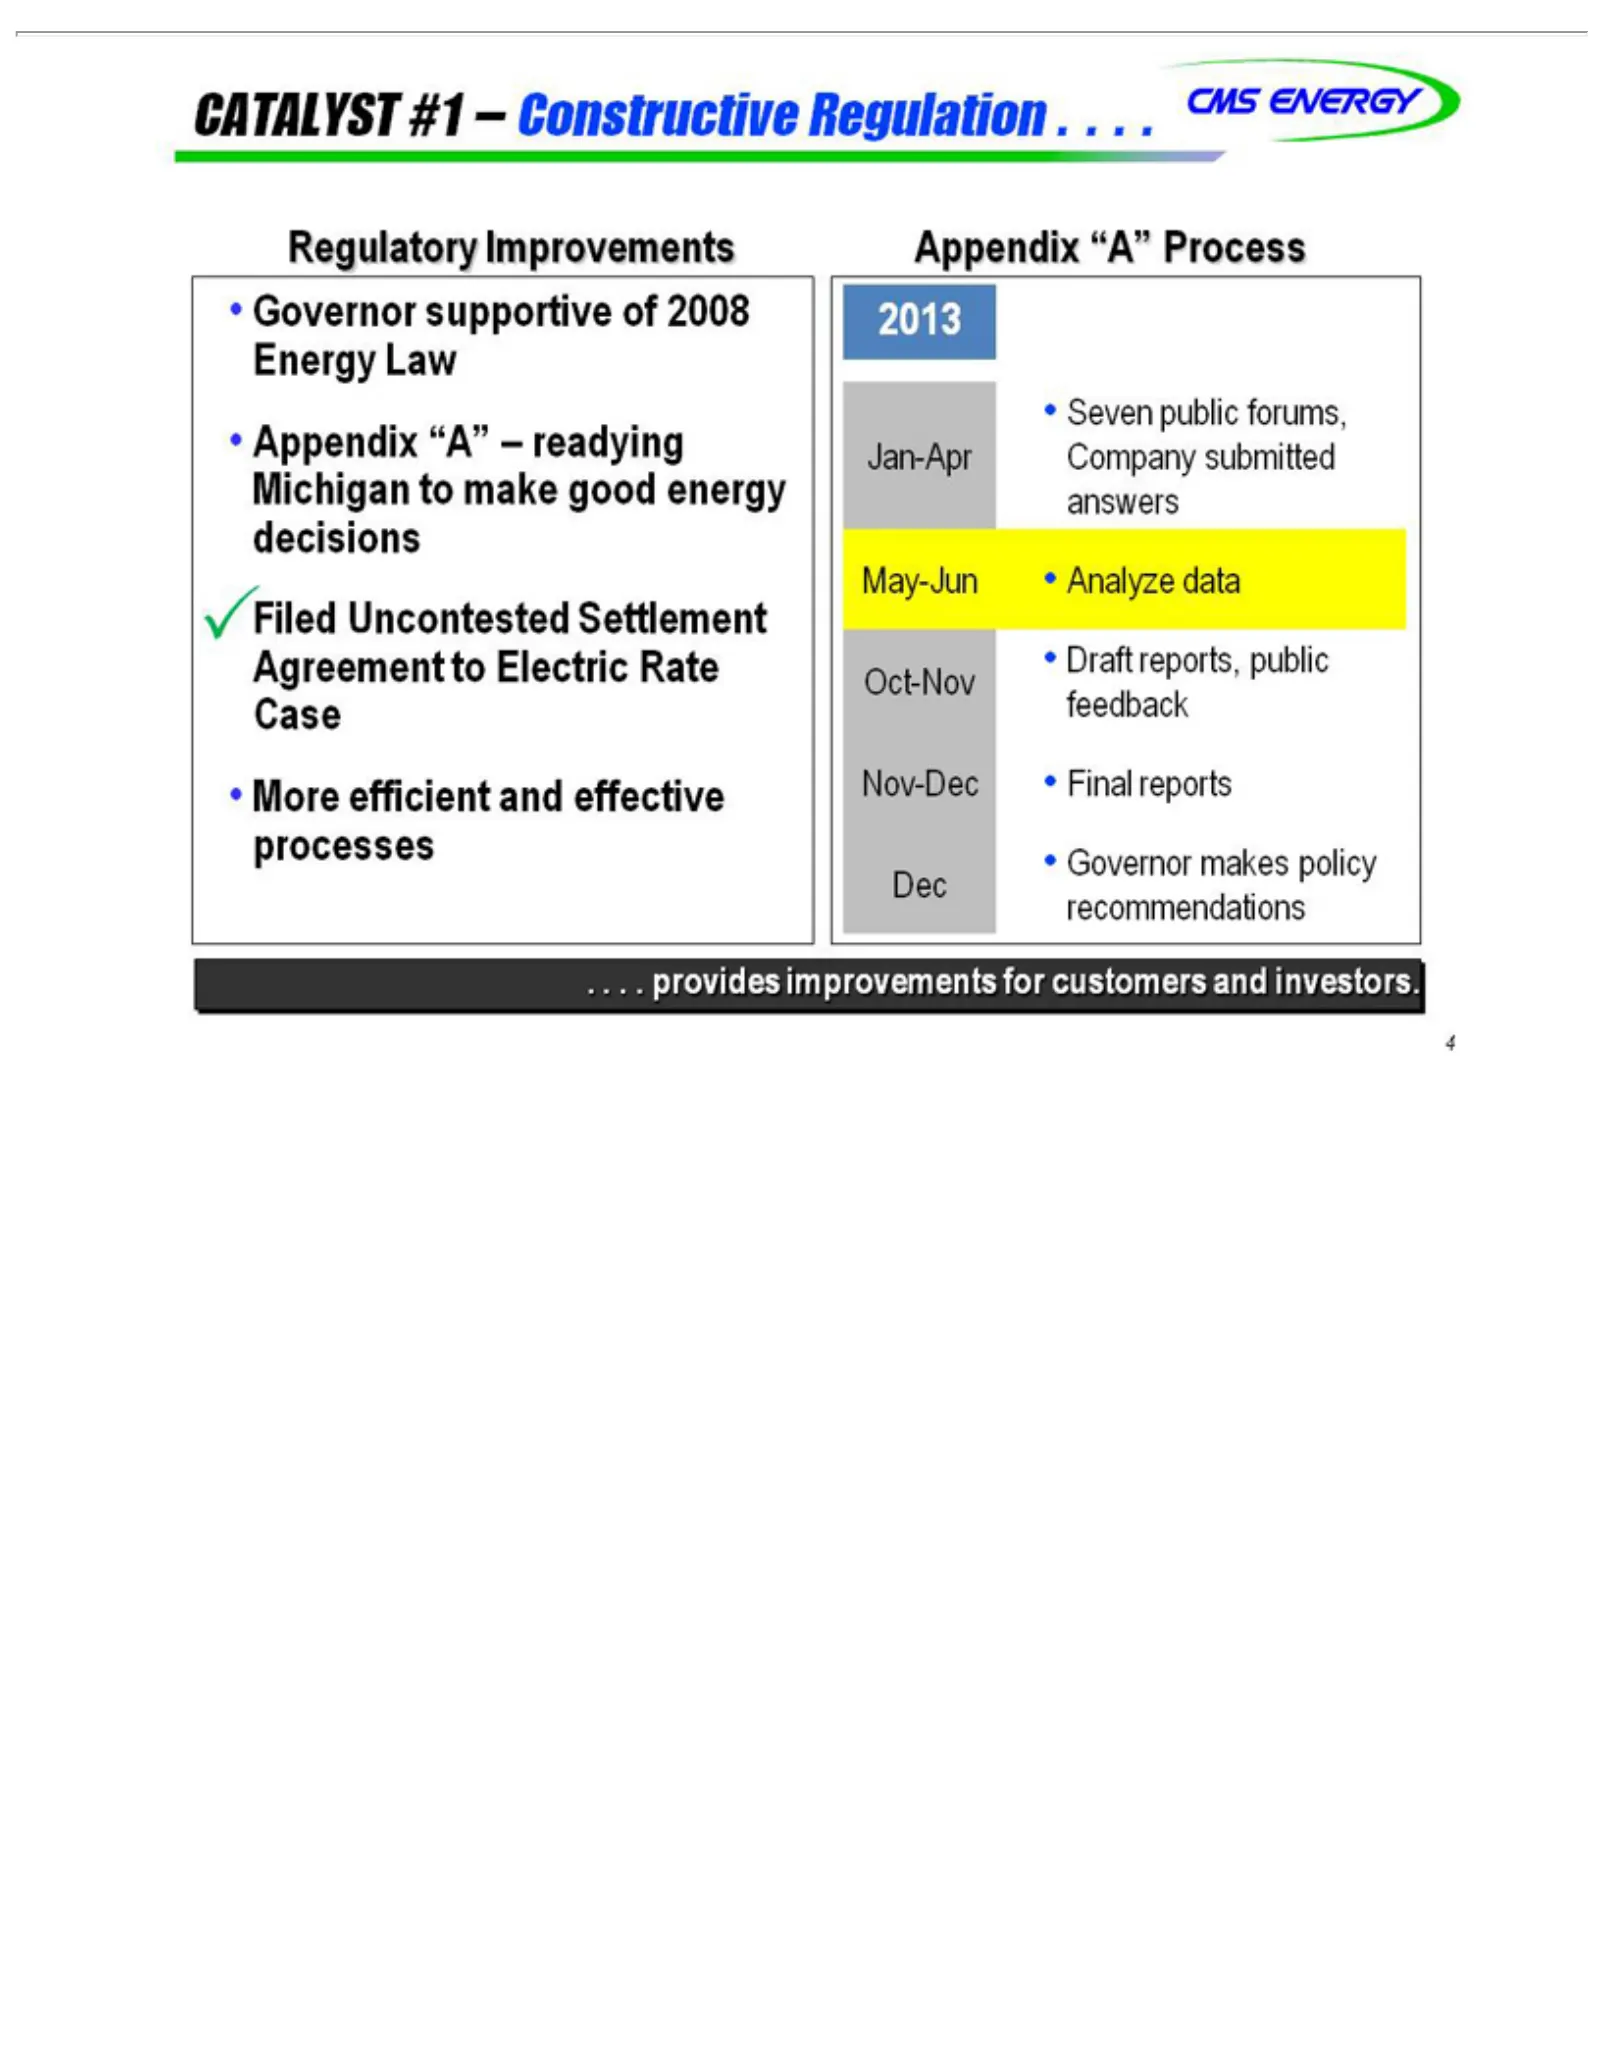
Slide 5: Catalyst 1: Regulatory Improvements
CATALYST CMS Regulatory ü Appendix .•2013 4 .Analyze Appendix More Seven Draft Final Governor Filed . . provides ENERGY reports reports, efficient Uncontested public data “A” supportive makes Improvements “A” #1improvements forums, Process public –and – Constructive readying policy effective Settlem
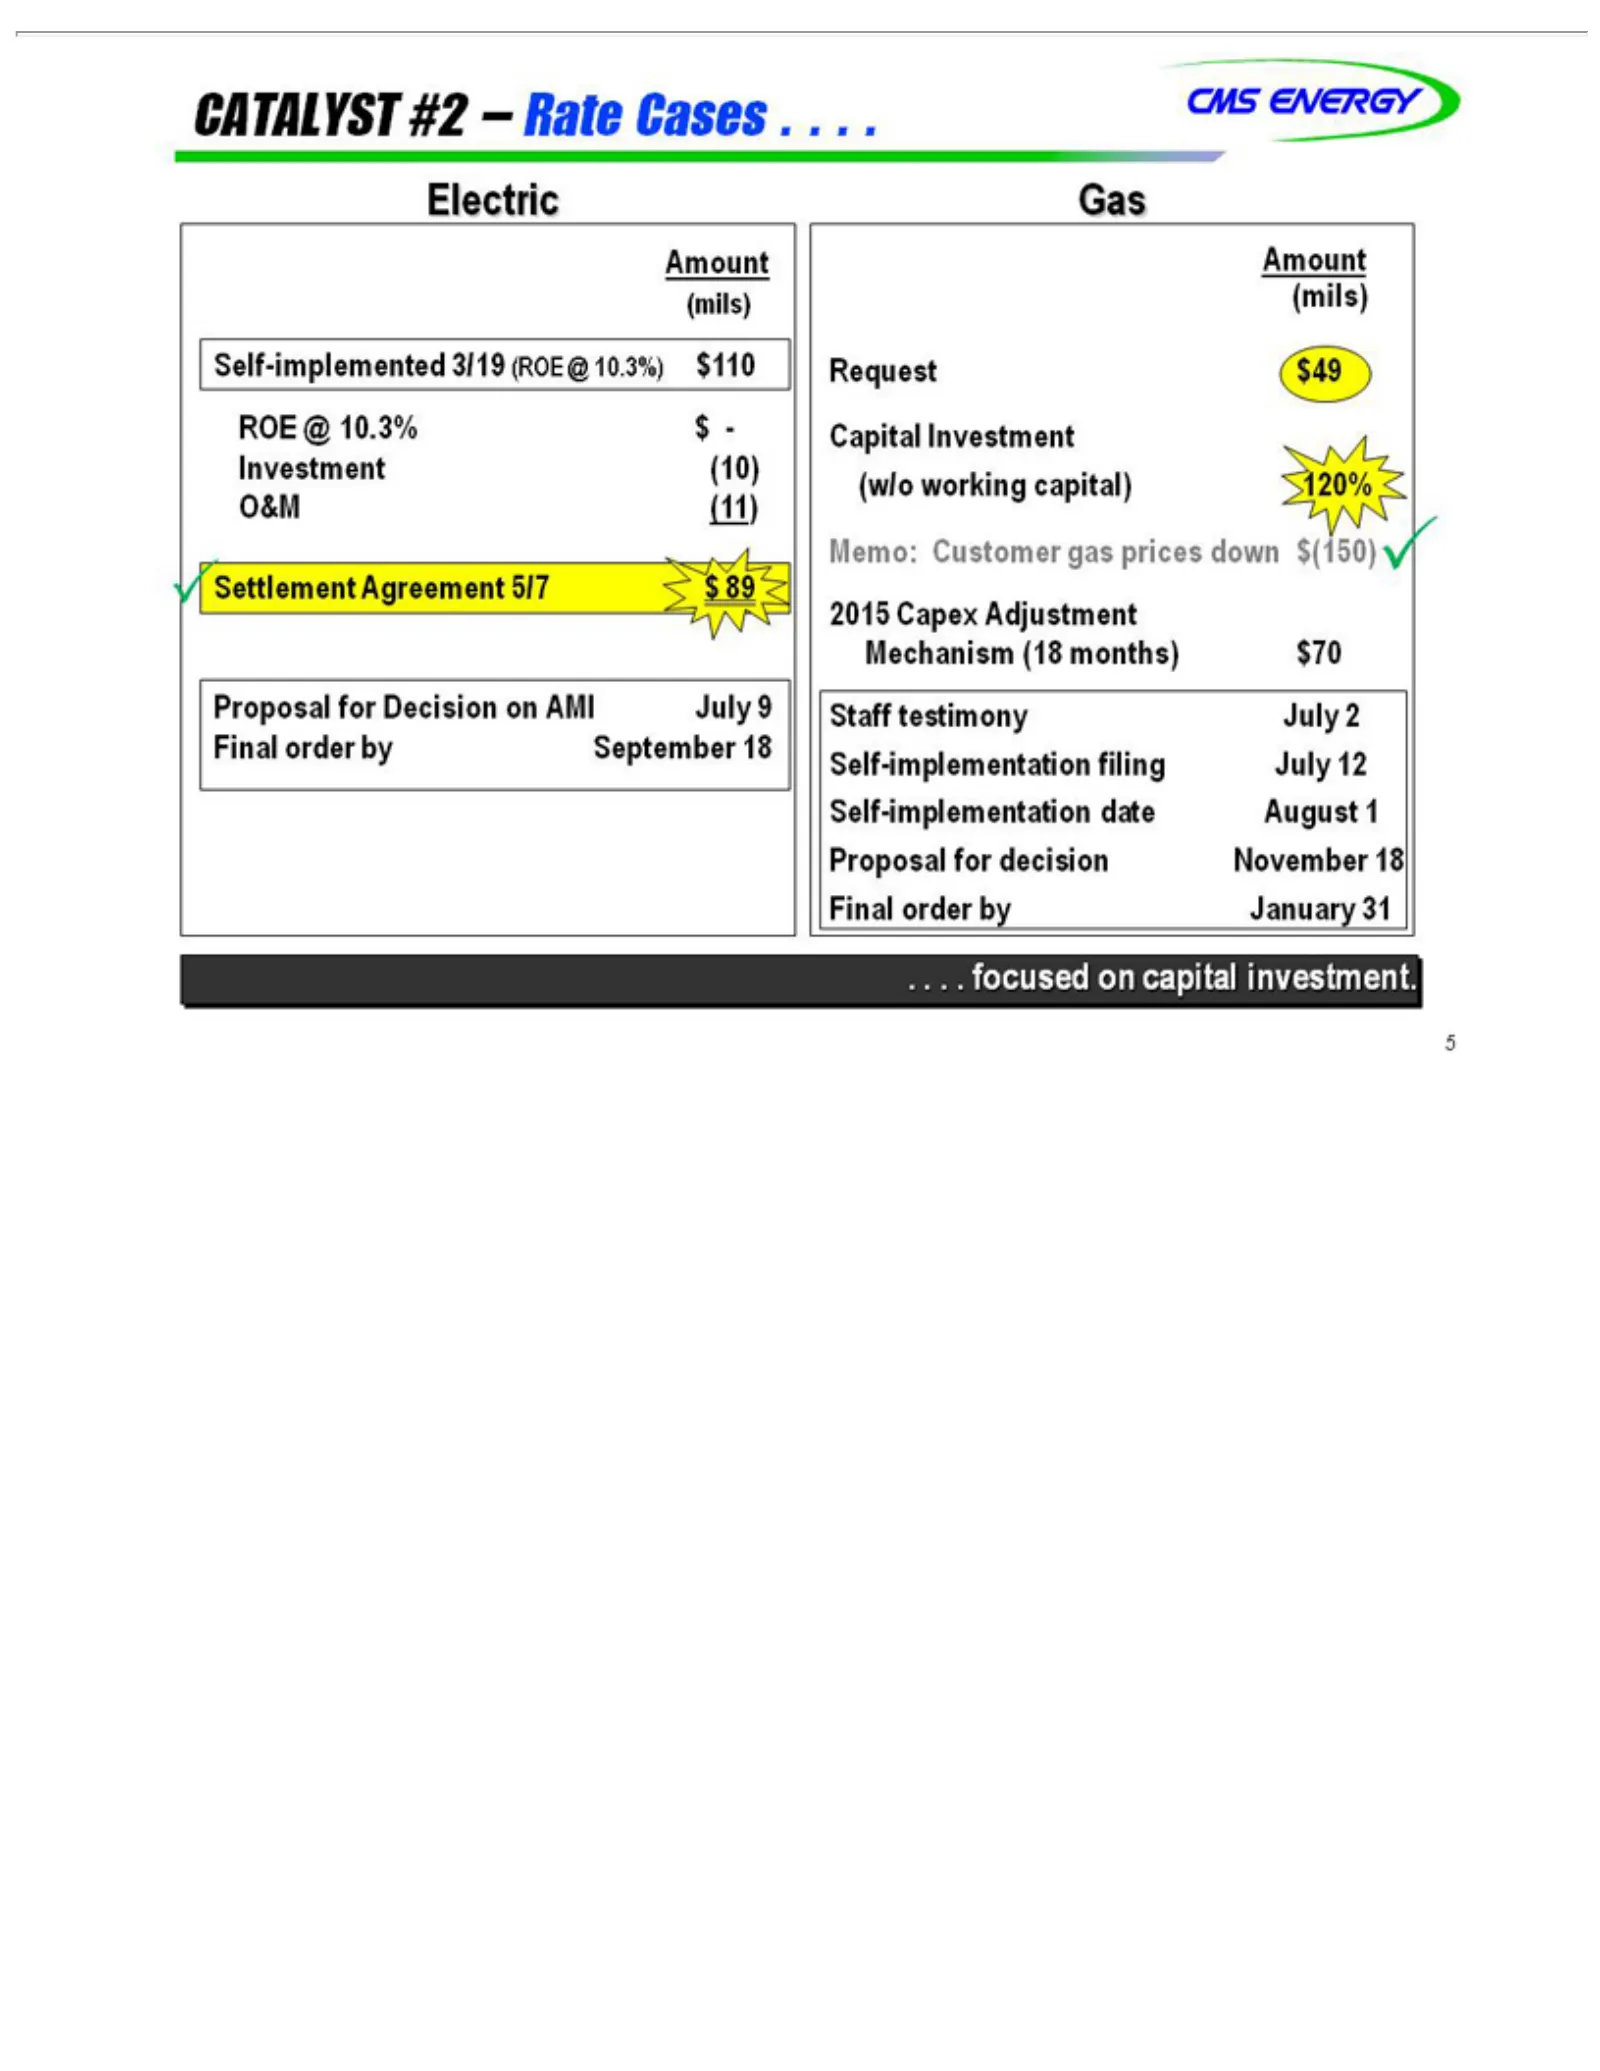
Slide 6: Catalyst 2: Electric Rate Cases
CATALYST CMS Electric Self-implemented ROE Investment O&M ü Amount Gas Request Capital (w/o Memo: 2015 Mechanism Staff Self-implementation Proposal .Final 5 .Settlement . . focused working testimony @ Capex order ENERGY (11) Investment Customer 10.3% $49 (mils) forby (10) (18 Adjustment #2 Decision
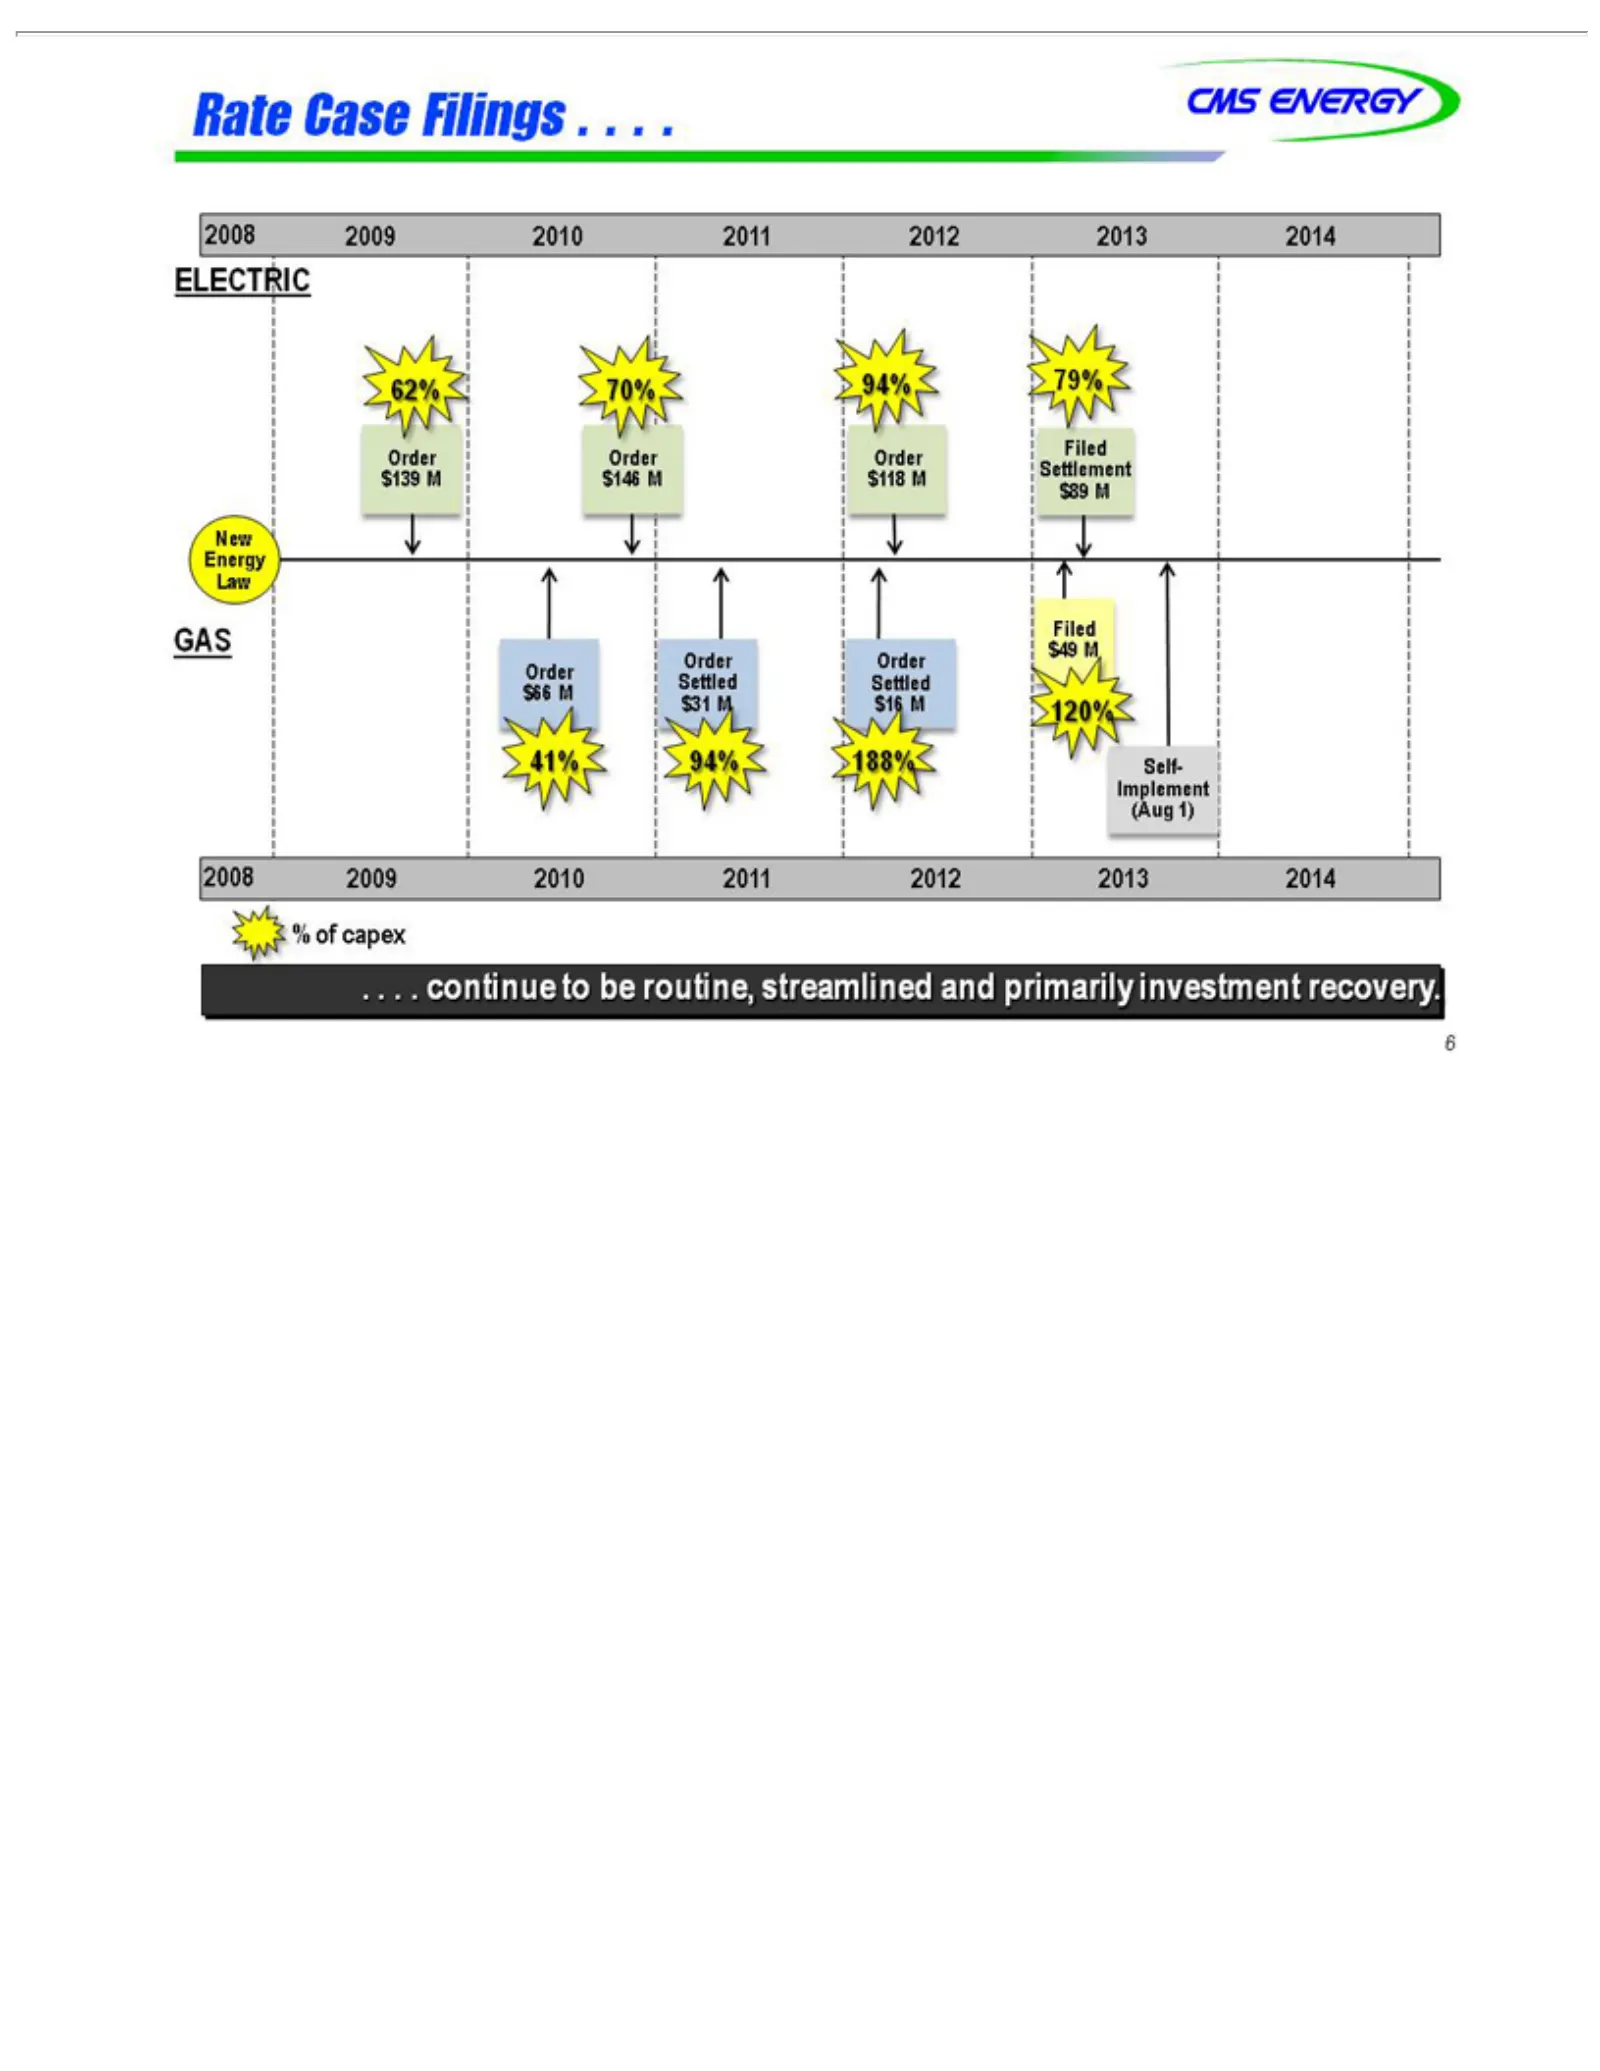
Slide 7: Rate Case Filings and Orders
Rate CMS 62% ELECTRIC $139 Settlement GAS Law Energy New Order $66 $31 41% (Aug 2008 .% 6 . .of.M continue Case 70% 94% capex M 2009 Filed 1) ENERGY Order Settled $16 $146 94% 188% Filings 2010 MOrder M to 120% Settled 79% be Self-Implement 2011 $118 . $49 Filed .routine, . .2012 MM$892013 streamlin
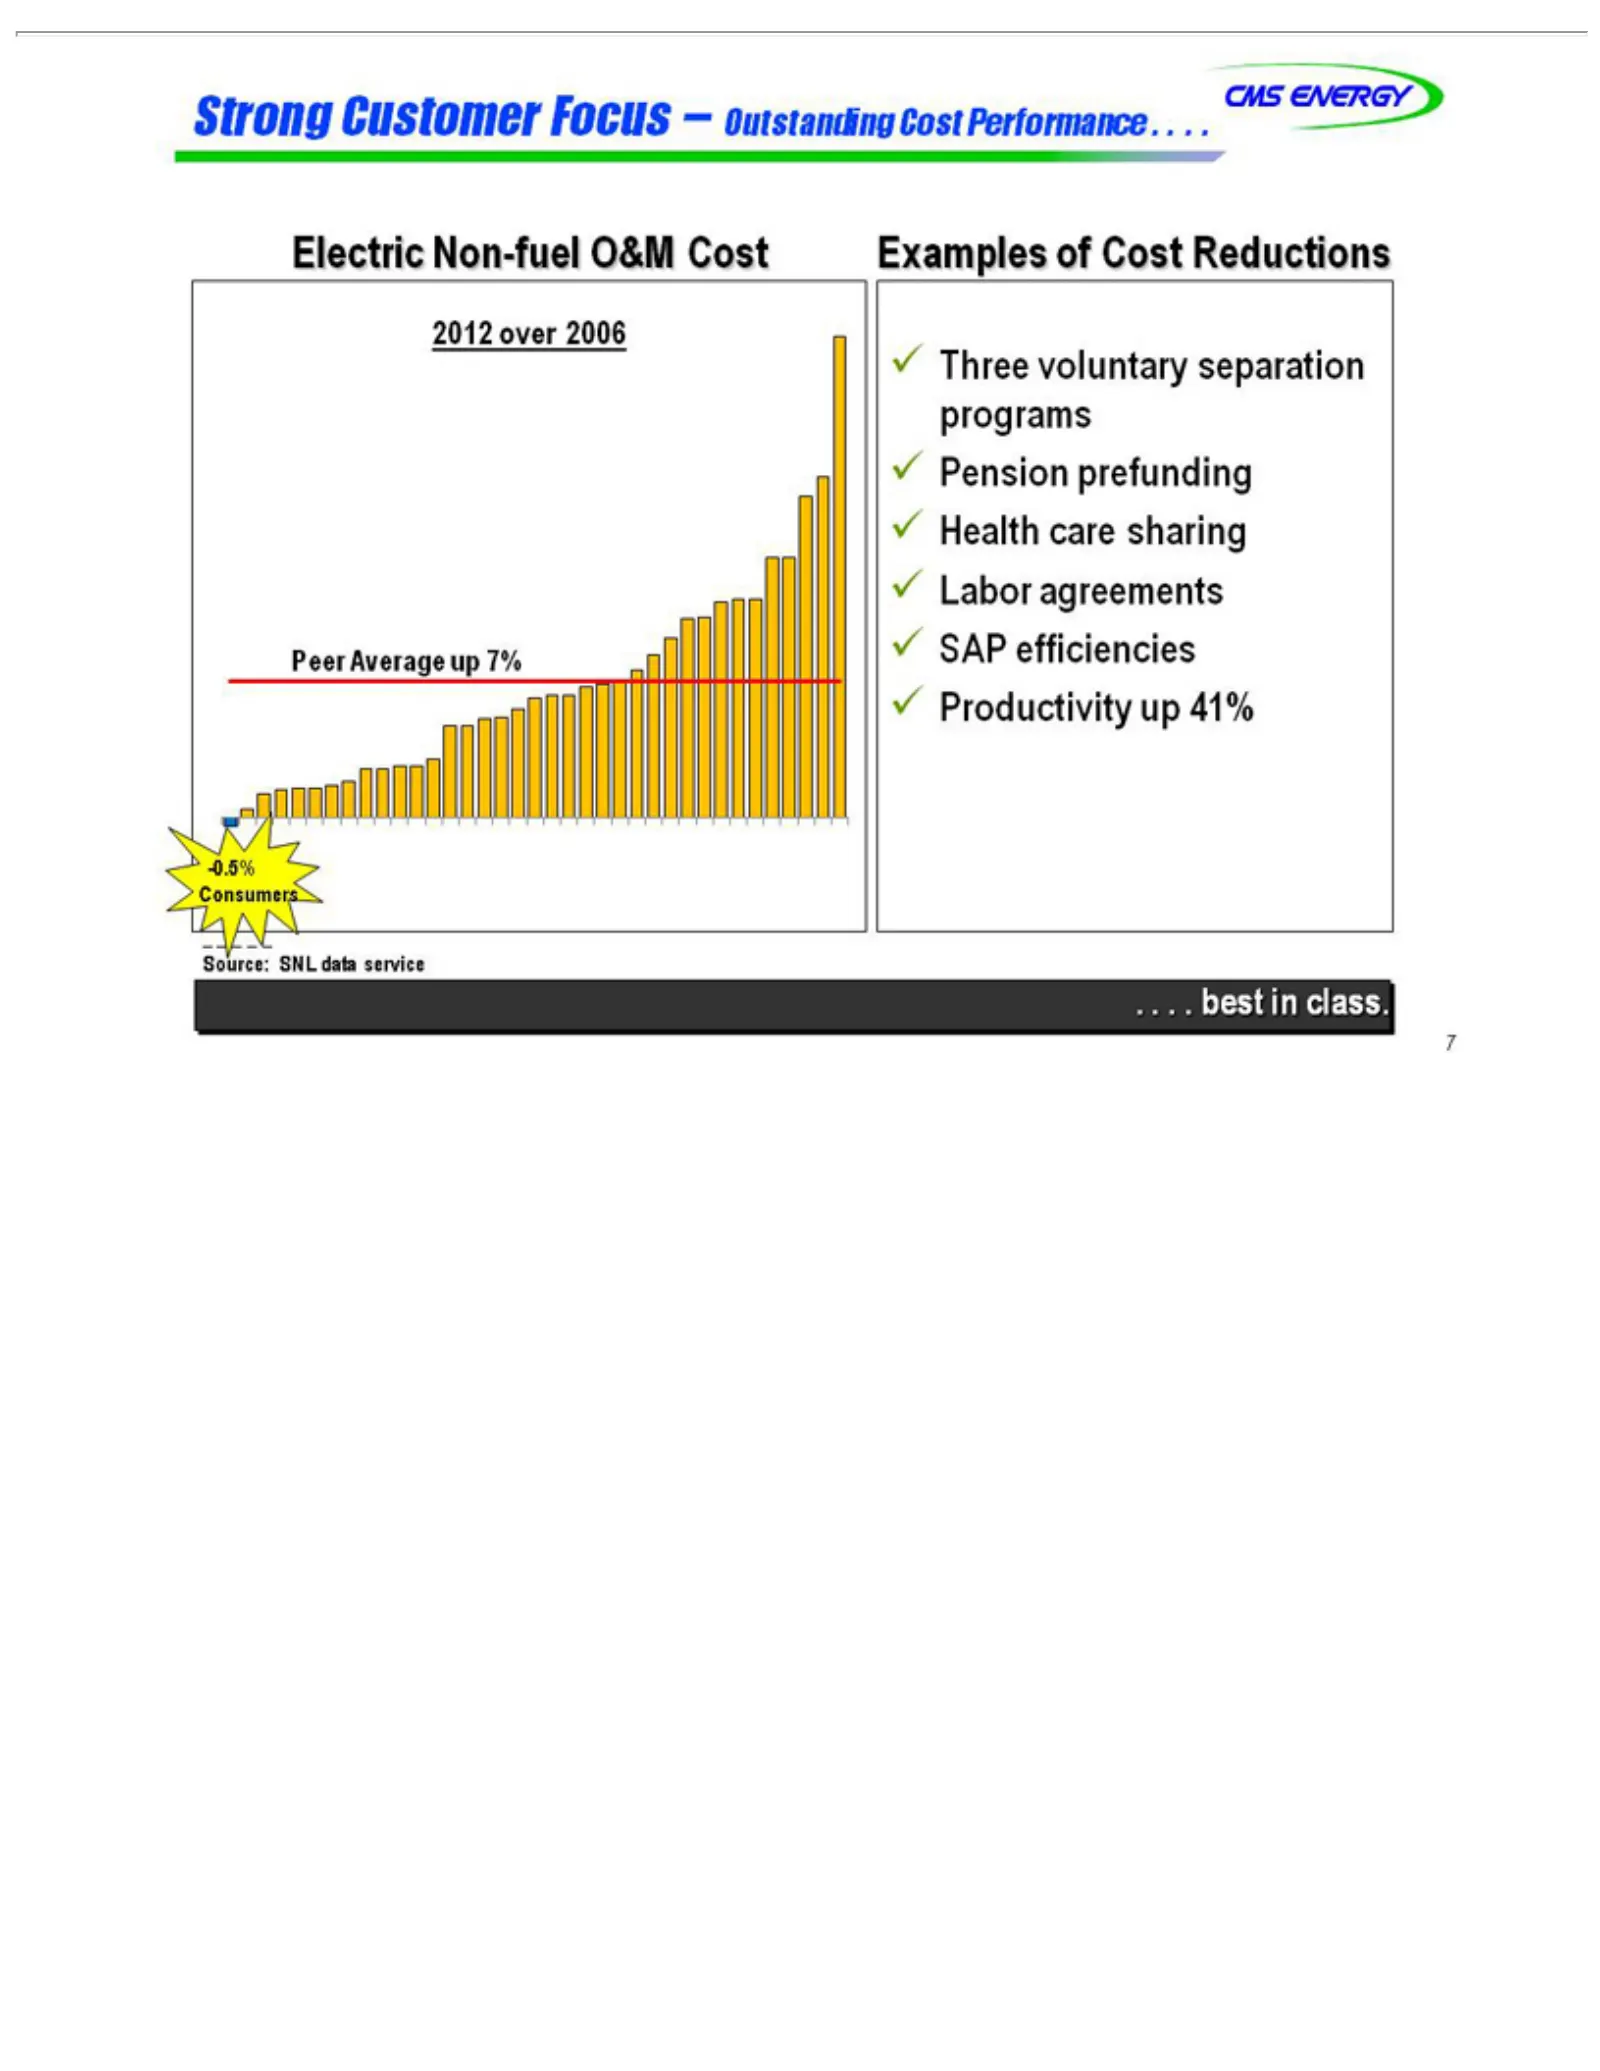
Slide 8: Strong Customer Focus: Cost Performance
Strong CMS Electric 2012 Peer -0.5% Examples ü .Source: 7 .Three Pension Health Labor SAP Productivity . . Average best over ENERGY Consumers efficiencies Customer SNL voluntary Non-fuel agreements care inprefunding of 2006 class. Cost data up sharing up7% Focus 41% O&M service Reductions separation
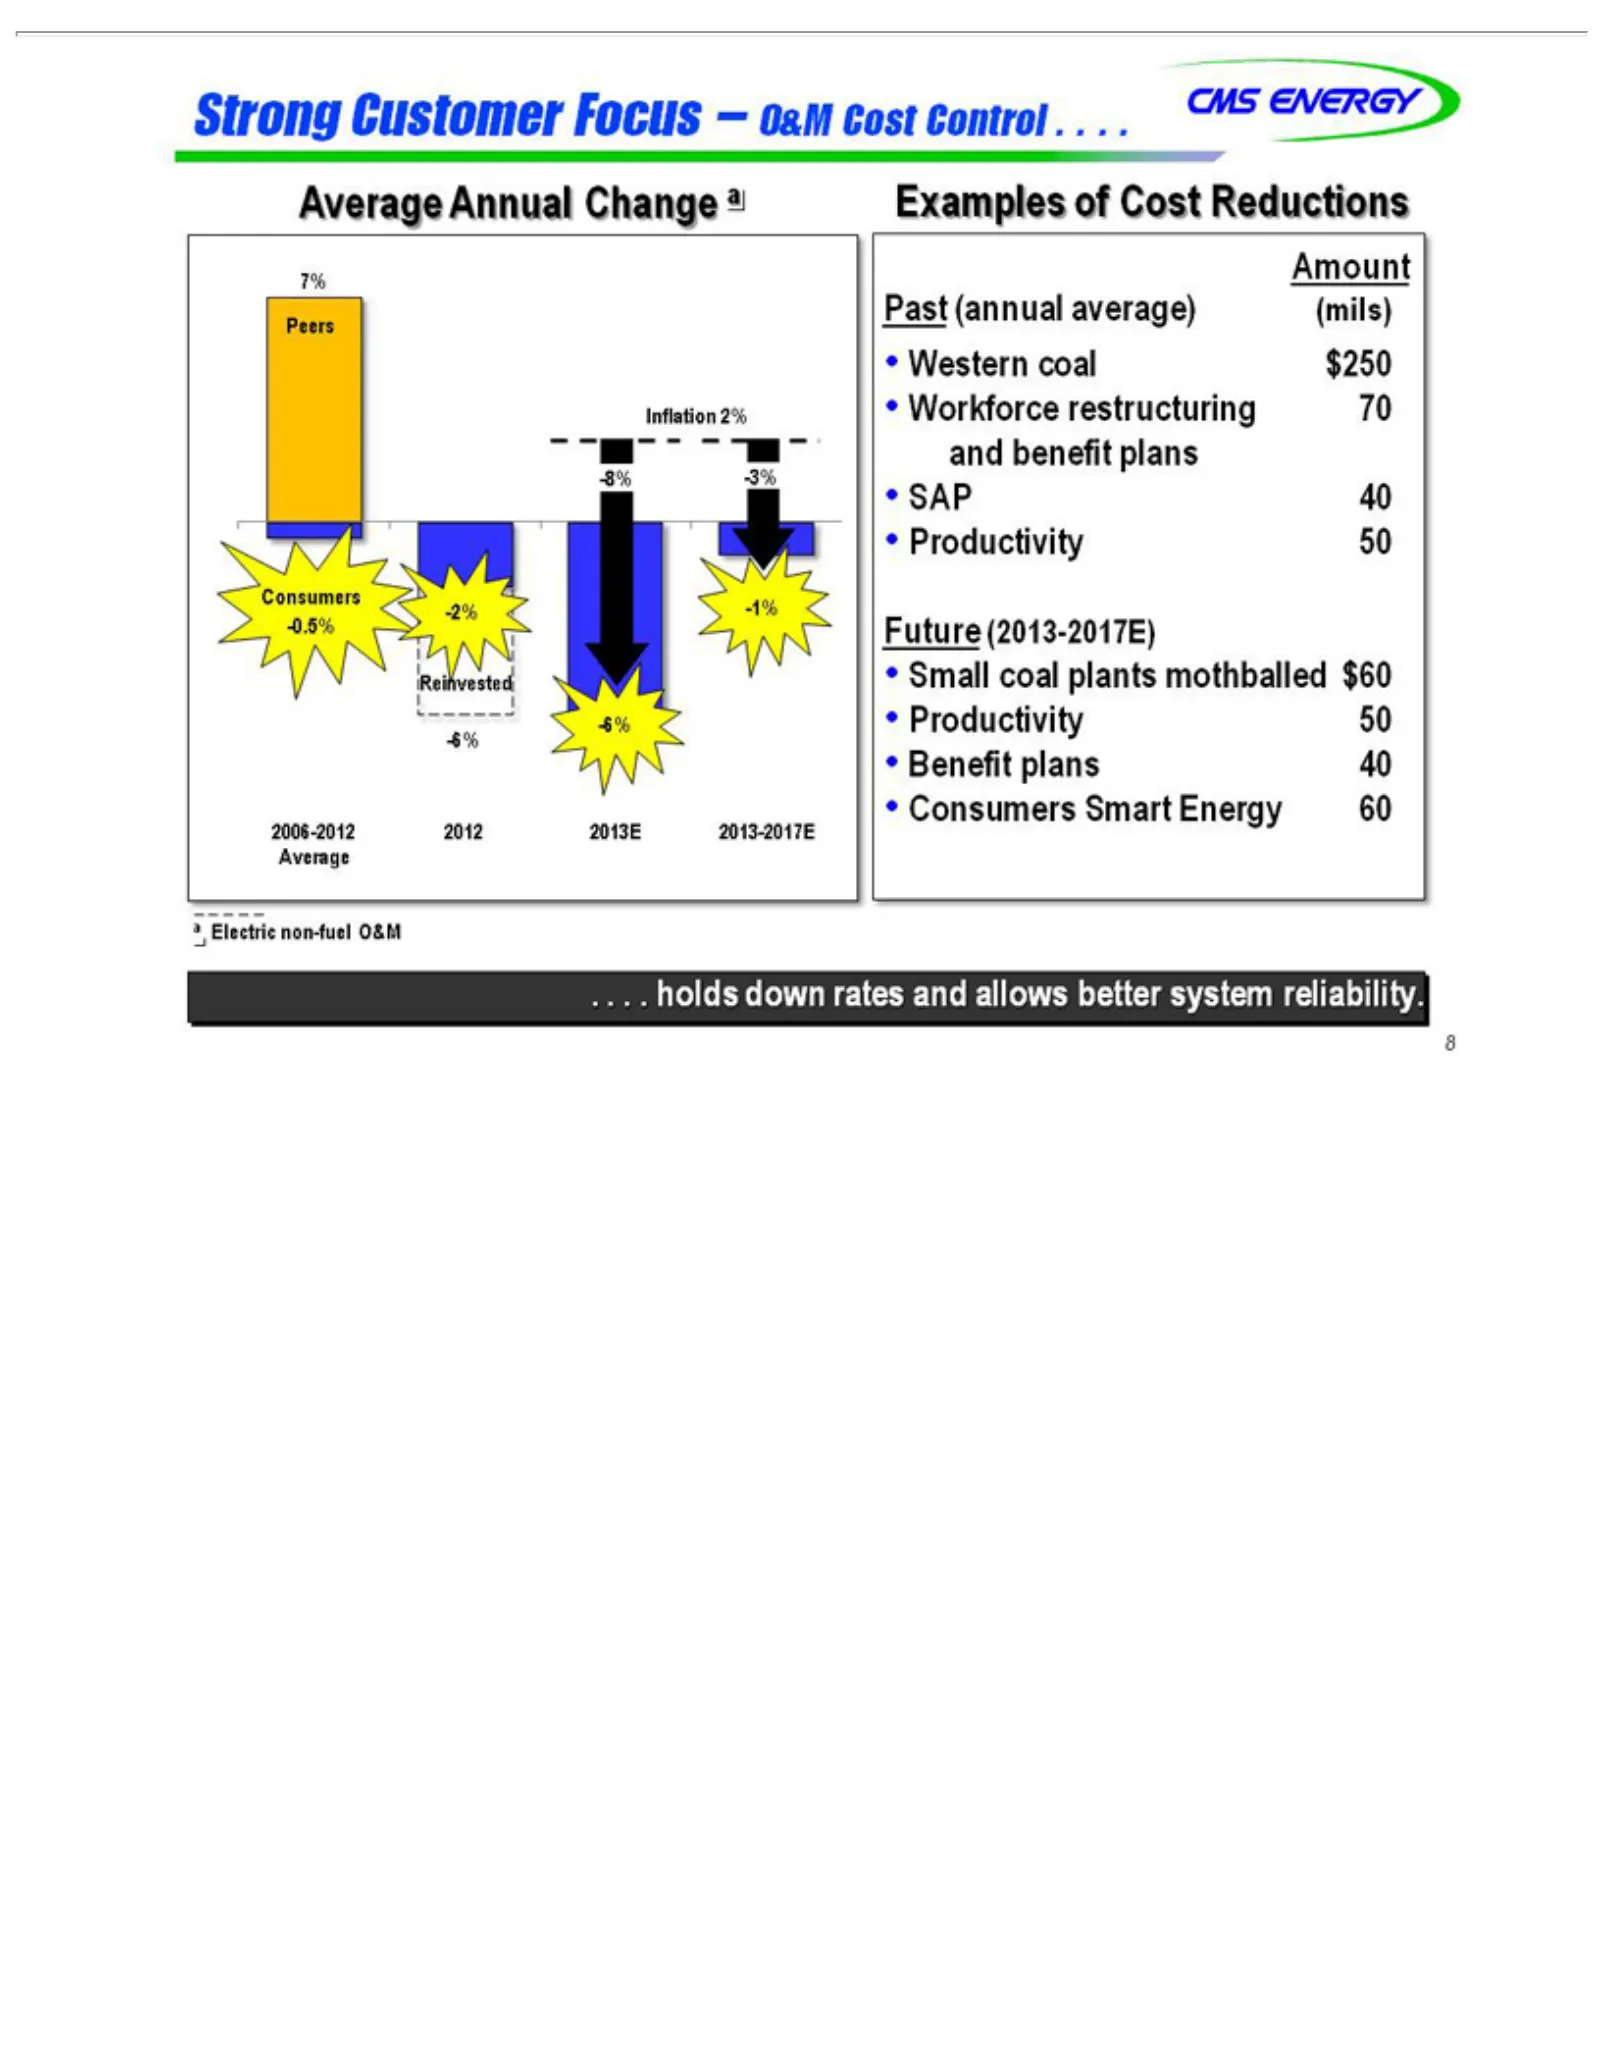
Slide 9: Strong Customer Focus: Inflation and O&M Reductions
Strong CMS Inflation Peers 7% -8% -2% Consumers 2006-2012 -6% Reinvested Examples Average Past Amount and .a•Future 8 .Workforce Western SAP Small Productivity Benefit Consumers Electric . .benefit -3% -1% (annual holds ENERGY 40 (2013-2017E) Customer coal Annual 2% plans -0.5% non-fuel coal of down
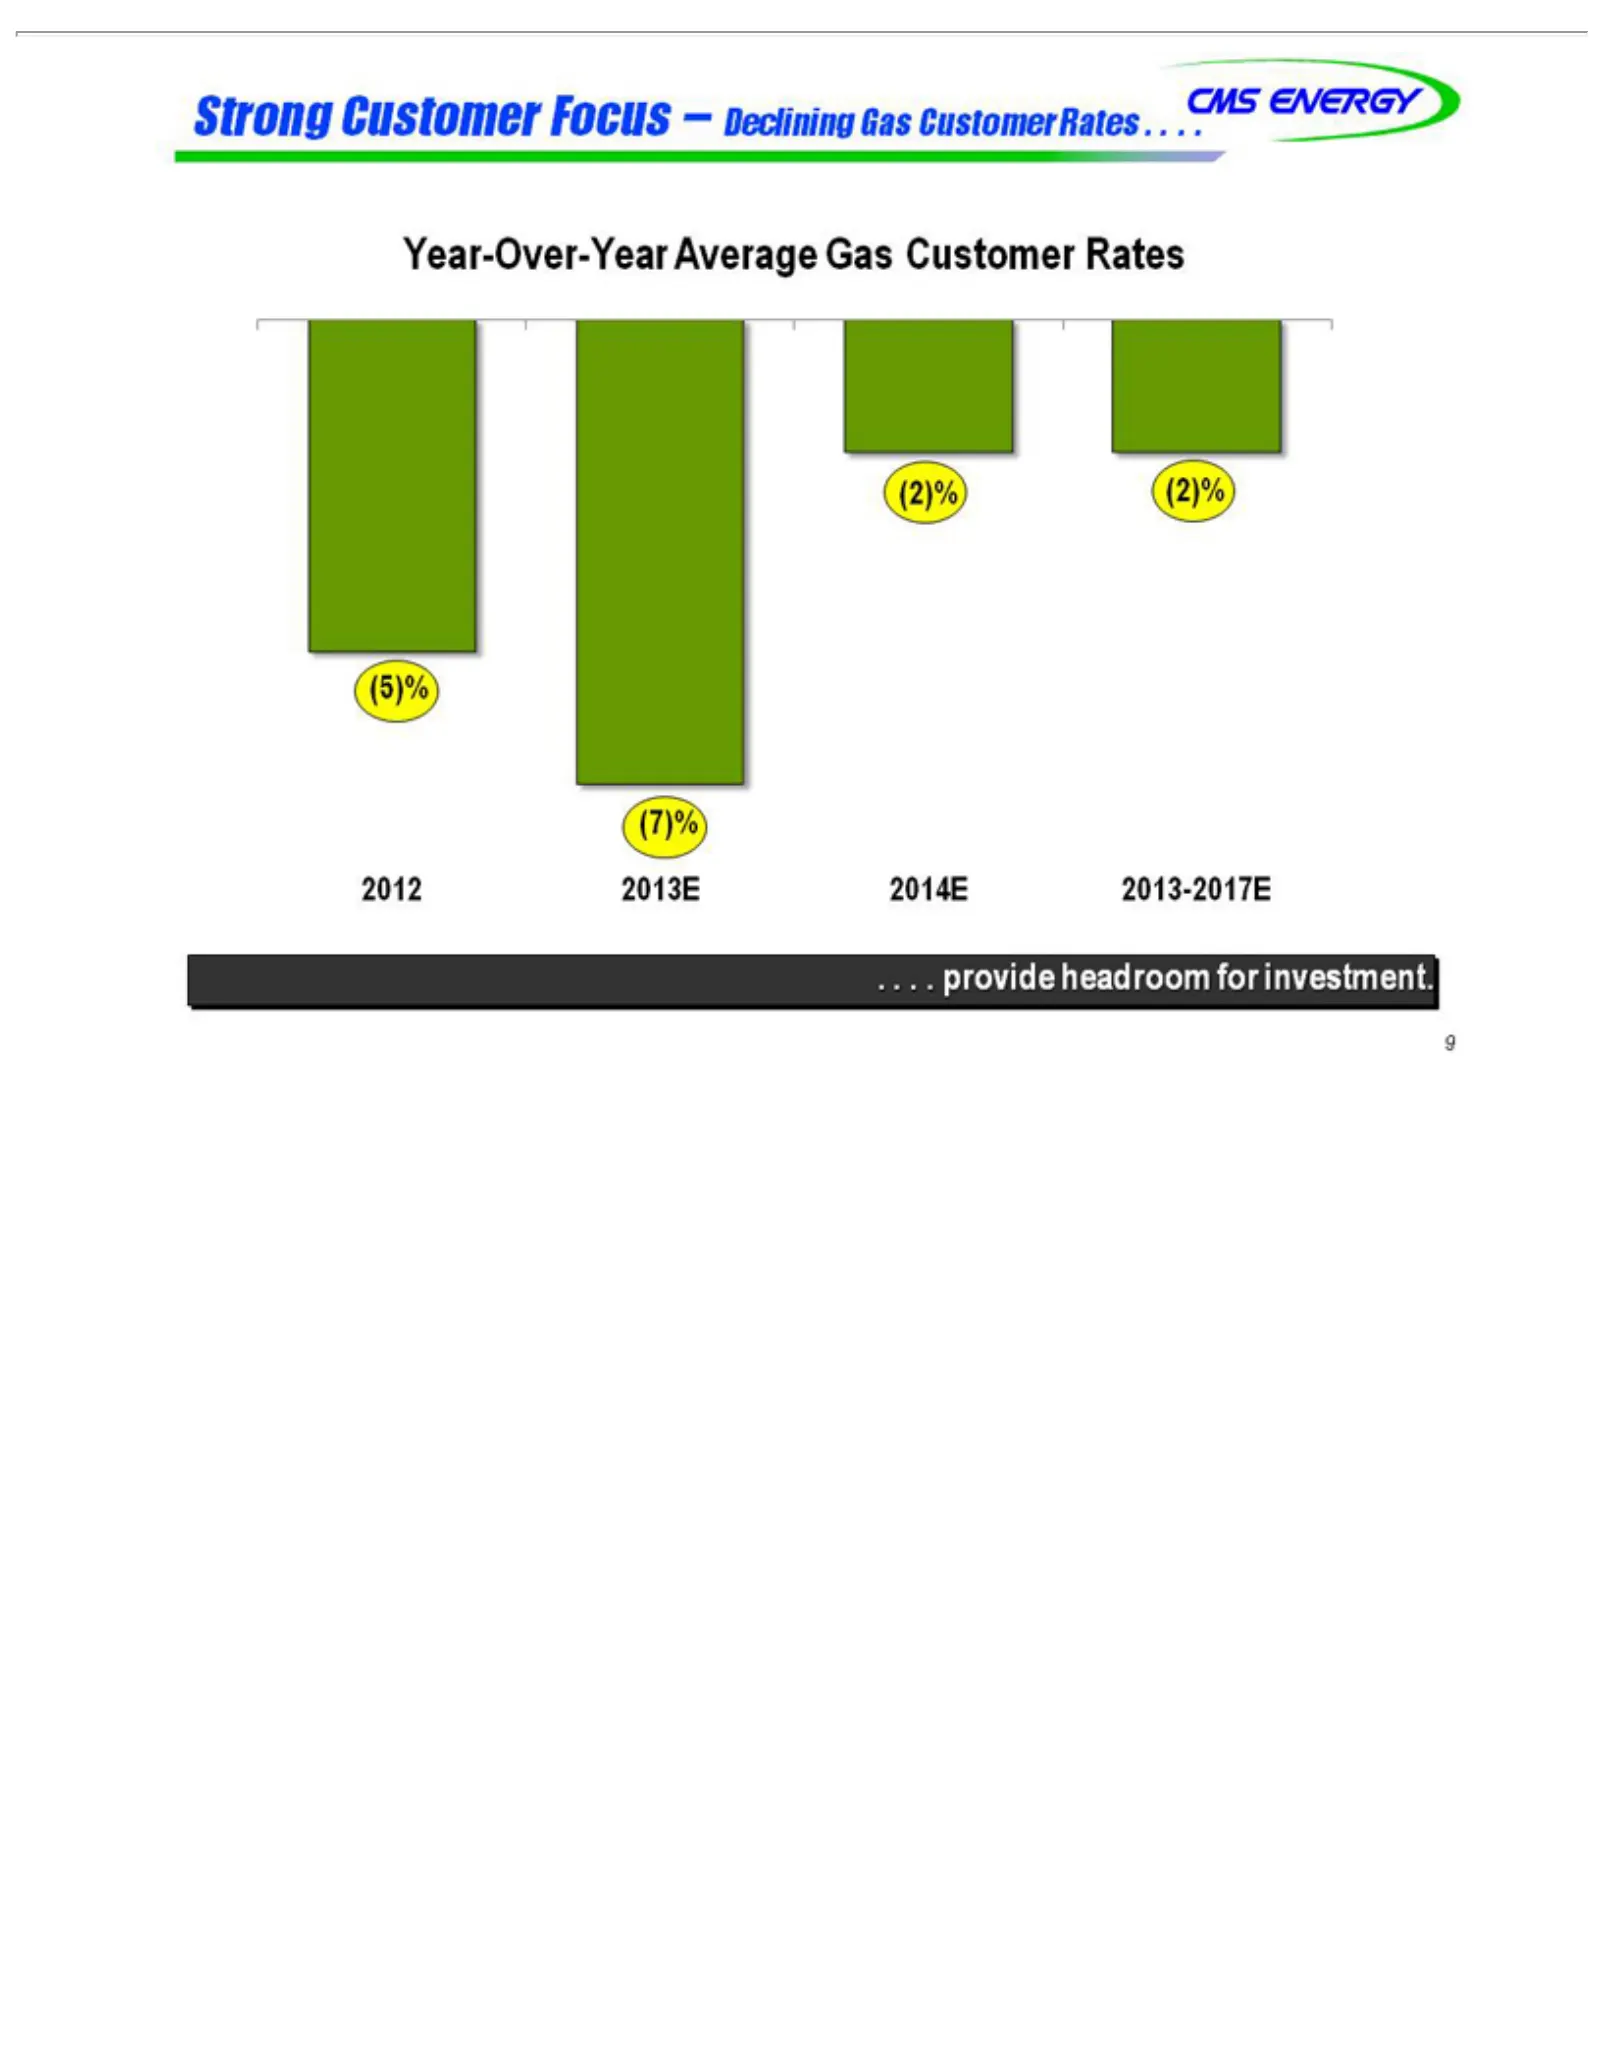
Slide 10: Strong Customer Focus: Year-Over-Year Customer Rates
Strong CMS Year-Over-Year (2)% 2012 (7)% .(5)% 9 . . . provide (2)% 2013E ENERGY Customer 2014E headroom Average Focus 2013-2017E for –Gas Declining investment. Customer GasRates Customer Rates . . . .
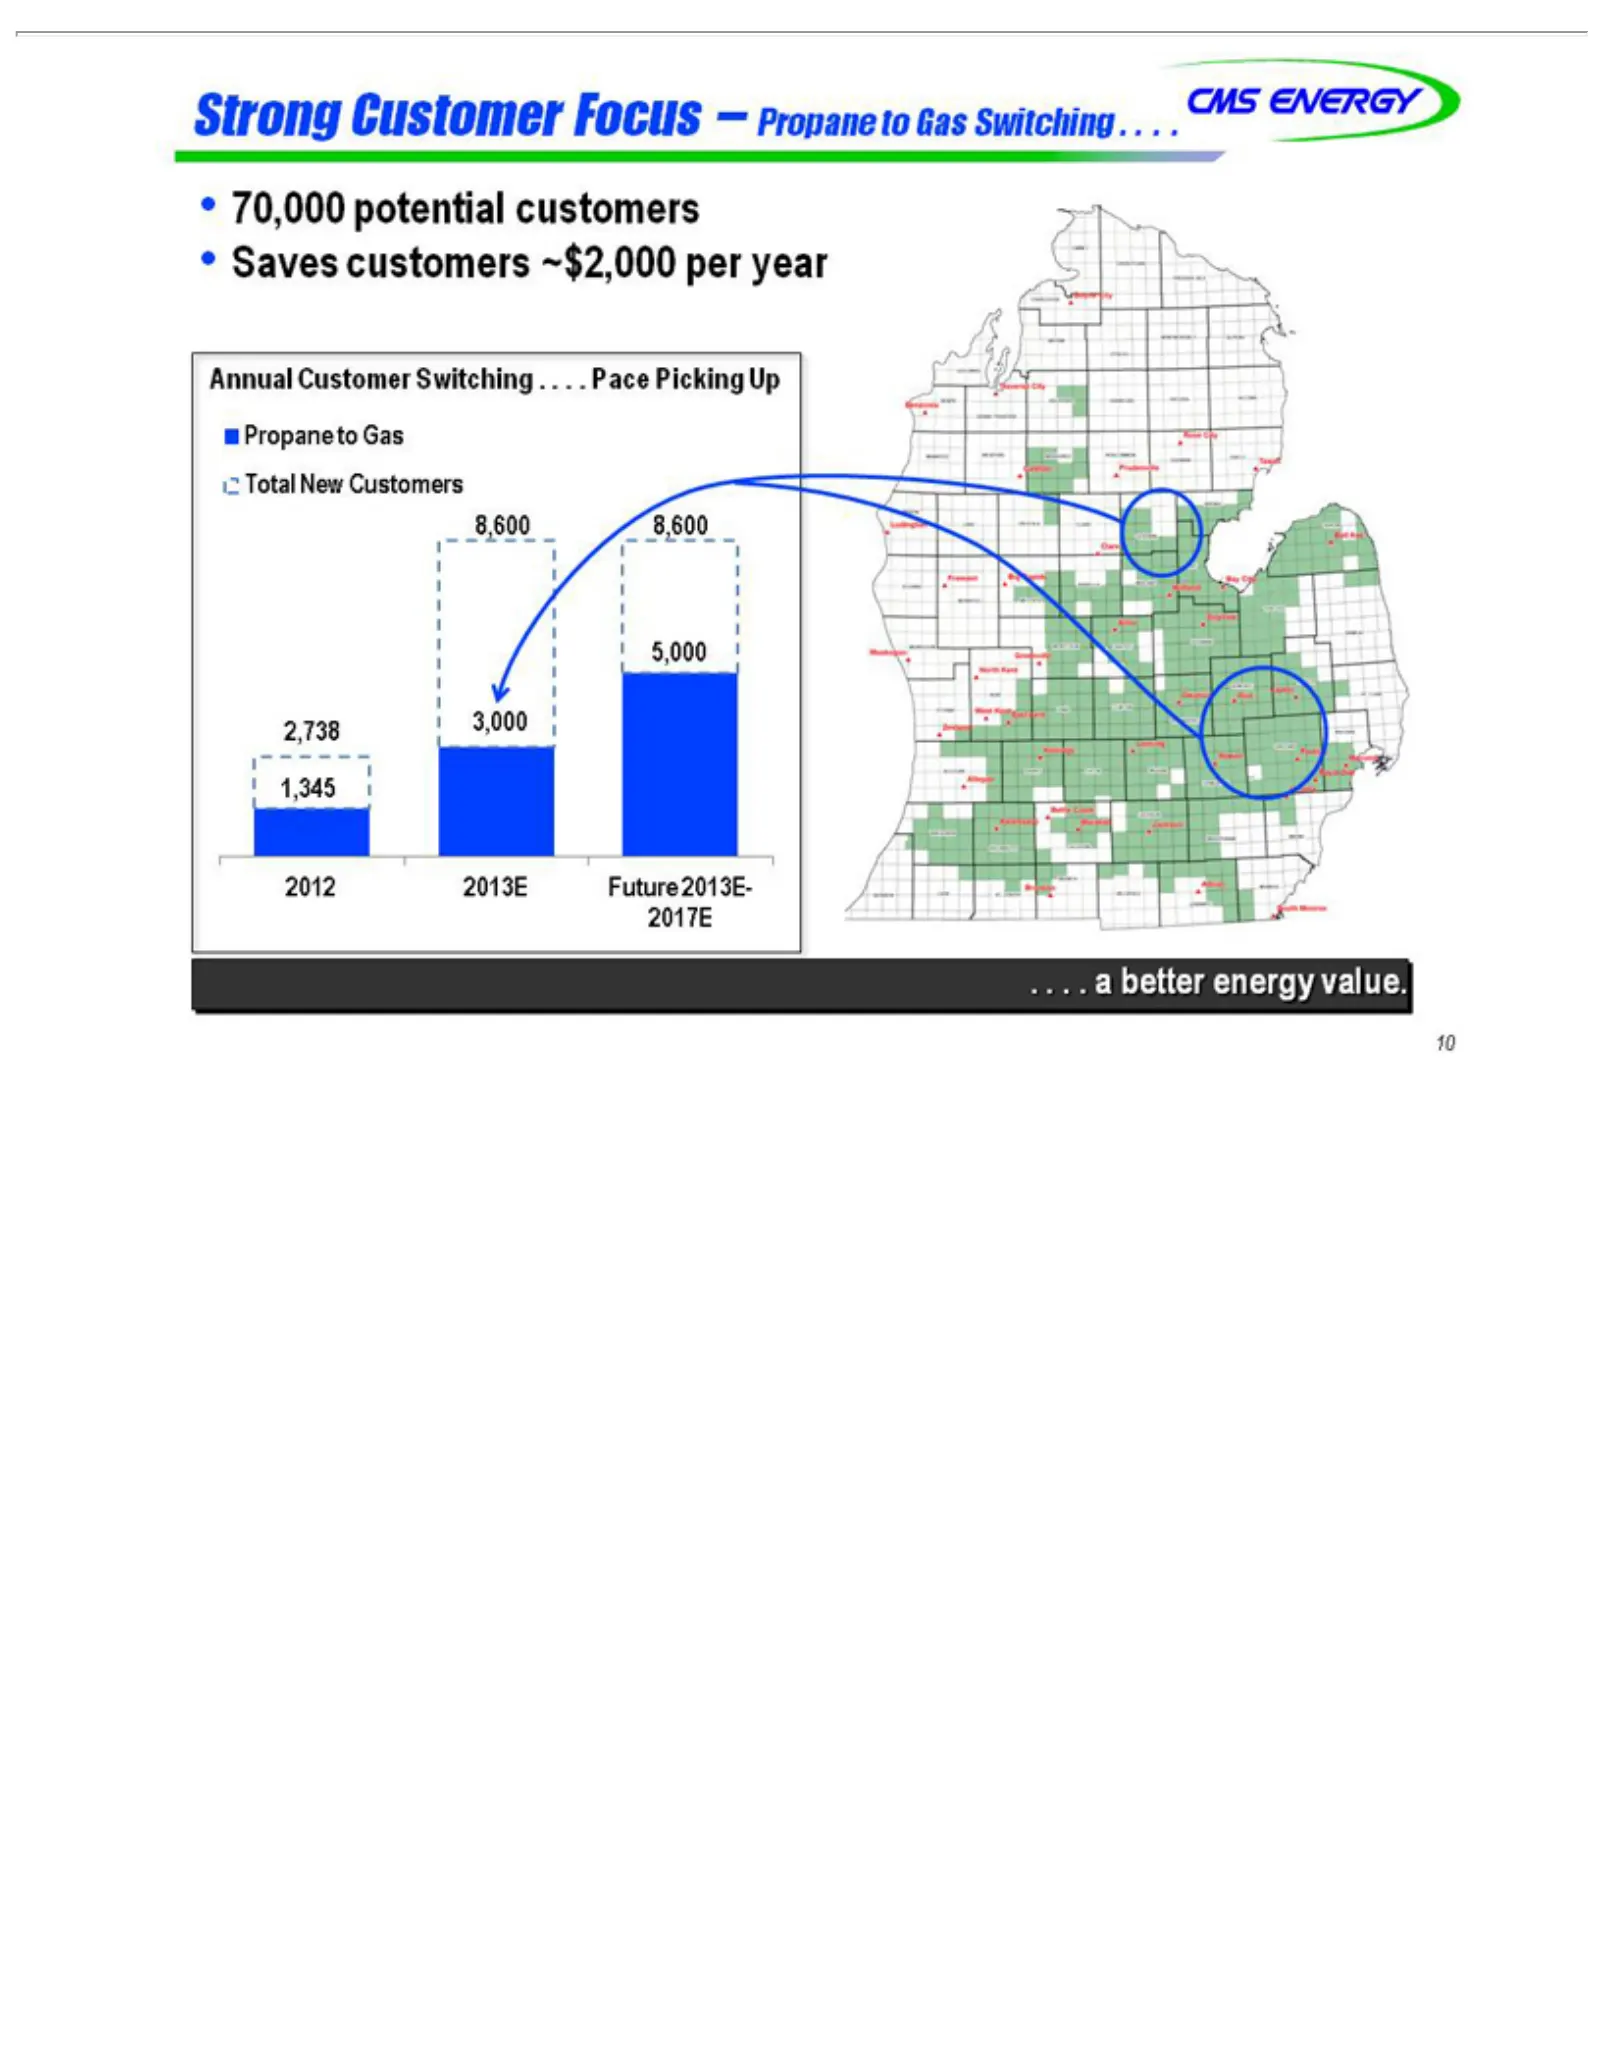
Slide 11: Strong Customer Focus: Propane to Gas Switching
Strong •CMS Annual Propane Future 2013E 2012 1,345 3,000 2,738 5,000 .8,600 10 .Saves 70,000 . . aENERGY better 2013E-2017E Customer customers Customer to potential Gas energy Total Focus Switching customers ~$2,000 value. New– Propane Customers per . . year . . Pace to Gas Picking Switching Up . .
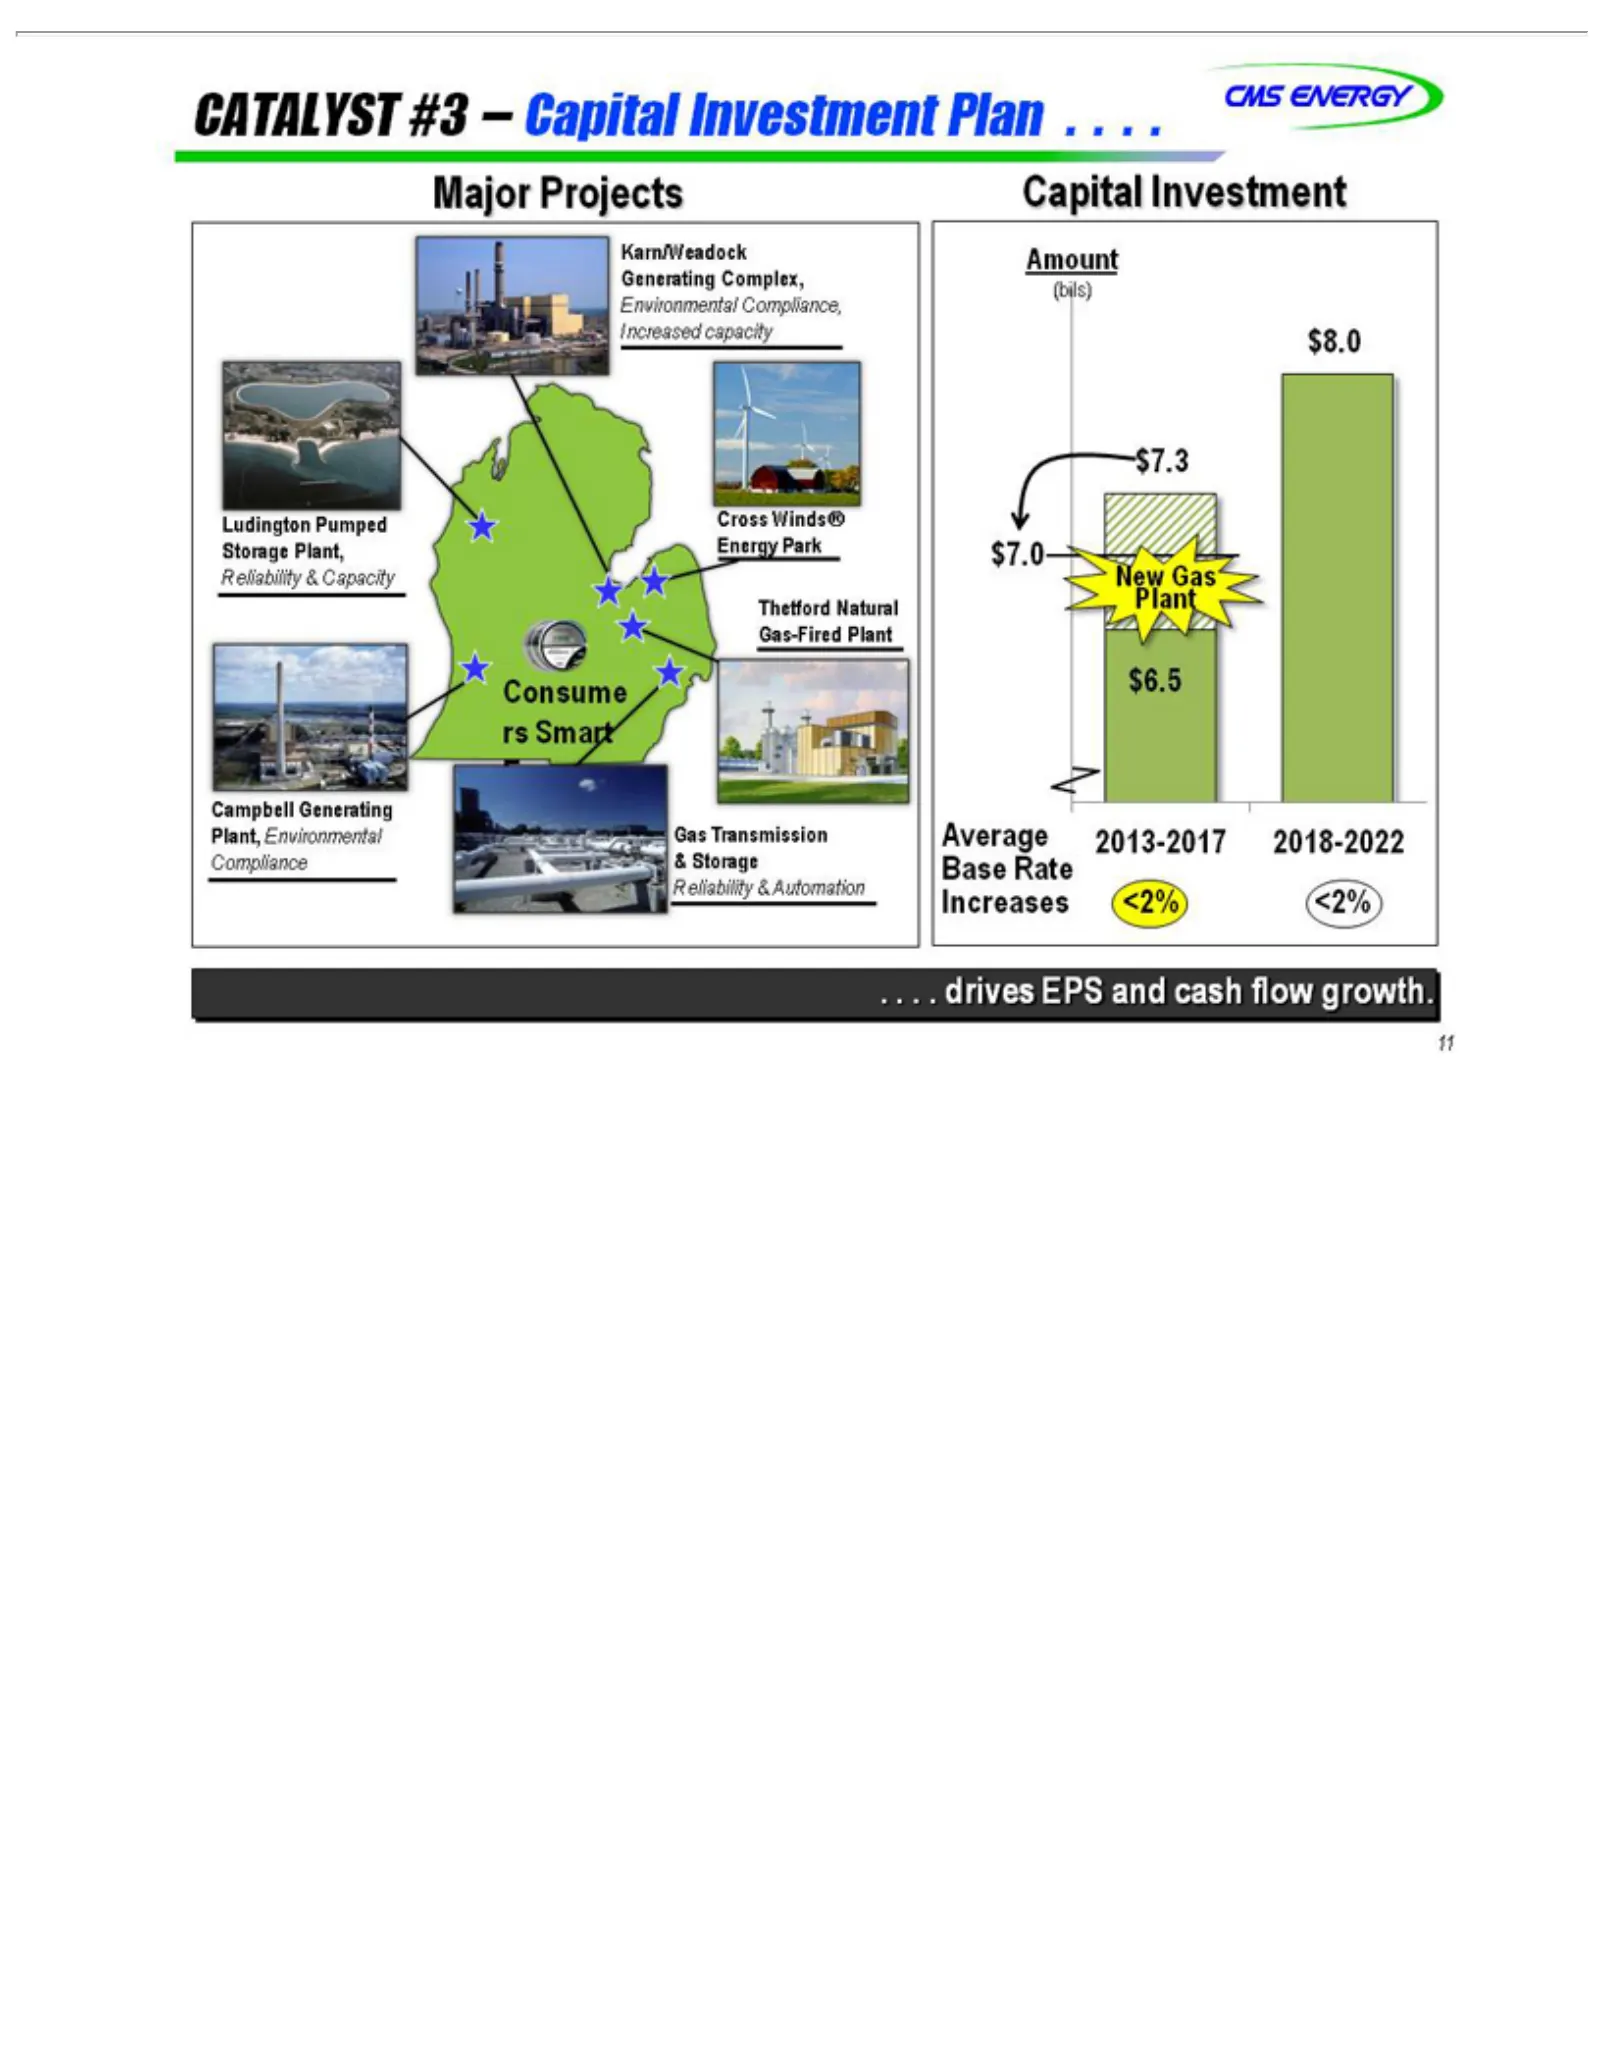
Slide 12: Catalyst 3: Major Capital Investment
CATALYST CMS Major Karn/Weadock Environmental Ludington Thetford Consumers Campbell Plant, Compliance Reliability Capital New $7.0 $7.3 $8.0 (bils) Amount Average .$6.5 11 . . . drives Gas ENERGY Environmental Projects Investment 2013-2017 Natural Plant Generating Pumped & EPS Smart & #3 Automation
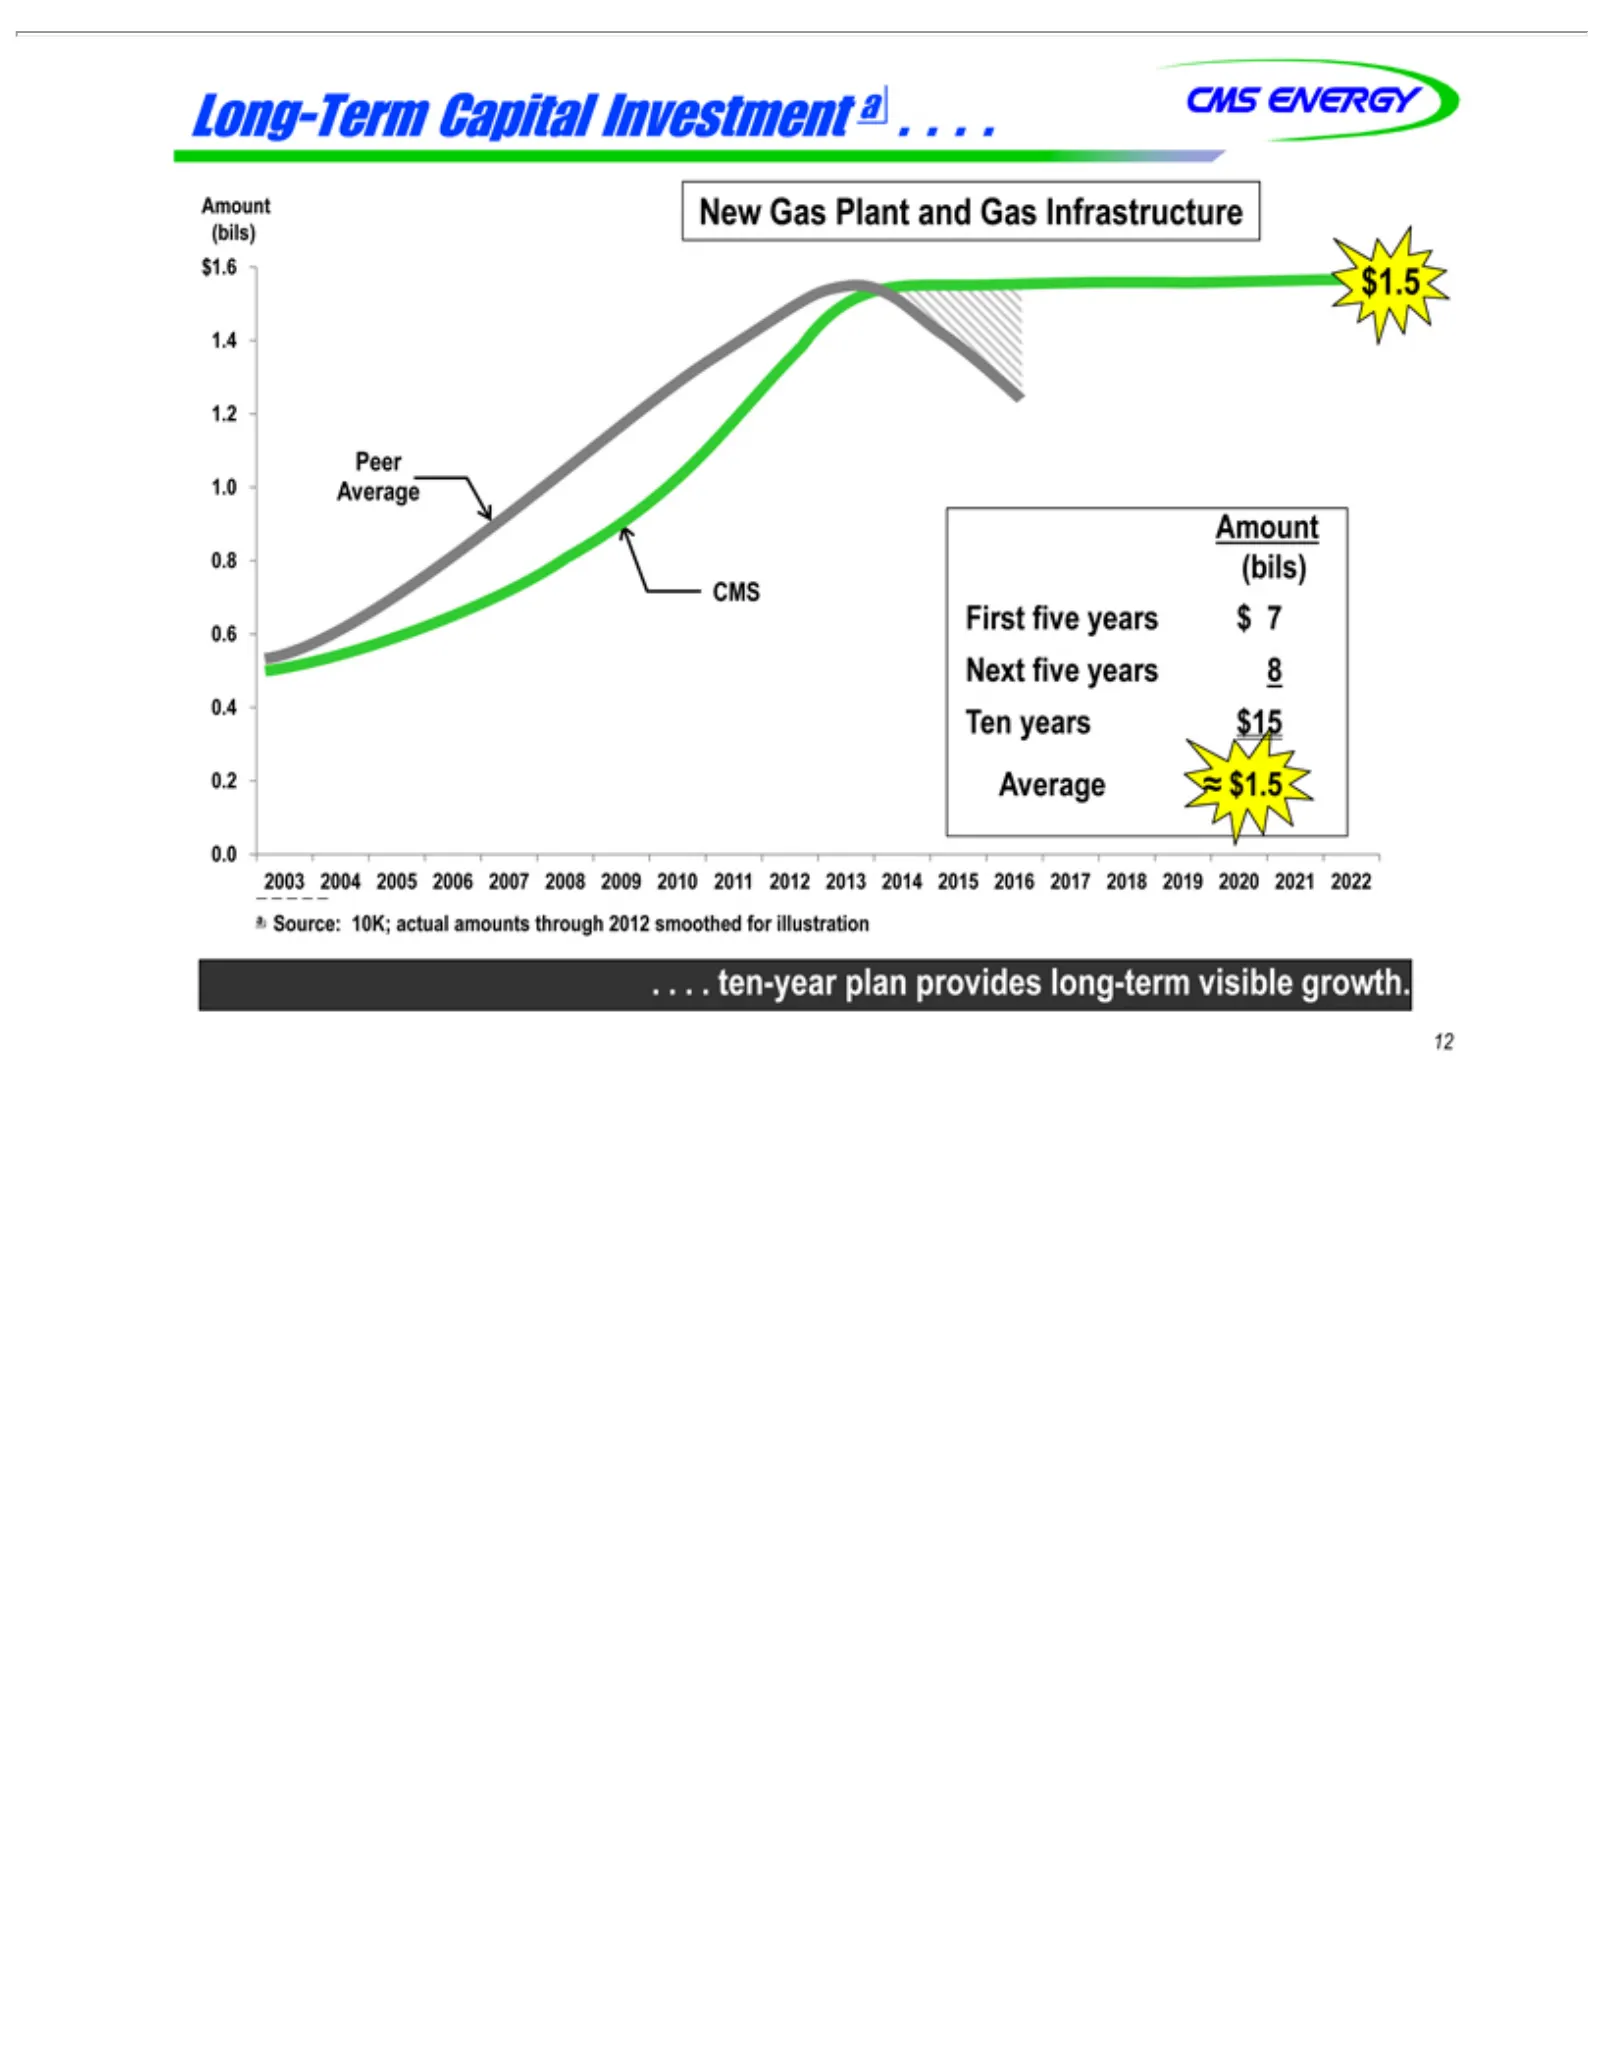
Slide 13: Long-Term Capital Investment Plan
Long-Term New Peer 0.0 0.2 0.4 0.6 0.8 1.0 1.2 1.4 $1.6 First (bils) Amount $1.5 CMS Next Ten Average .a2003 12 .Source: . .years Average ten-year five Gas five 2004 ENERGY ≈years Plant years 10K; $15 $1.5 2005 Capital plan $and actual 82006 7provides Investment Gas amounts 2007 Infrastructure long-
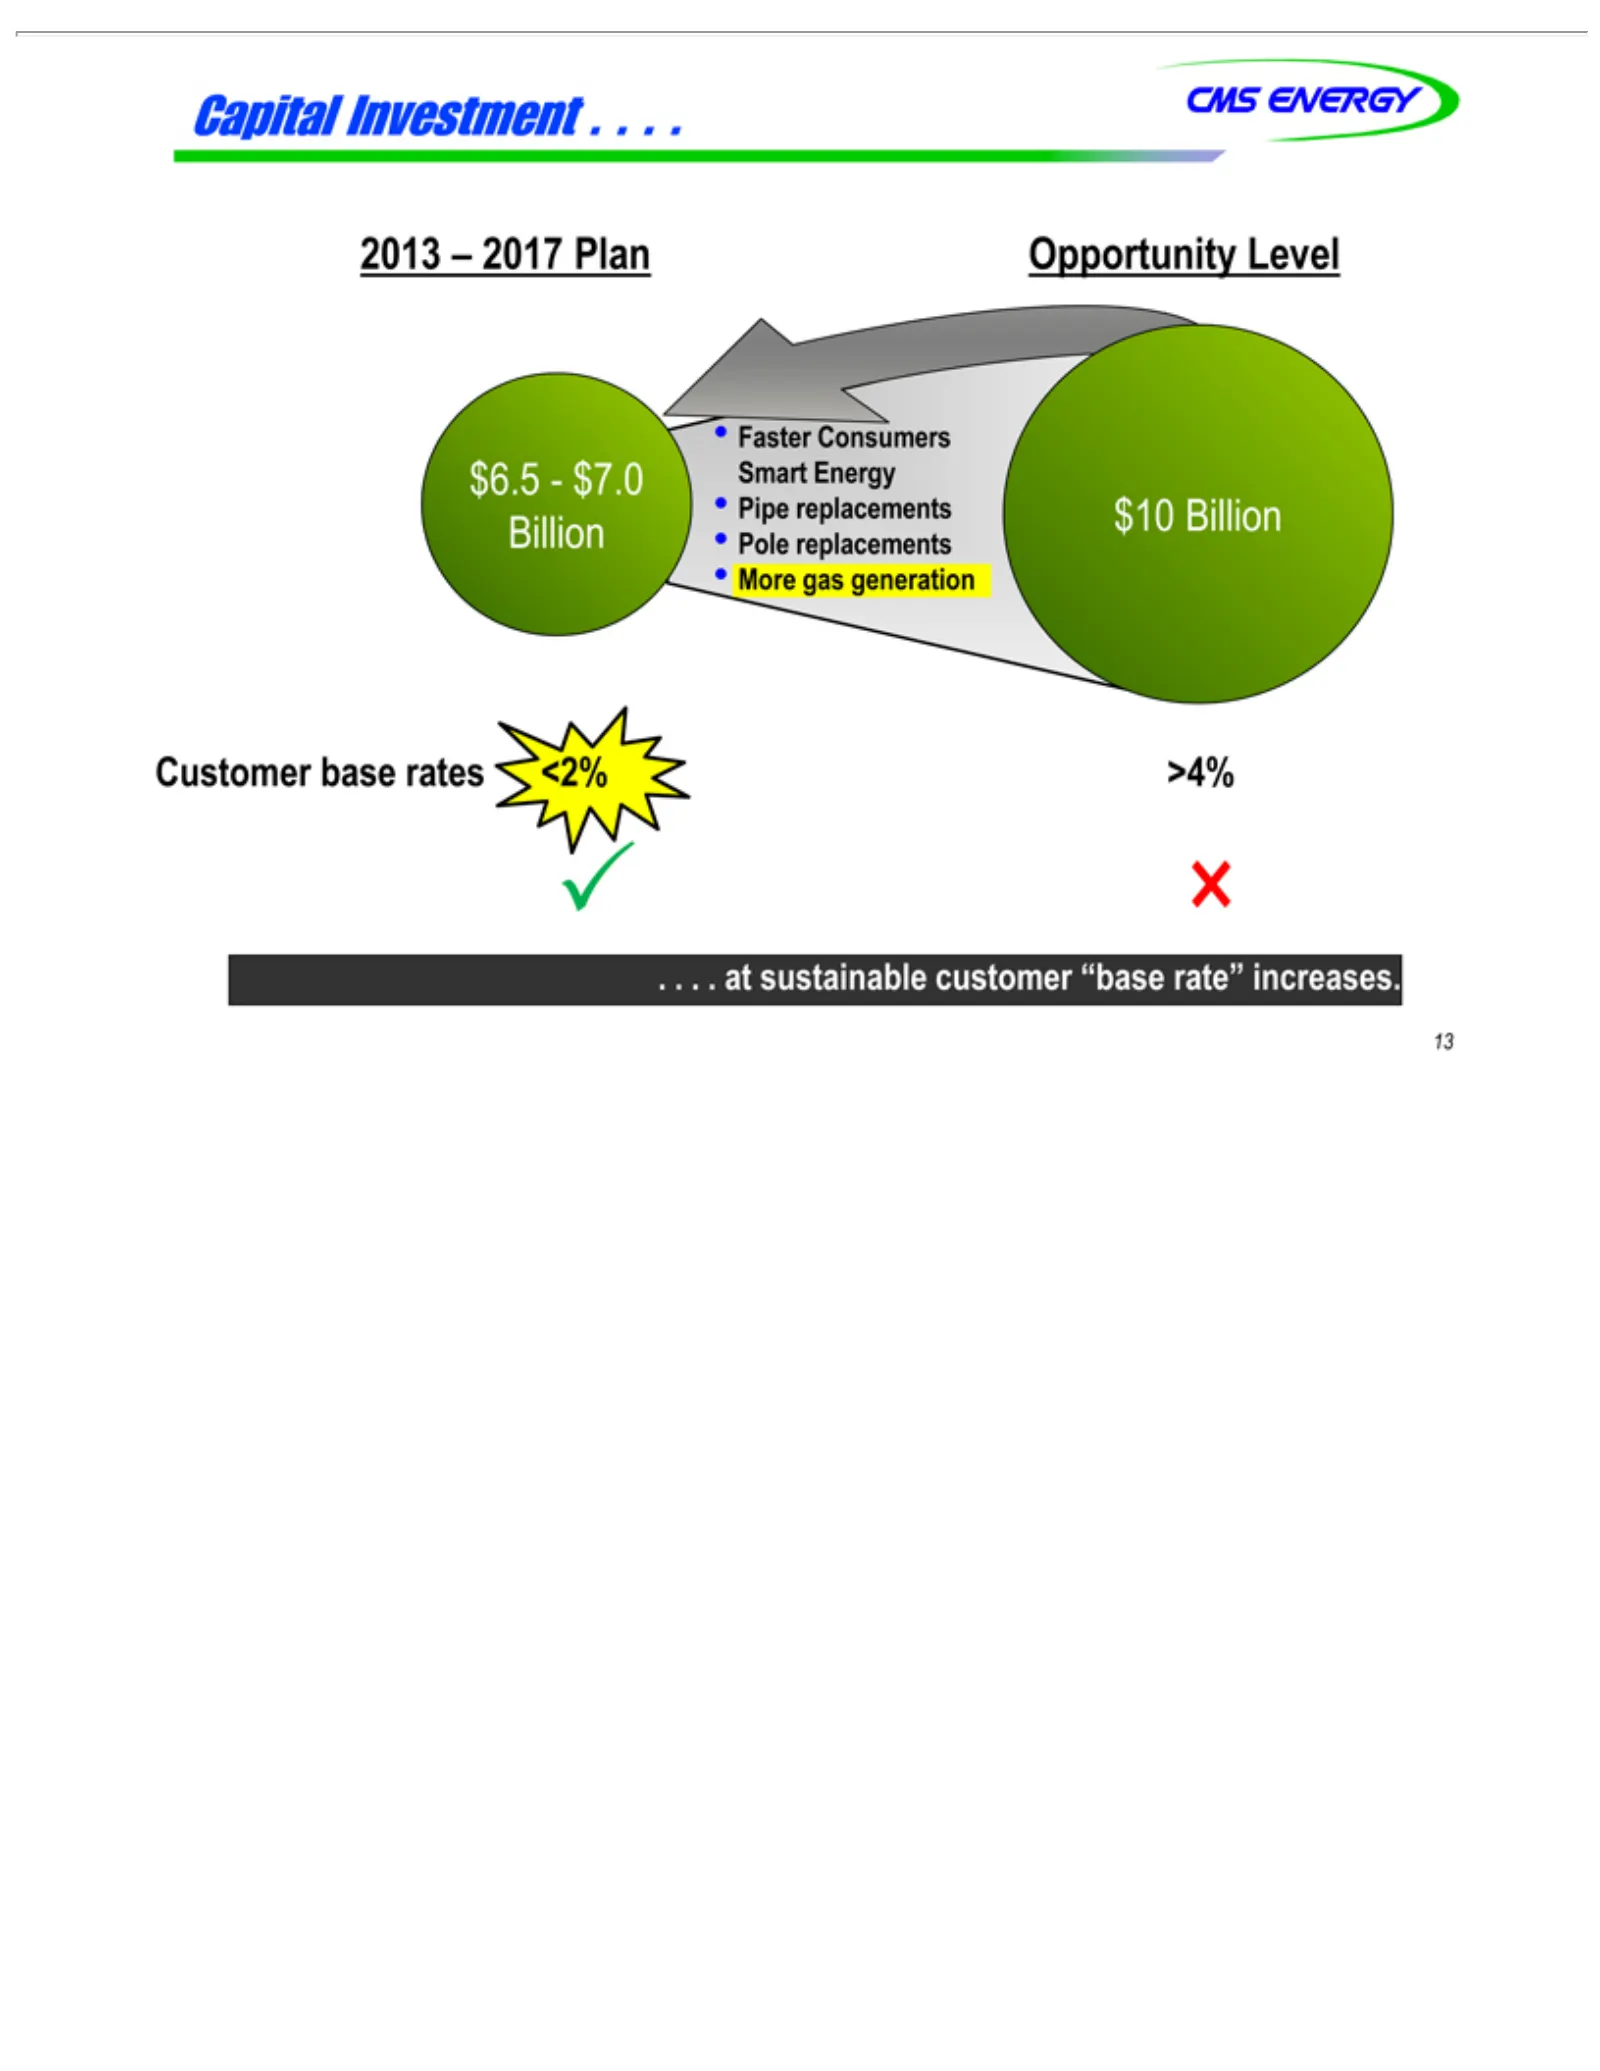
Slide 14: Capital Investment Opportunity
Capital CMS 2013 Opportunity •$6.5 $10 .Customer X ü >4% 13.More Faster Pipe Pole . .Billion ––ENERGY atreplacements $7.0 sustainable 2017 gas Investment Consumers rates generation Billion Level Plan <2% customer .Smart . . . Energy “base rate” increases.
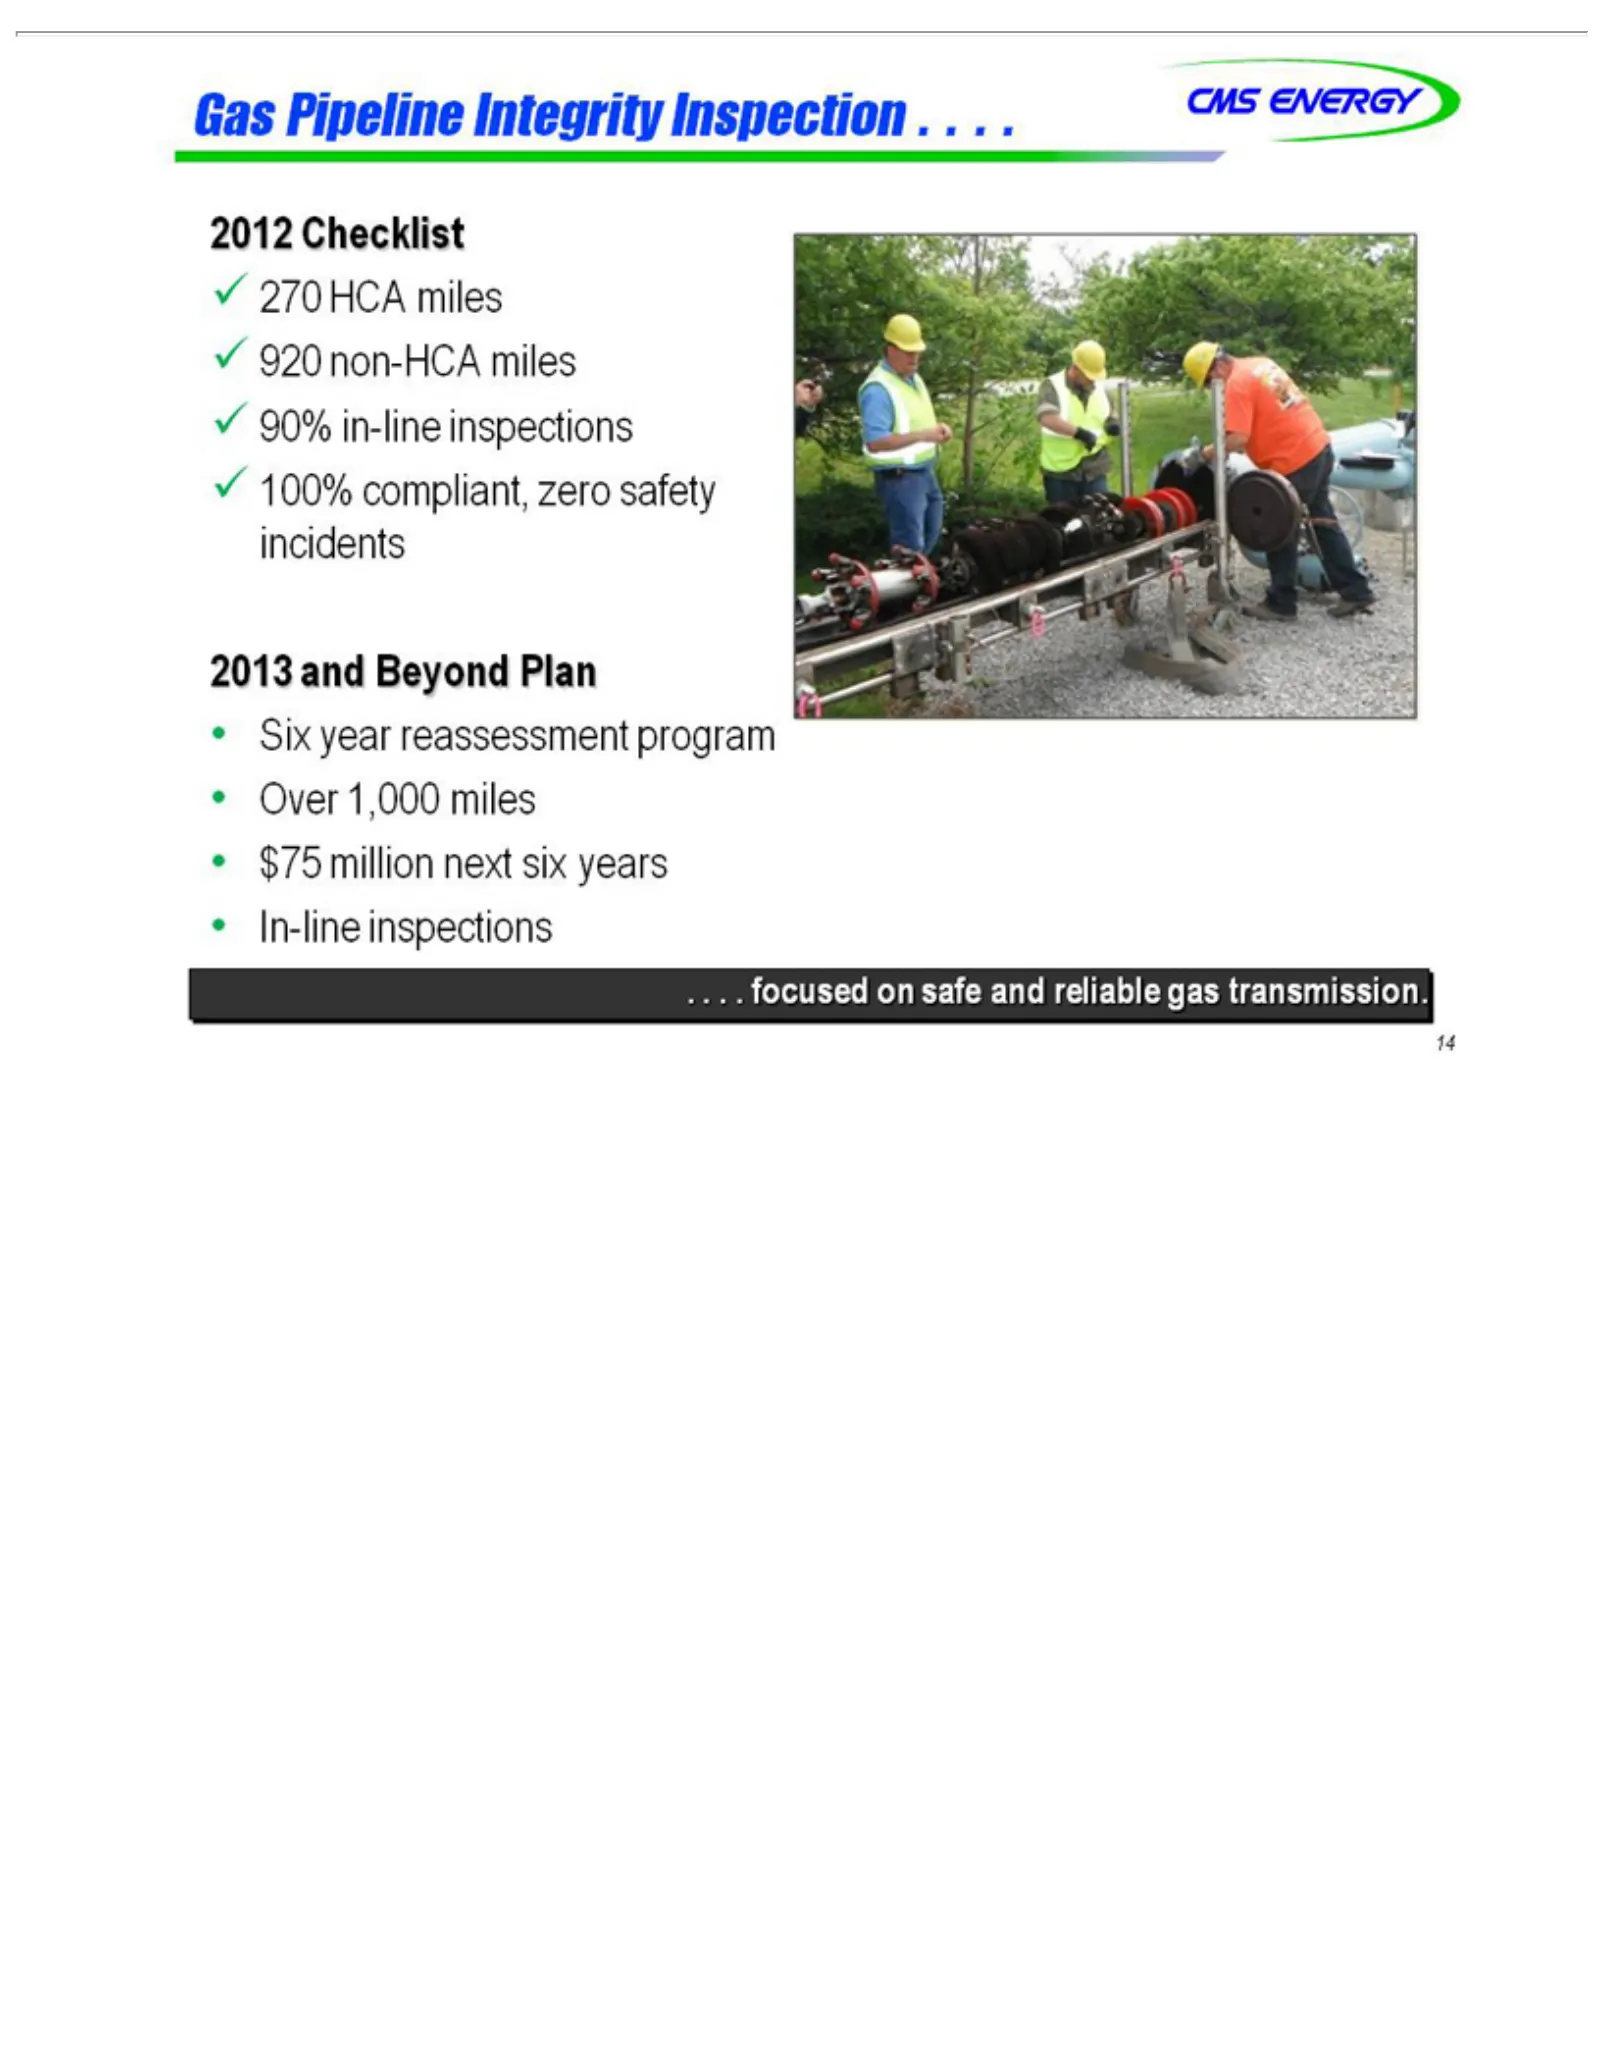
Slide 15: Gas In-line Inspection Program
Gas CMS 2012 ü .•2013 14 .In-line Six Over $75 270 920 90% 100% . . Pipeline focused year Checklist and million ENERGY HCA non-HCA in-line 1,000 compliant, inspections Beyond reassessment miles Integrity miles on next inspections safe miles Plan six zero and years Inspection program safety reliable
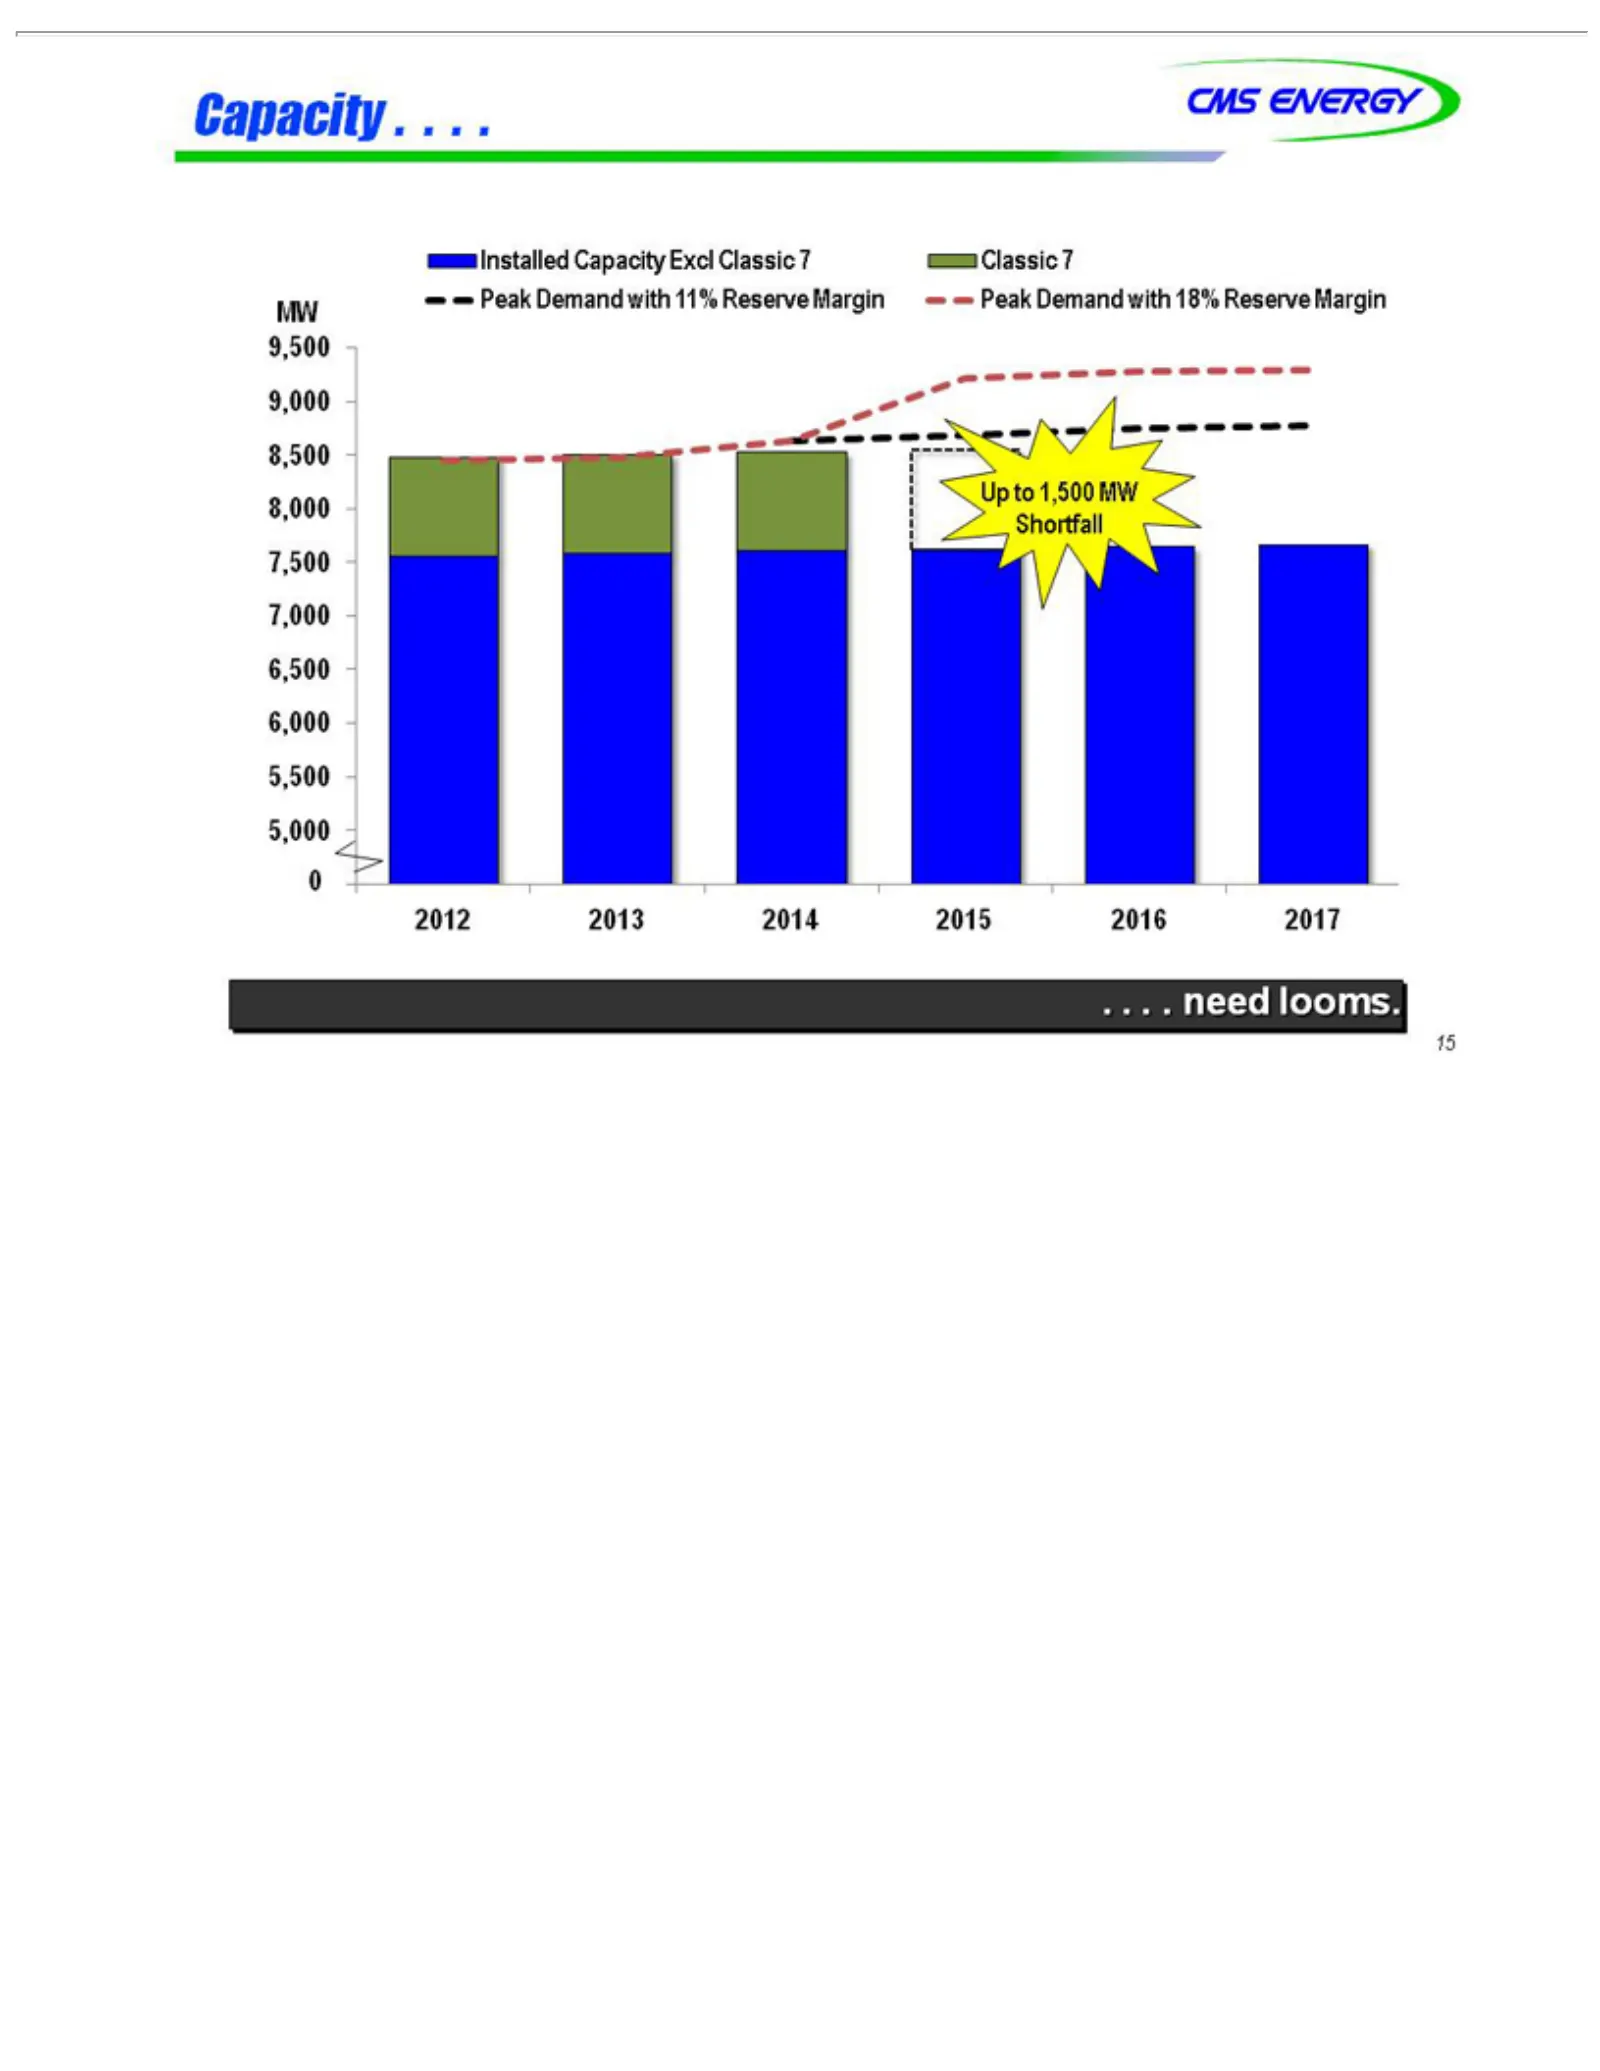
Slide 16: Installed Capacity and Peak Demand
Capacity CMS Installed Classic Peak MW Up .2012 15 . . to . need 9,500 Demand 2013 ENERGY 1,500 7 Capacity . looms. ..2014 9,000 MW . .with 2015 8,500 Shortfall Excl 11% 18% 2016 8,000 Classic Reserve 2017 7,500 7 Margin 7,000 6,500 6,000 5,500 5,000 0
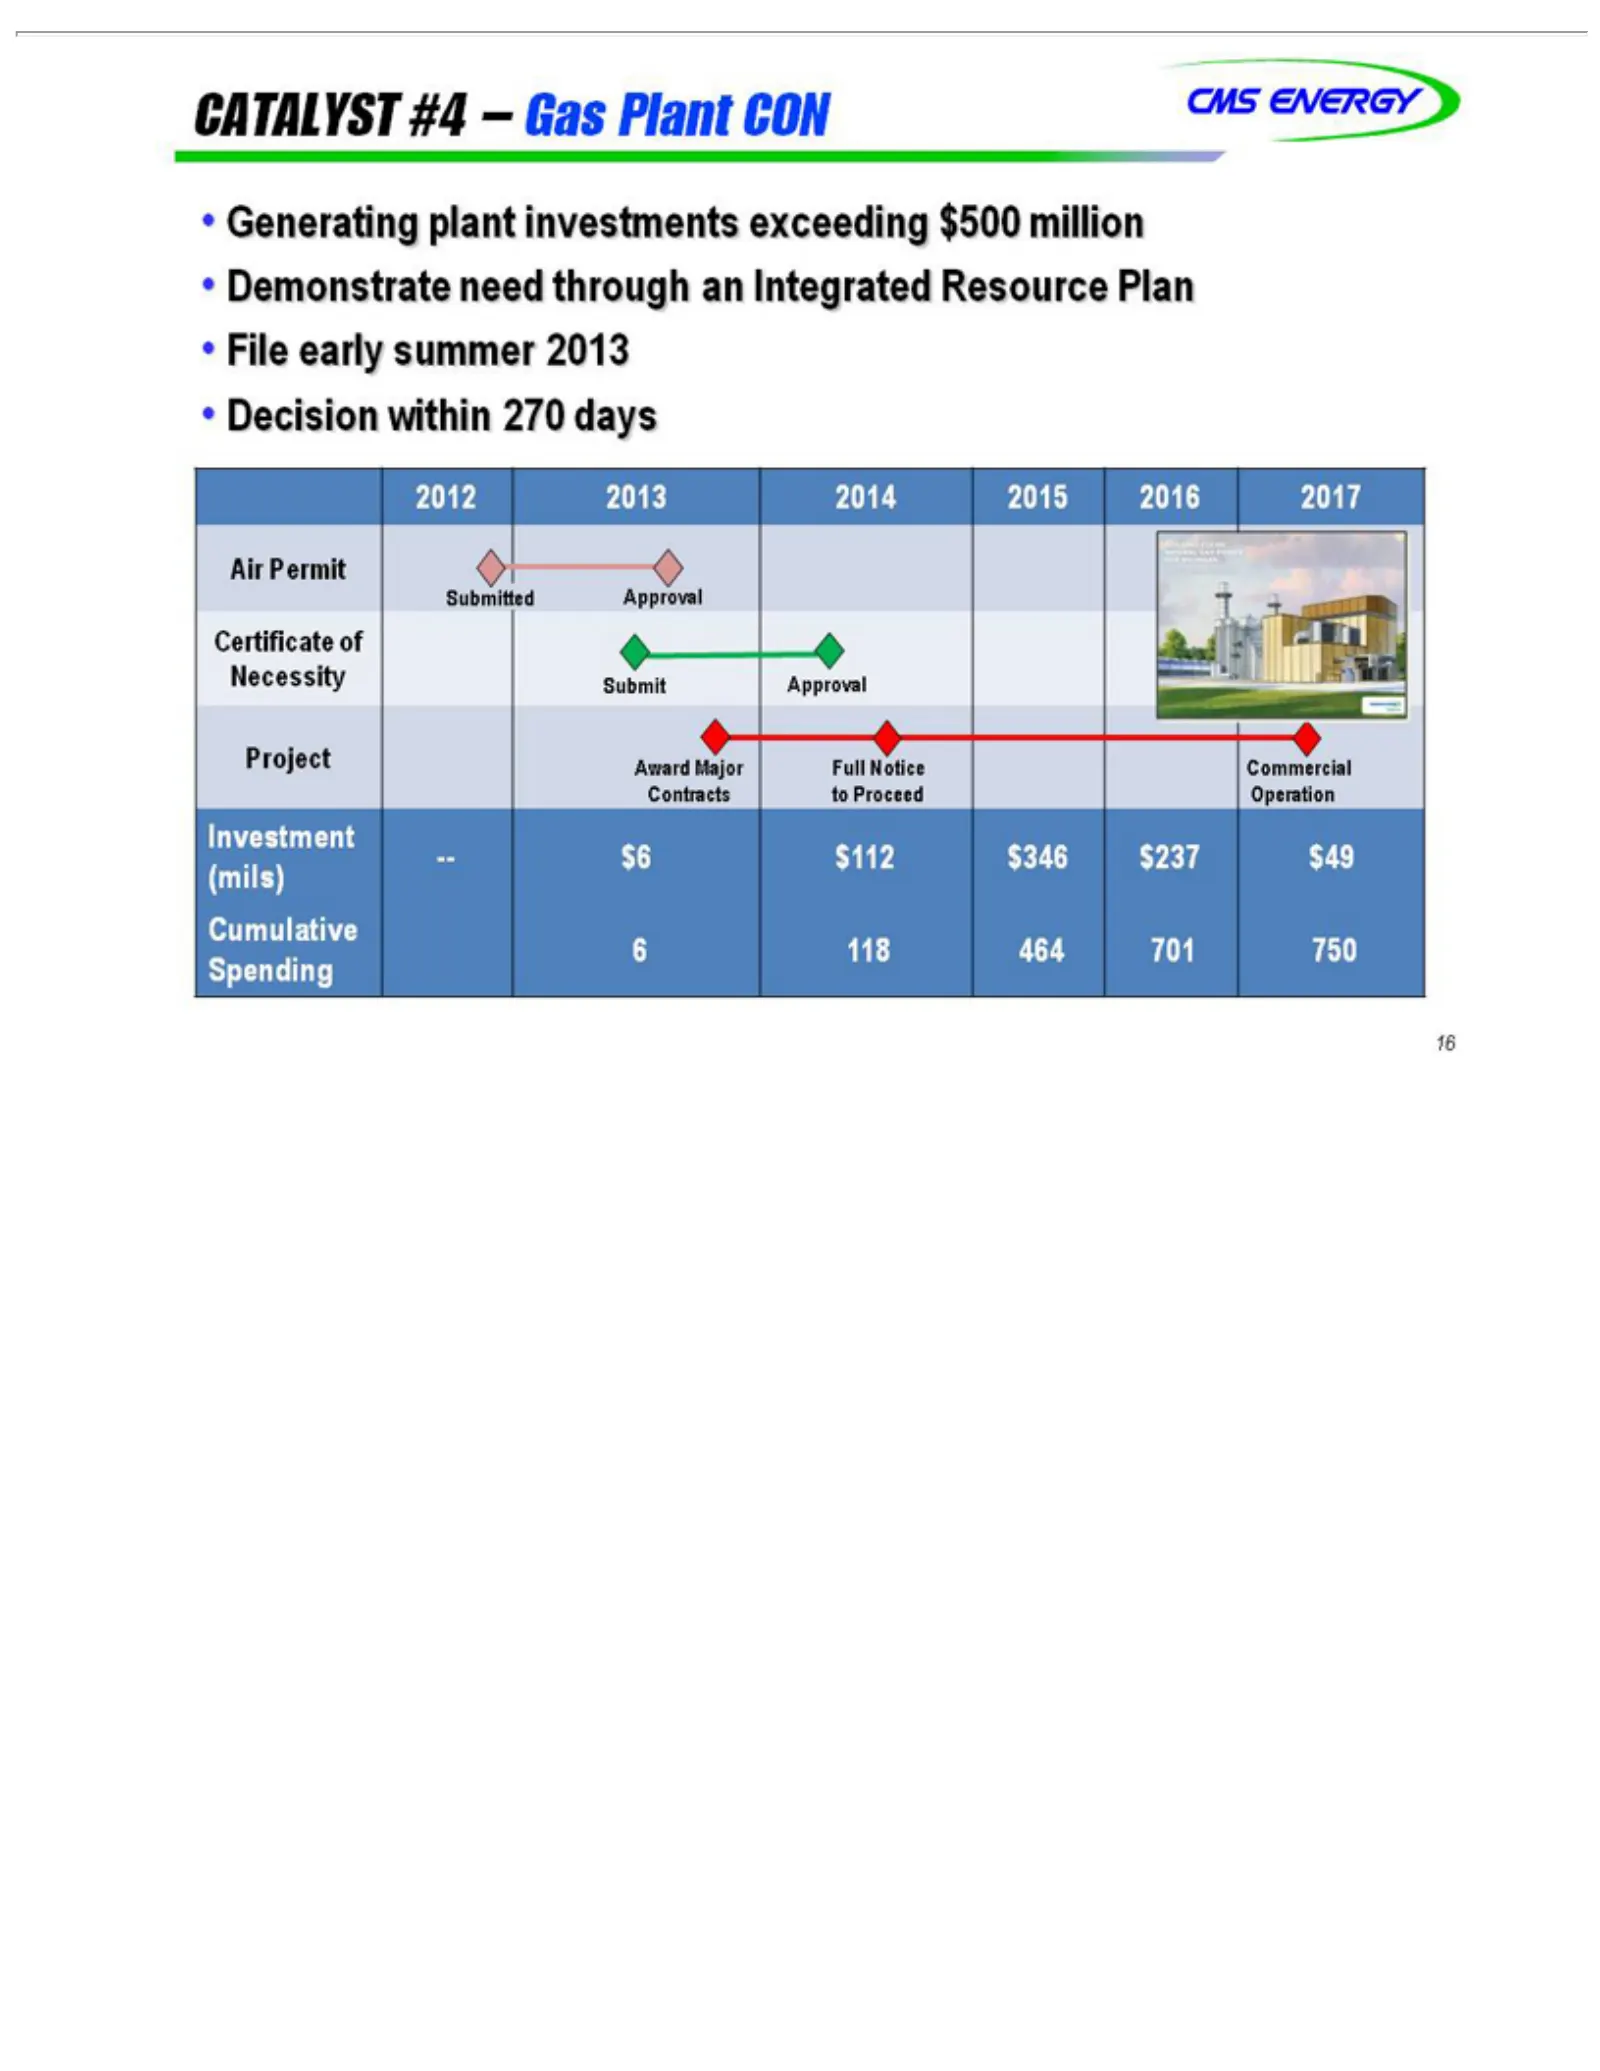
Slide 17: Catalyst 4: Gas Plant Approval
CATALYST •CMS 2012 Air Submitted Certificate Necessity Project Contracts Investment Cumulative (mils) 16 Spending Generating Demonstrate File Decision Permit 2013 ENERGY early Award to Submit Approval within of 2014 summer —6Proceed #4 plant 118 Major $6 need –2015 Gas $112 270 Approval 464 investme
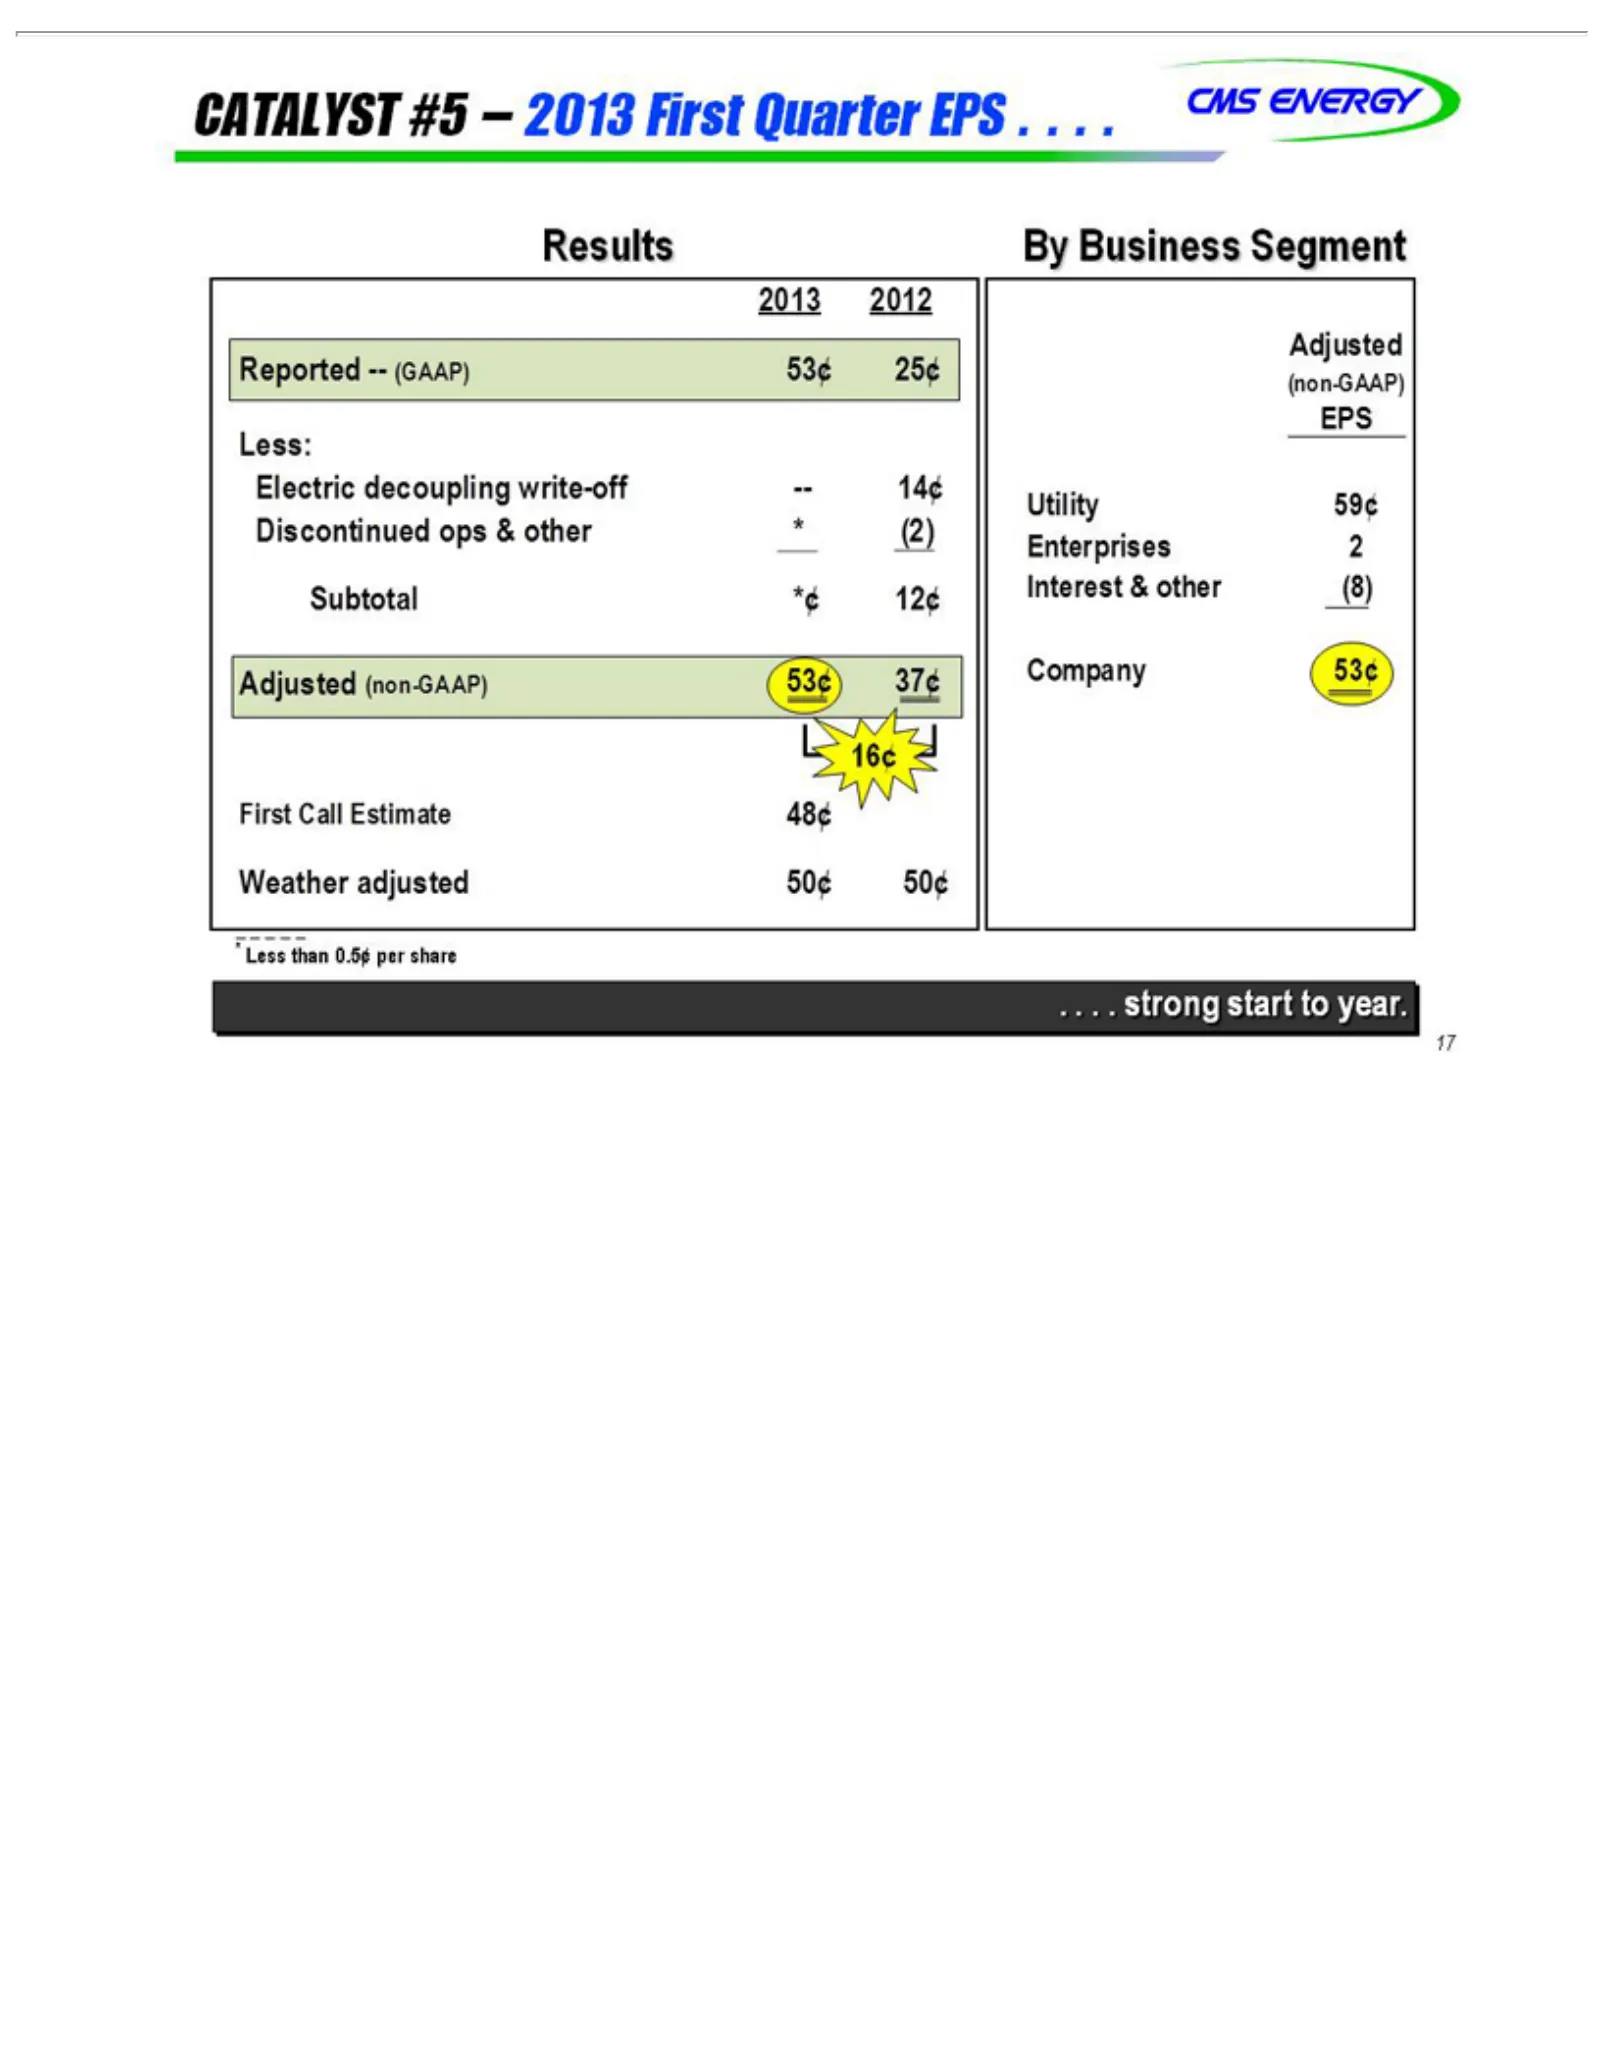
Slide 18: Catalyst 5: First Quarter 2013 Results
CATALYST CMS 2013 Results Reported Electric Less: Discontinued Subtotal First 16¢ Weather By Utility EPS (non-GAAP) Adjusted Enterprises Interest Company .* 17.Less . Business . strong Call 2012 ENERGY than 59¢ & decoupling adjusted *¢ (non-GAAP) — Estimate 53¢ other 2start 0.5¢ 12¢ #5 (GAAP) Segmen
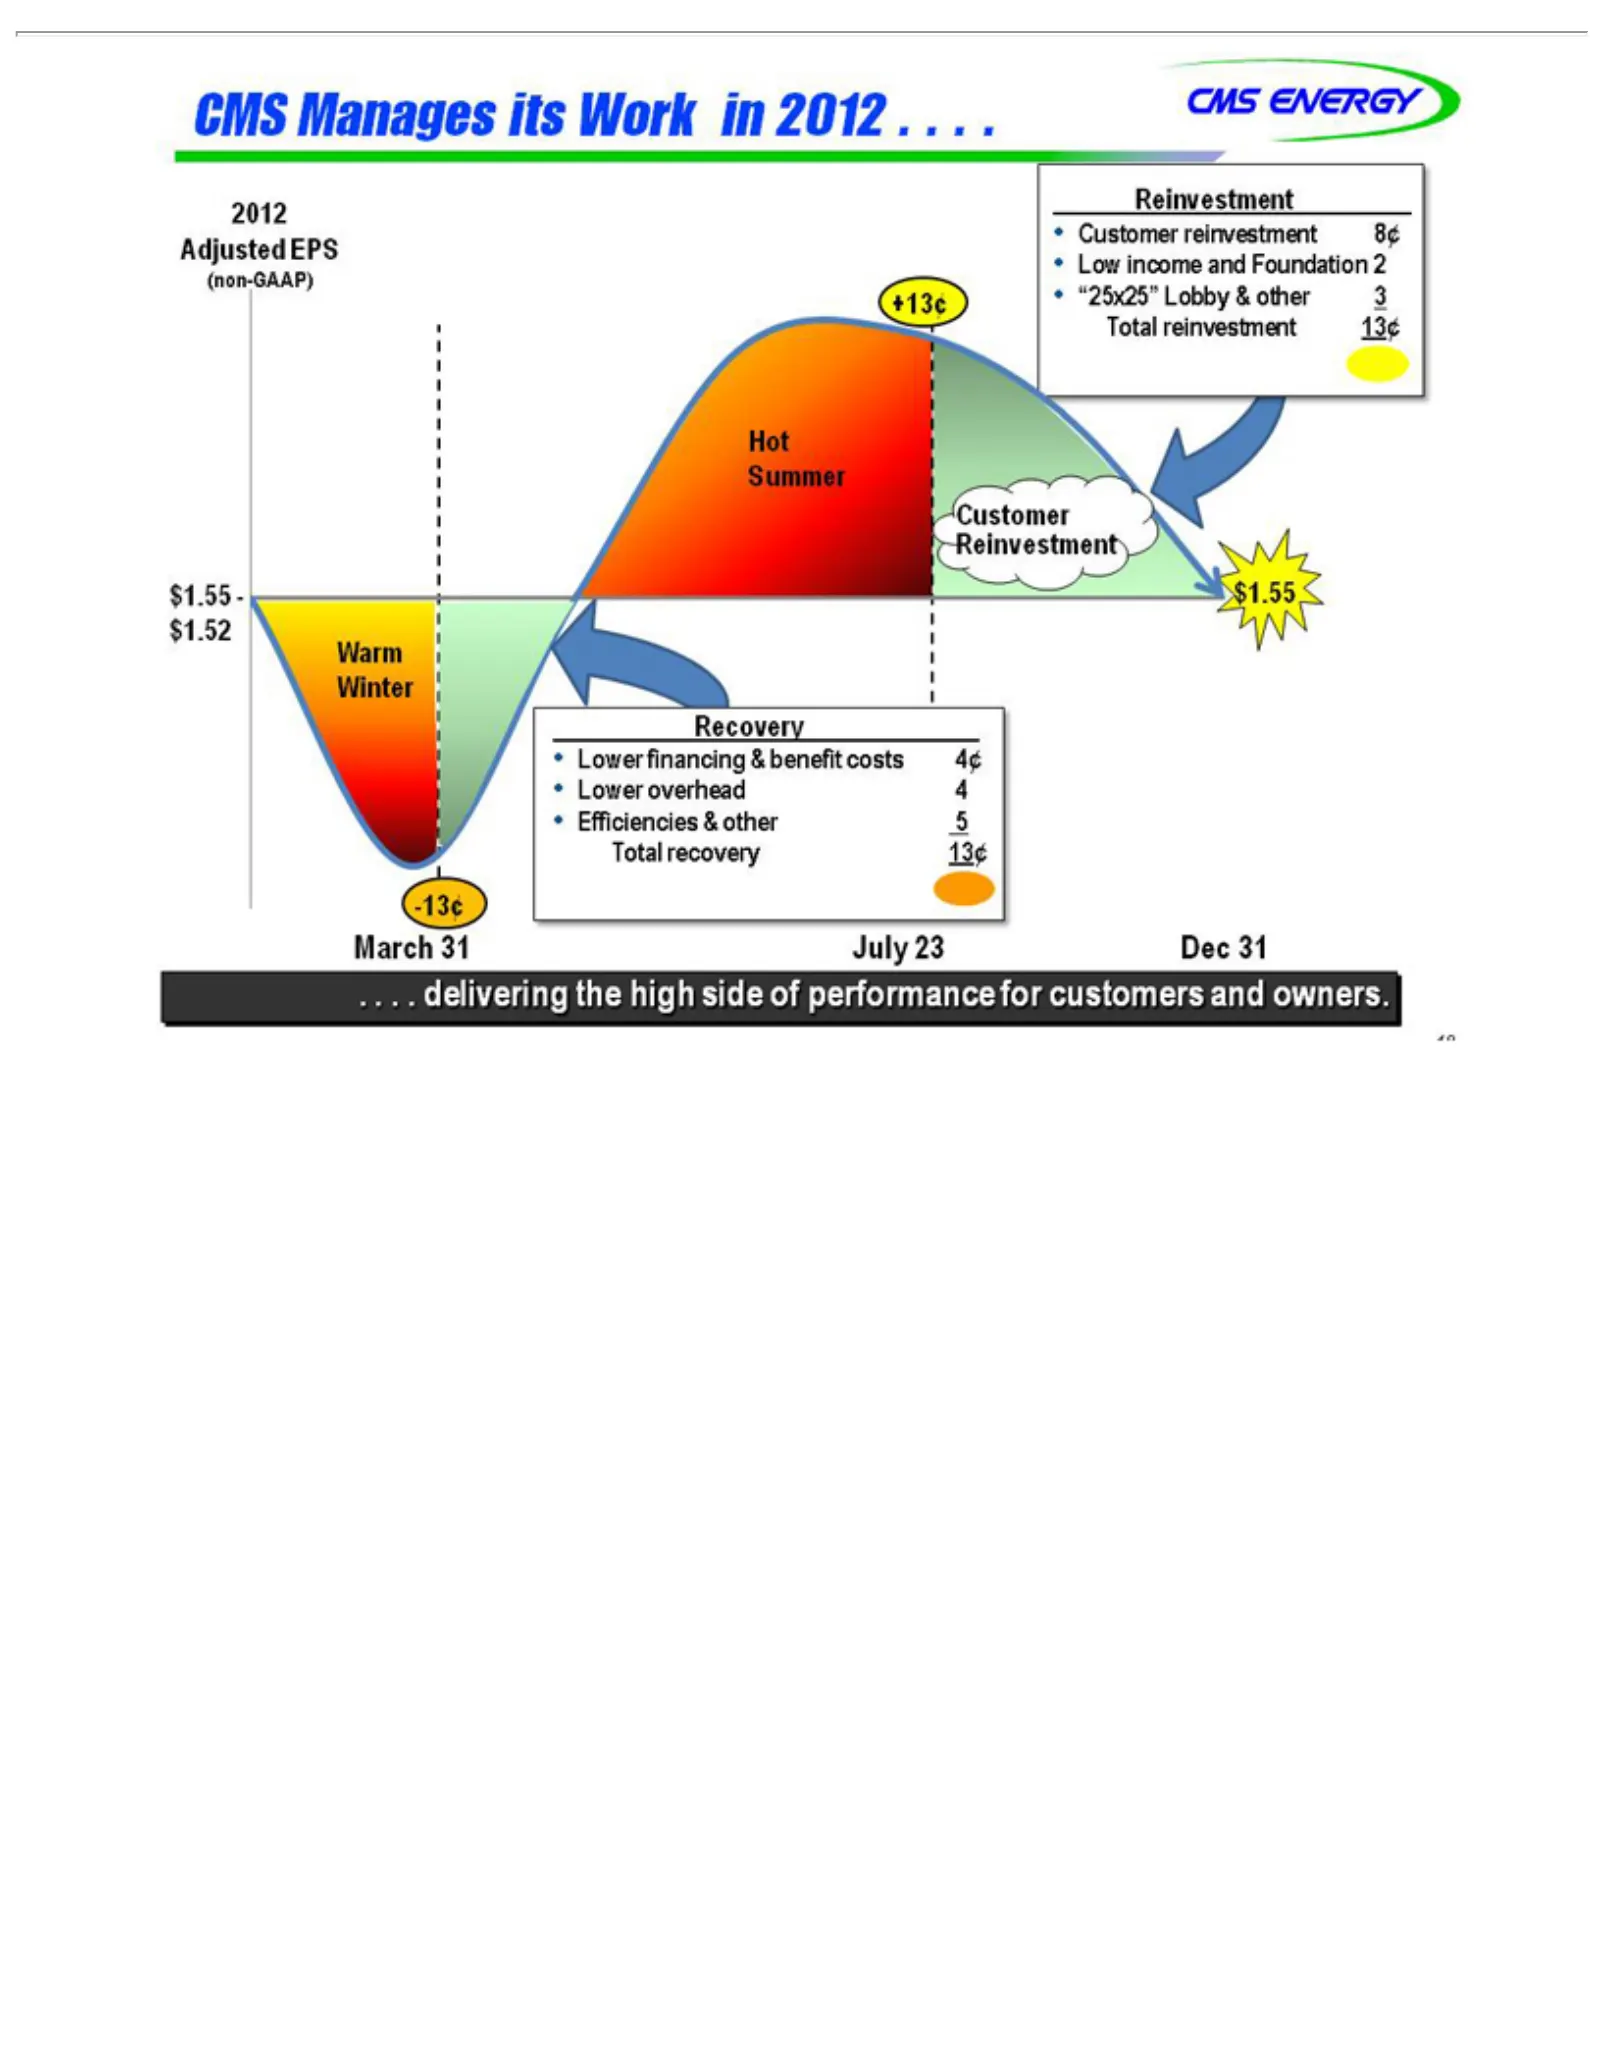
Slide 19: 2012 Adjusted EPS and Reinvestment
CMS 2012 Reinvestment (non-GAAP) Warm Hot Customer +13¢ March -13¢ $1.55 •Recovery Total July .Dec 18 .Efficiencies Customer Low “25x25” Lower . .Summer 31 23 delivering Adjusted reinvestment recovery Manages ENERGY -Winter income 31 $1.52 financing overhead Reinvestment Lobby reinvestment &and 13¢
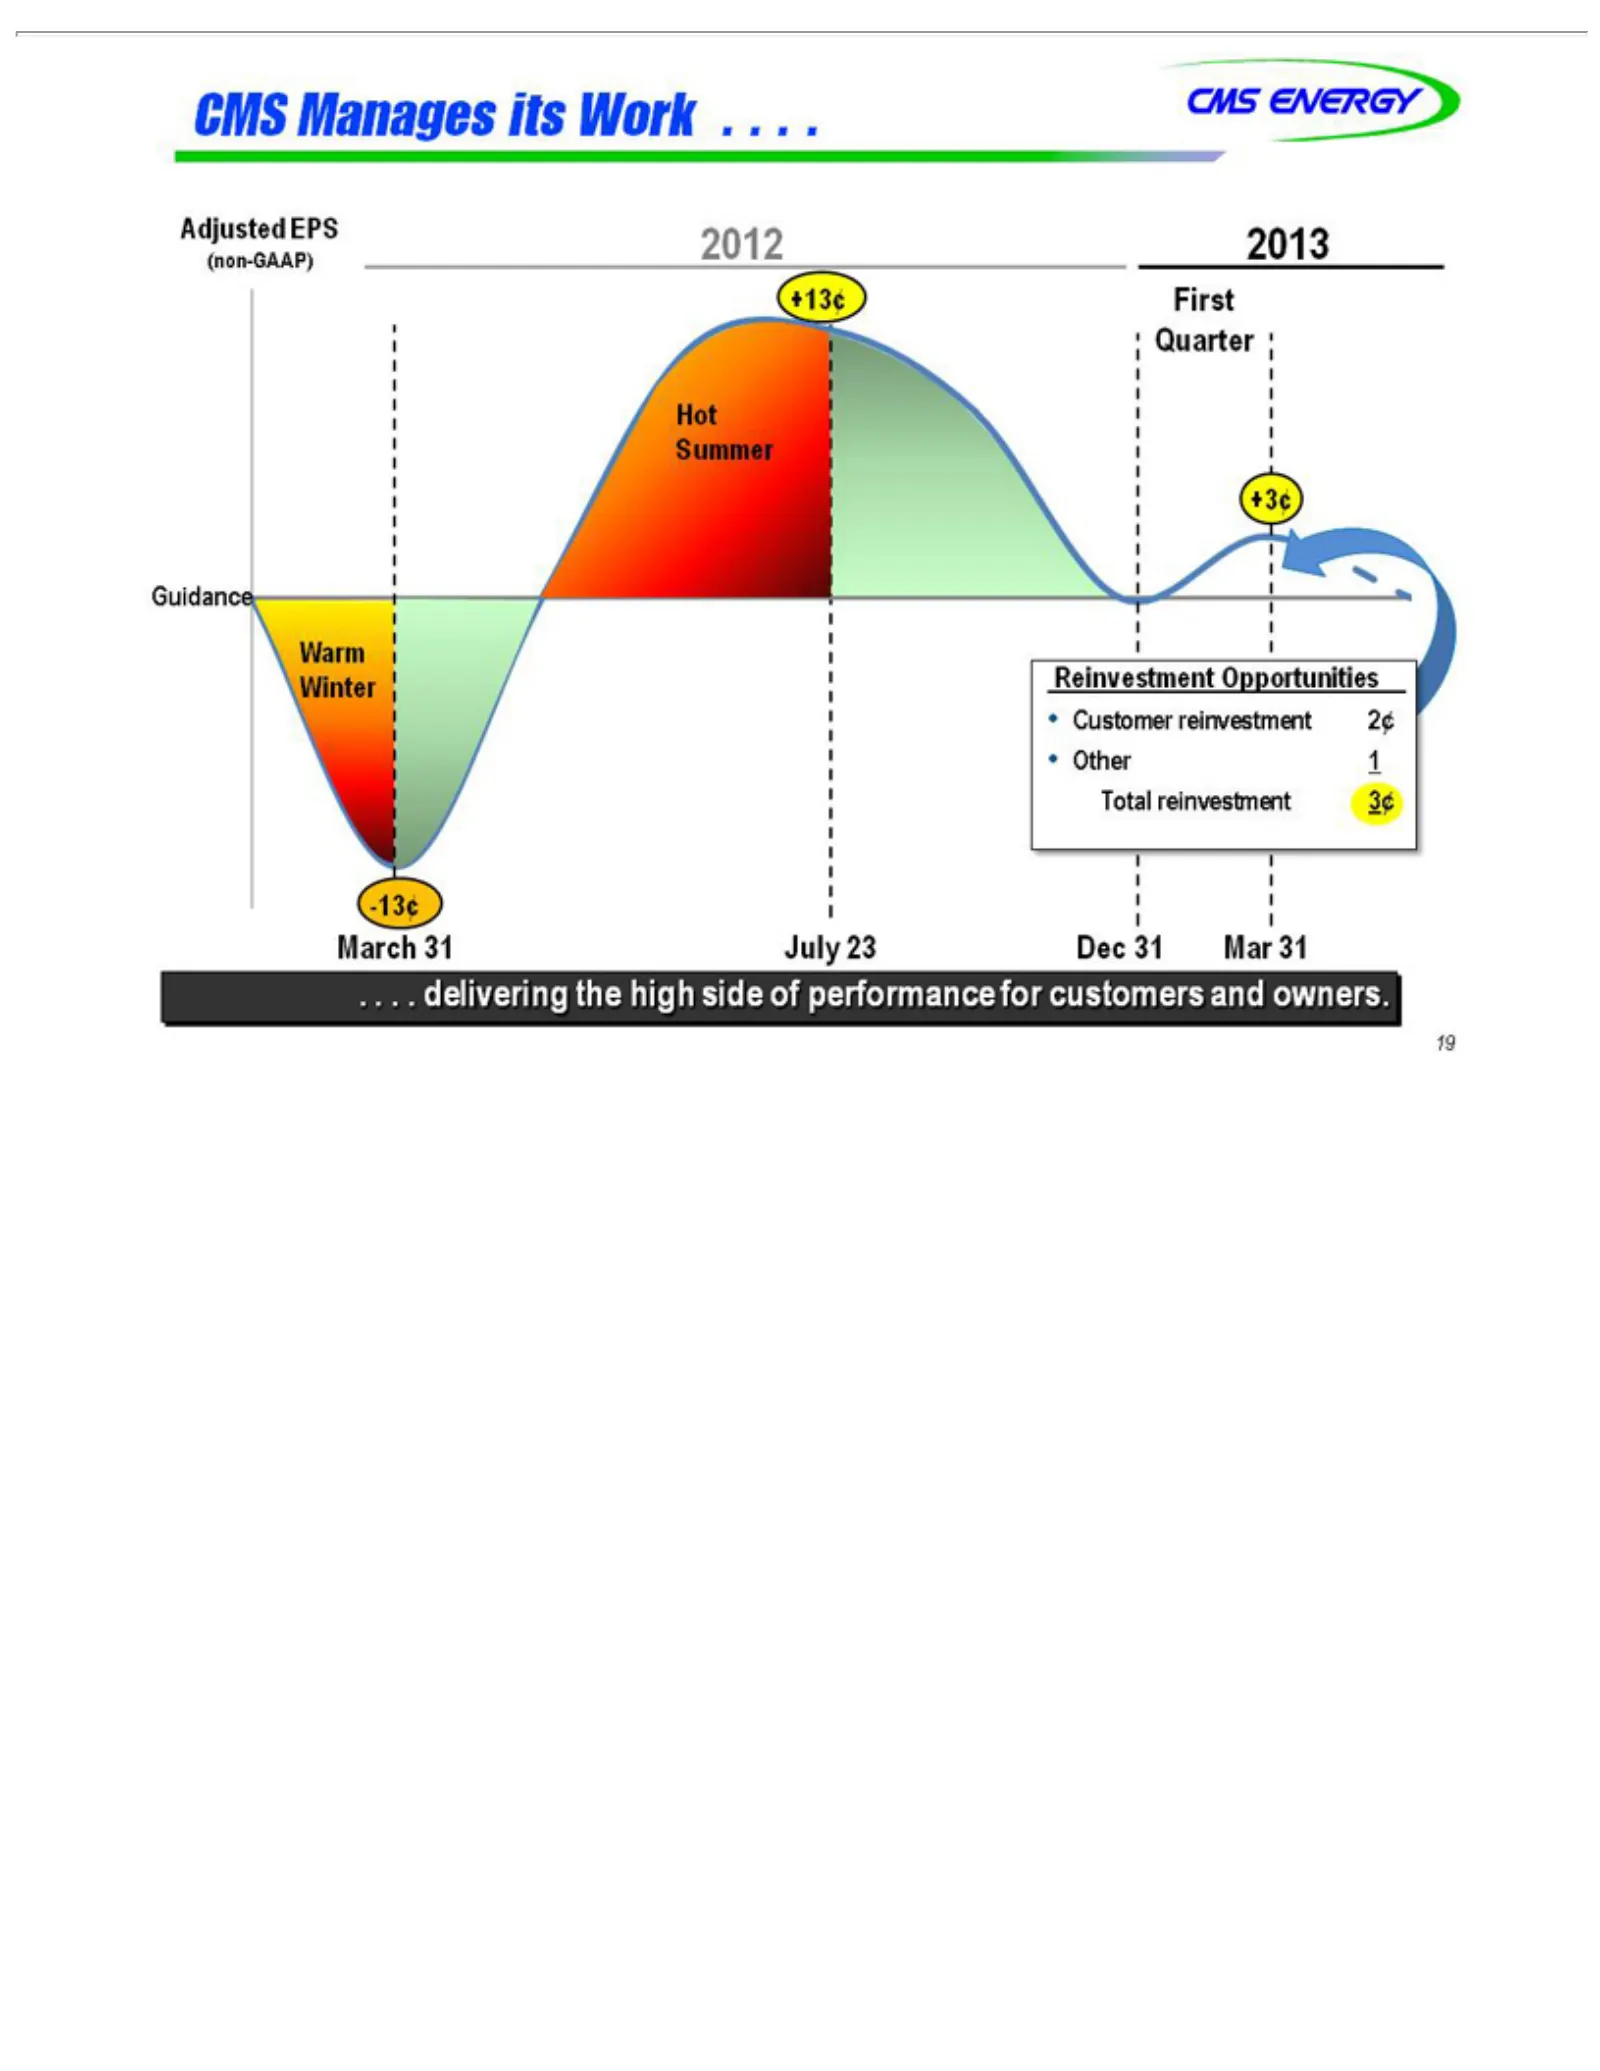
Slide 20: 2013 Adjusted EPS Guidance
CMS Adjusted Warm Guidance 2013 2012 (non-GAAP) March -13¢ Hot +13¢ July First Reinvestment •+3¢ Total .Dec 19 .Other Customer . .Summer 31 23 delivering Quarter reinvestment Manages ENERGY Winter 31 Mar 1 EPS reinvestment 31Opportunities its theWork 3¢ high side . 2¢ . . . of performance for custom
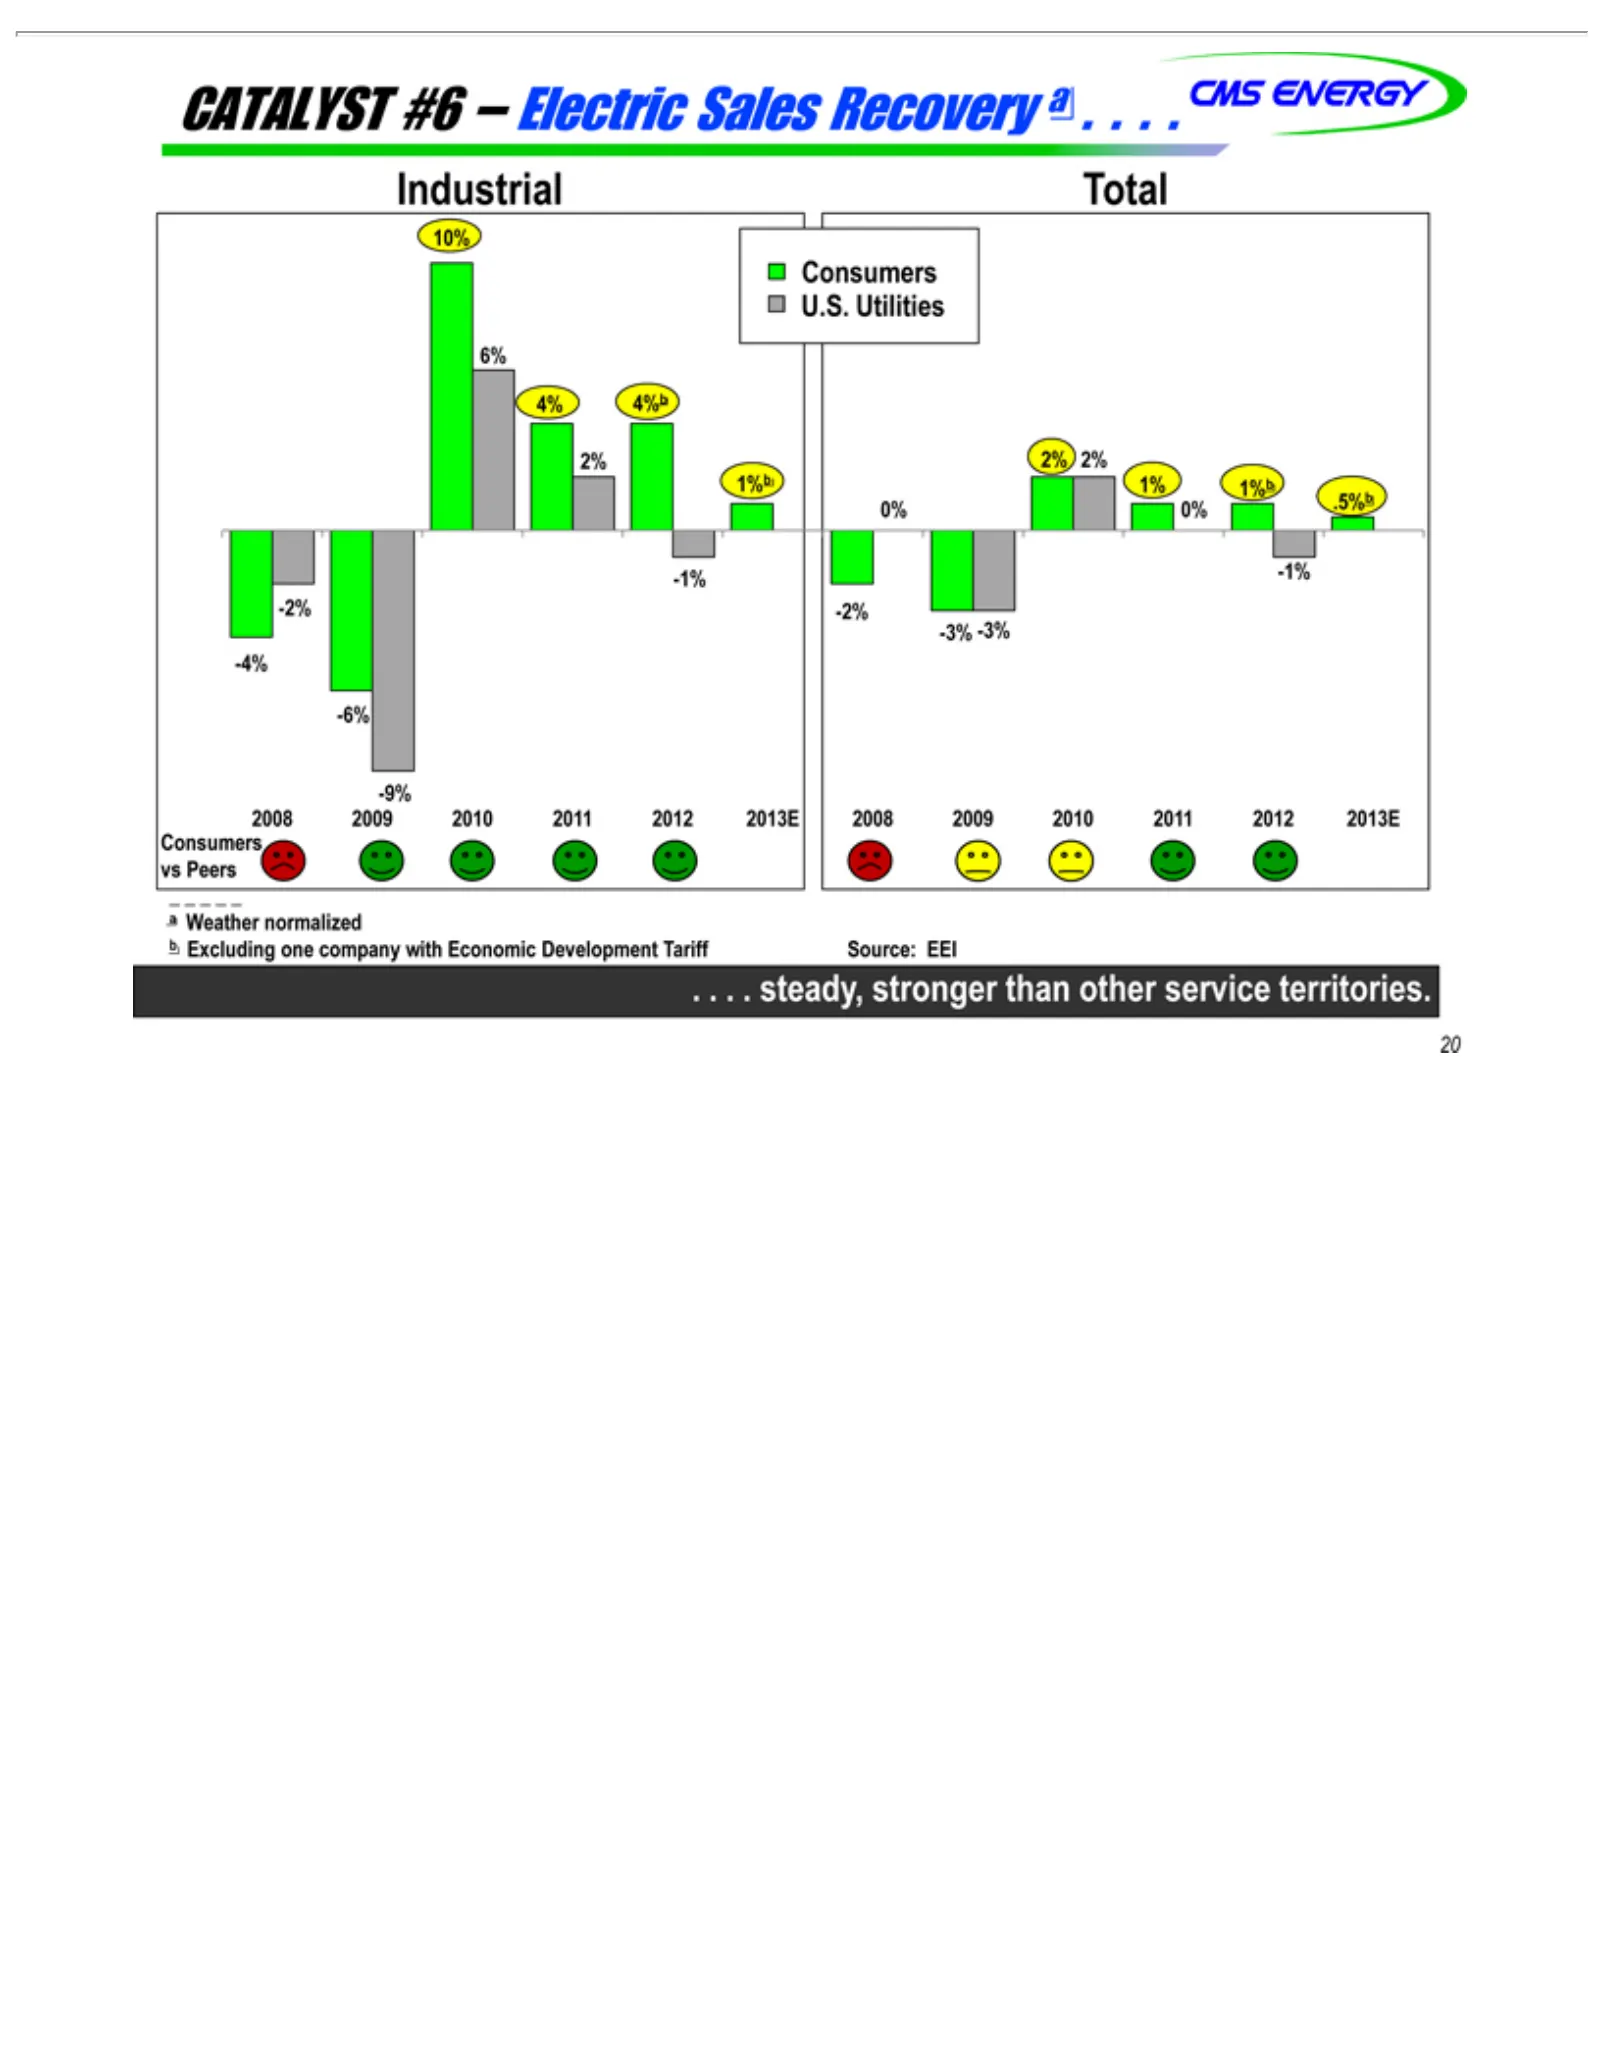
Slide 21: Catalyst 6: Industrial Sales Recovery
CATALYST CMS Industrial 4% 6% 10% -9% -6% -4% 1%b Consumers 2% Total 1% 0% -3% -2% -1% a2008 .Source: 20 .Weather . .0% 4%b 2% 1%b -3% steady, 2009 ENERGY EEI .5%b normalized 2010 U.S. vs stronger #6Peers –2011 Utilities Electric than 2012 b Excluding other Sales 2013E service Recovery one company t
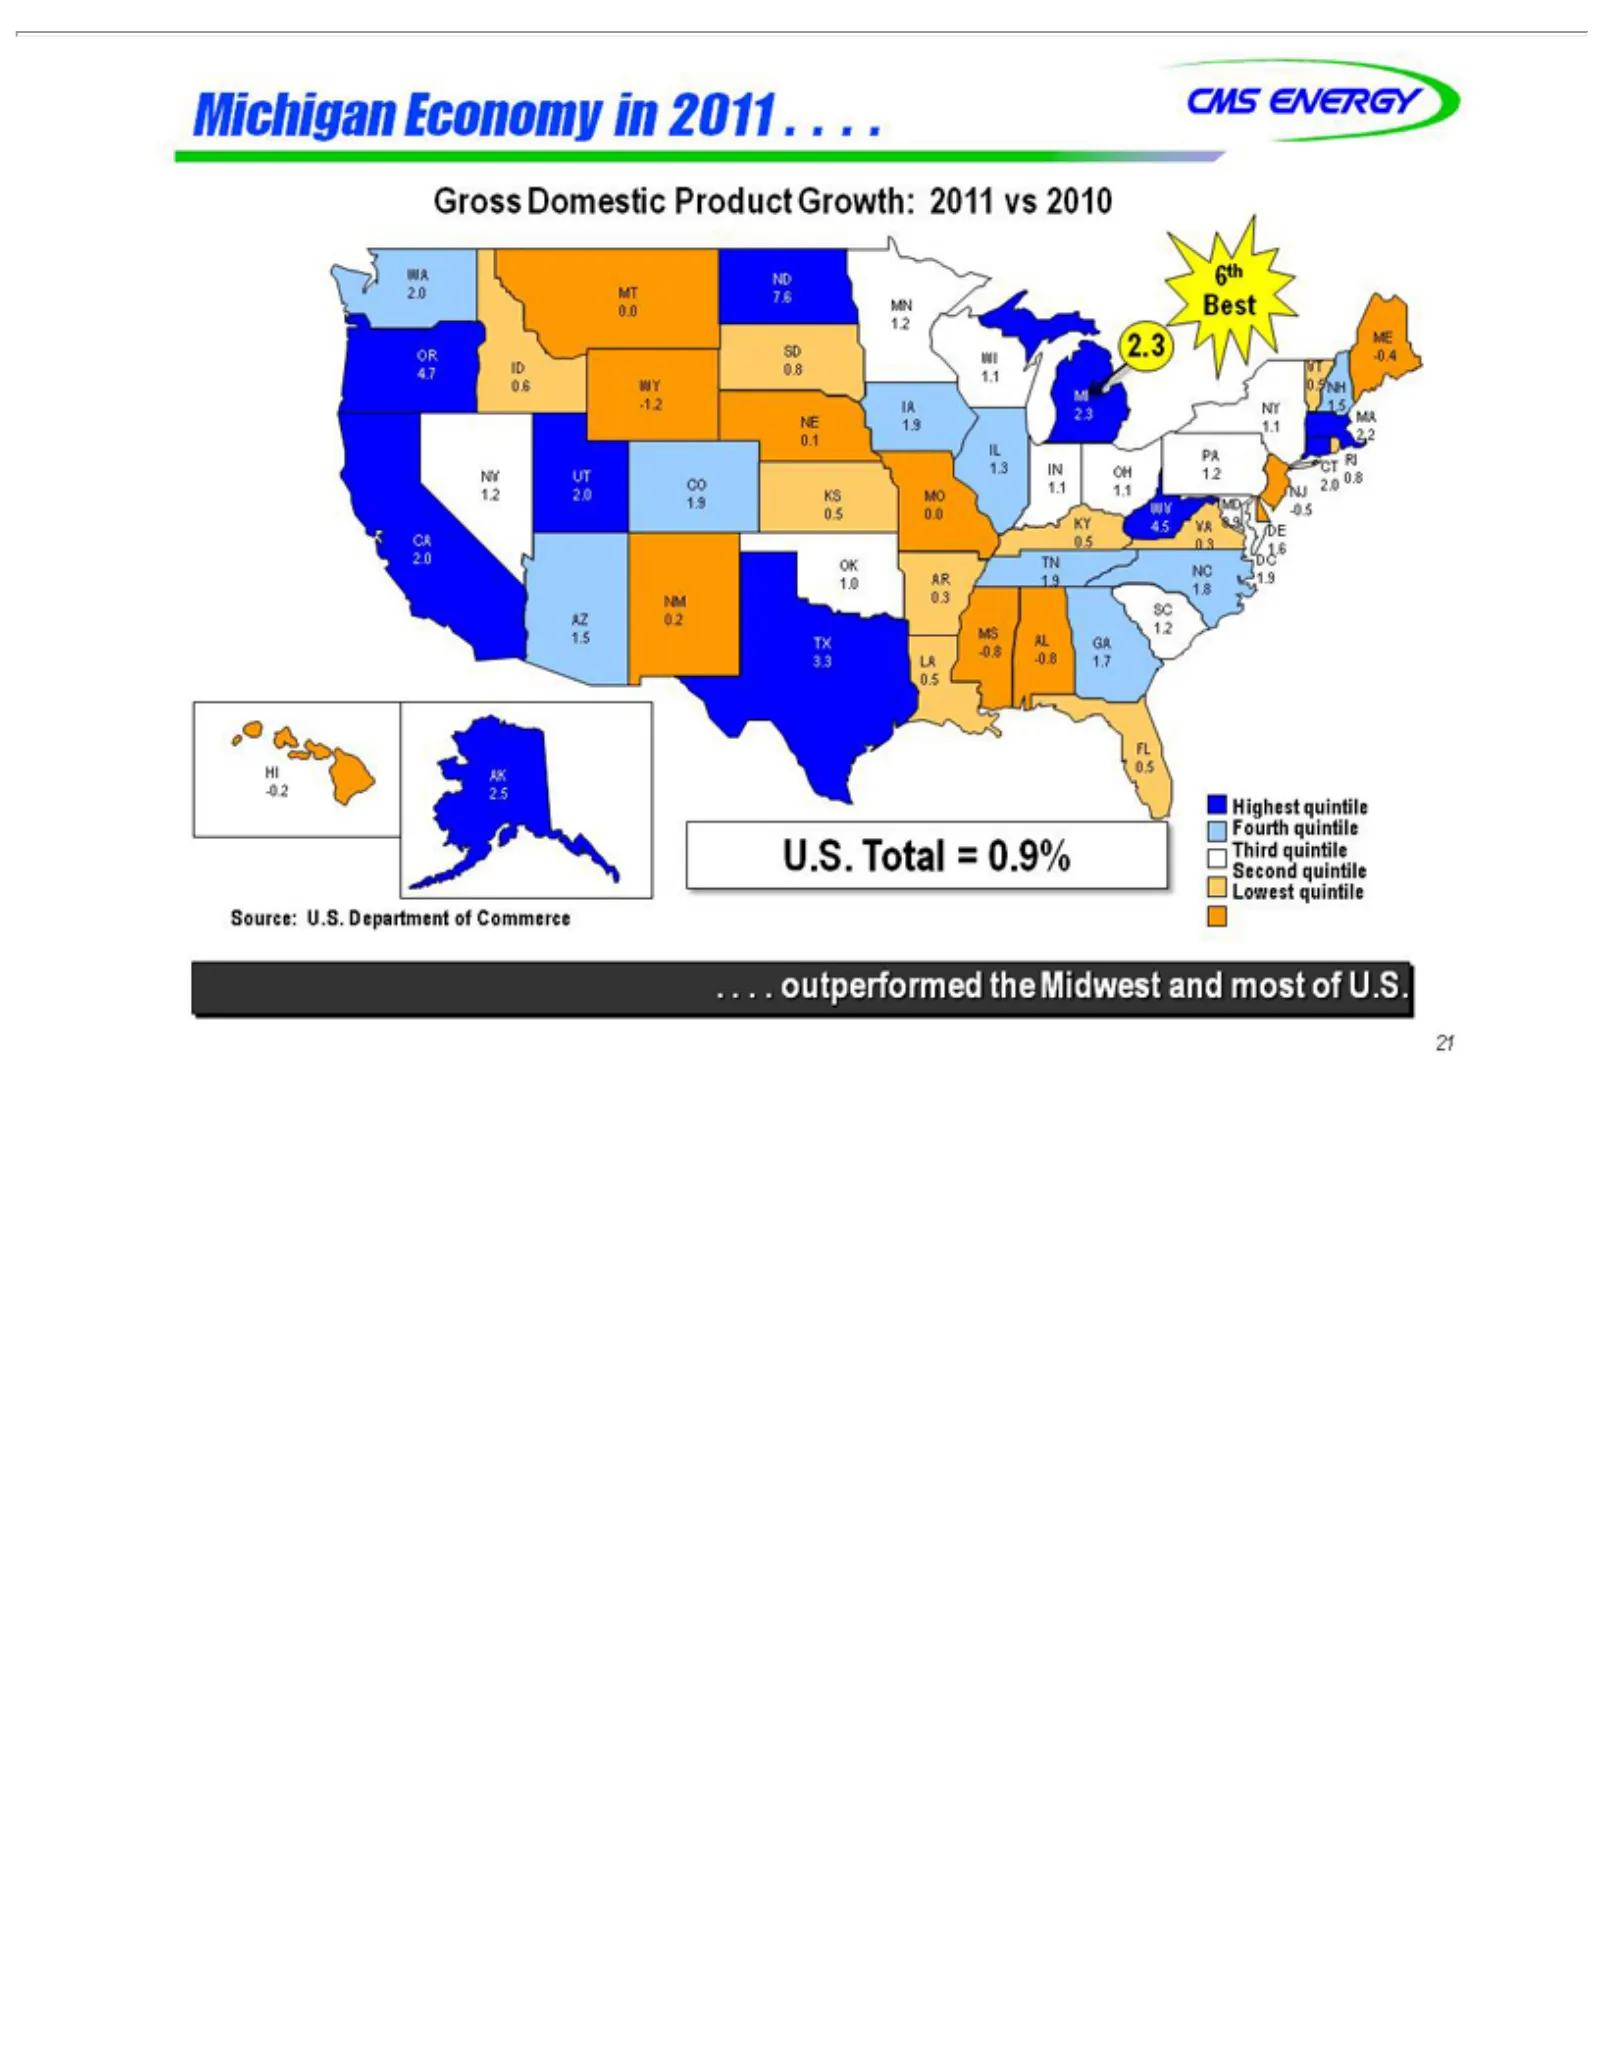
Slide 22: Michigan Gross Domestic Product Growth
Michigan CMS Gross WA MN SD 0.0 4.7 WY 0.6 0.1 1.3 RI NV 1.2 1.9 4.5 0.3 2.0 AR NC 1.0 AZ 1.5 LA 3.3 FL 0.5 -0.2 U.S. .Third 21 . . HI WV TX 7.6 0.8 MI 1.1 2.2 IN 2.0 0.0 CA 1.6 OK 1.8 .1.7 -0.8 2.3 0.2 1.9 UT MT 2.5 Best 1.1 outperformed Total ENERGY quintile Domestic AK OH 0.5 IL MD -0.5 NM AL ME
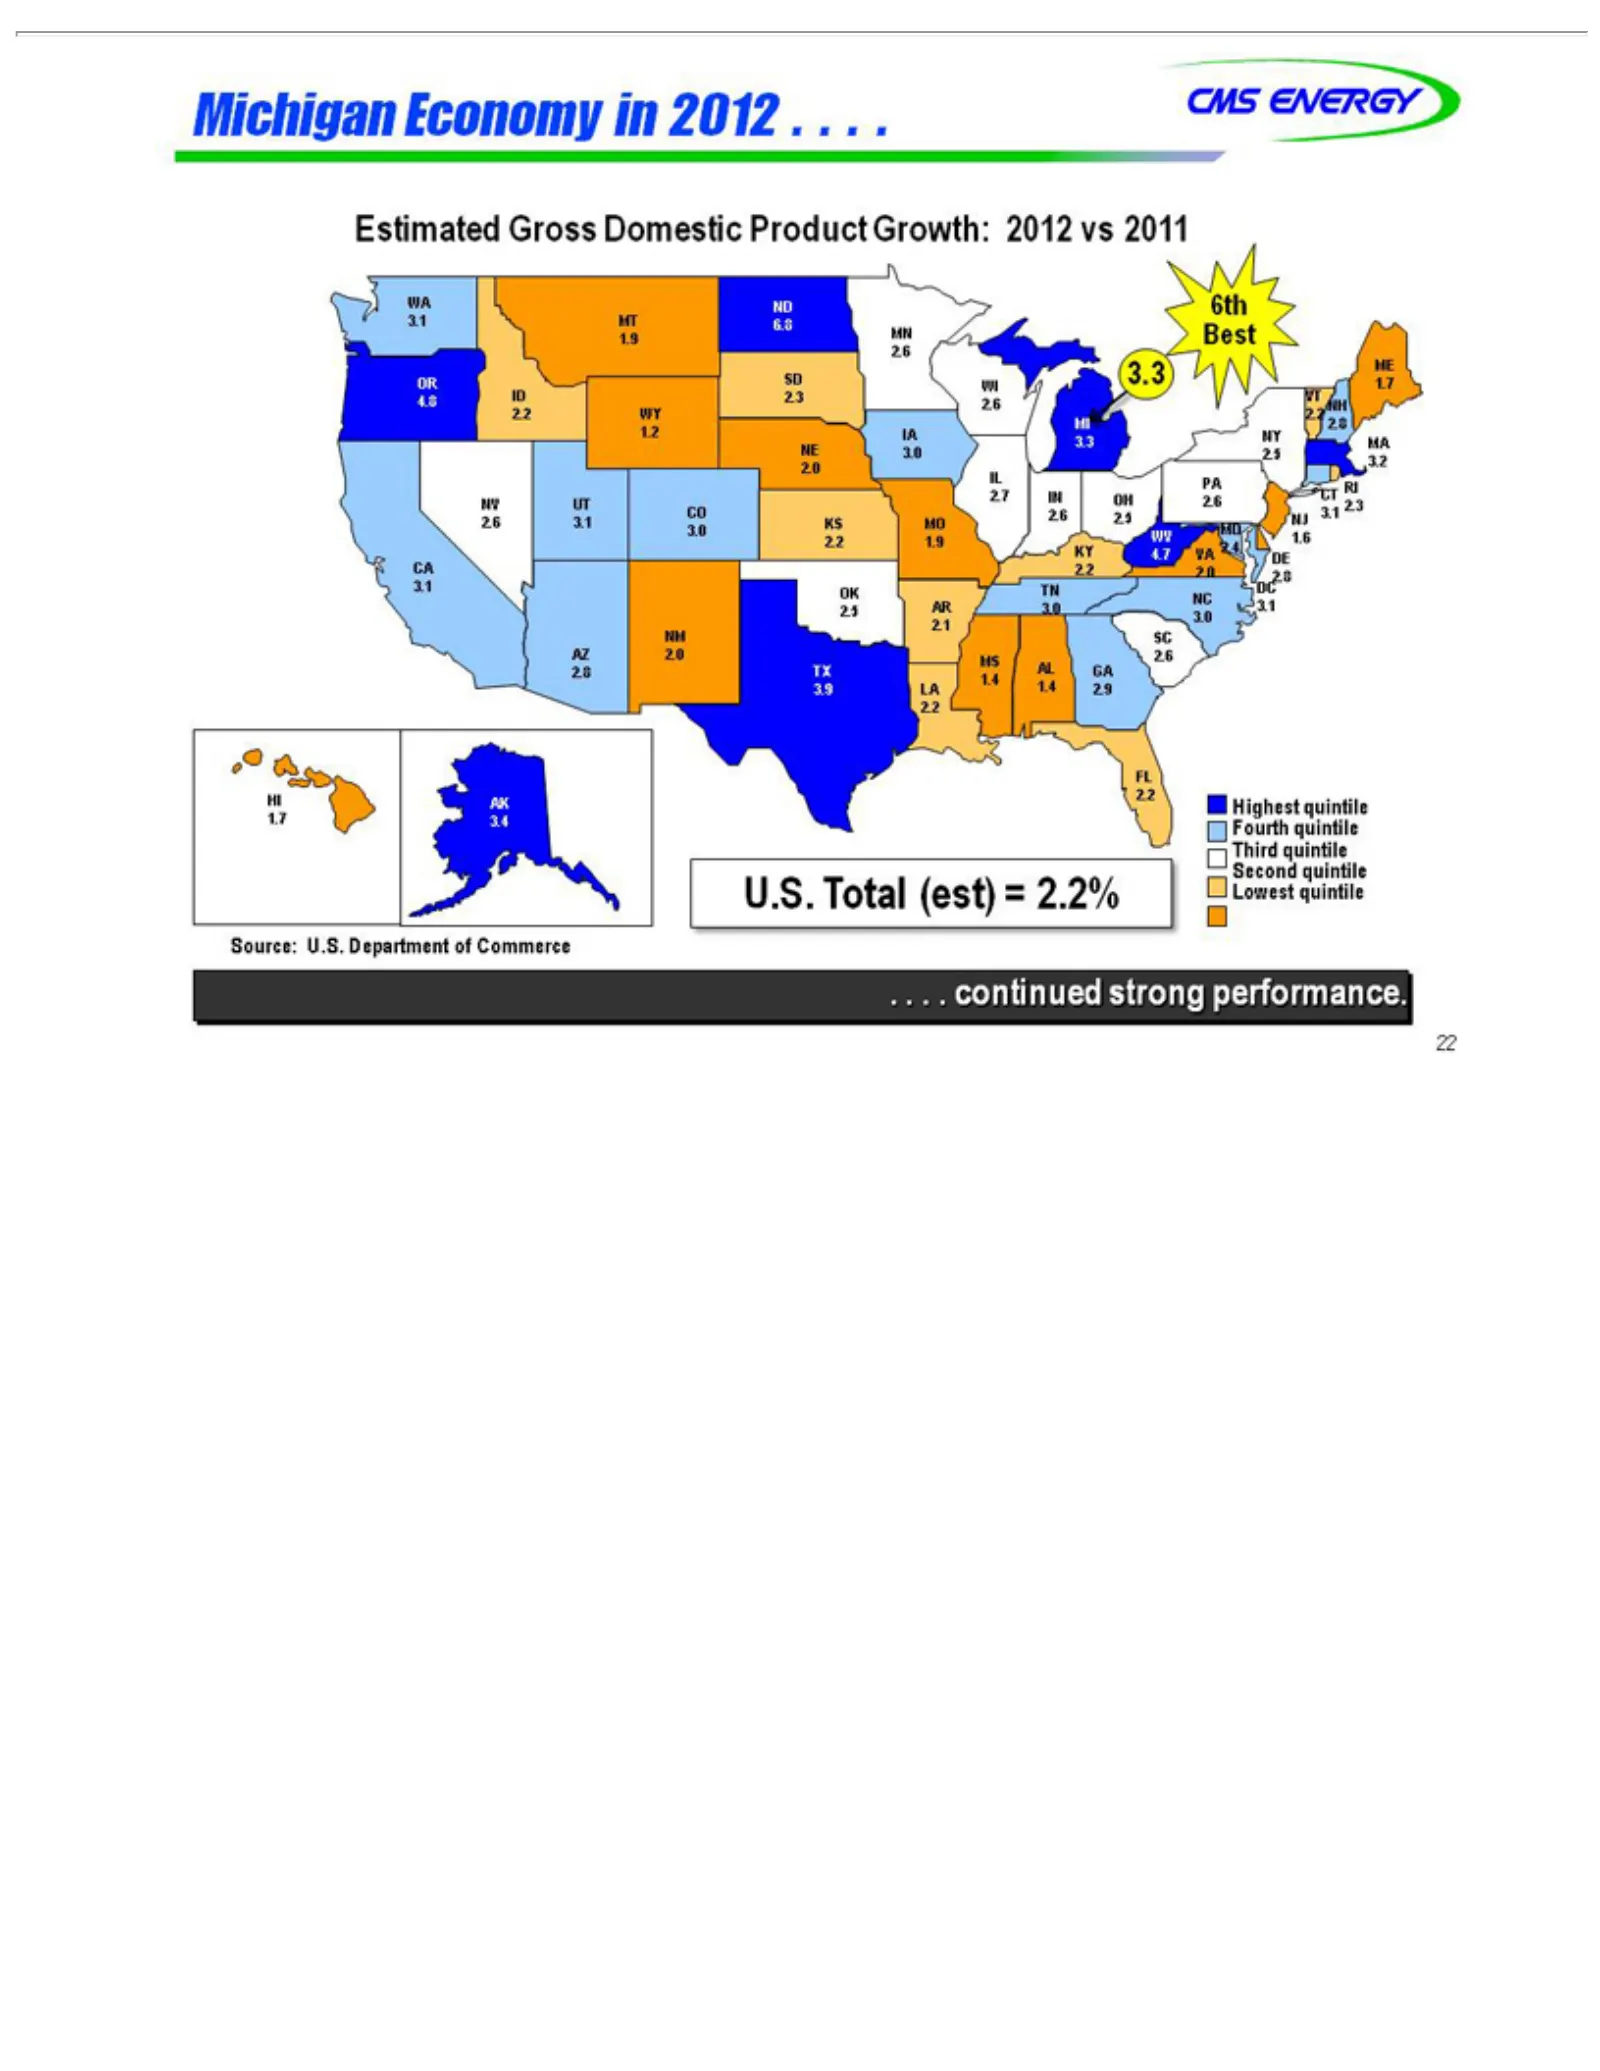
Slide 23: Michigan Estimated Gross Domestic Product Growth 2012
Michigan CMS Estimated WA 1.9 SD 4.8 NE RI NV 2.6 2.2 4.7 2.0 AR NC NM 2.8 HI FL 1.7 Fourth U.S. .Source: 22 . .AK 2.7 TX 6.8 2.6 3.1 1.9 CA 2.8 .3.4 3.3 3.0 UT ND SC continued Total ENERGY IN quintile 2.2 MN NH MD 1.6 3.1 ME 1.4 3.3 2.2 3.1 2.6 AZ U.S. 6th OH Economy Gross (est) Highest KY OK GA MA
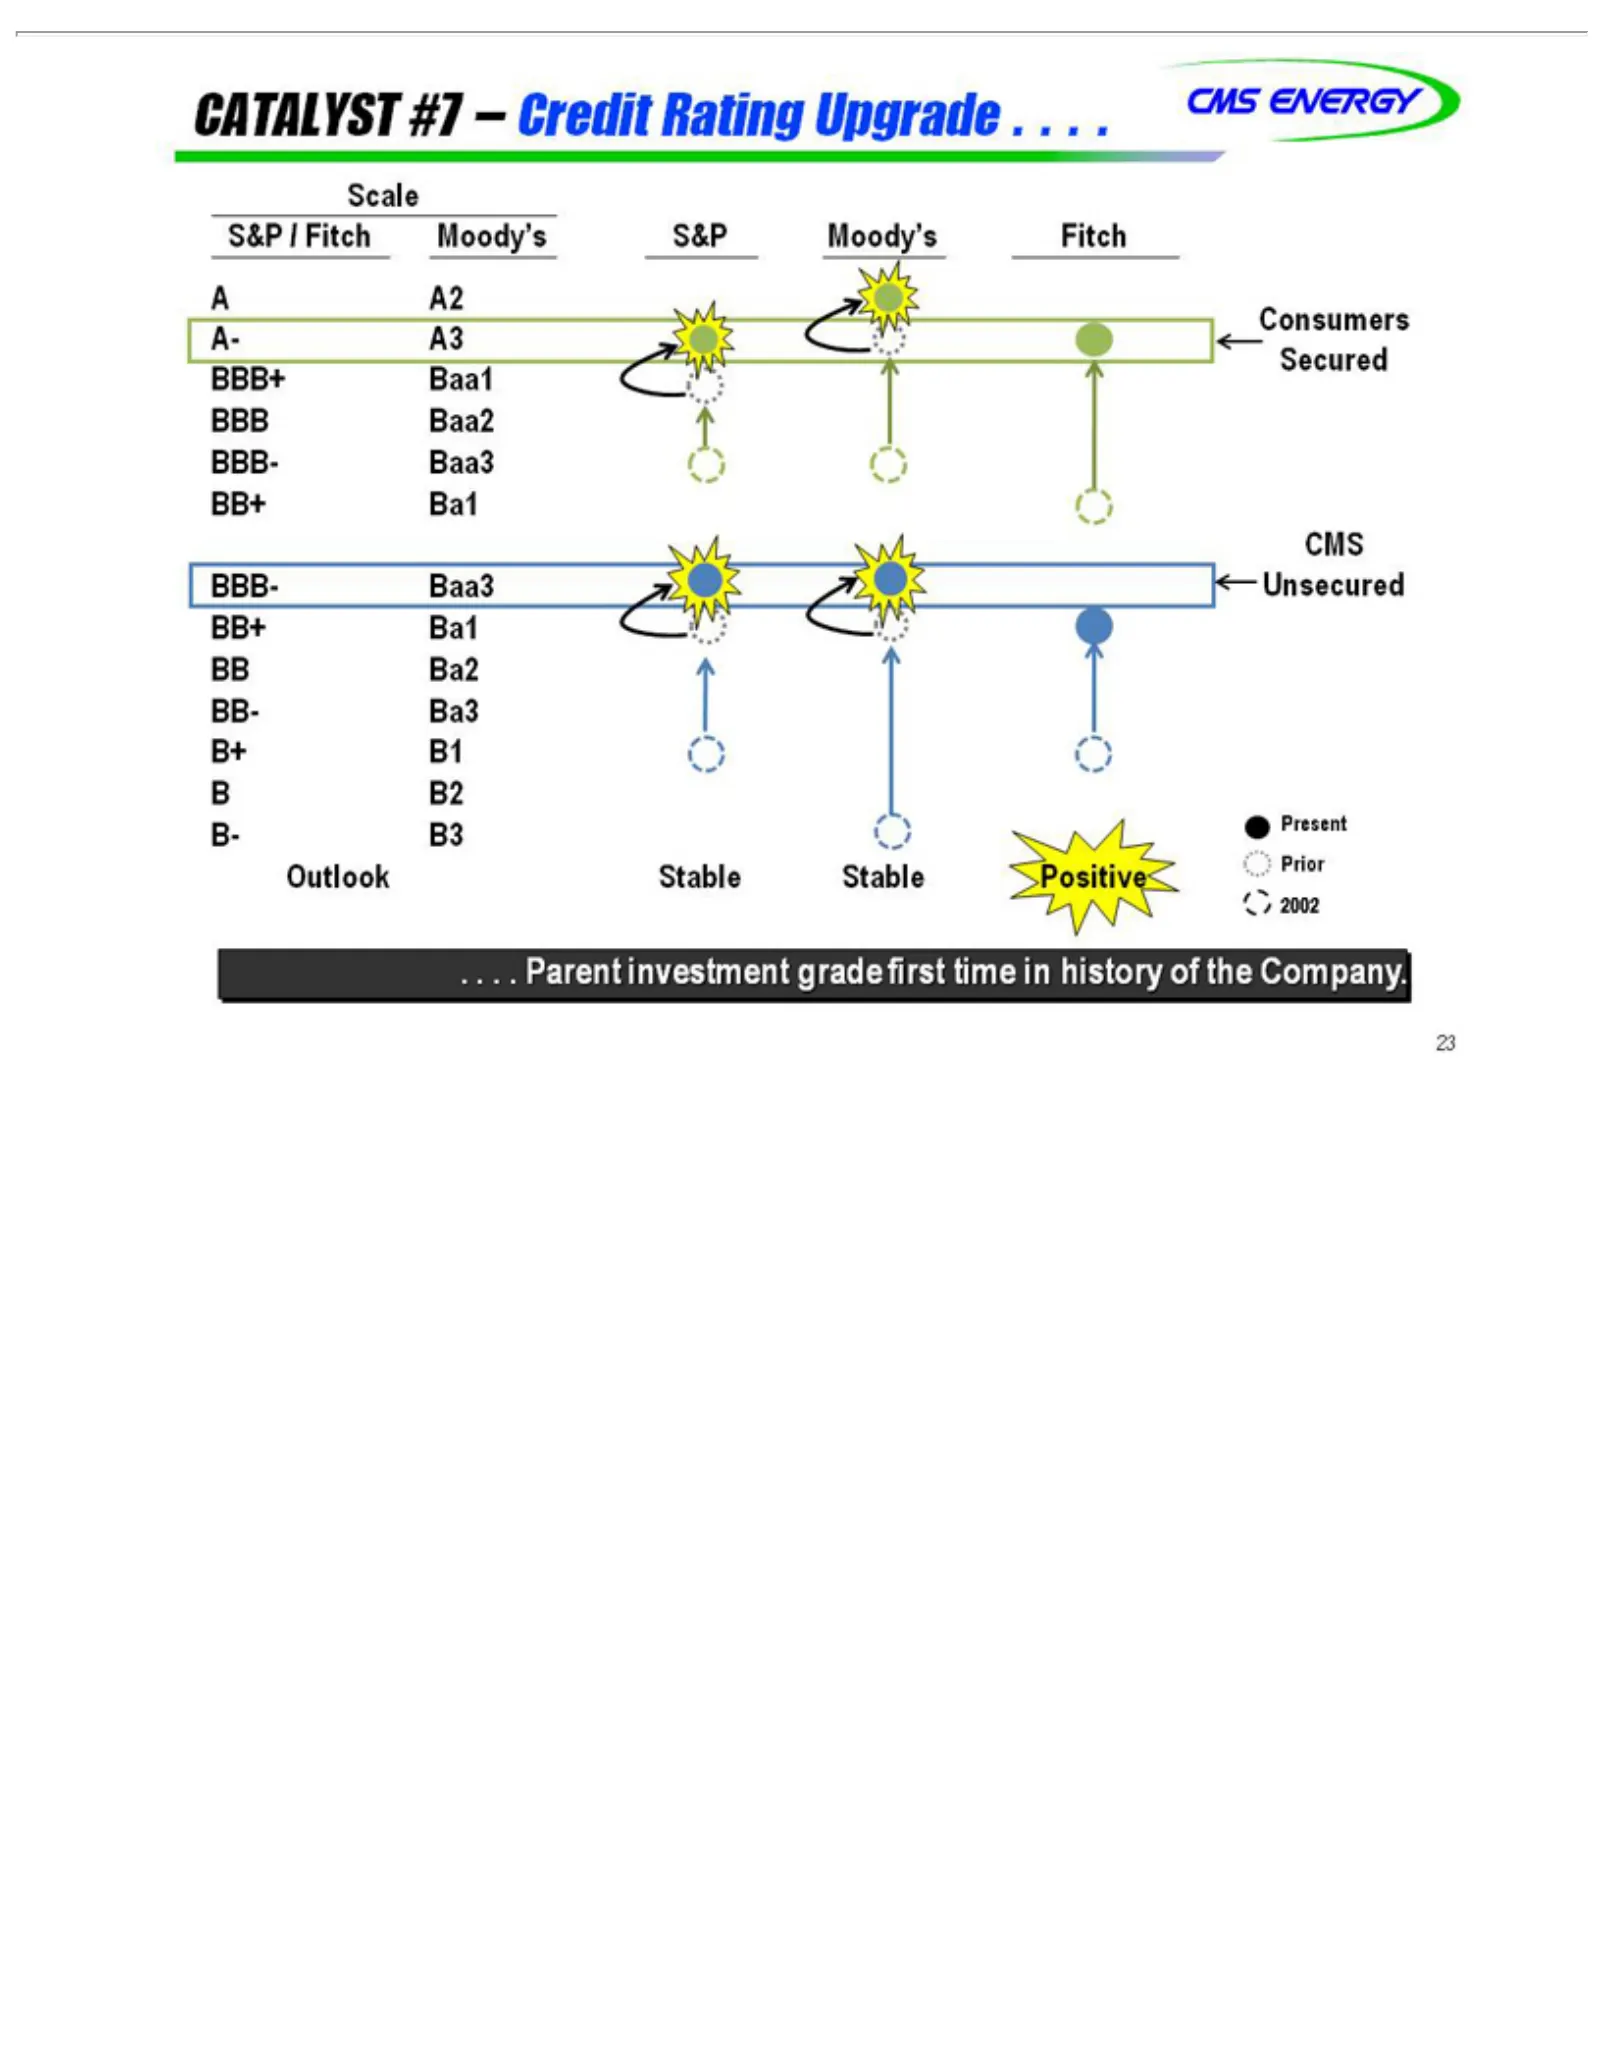
Slide 24: Catalyst 7: Credit Upgrade
CATALYST S&P Scale A A- BBB+ BBB BBB- CMS BB+ BB BB- B+ B B- .Outlook 2002 23 . A2 B2 .B3 A3 B1 .Ba2 Ba3 Parent /Ba1 Baa2 ENERGY Baa3 Fitch Present Consumers Baa1 Stable investment Unsecured Moody’s Secured #7 Stable – Credit S&P Positive grade Rating Moody’s first Prior Upgrade time Fitch in. histo
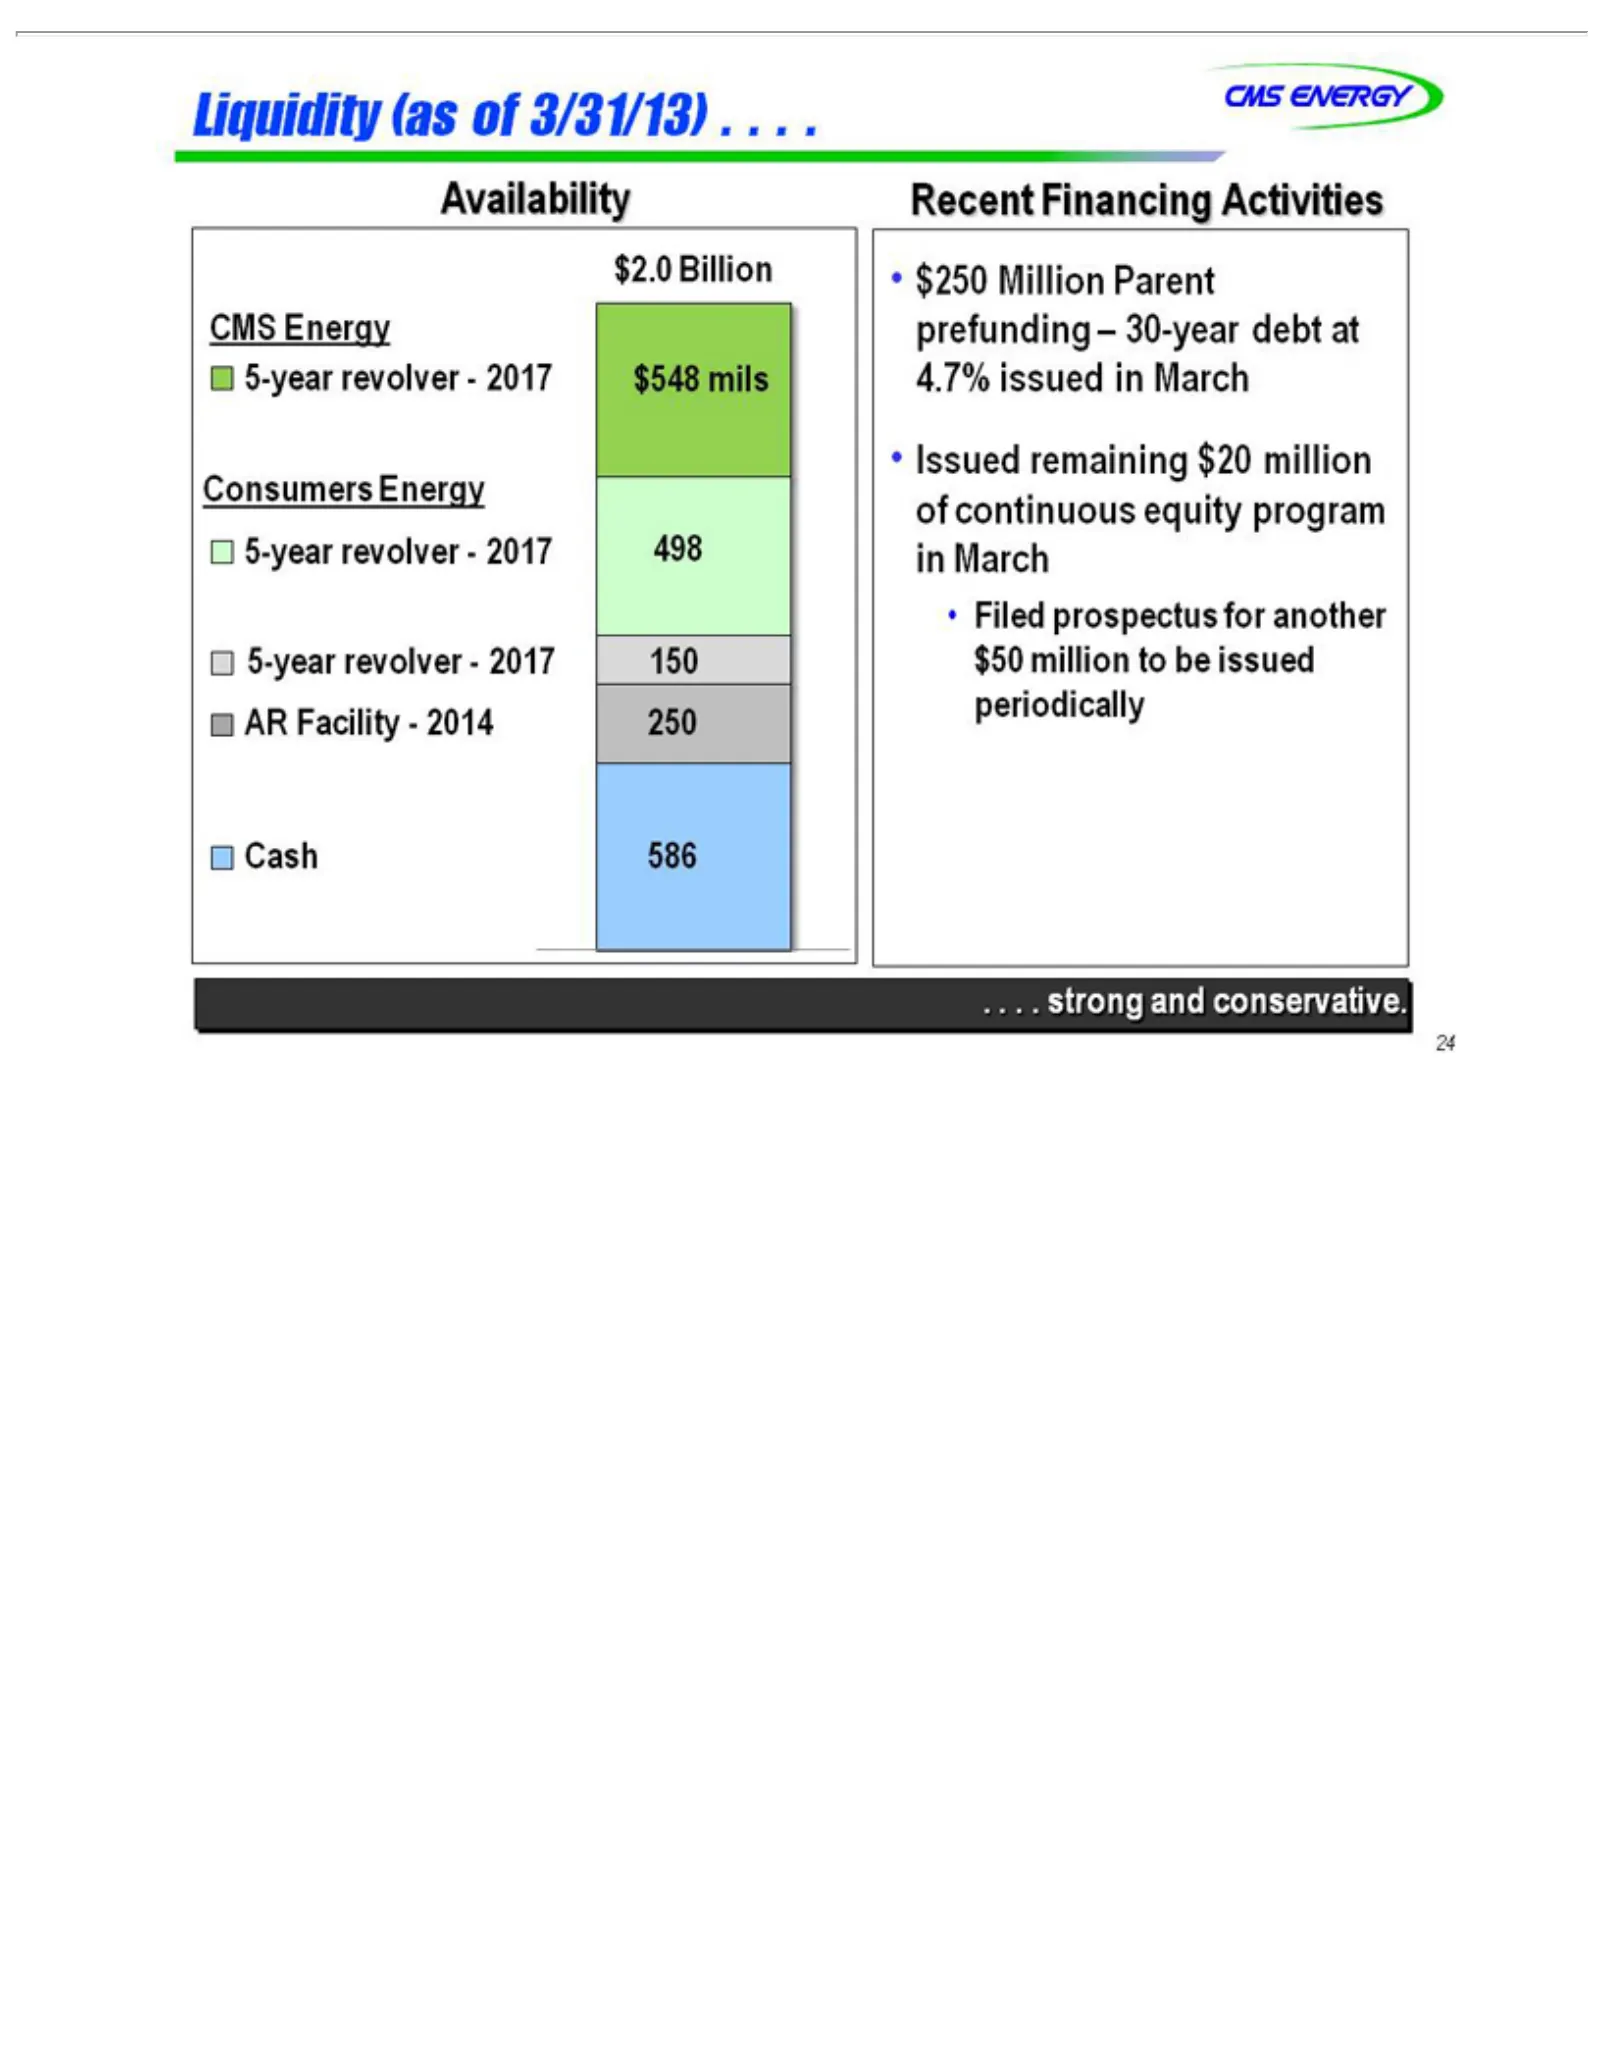
Slide 25: Liquidity Availability
Liquidity $2.0 Availability CMS Consumers 5-year AR Cash .•Recent 24 .Filed $250 Issued . .Facility—2014 Billion strong 586 ENERGY Energy revolver—2017 Million prospectus Financing remaining (asand Energy ofParent conservative. 3/31/13) Activities for $20 250another prefunding $548 498 150 million .
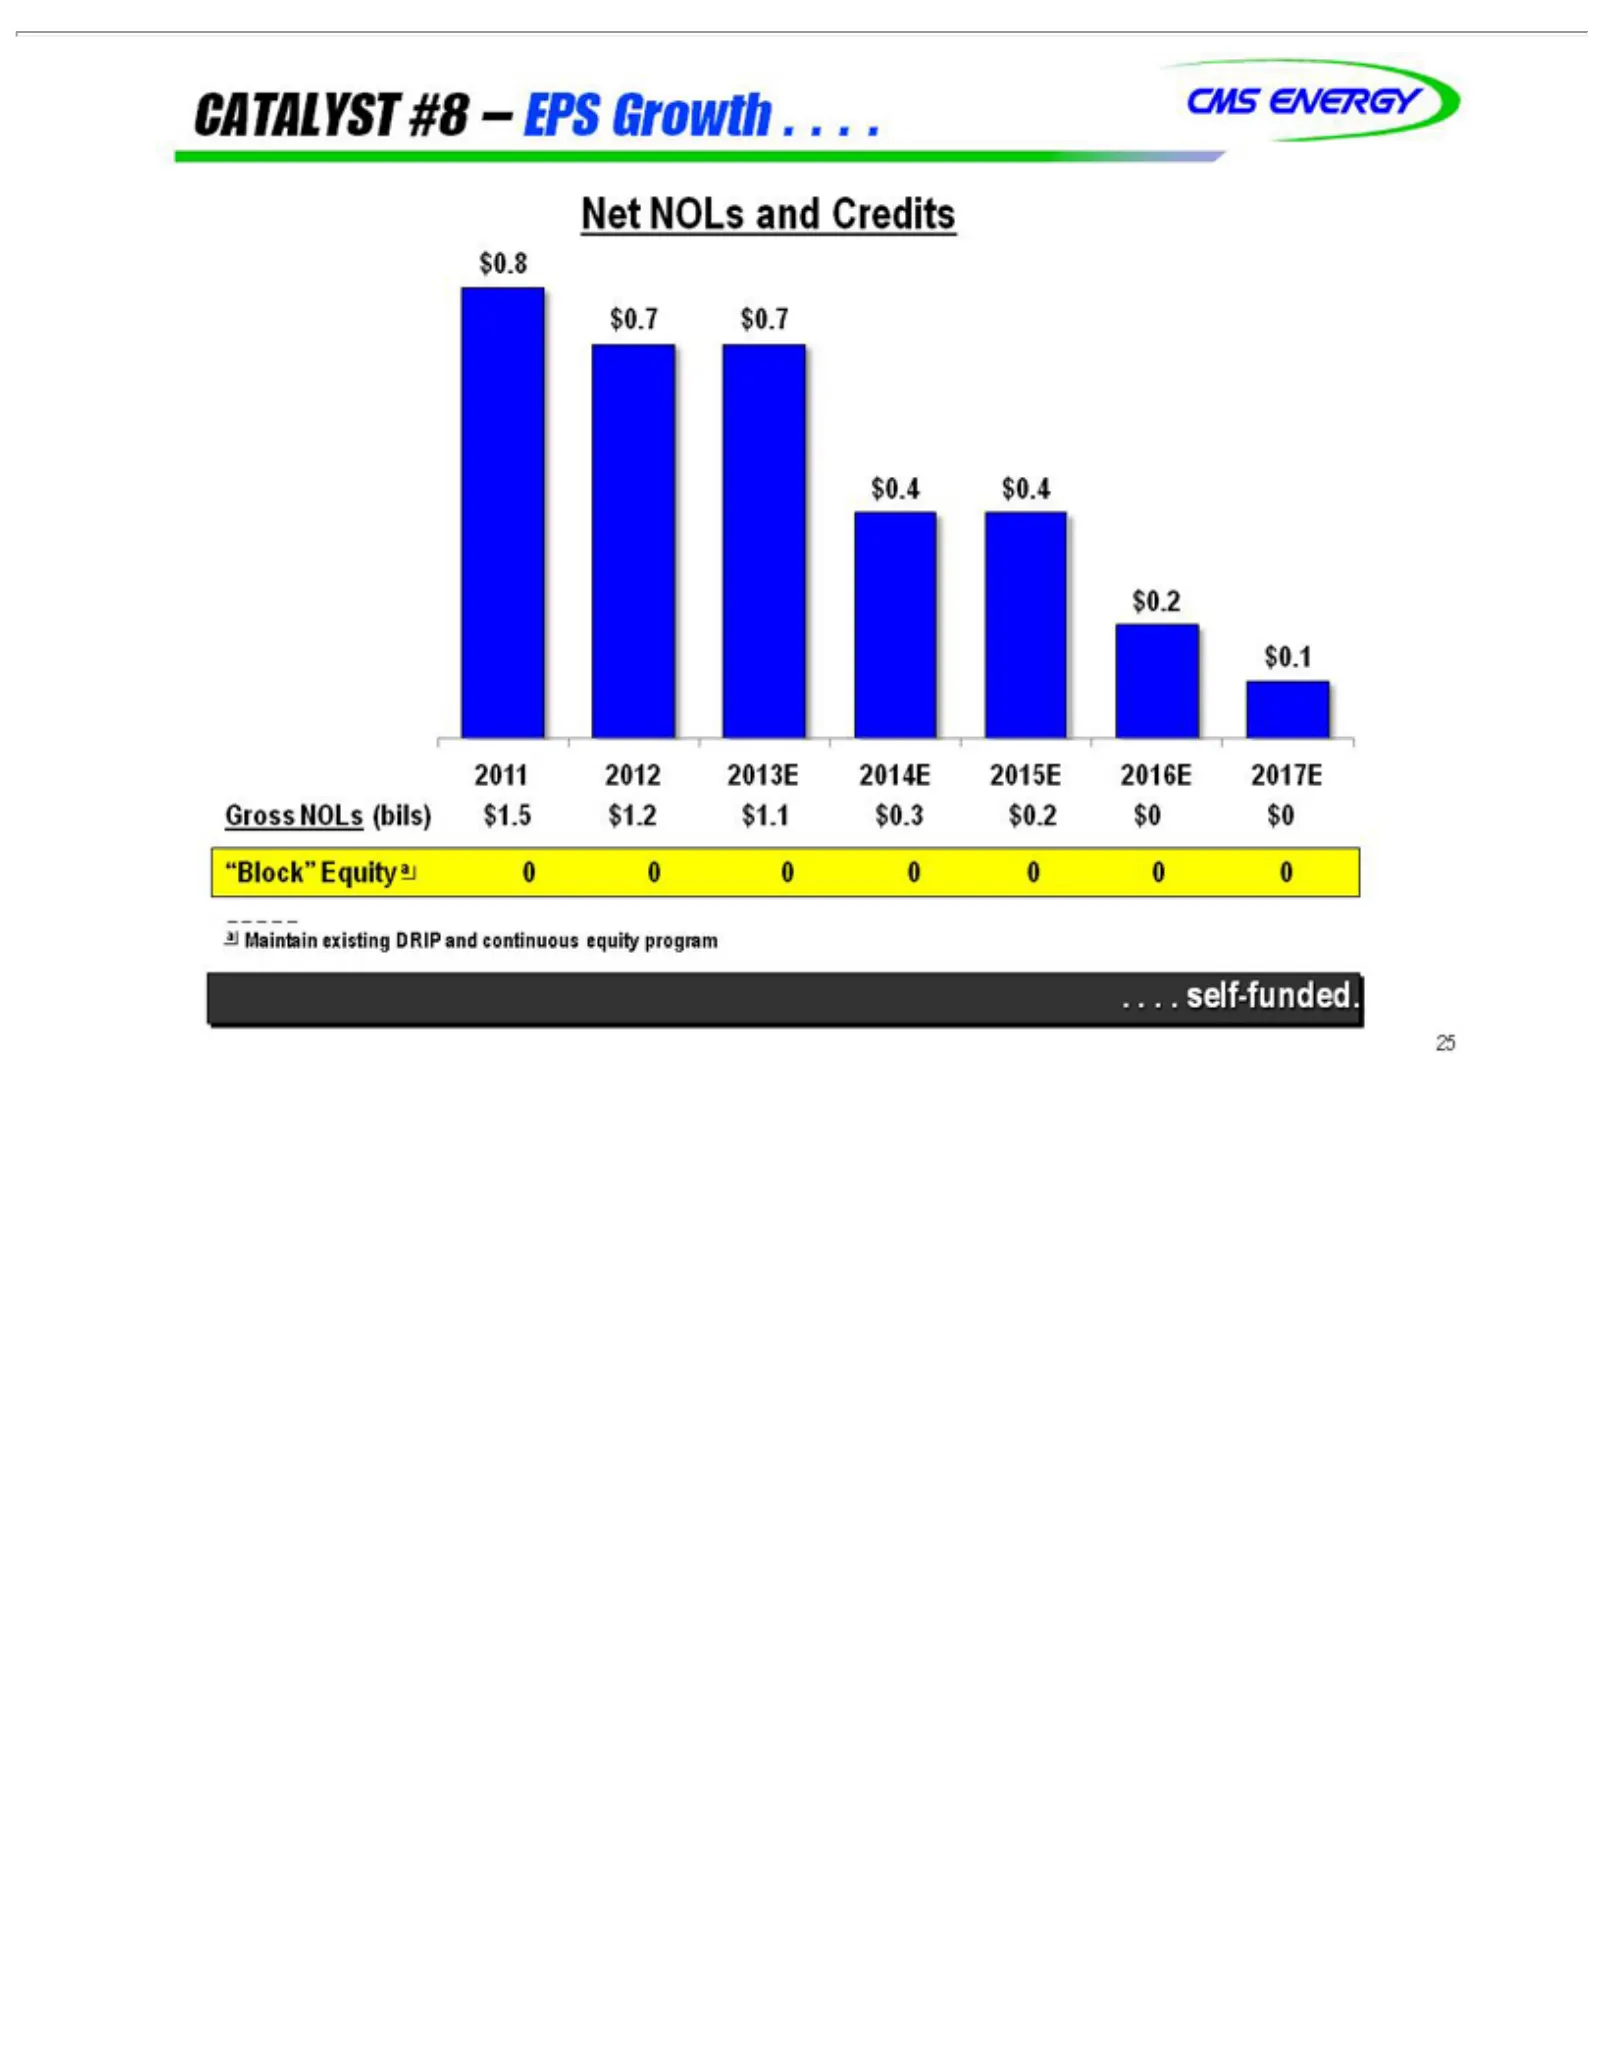
Slide 26: Catalyst 8: Net Operating Loss Credits
CATALYST CMS Net $0.8 $0.4 $0.2 2011 Gross .a“Block” 25 .Maintain . .NOLs $0.7 $0.4 $0.1 self-funded. 2012 ENERGY NOLs Equity $0.7 and 2013E existing #8 (bils) Credits –a 0EPS 2014E $1.5 0DRIP 0Growth 0$1.2 02015E and 0 0$1.1 continuous . .2016E .$0.3 . $0.2 2017E equity $0 $0program
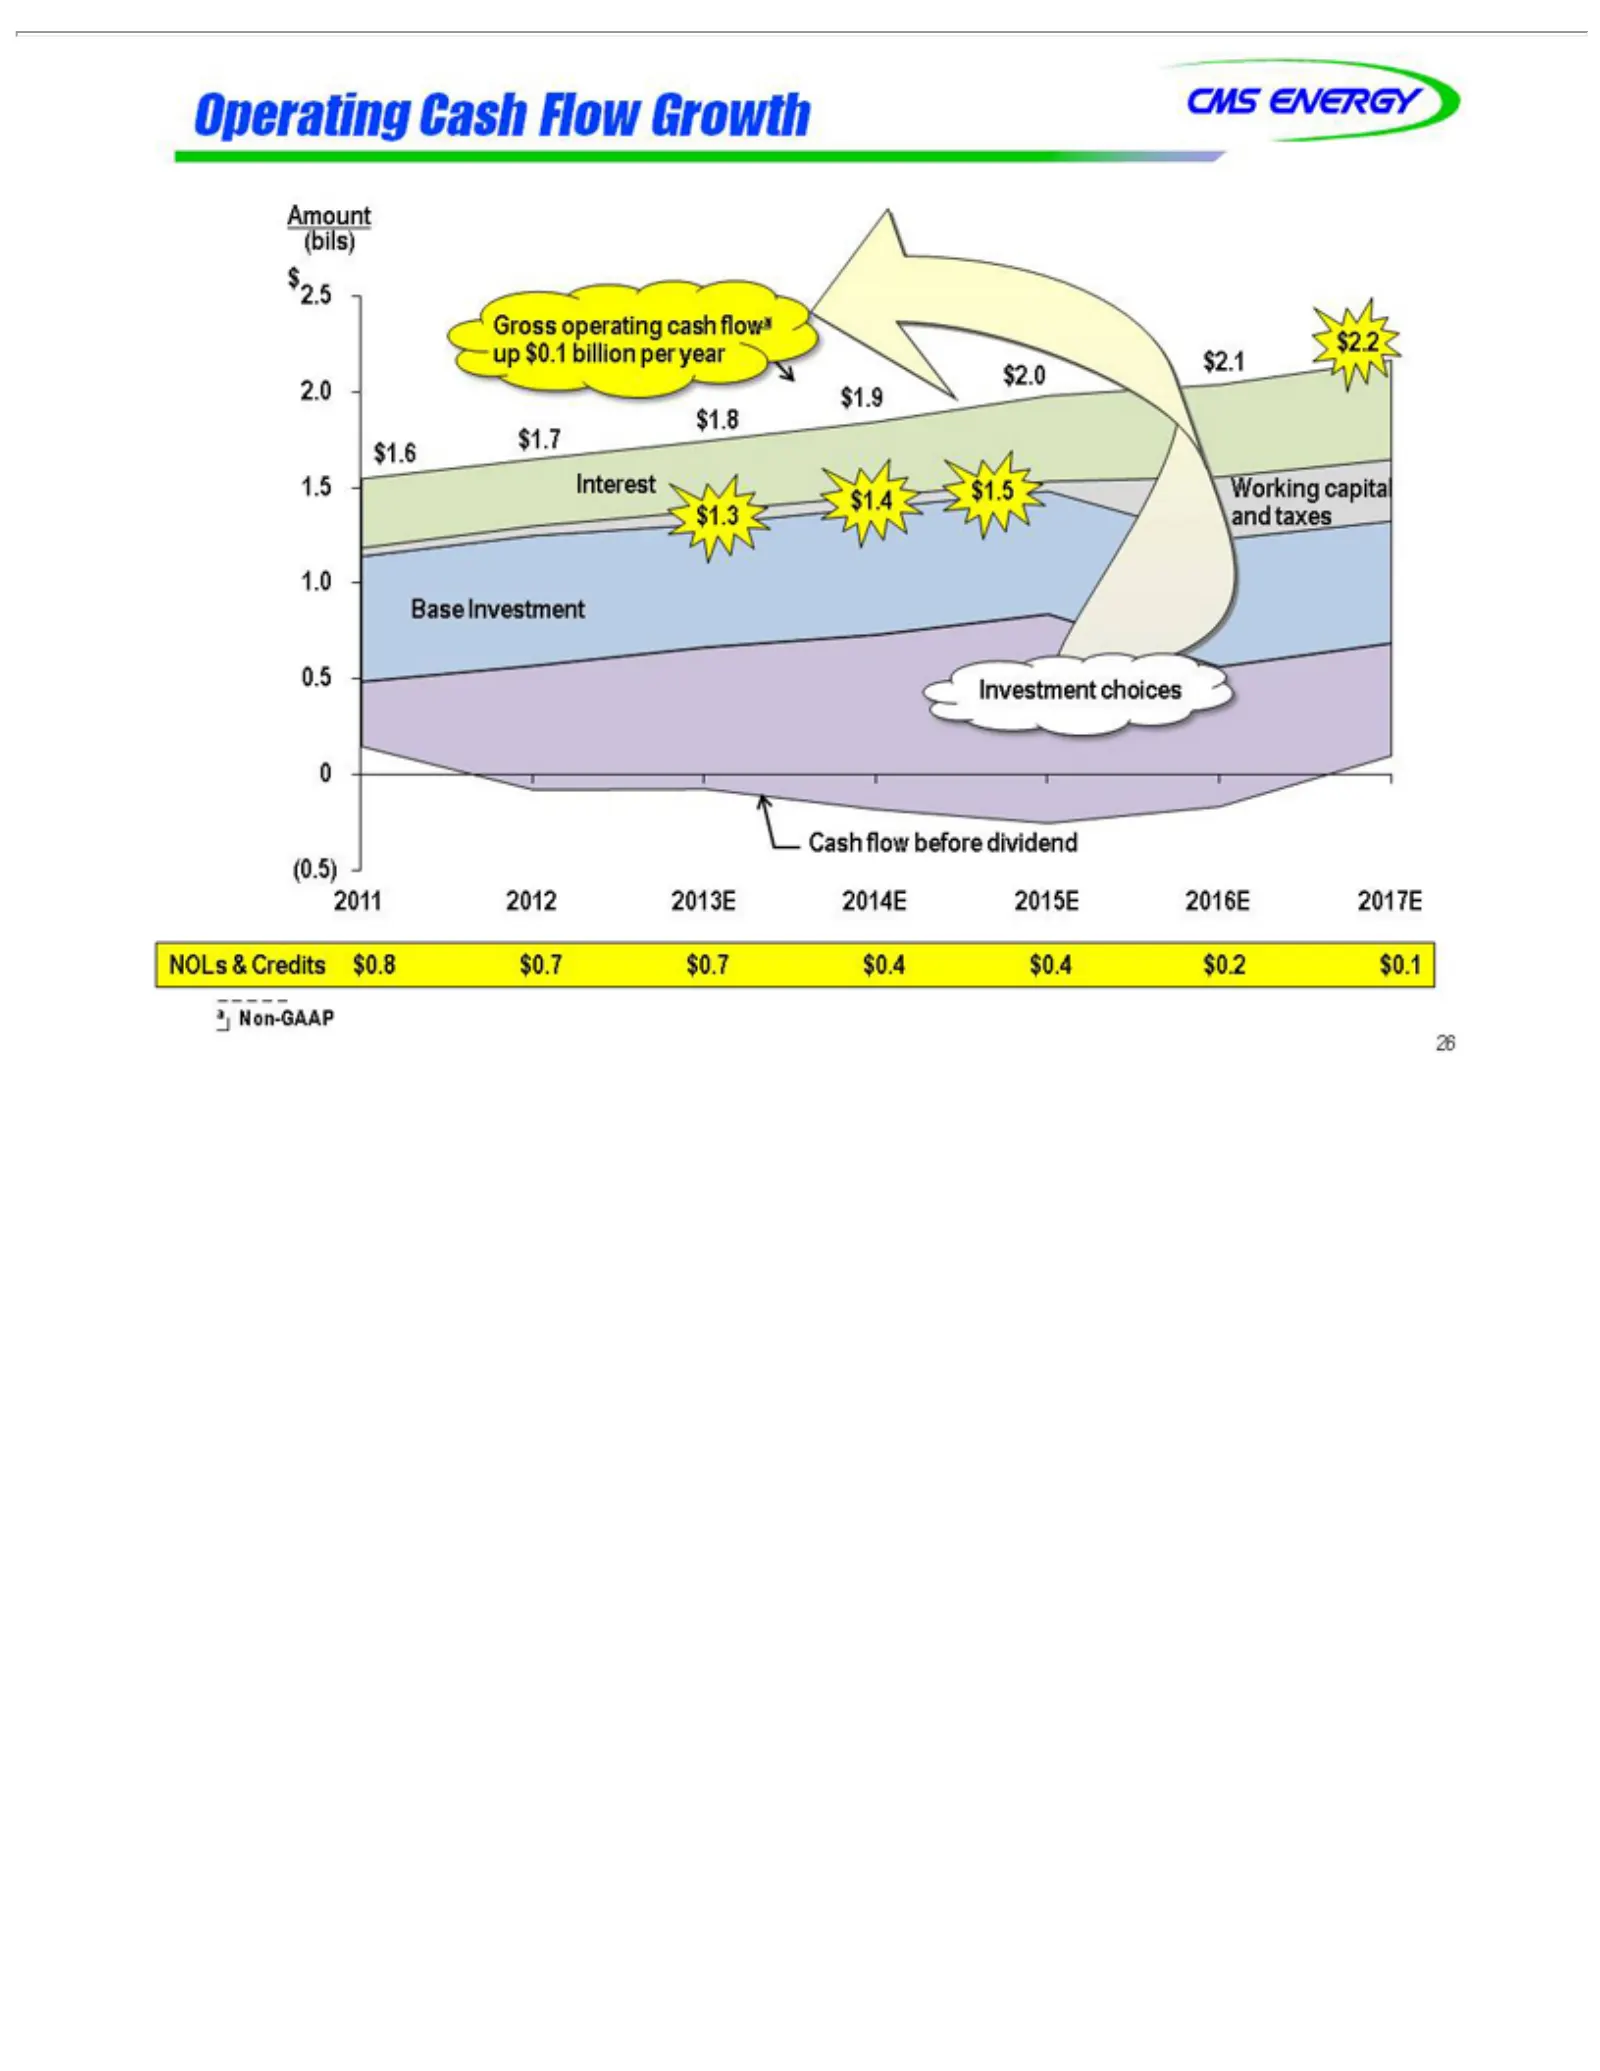
Slide 27: Operating Cash Flow
Operating CMS Amount 2.0 Gross (0.5) up Interest $2.0 $1.9 $1.6 $1.7 $1.8 $1.3 $1.4 Base Investment Cash 2011 aNOLs 26 Non-GAAP $0.1 1.5 and Investment 2012 flow ENERGY operating &1.0 $1.5 billion (bils) taxes Credits Cash before 2013E 0.5 choices Working $2.5 0per Flow cash $0.8 dividend 2014E year
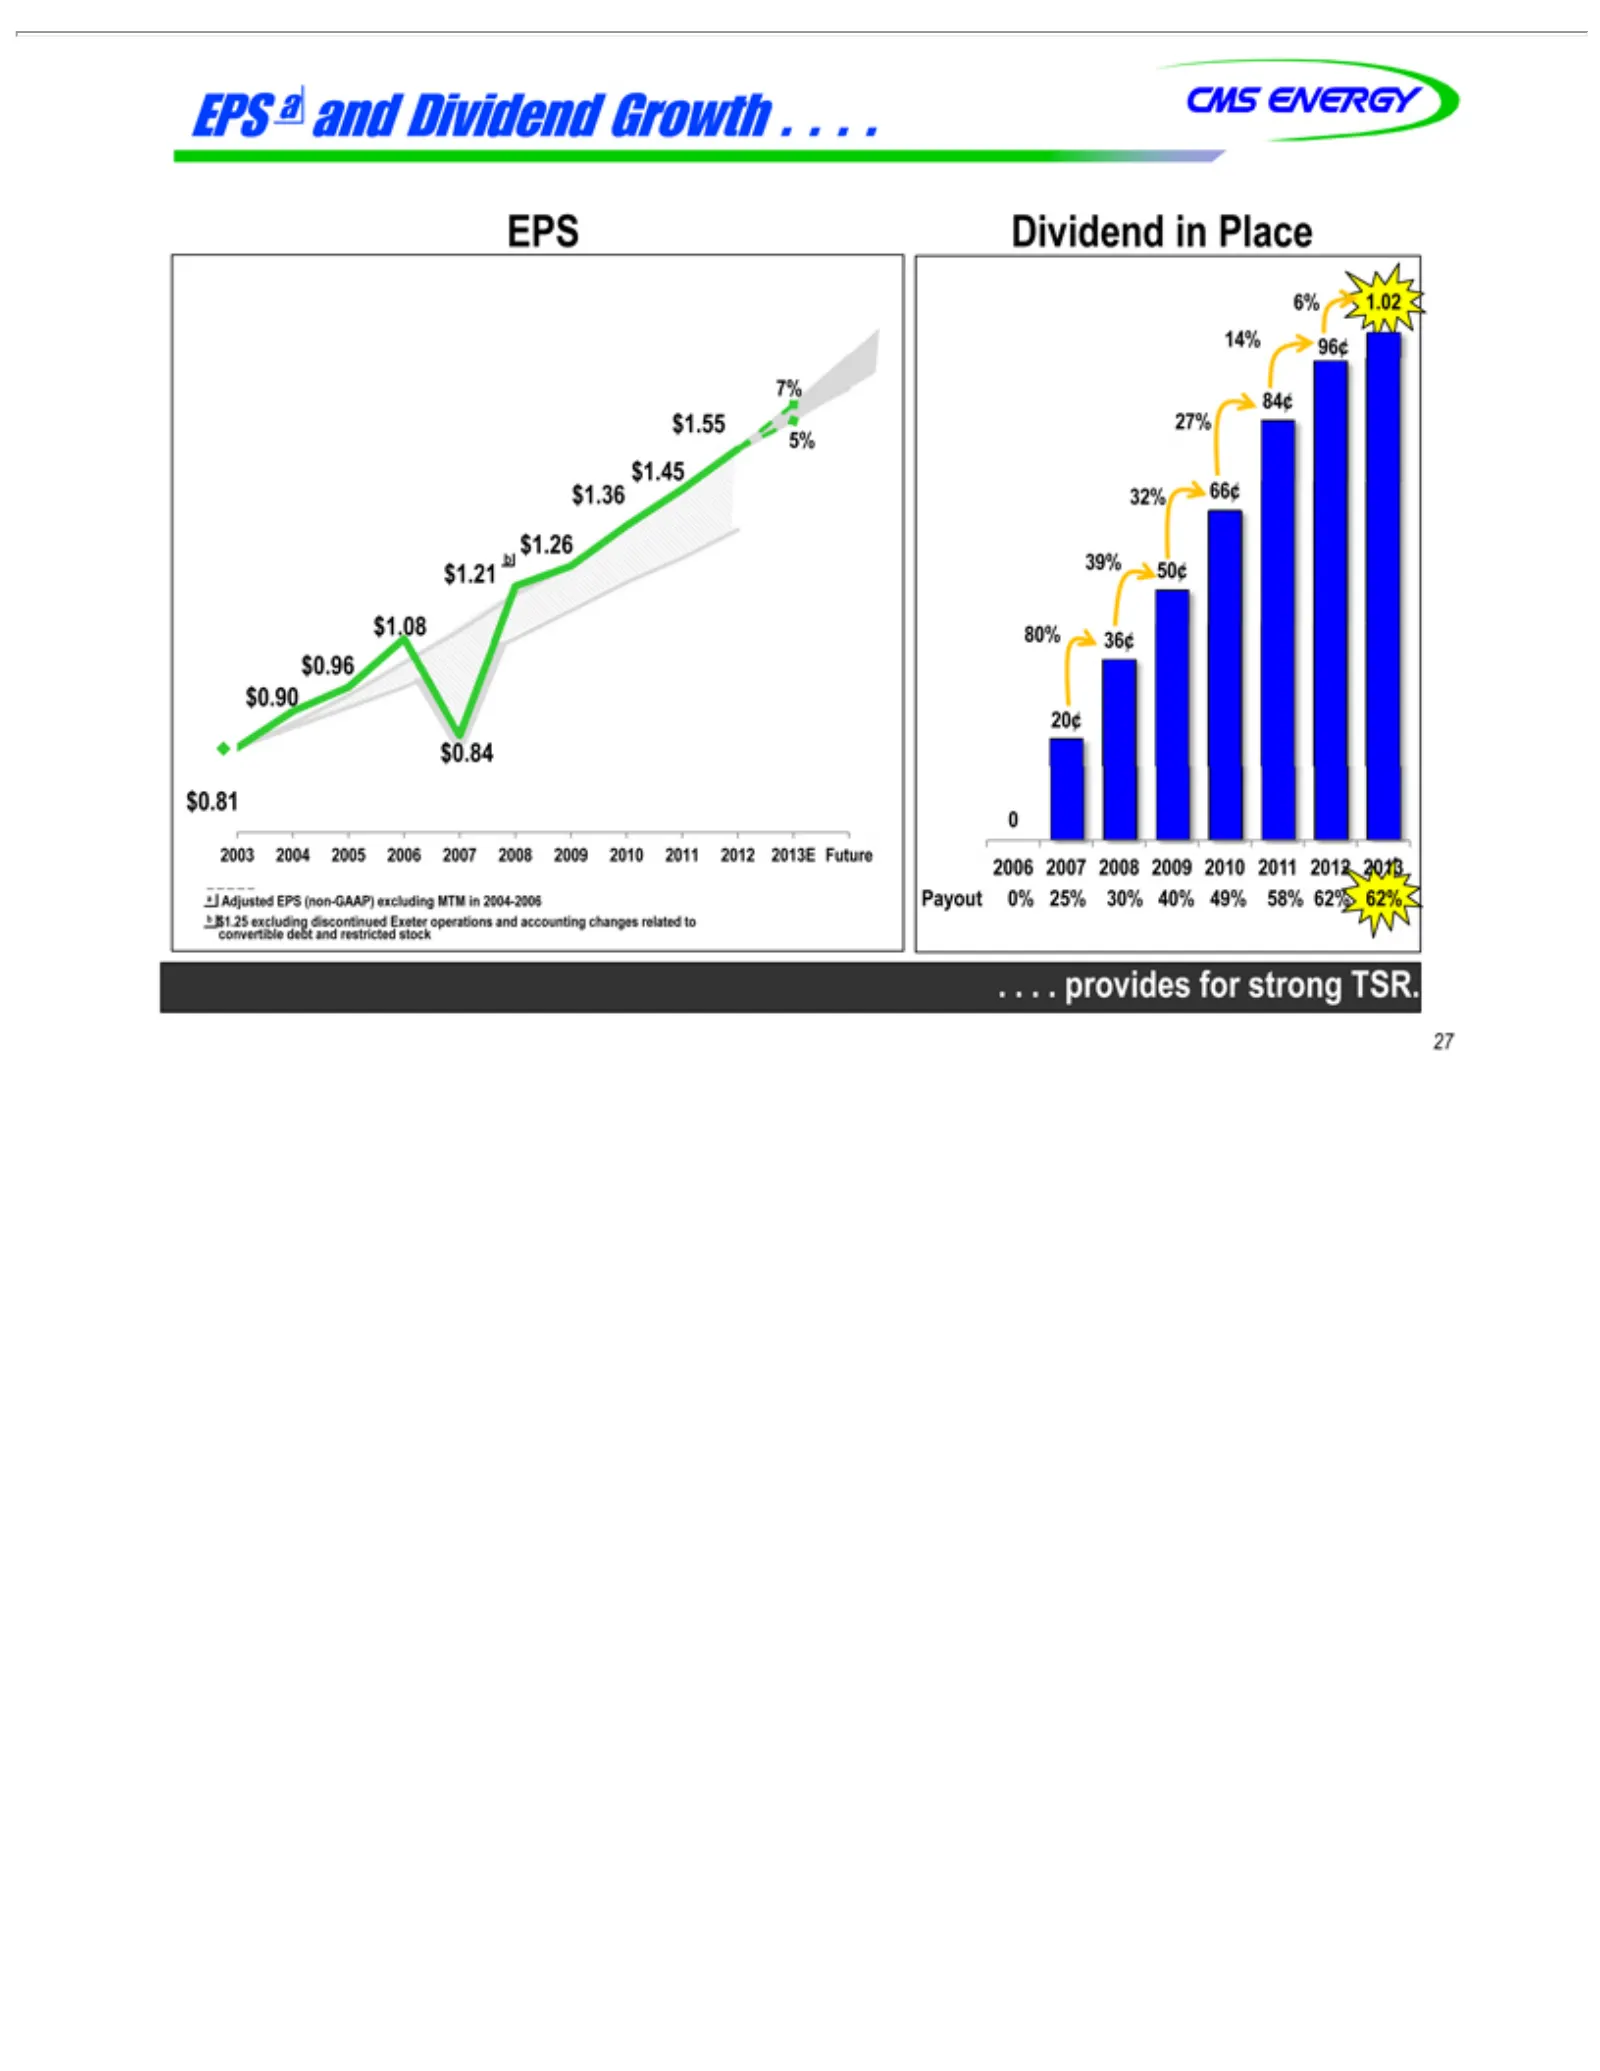
Slide 28: EPS Growth and Dividend Payout
CMS $1.36 5% $1.55 7% EPS $ $1.26 2003 $0.81 $0.84 $0.90 $0.96 a$1.08 b convertible Dividend 6% 14% 27% 32% 39% 80% 2 0 20¢ .Payout 27 1.21 .006 Adjusted $1.25 . .1.02 aprovides 96¢ 84¢ 66¢ 50¢ 36¢ 2004 2007 ENERGY $1.45 and 0% excluding inDividend EPS 2005 2008 25% debt Place for(non-GAAP) 30% and
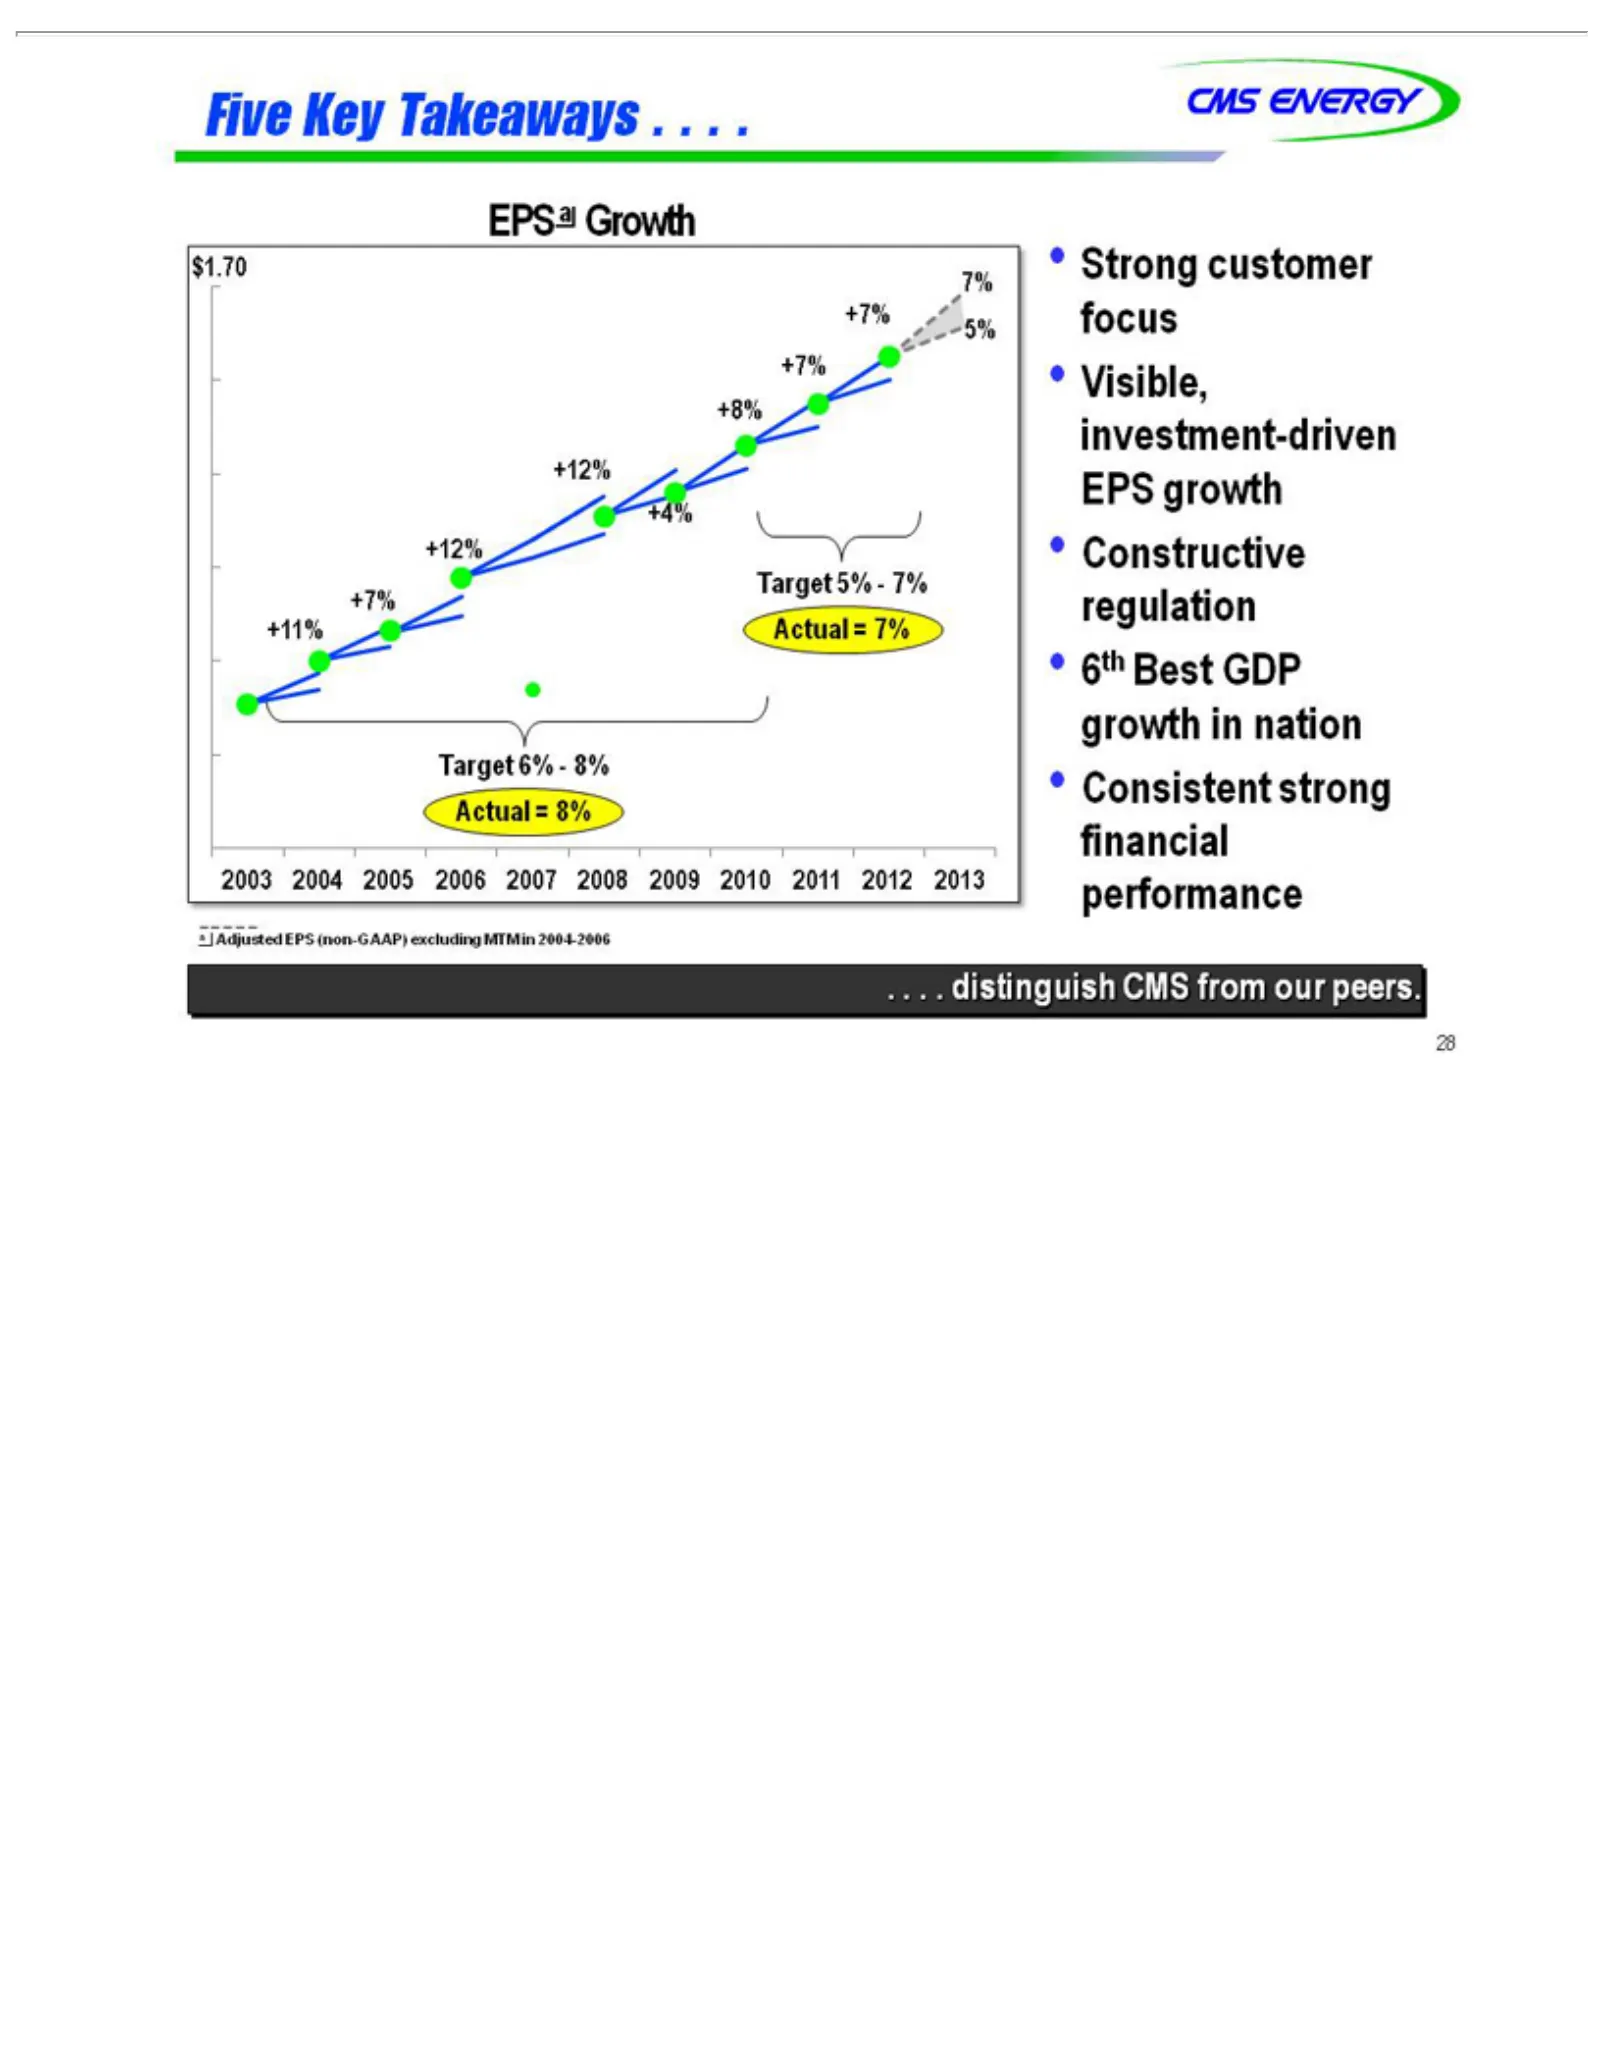
Slide 29: Five Key Takeaways and EPS Performance
Five CMS EPS $1.70 +4% +12% +8% +7% +11% Target Actual .a•2003 28 .Visible, Strong Constructive 6th Consistent Adjusted . . adistinguish Key Best Target 5% 2004 ENERGY 7% Actual Growth 6%—8% = customer 8% investment-driven Takeaways GDP EPS 2005 5%—7% strong =regulation 7% growth (non-GAAP) CMS 2006

Slide 30: Appendix
APPENDIX
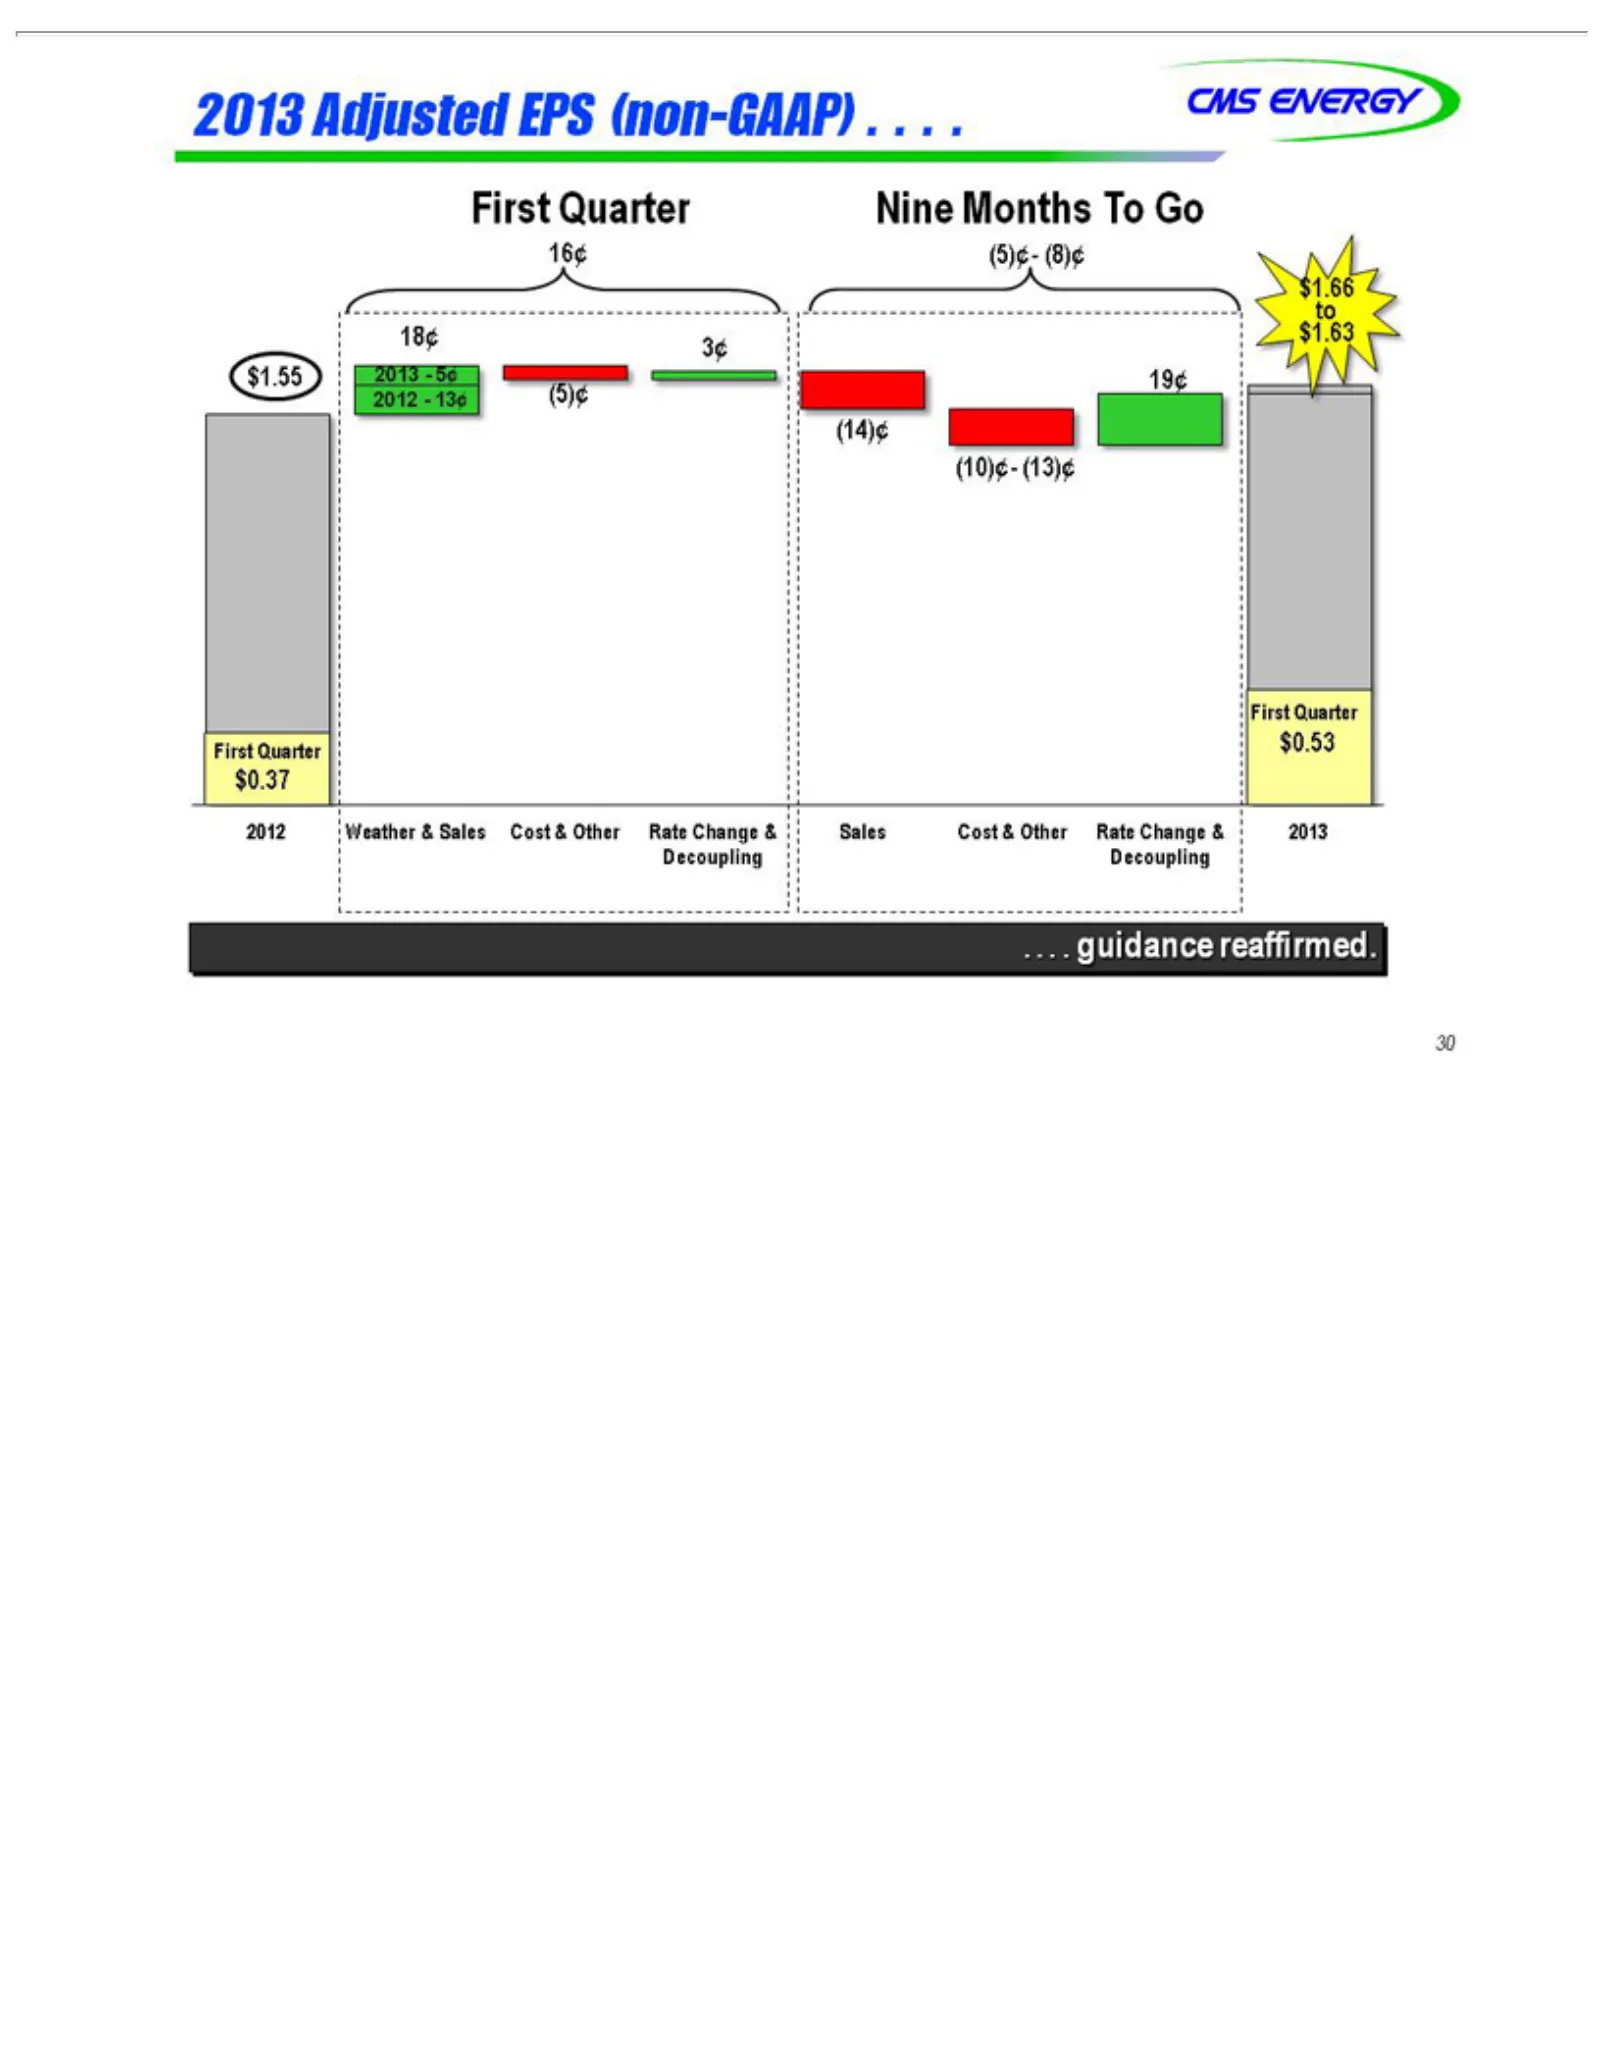
Slide 31: 2013 Guidance Reaffirmed: Nine Months To Go
2013 CMS 18¢ 16¢ $1.55 2012—13¢ 2012 $0.37 Nine First (10)¢—(13)¢ (14)¢ 19¢ $1.63 to $1.66 (5)¢—(8)¢ Sales .$0.53 Decoupling 30 . . .3¢ guidance Quarter Months Adjusted Weather Cost ENERGY 2013—5¢ &(5)¢ Other To & reaffirmed. EPS Go Sales Rate (non-GAAP) Cost Change & Other & . . 2013 . Rate . Chang
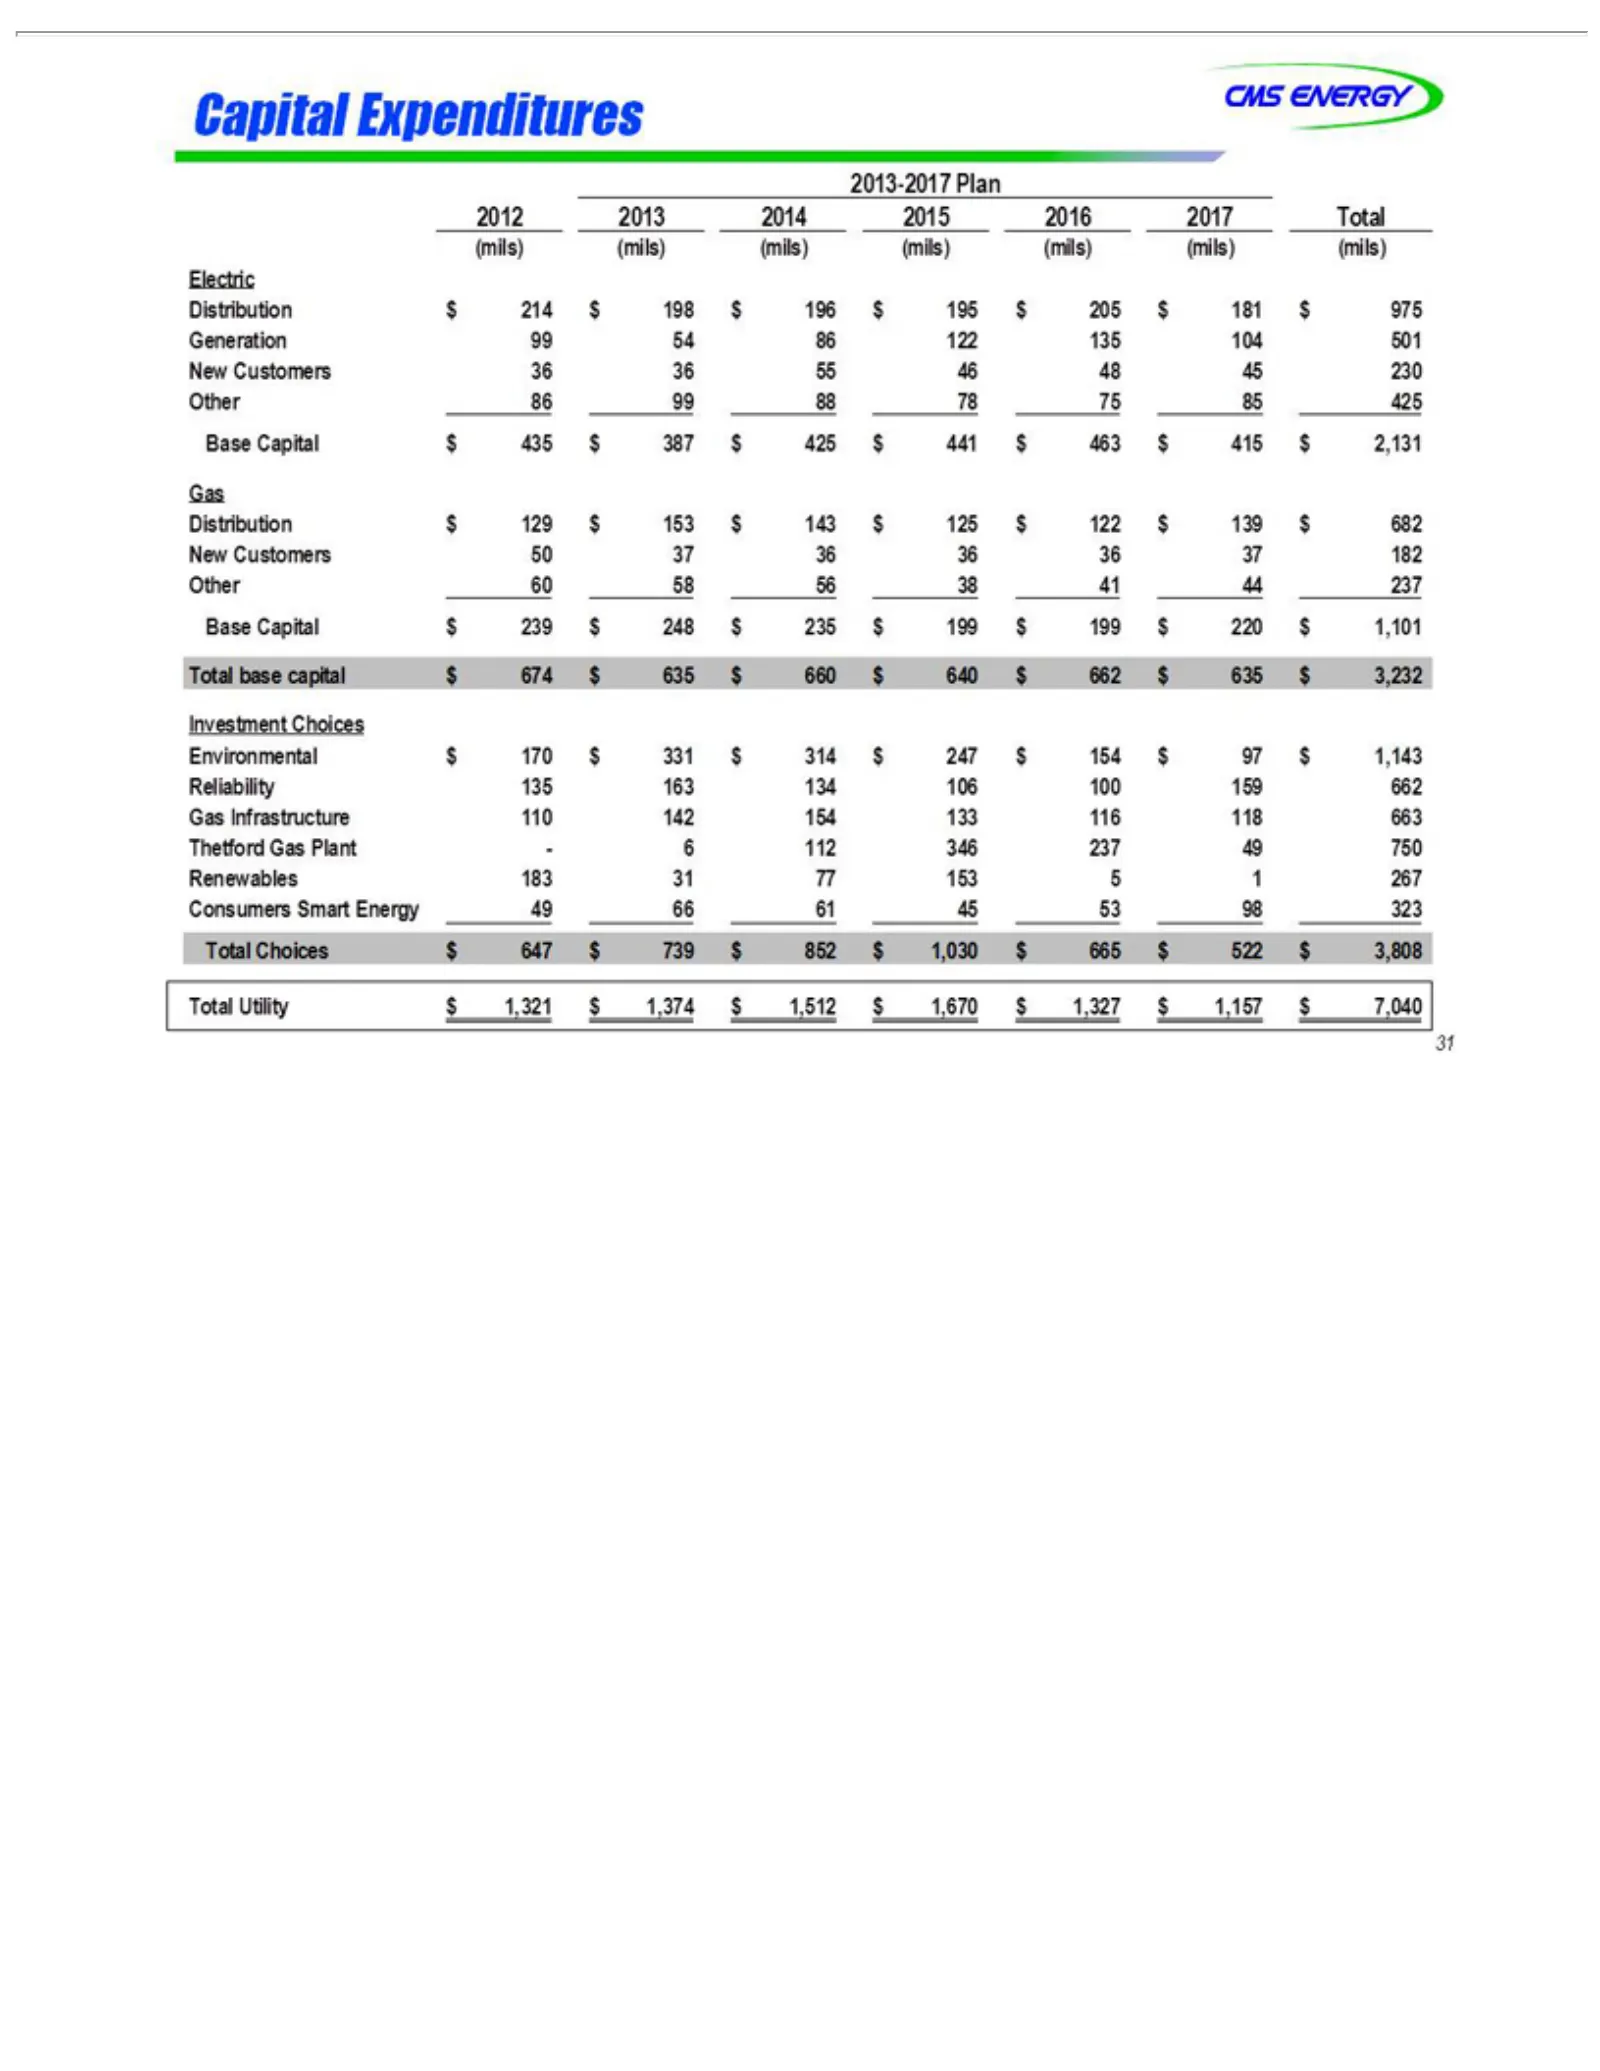
Slide 32: Capital Expenditures 2013-2017
Capital CMS 2013-2017 2012 (mils) Electric Generation Distribution New Other Base Investment Environmental Reliability Gas Thetford Renewables Consumers Total 31 Infrastructure Customers Capital 2013 base Choices Utility ENERGY 86 60 (mils) Expenditures Gas 99capital 58135 2014 Plan 99 Choices Smart
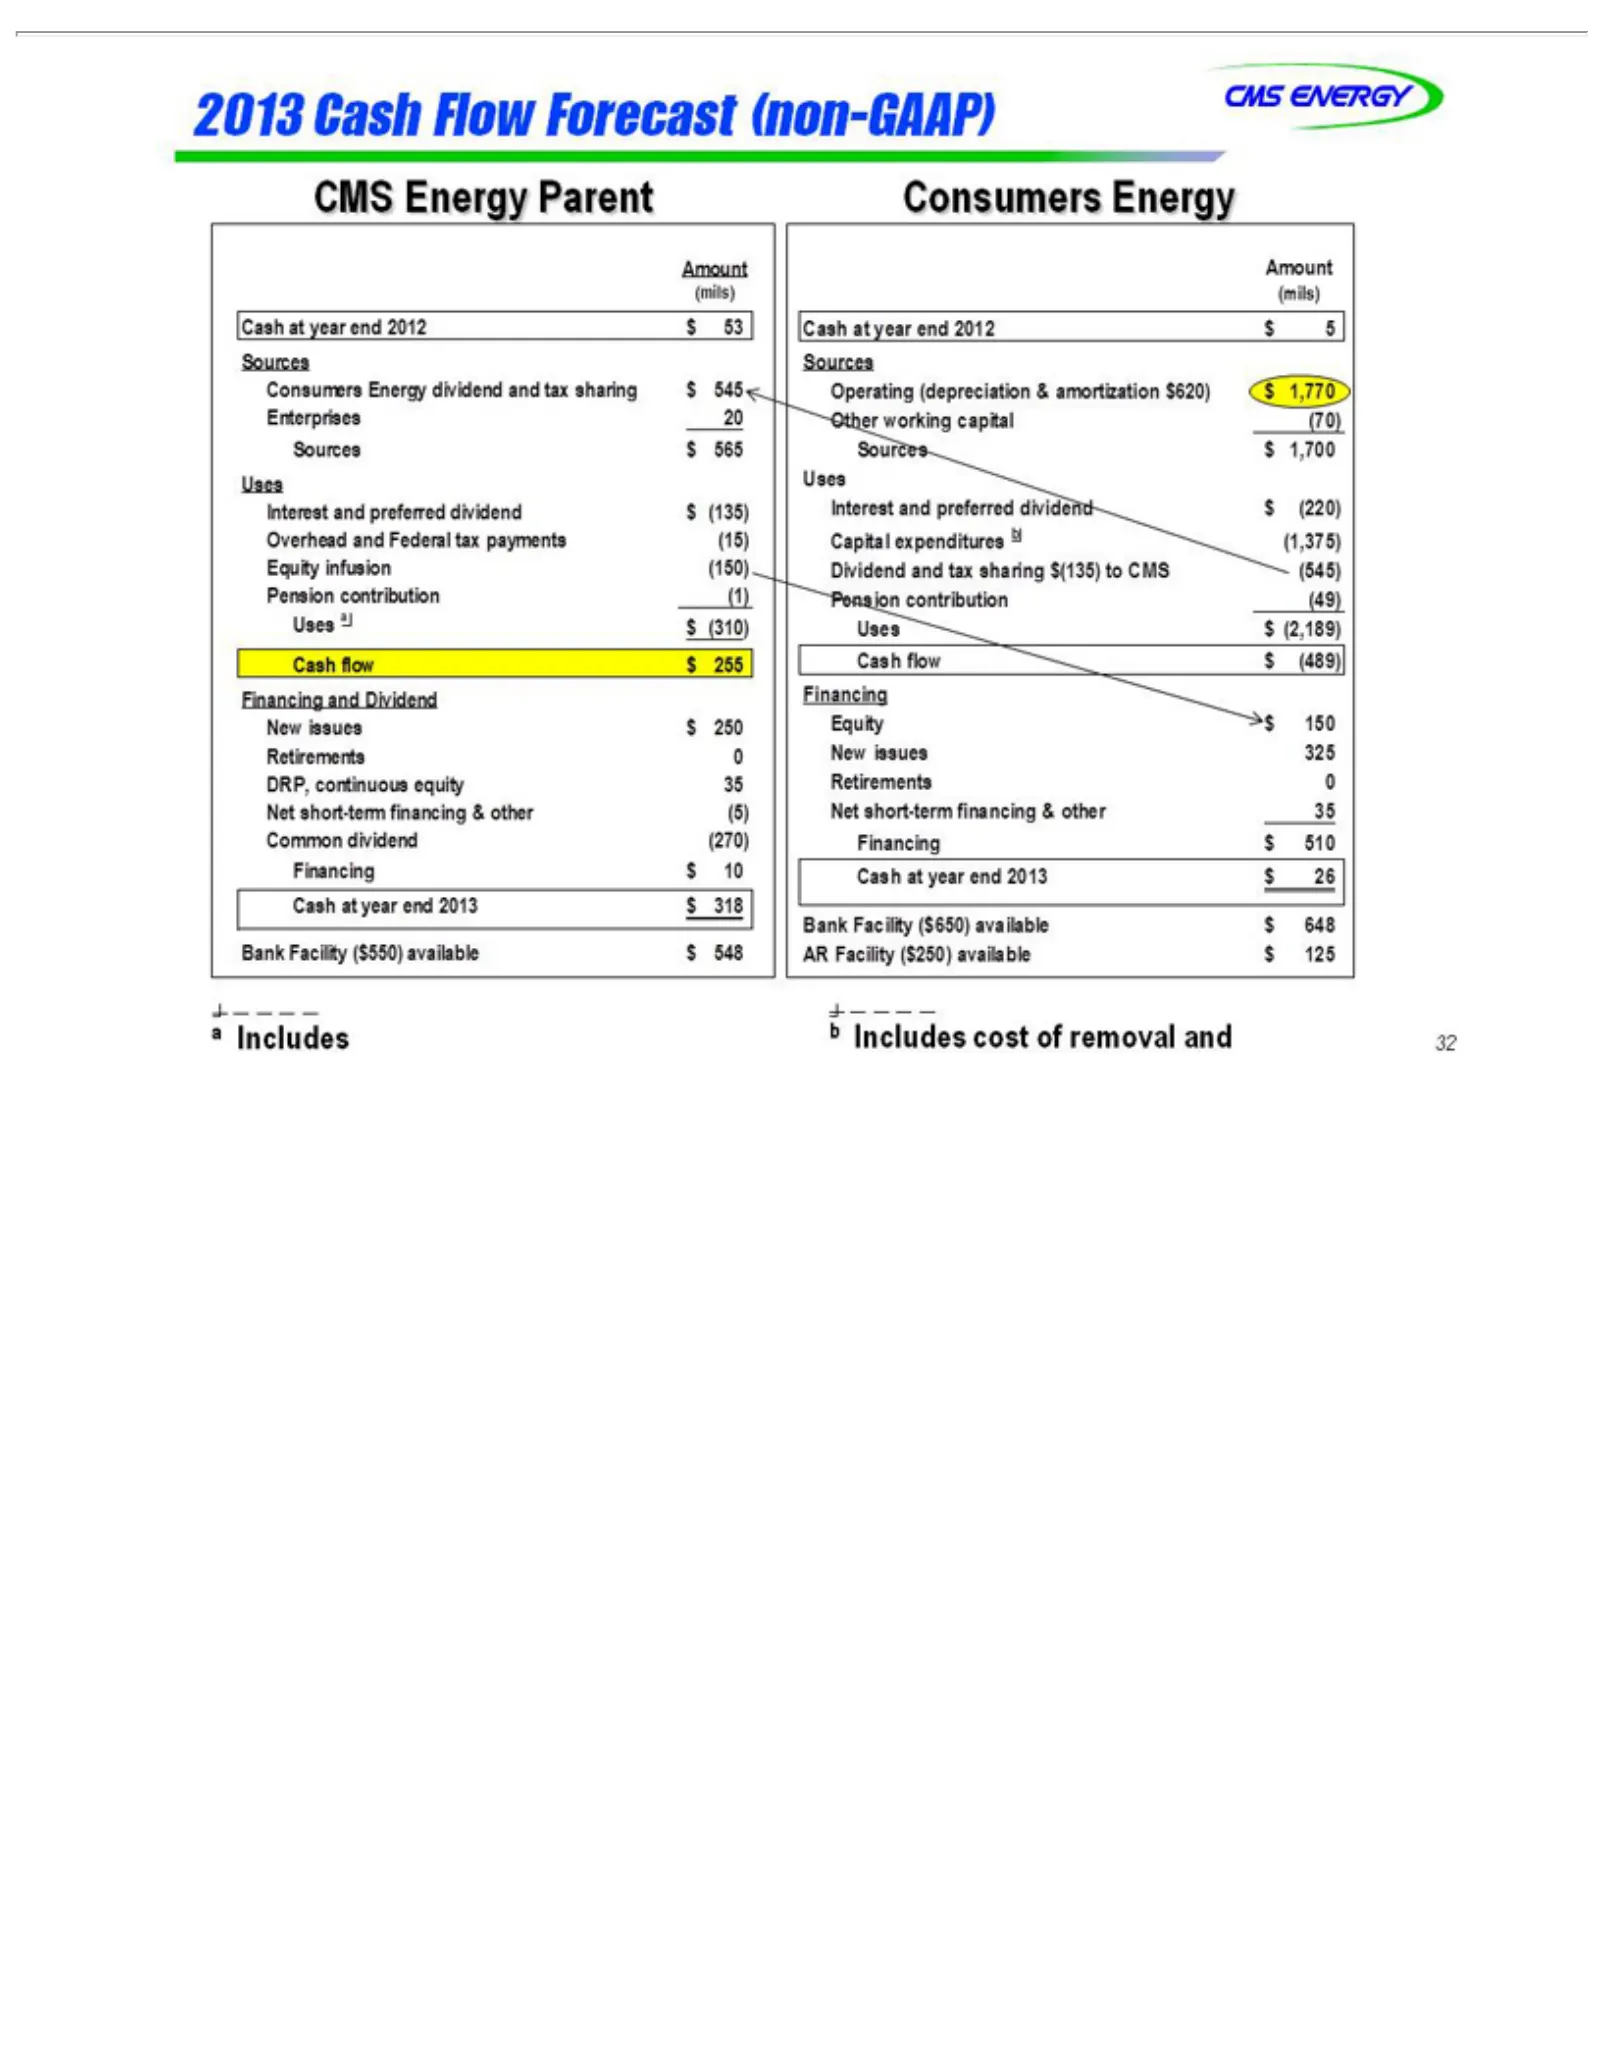
Slide 33: 2013 Sources and Uses of Cash
2013 CMS Enterprises Overhead DRP, aCommon Consumers (mils) Amount Operating Other Sources Interest Capital Dividend Pension Uses Equity New Retirements Net Financing Cash Bank AR b 32Includes Facility short-term issues $aCash flow at continuous Facility ENERGY Energy working $infusion (2,189) expen

Slide 34: GAAP Reconciliation
GAAP Reconciliation
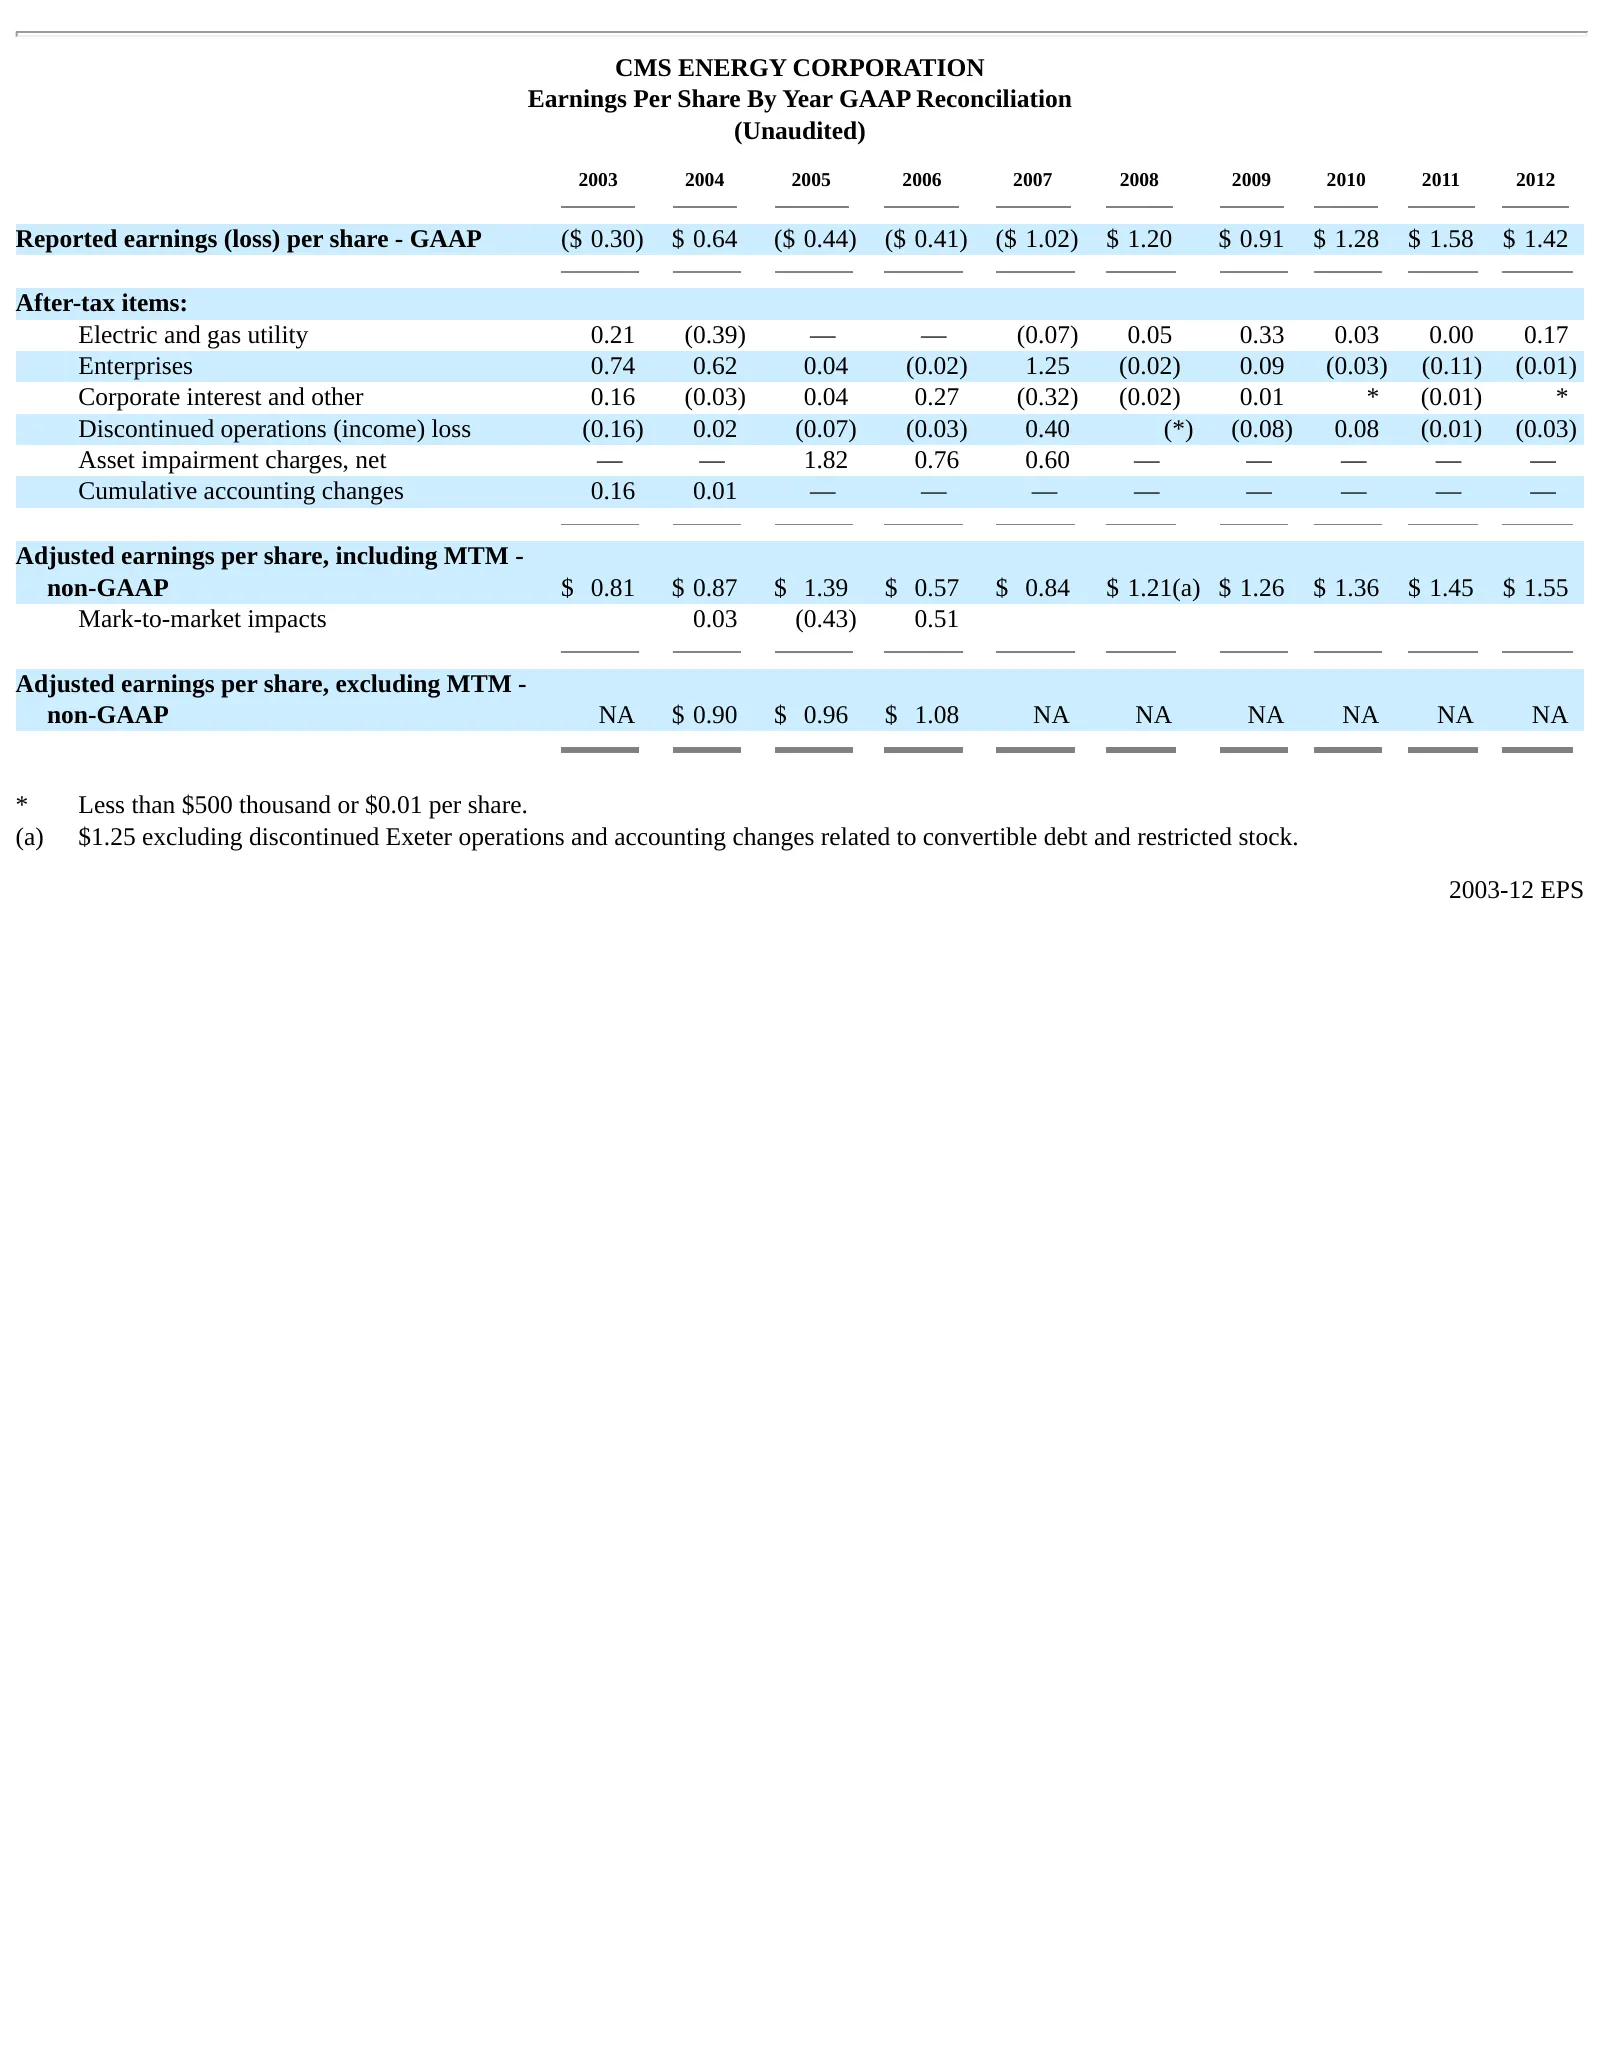
Slide 35: Earnings Per Share By Year GAAP Reconciliation
CMS ENERGY CORPORATION Earnings Per Share By Year GAAP Reconciliation (Unaudited) 2003 2004 2005 2006 2007 2008 2009 2010 2011 2012 Reported earnings (loss) per share - GAAP ($ 0.30) $ 0.64 ($ 0.44) ($ 0.41) ($ 1.02) $ 1.20 $ 0.91 $ 1.28 $ 1.58 $ 1.42 After-tax items: Electric and gas utility 0.21 (
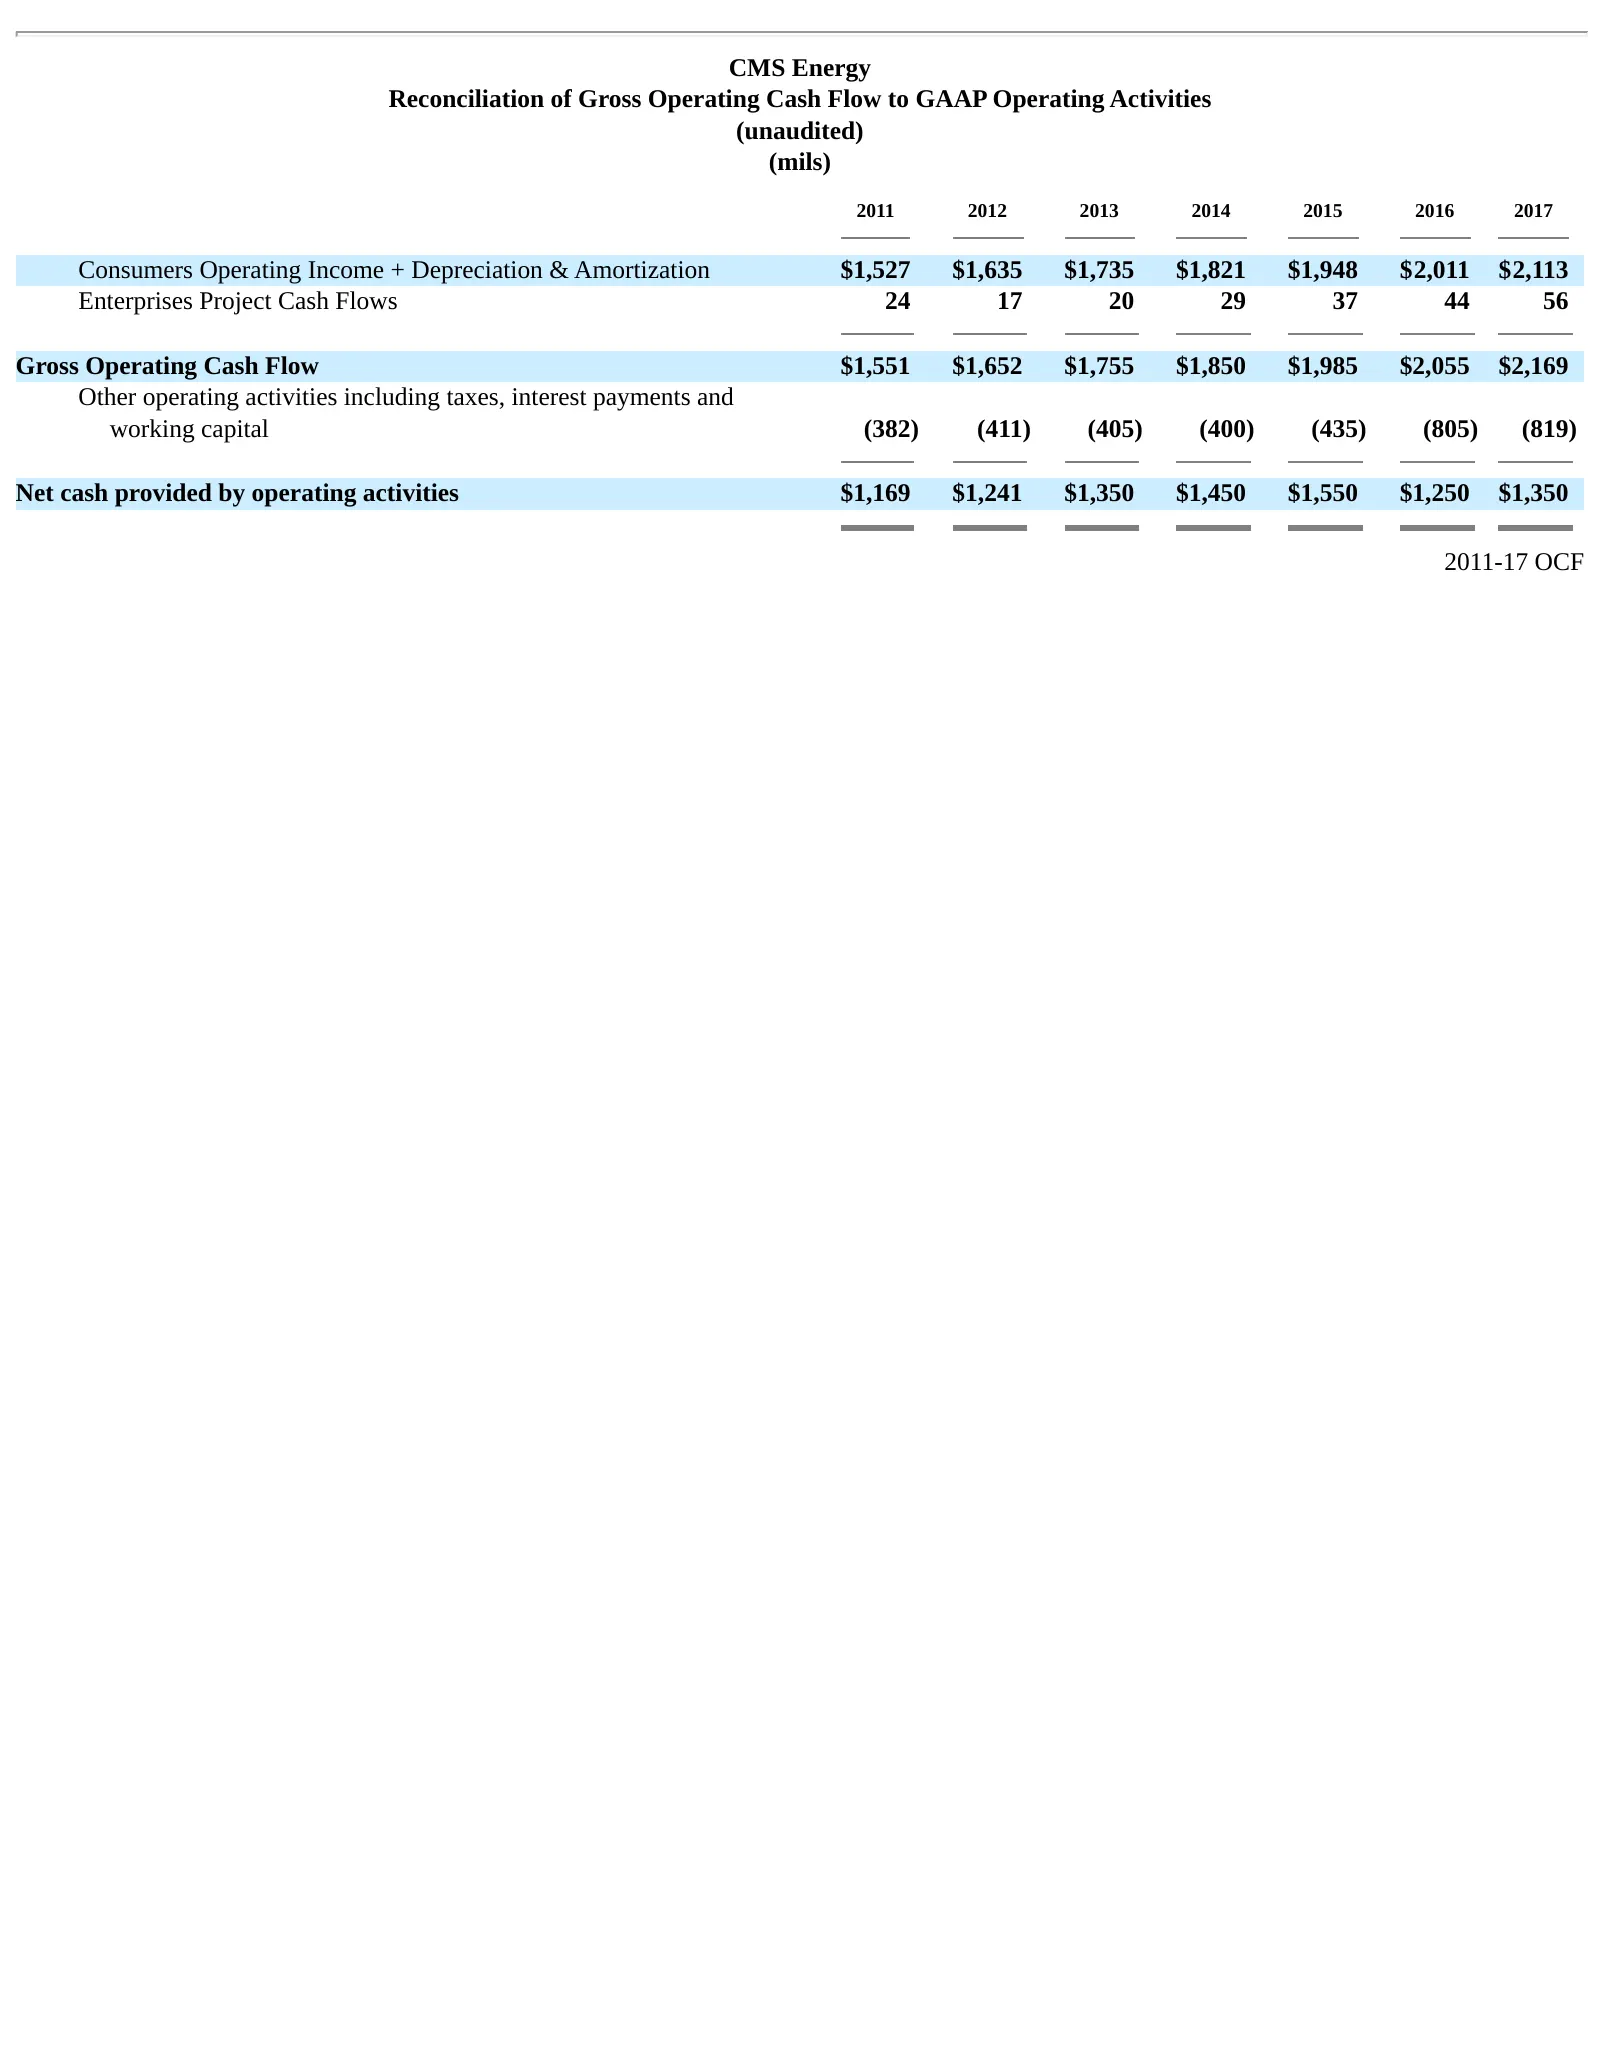
Slide 36: Gross Operating Cash Flow to GAAP Operating Activities
CMS Energy Reconciliation of Gross Operating Cash Flow to GAAP Operating Activities (unaudited) (mils) 2011 2012 2013 2014 2015 2016 2017 Consumers Operating Income + Depreciation & Amortization $1,527 $1,635 $1,735 $1,821 $1,948 $2,011 $2,113 Enterprises Project Cash Flows 24 17 20 29 37 44 56 Gros
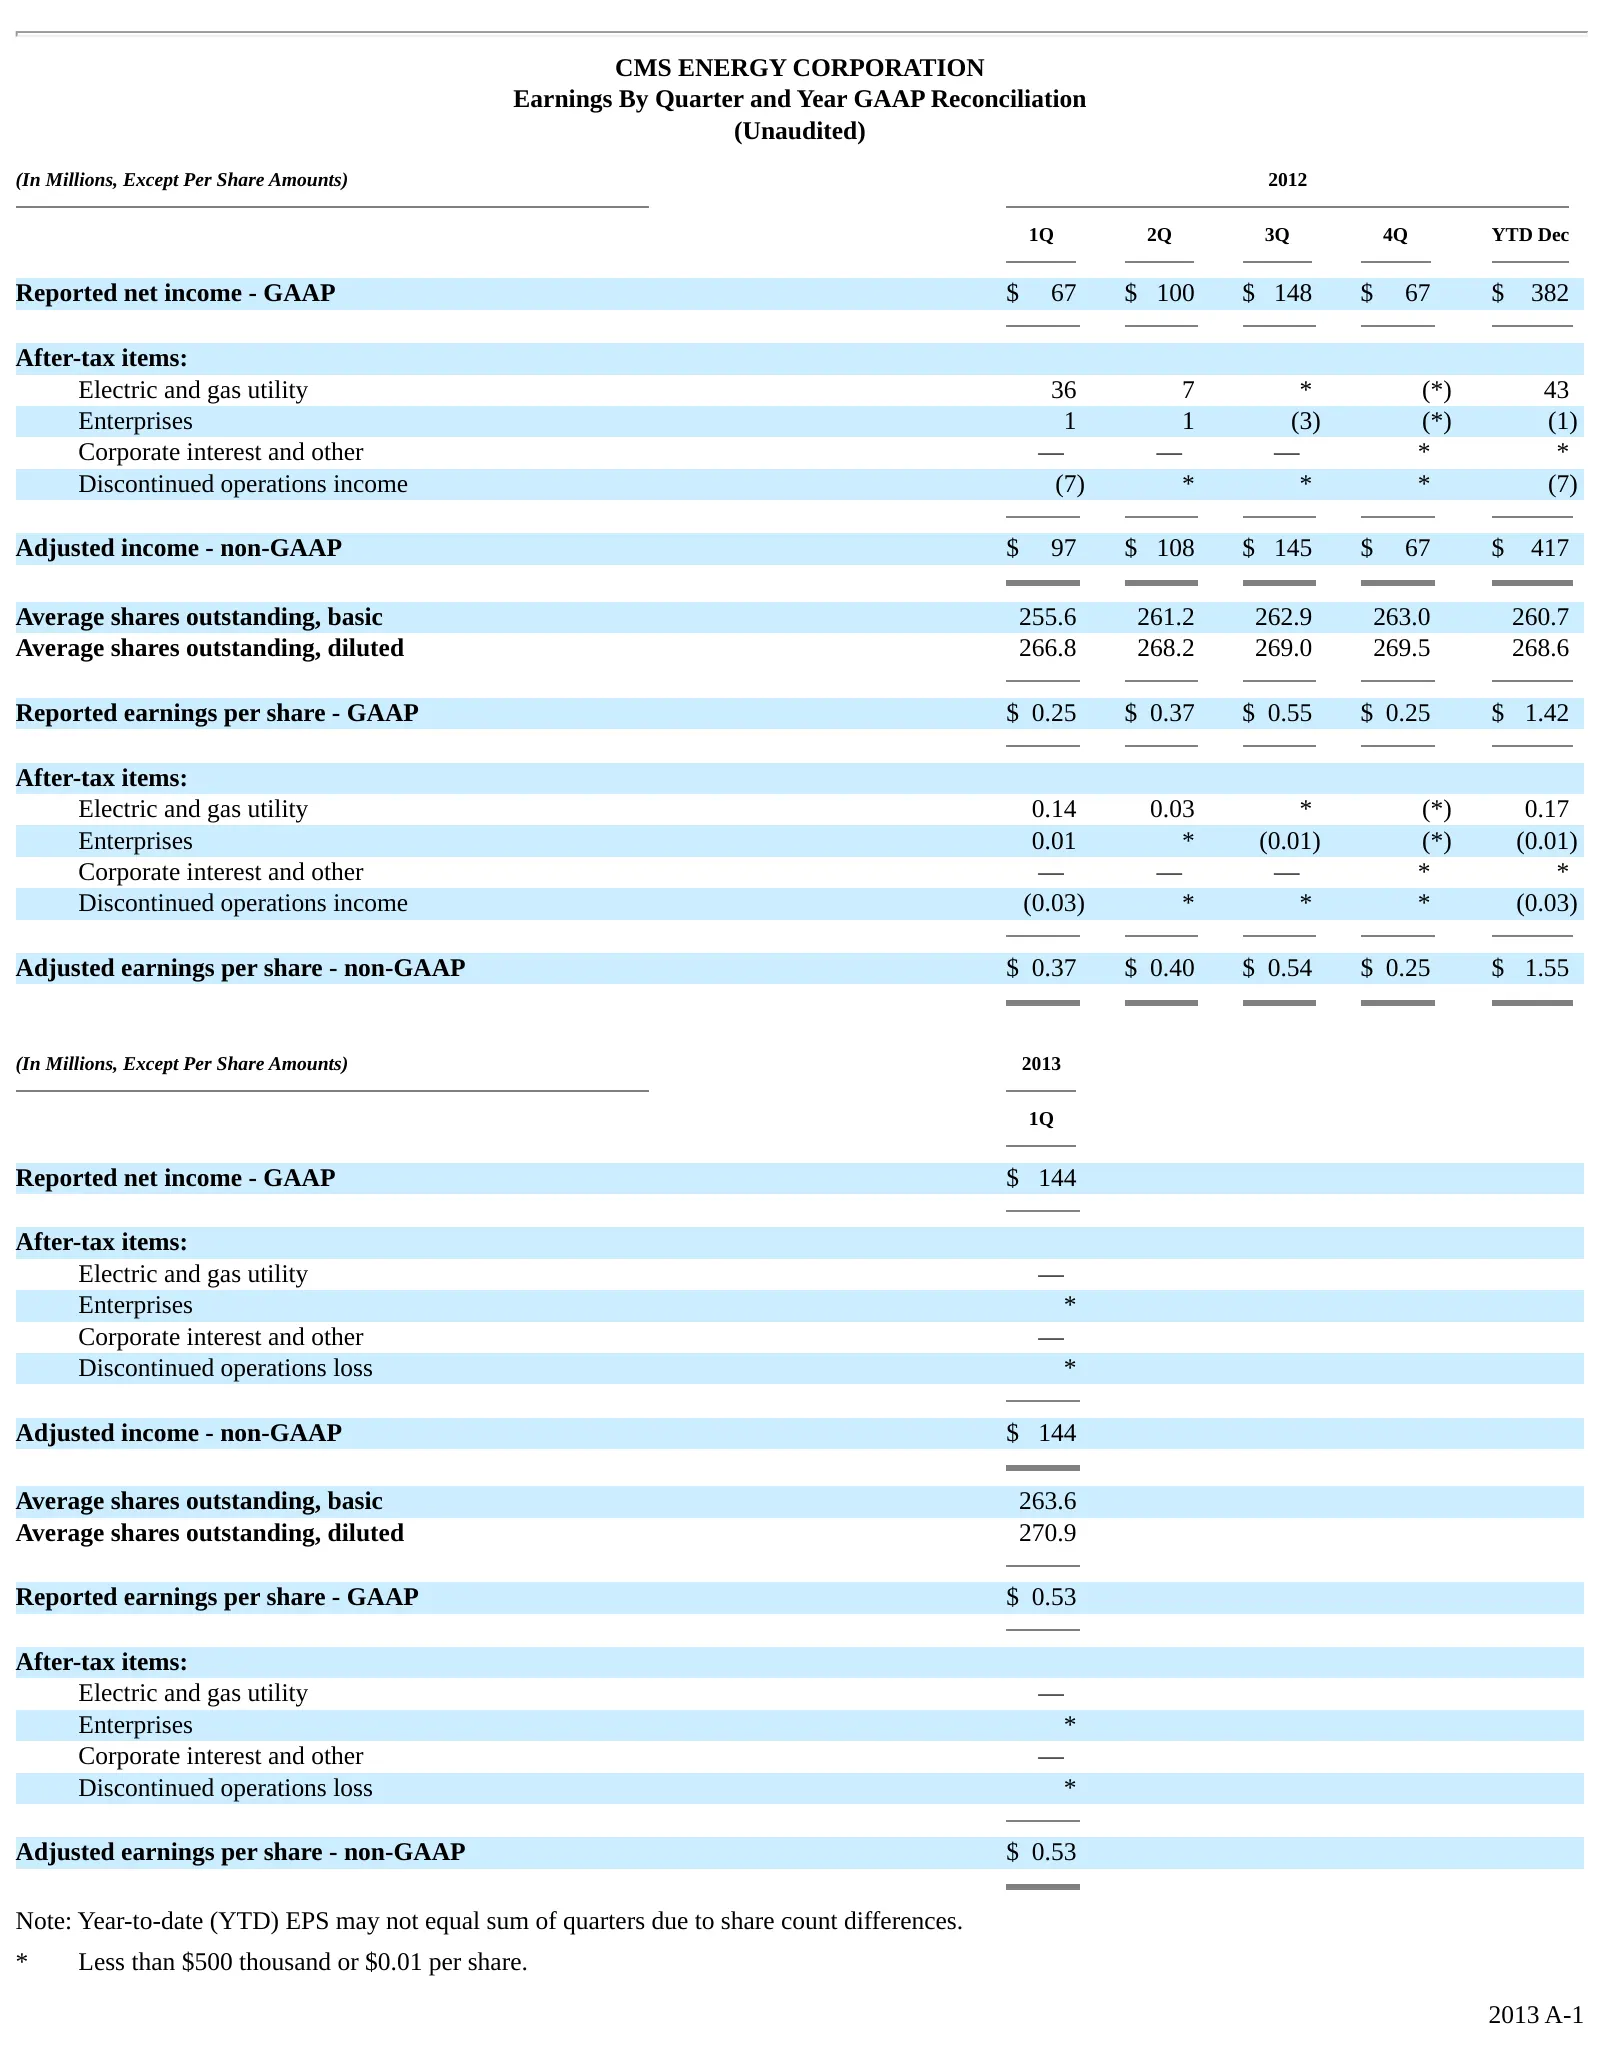
Slide 37: Earnings By Quarter and Year GAAP Reconciliation
CMS ENERGY CORPORATION Earnings By Quarter and Year GAAP Reconciliation (Unaudited) (In Millions, Except Per Share Amounts) 2012 1Q 2Q 3Q 4Q YTD Dec Reported net income - GAAP $ 67 $ 100 $ 148 $ 67 $ 382 After-tax items: Electric and gas utility 36 7 * (*) 43 Enterprises 1 1 (3) (*) (1) Corporate in
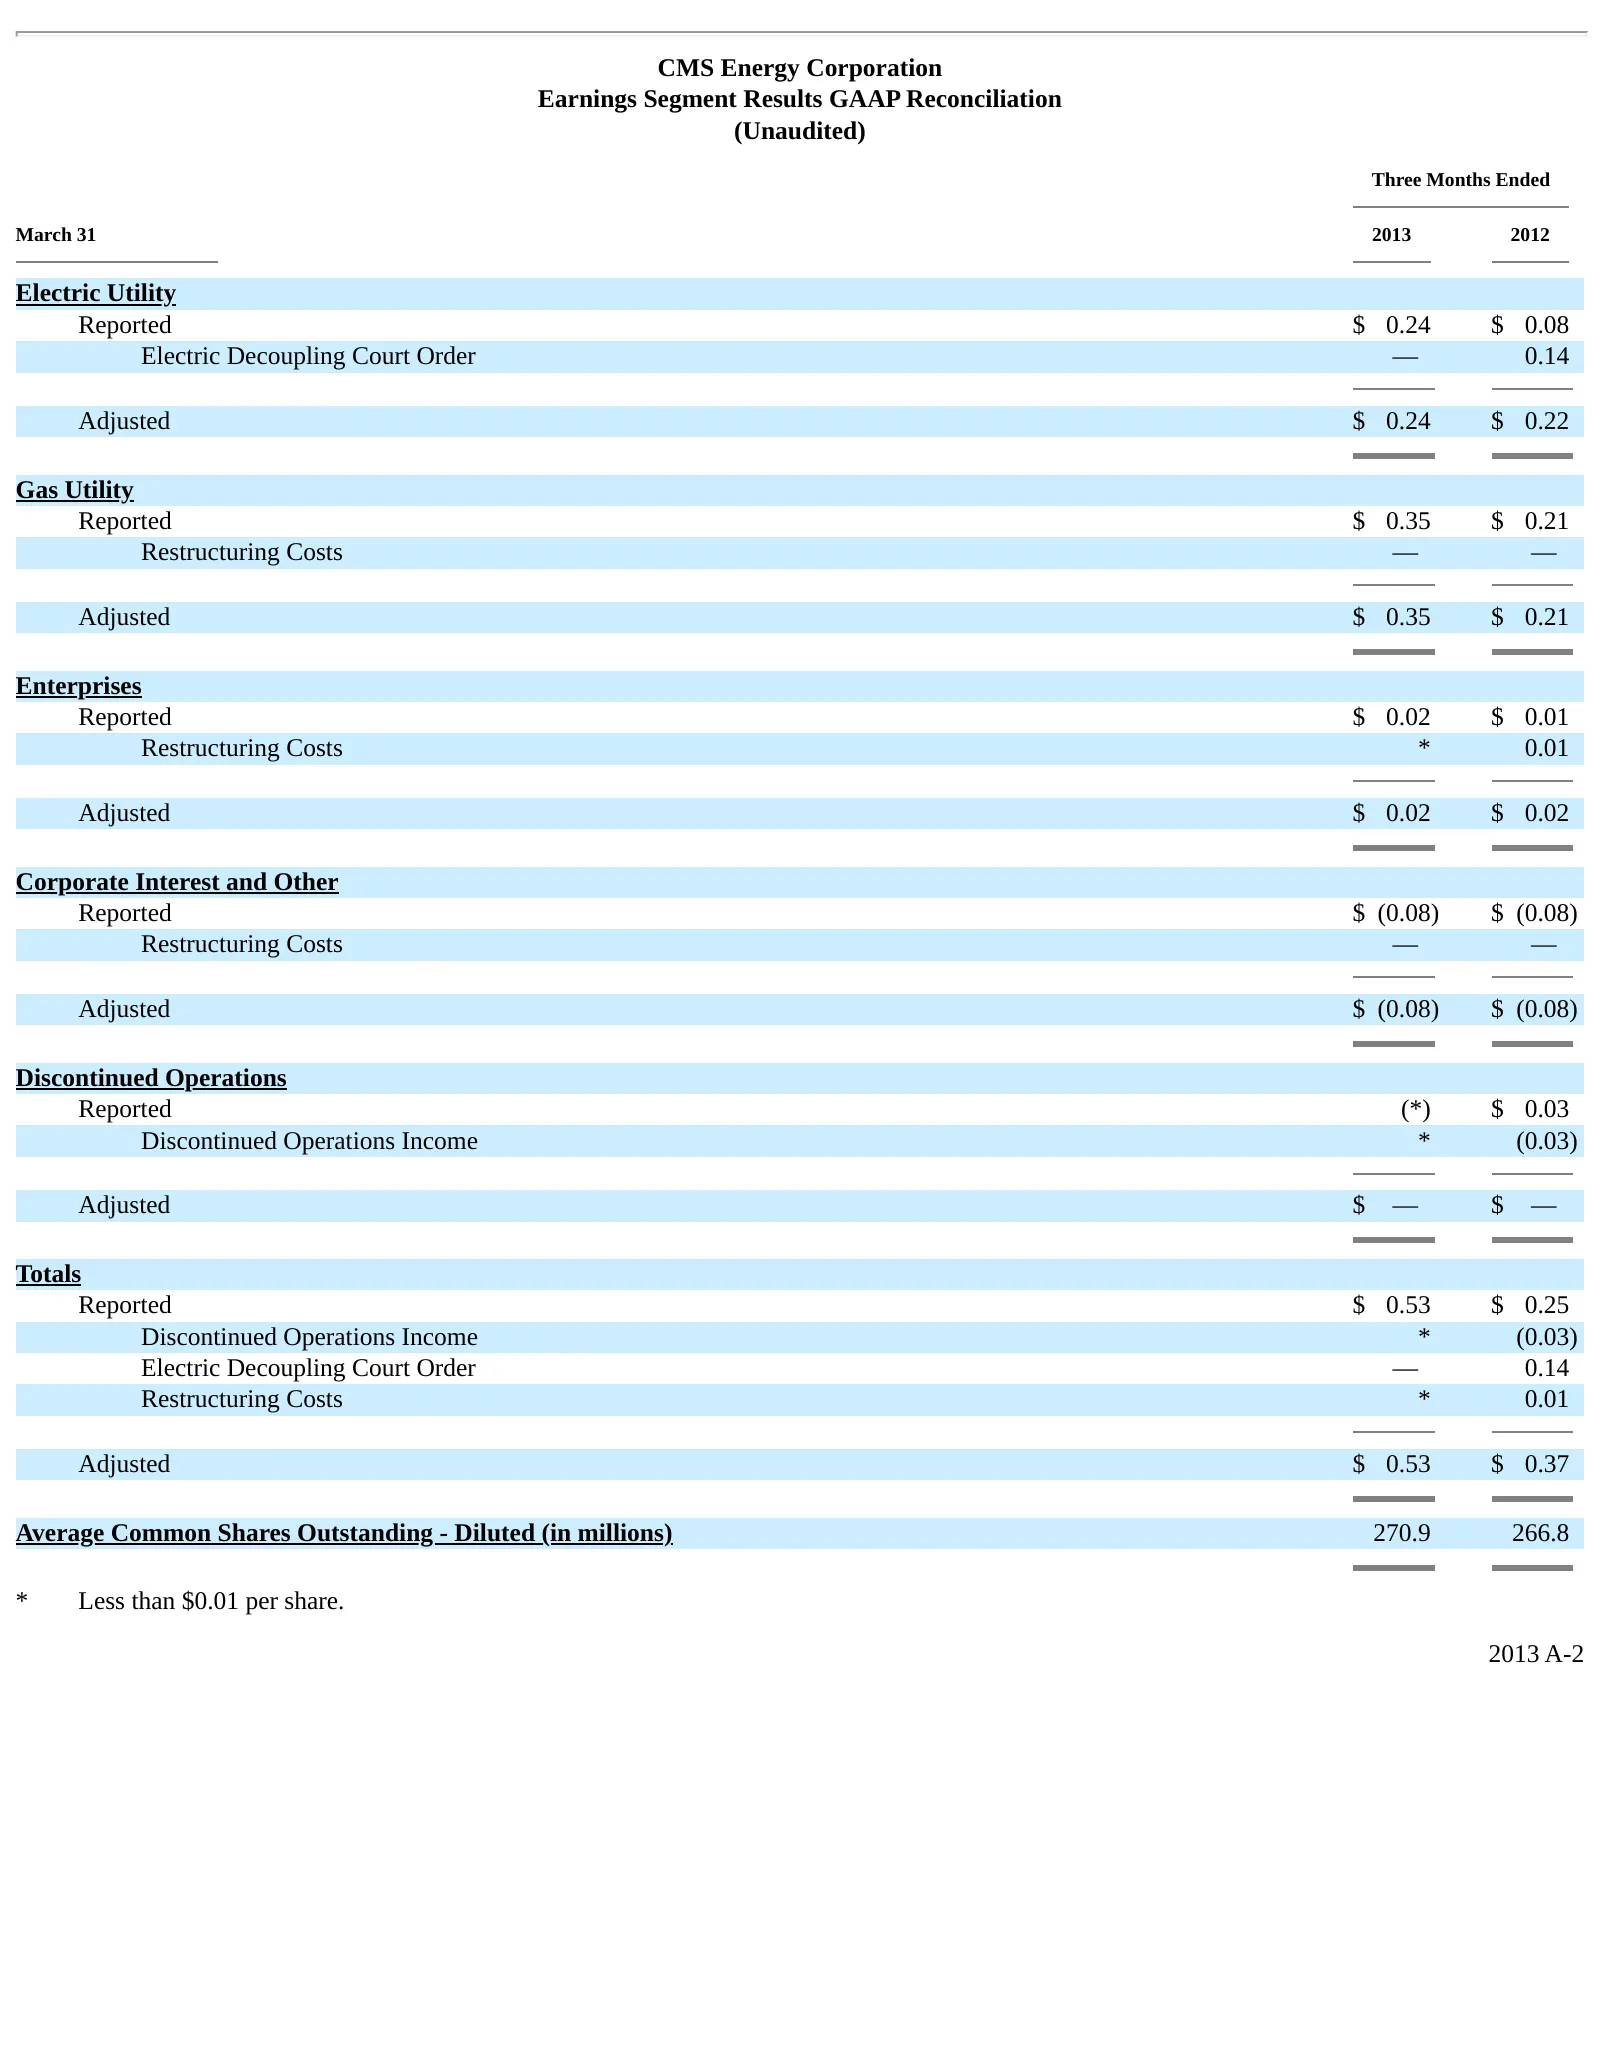
Slide 38: Earnings Segment Results GAAP Reconciliation
CMS Energy Corporation Earnings Segment Results GAAP Reconciliation (Unaudited) Three Months Ended March 31 2013 2012 Electric Utility Reported $ 0.24 $ 0.08 Electric Decoupling Court Order — 0.14 Adjusted $ 0.24 $ 0.22 Gas Utility Reported $ 0.35 $ 0.21 Restructuring Costs — — Adjusted $ 0.35 $ 0.2
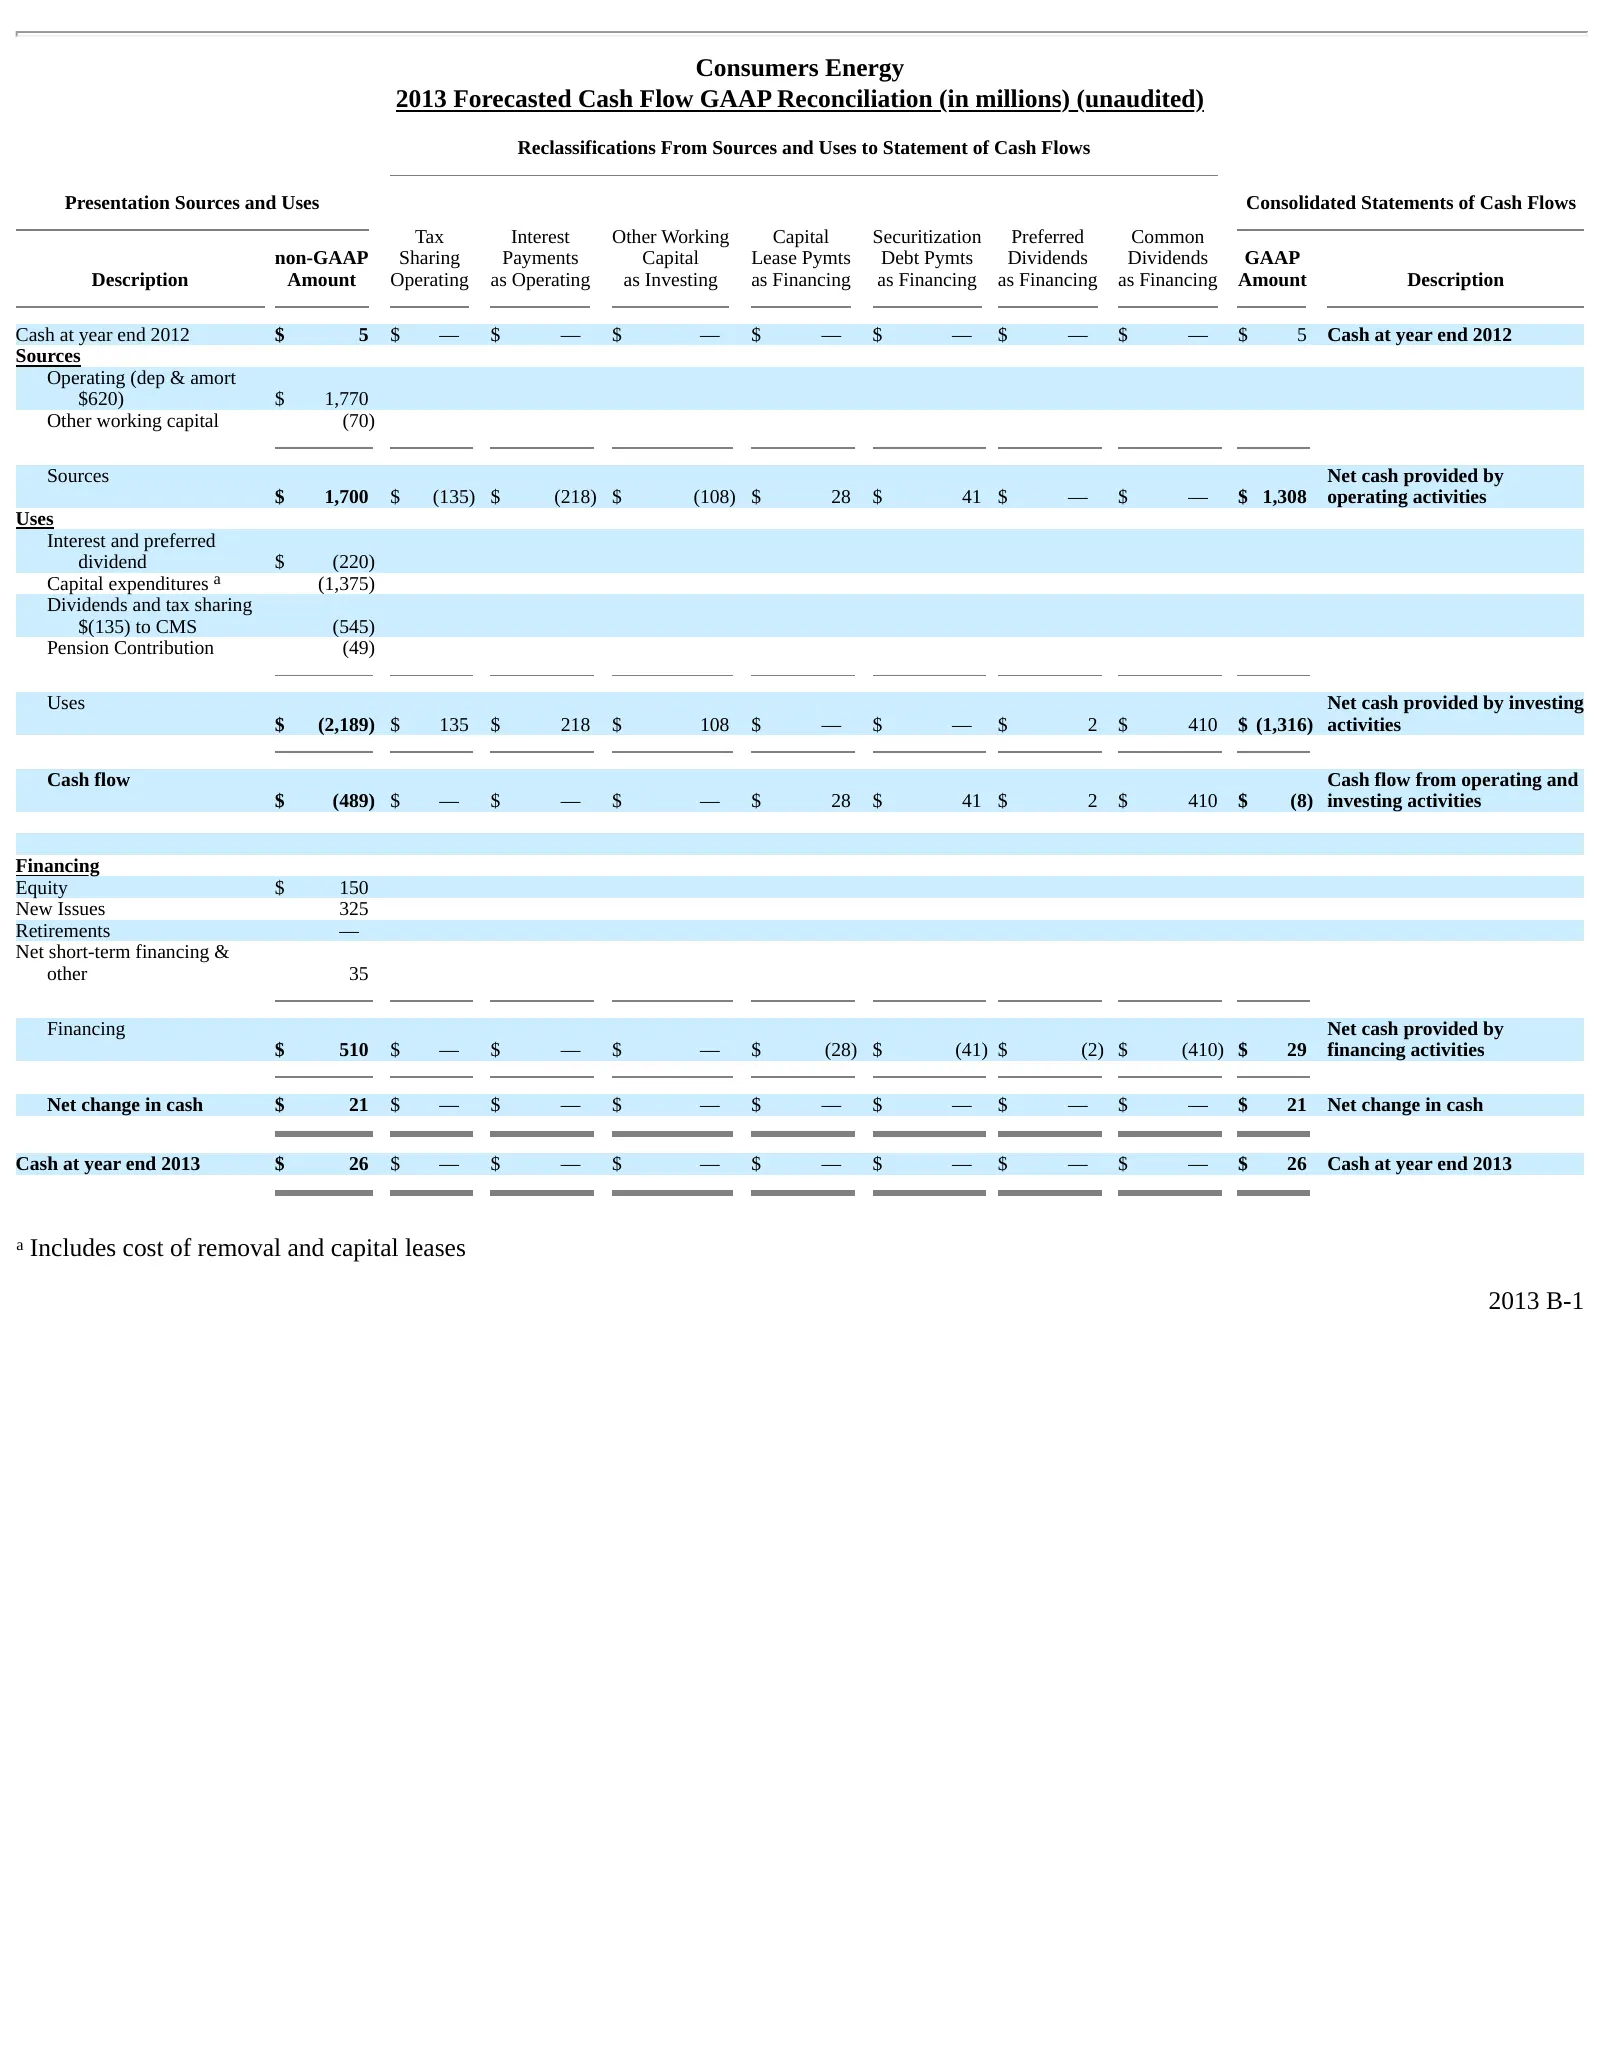
Slide 39: Consumers Energy 2013 Forecasted Cash Flow GAAP Reconciliation
Consumers Energy 2013 Forecasted Cash Flow GAAP Reconciliation (in millions) (unaudited) Reclassifications From Sources and Uses to Statement of Cash Flows Presentation Sources and Uses Consolidated Statements of Cash Flows Tax Interest Other Working Capital Securitization Preferred Common non-GAAP
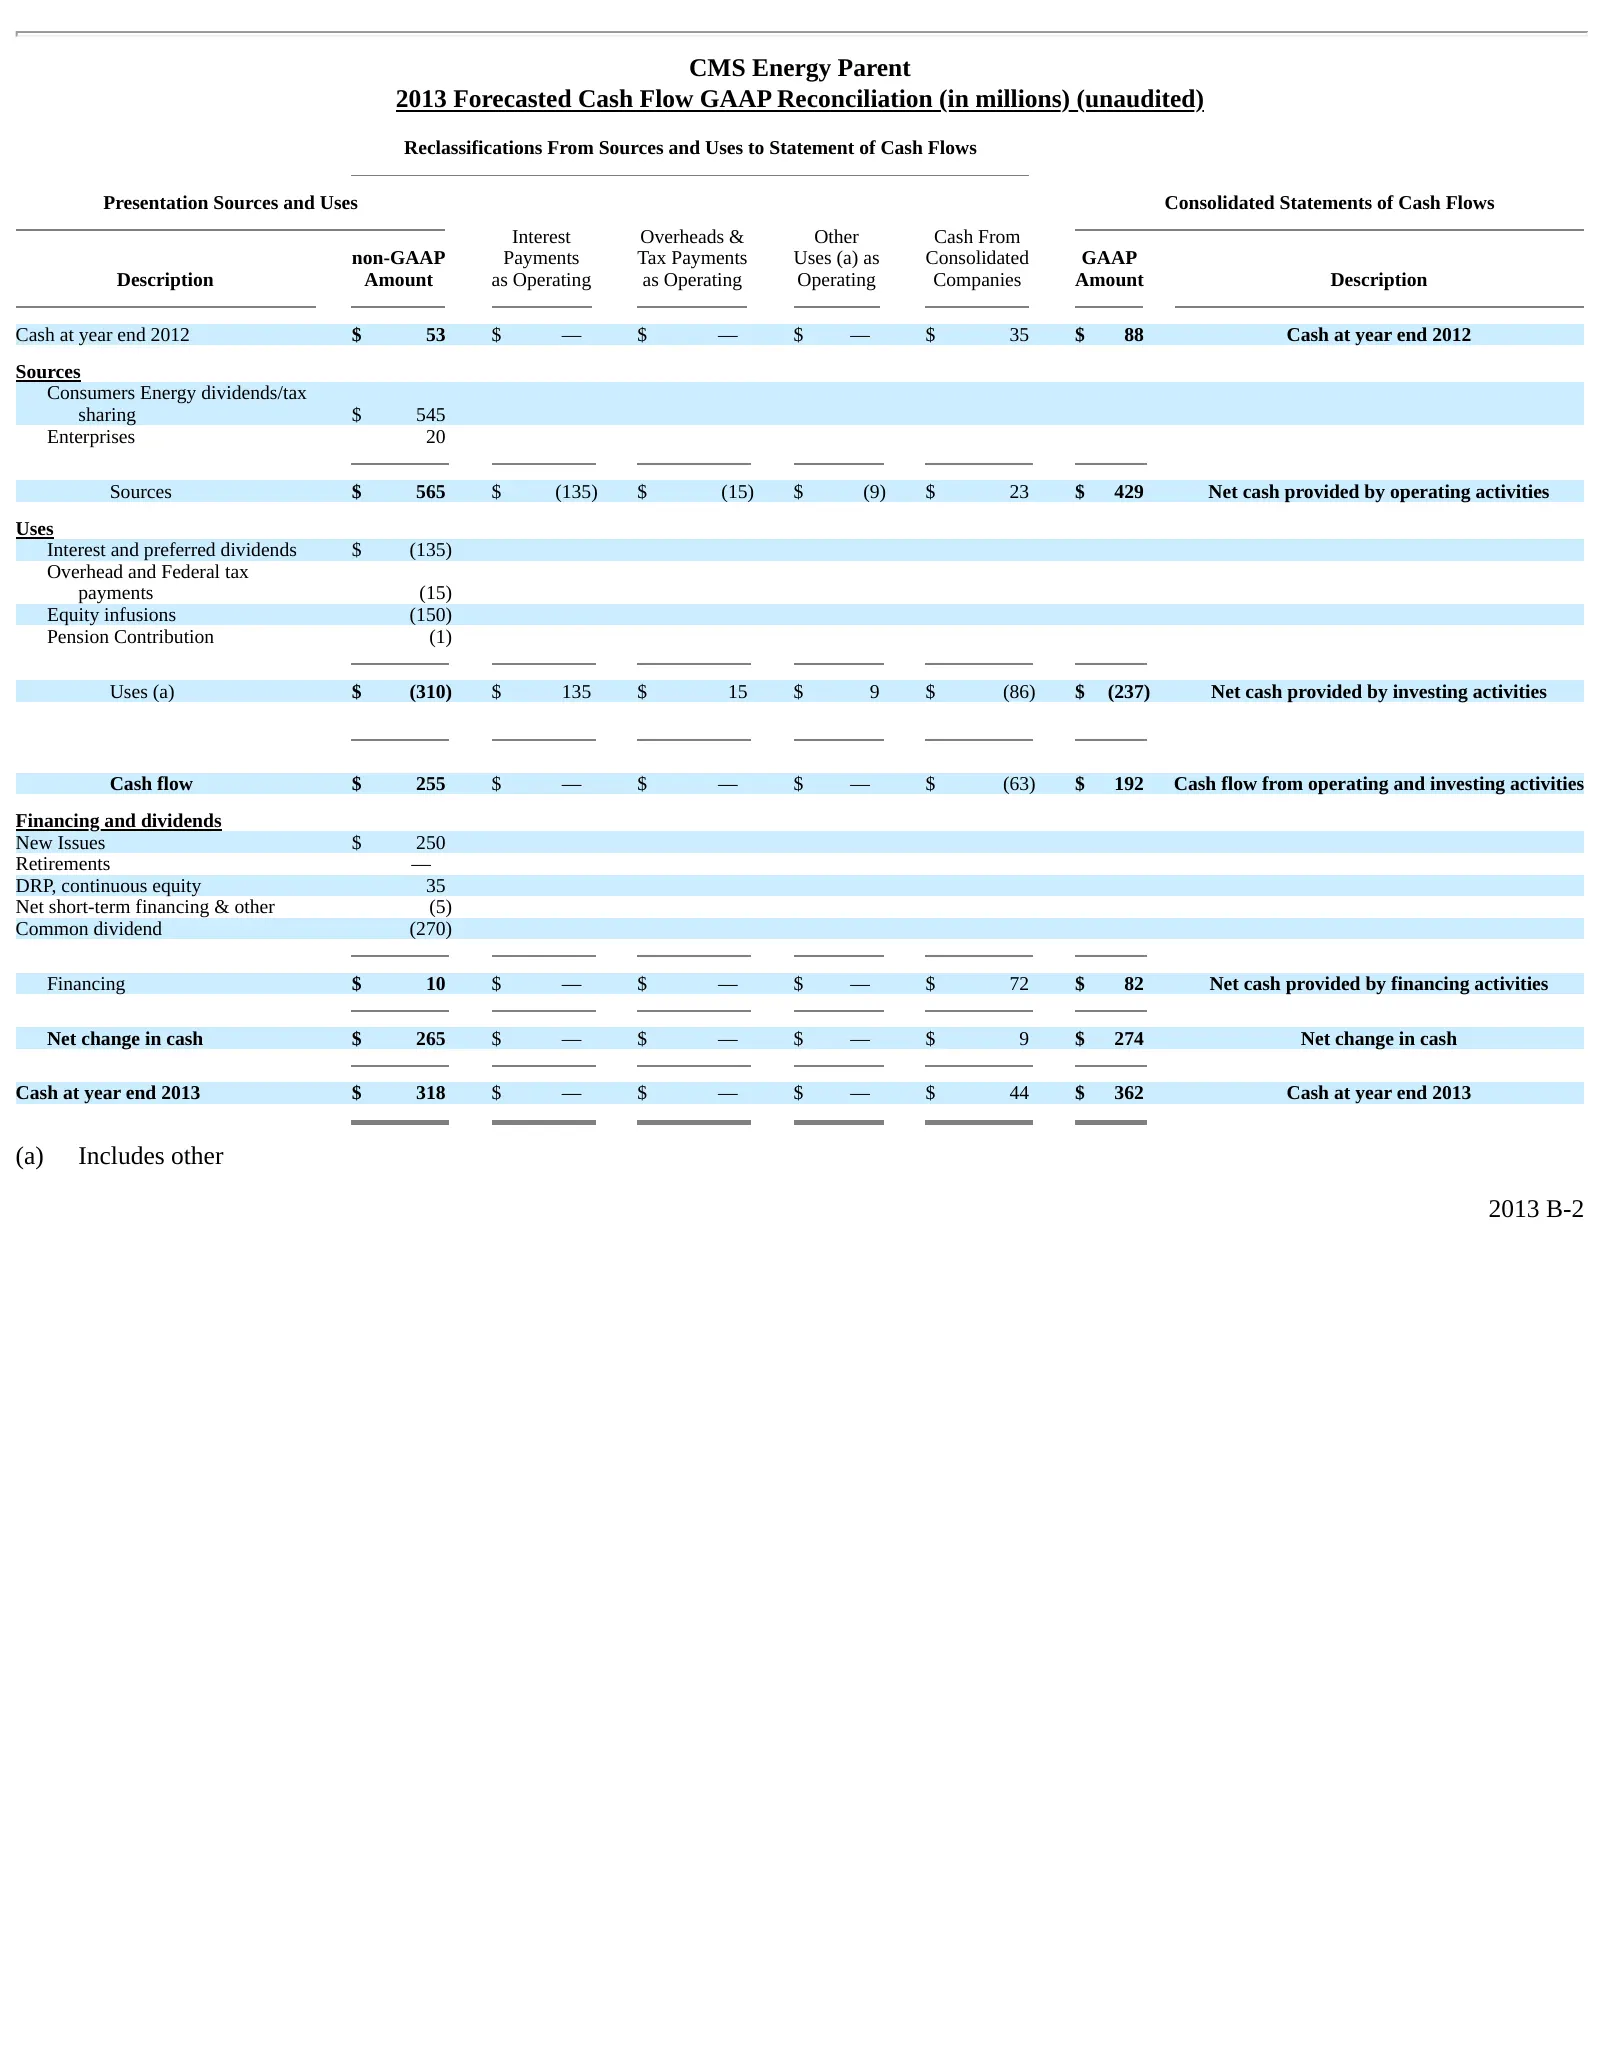
Slide 40: CMS Energy Parent 2013 Forecasted Cash Flow GAAP Reconciliation
CMS Energy Parent 2013 Forecasted Cash Flow GAAP Reconciliation (in millions) (unaudited) Reclassifications From Sources and Uses to Statement of Cash Flows Presentation Sources and Uses Consolidated Statements of Cash Flows Interest Overheads & Other Cash From non-GAAP Payments Tax Payments Uses (a
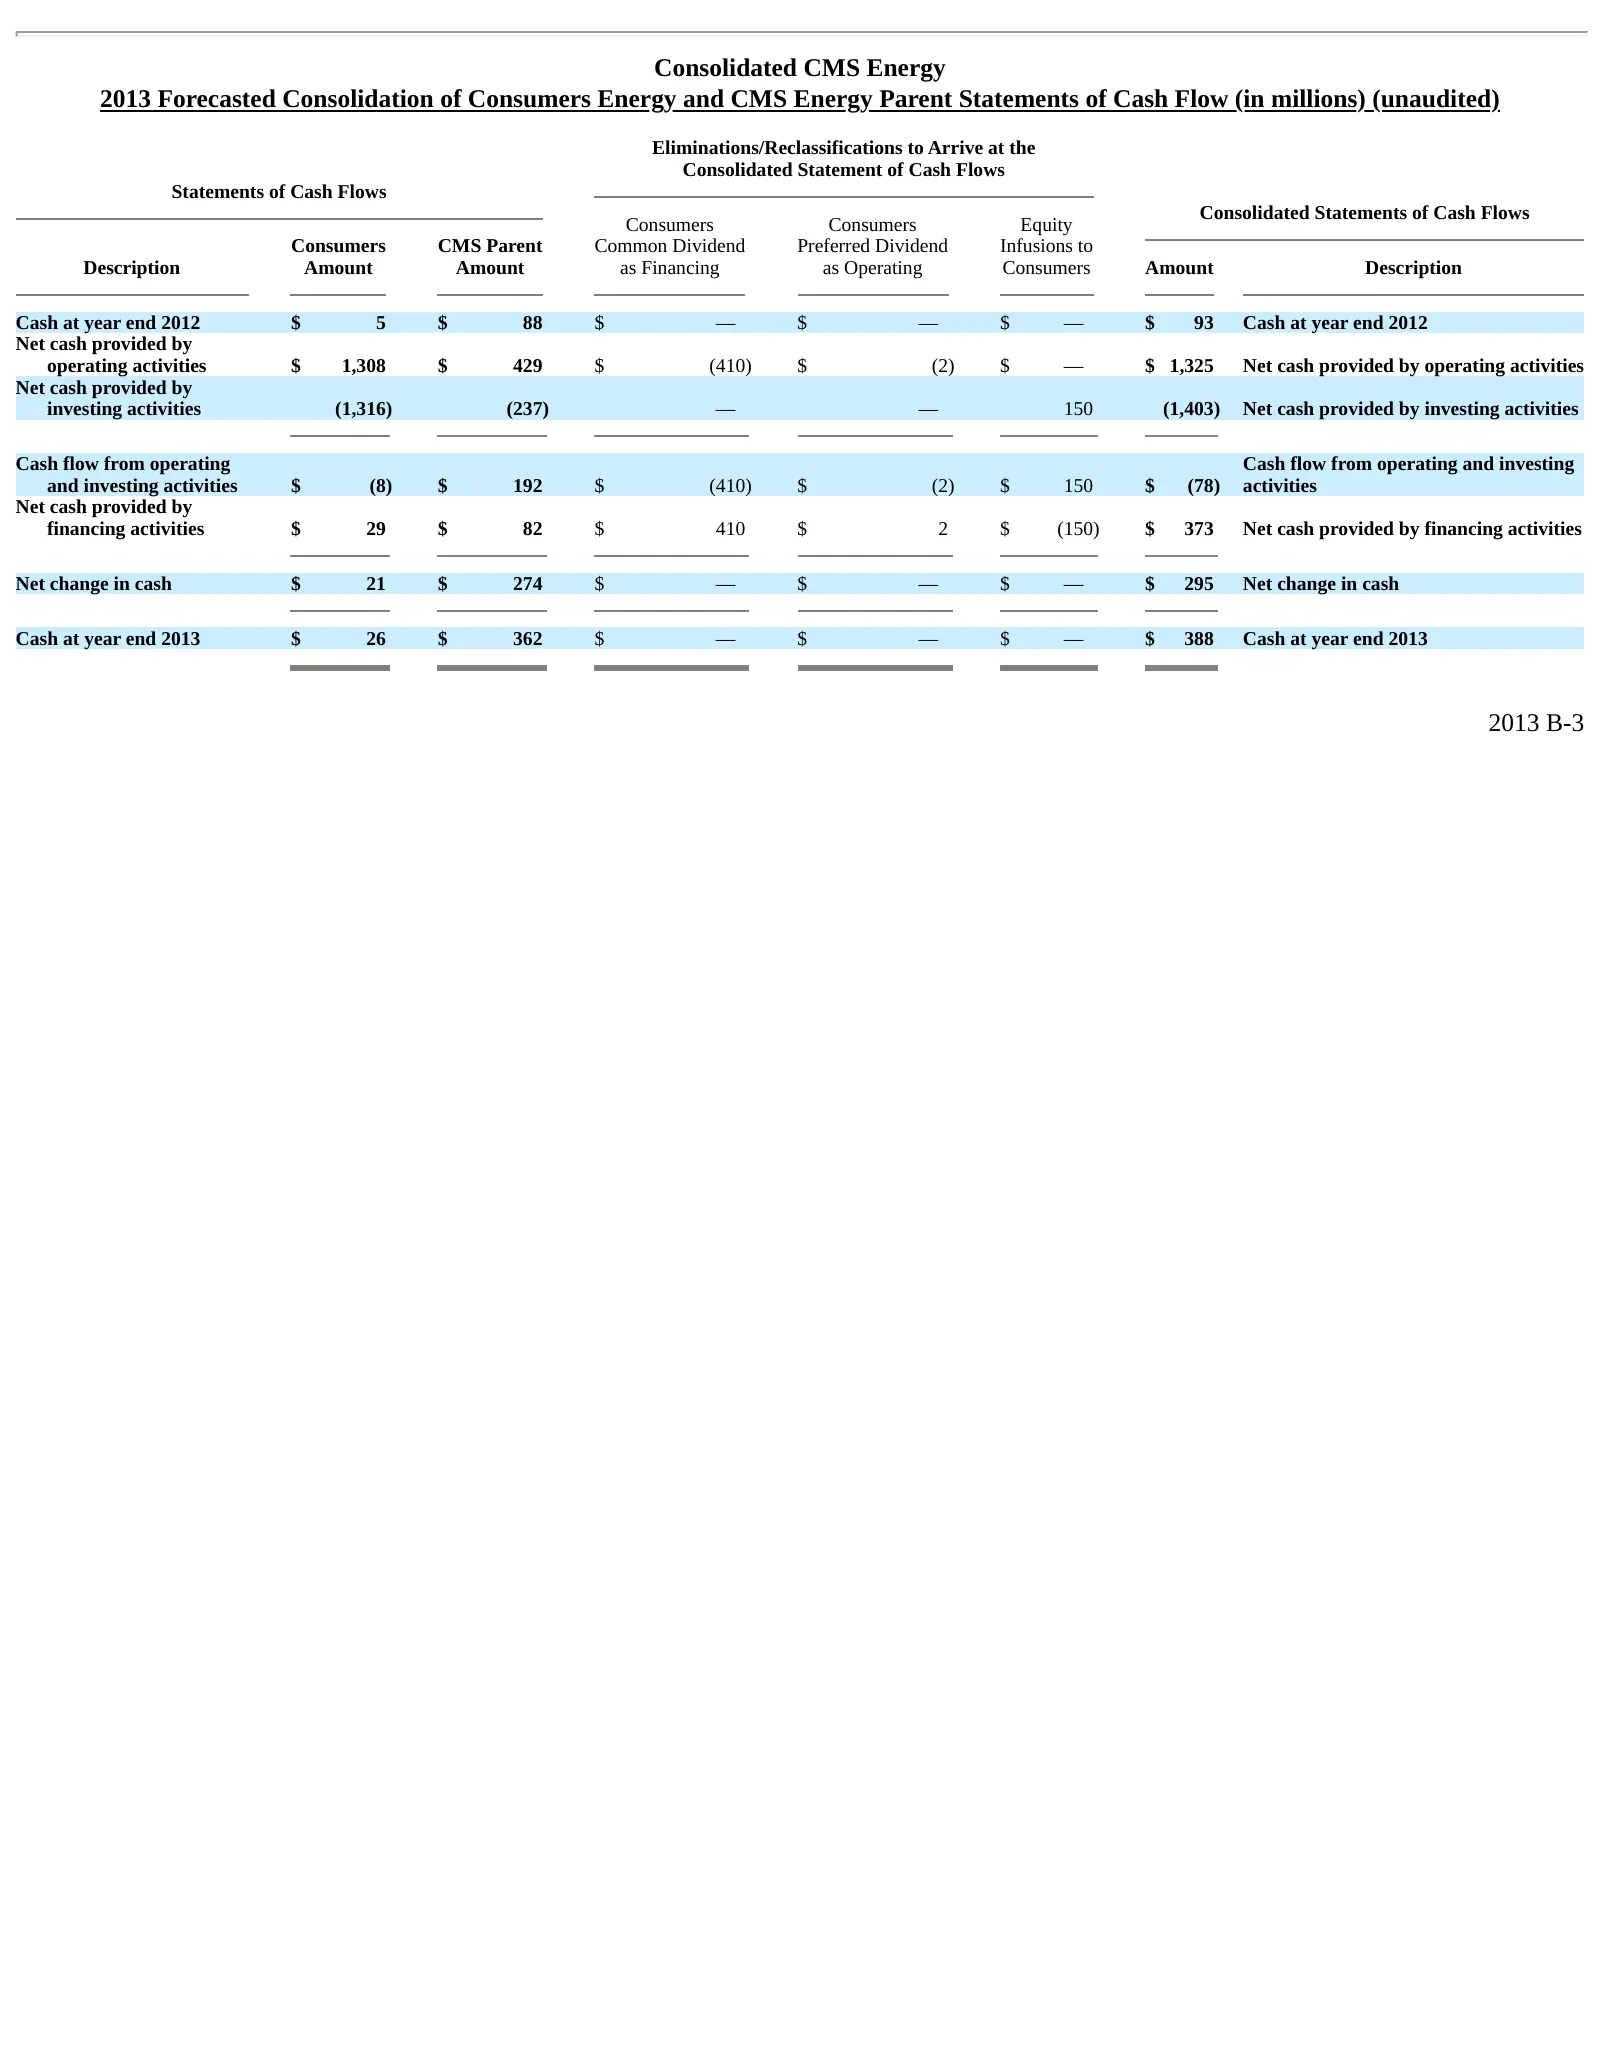
Slide 41: Consolidated CMS Energy 2013 Forecasted Statements of Cash Flow
Consolidated CMS Energy 2013 Forecasted Consolidation of Consumers Energy and CMS Energy Parent Statements of Cash Flow (in millions) (unaudited) Eliminations/Reclassifications to Arrive at the Consolidated Statement of Cash Flows Statements of Cash Flows Consolidated Statements of Cash Flows Consum
Source: SEC EDGAR · 8-K filed May 13, 2013
More decks from Consumers Energy Company
 FY2024 Earnings Presentation33 slides · Feb 6, 2025
 Technical Presentation (August 2024)8 slides · August 2024
 Technical Presentation (August 2024)8 slides · August 2024
 Corporate Update (August 2024)8 slides · August 2024
 Corporate Update (August 2024)8 slides · August 2024
 Corporate Update (September 2023)22 slides · Sep 28, 2023