Retail Properties of America Inc
Retail Properties of America — Investor Presentation (October 2012)
31 slides from Retail Properties of America's investor presentation, Oct 2, 2012

Slide 1: Investor Presentation October 2012
Exhibit 99.1 INVESTOR PRESENTATION October 2012
Slide 2: Disclaimer
Disclaimer This presentation contains “forward-looking statements” within the meaningof the safe harbor from civil liability provided for such statements by the Private SecuritiesLitigation Reform Act of 1995 (set forth in Section27A of the SecuritiesAct of 1933, asamended,or the SecuritiesAct, and
Slide 3: Investment Highlights
Investment Highlights Large, diversified, high quality retail portfolio Significantability to enhanceportfolio valuethrough continued lease-up Diversified base of value-oriented retail tenants Capital structure positioned for growth Opportunity to enhance portfolio and balance sheet through disposit
Slide 4: Foundations of Strategic Growth Plan
Foundations of Strategic Growth Plan Enhancing portfolio value. Continuing to grow value through: — Strong leasing momentum — Stabilized cash flows — Active asset management focused on risk mitigation and tenant retention Strengthening balance sheet. Reducing leverage and overall risk profile is a t
Slide 5: Executing Strategic Initiatives
Executing Strategic Initiatives Aon lease renewal — Active approach to asset management resulted in lease extensions and prepared the asset for sale Sold $227 M of assets YTD, most notably: — Mervyns 13-asset portfolio for $100 M, with proceeds used to repay the mortgage debt related to the 23-asset
Slide 6: Financial and Operational Goals
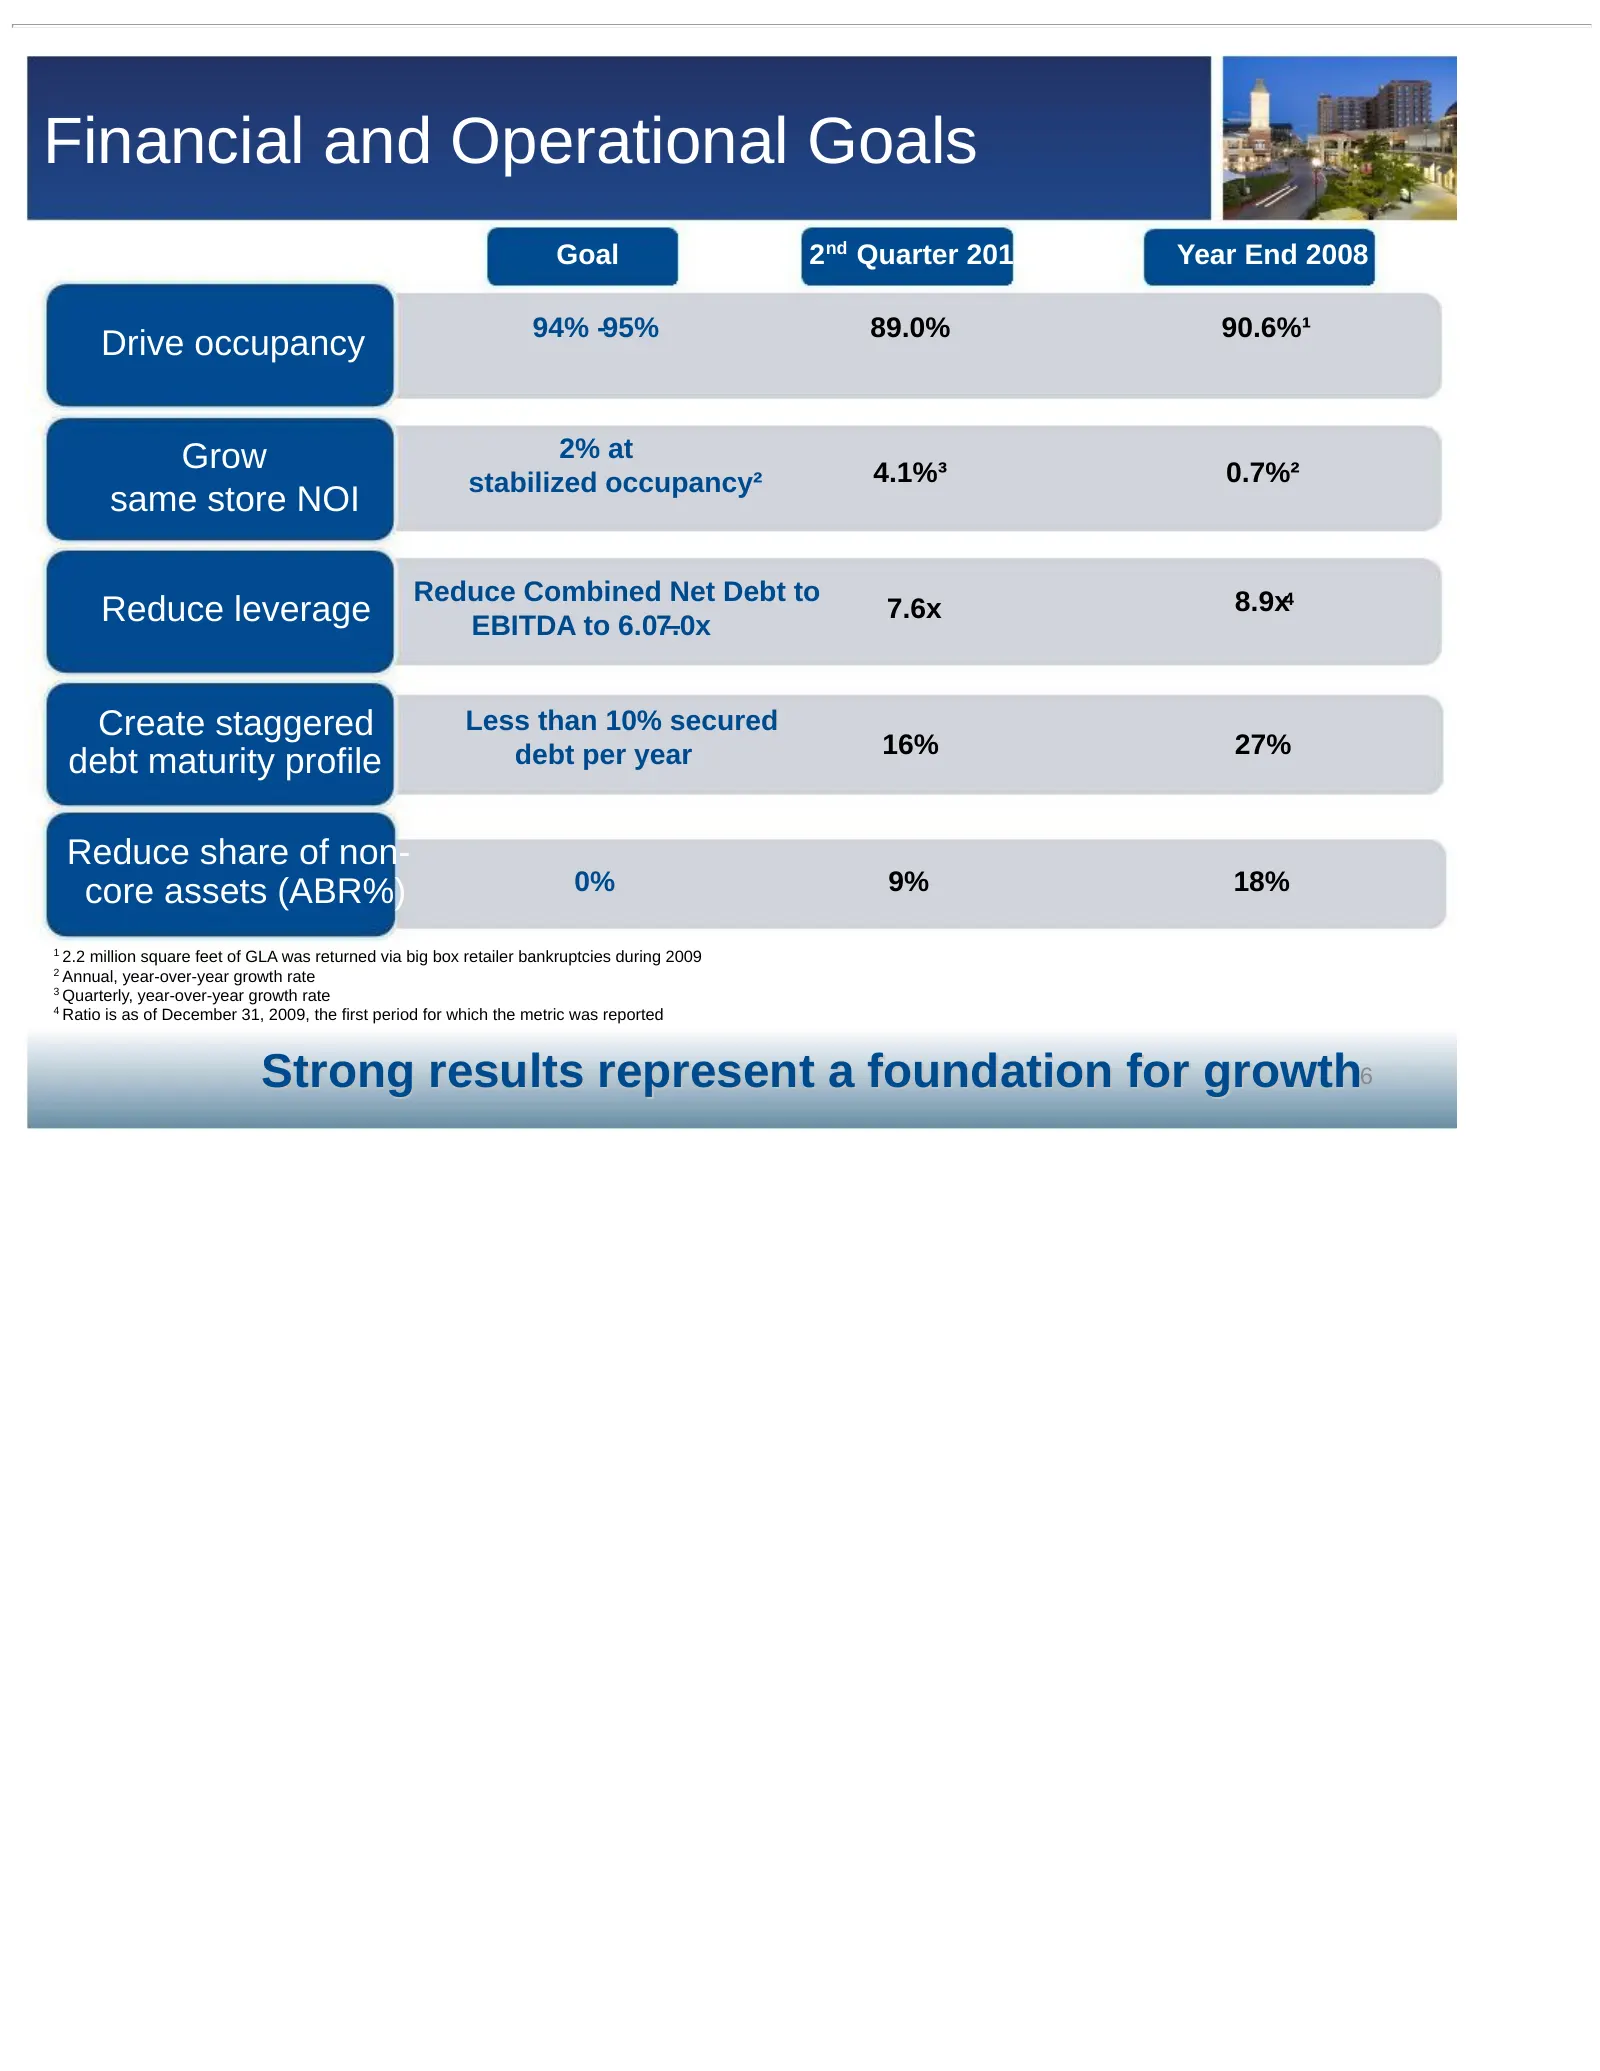
Financial and Operational Goals Goal 2nd Quarter 2012 Year End 2008 94% -95% 89.0% 90.6%¹ Drive occupancy Grow 2% at stabilized occupancy² 4.1%³ 0.7%² same store NOI Reduce Combined Net Debt to 8.9x4 Reduce leverage EBITDA to 6.07.0x – 7.6x Create staggered Less than 10% secured debt per year 16% 27
Slide 7: Strong 2Q12 Financial & Operational Performance
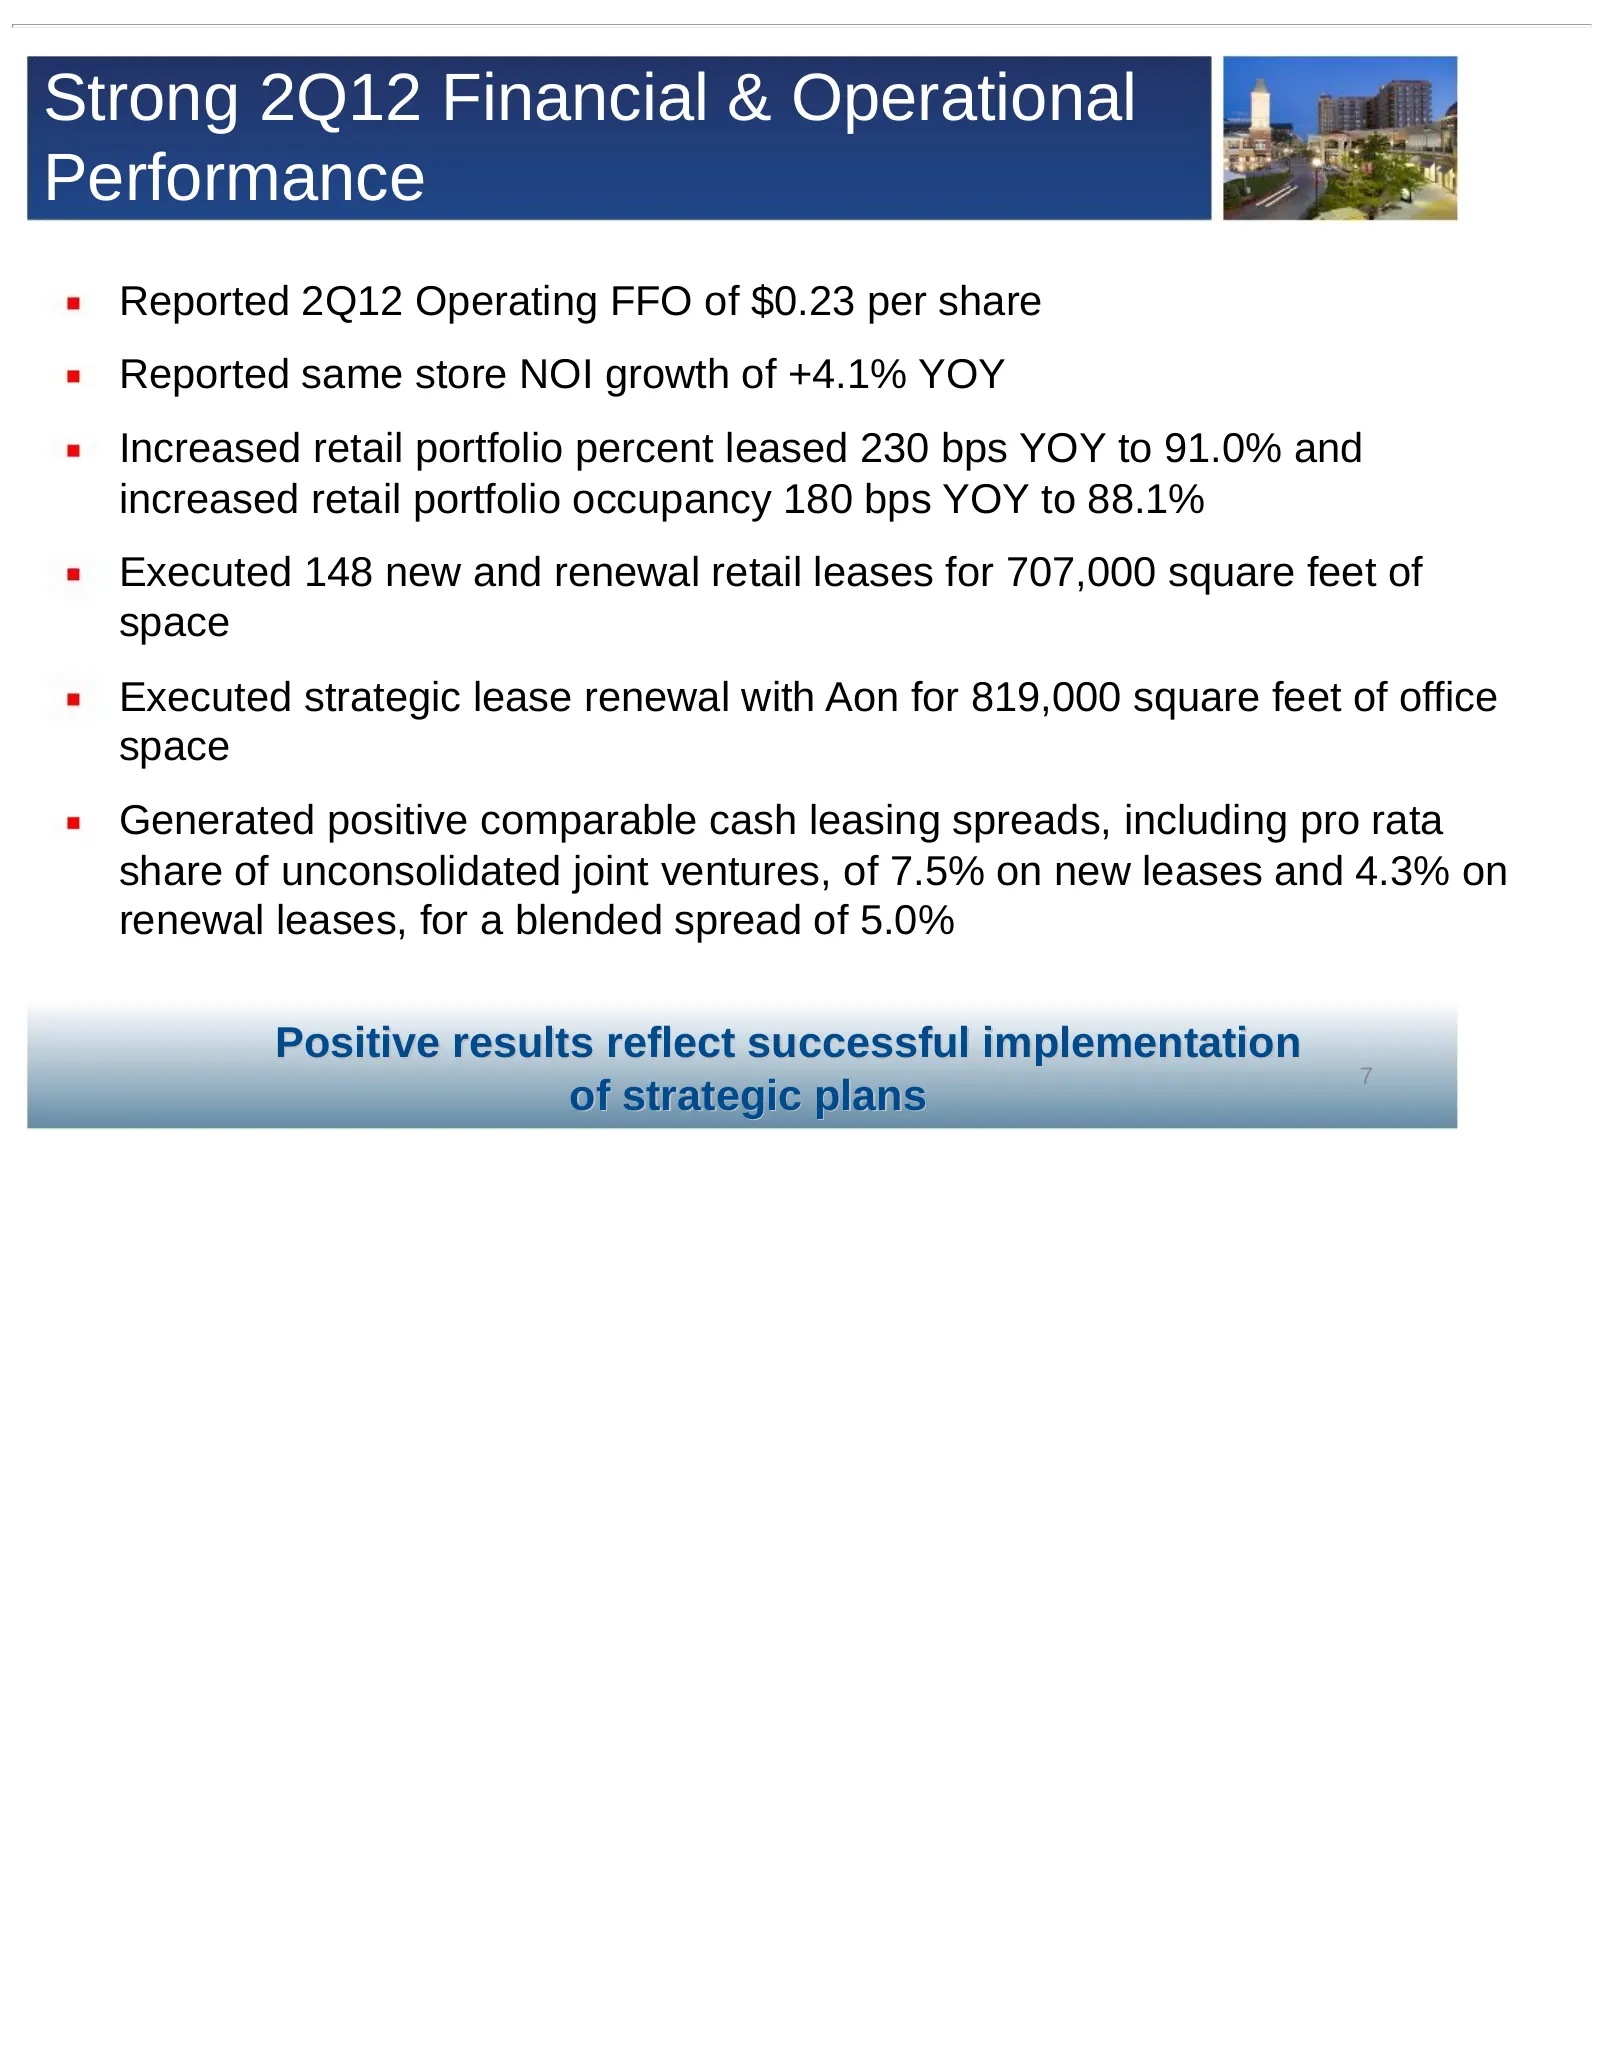
Strong 2Q12 Financial & Operational Performance Reported 2Q12 Operating FFO of $0.23 per share Reported same store NOI growth of +4.1% YOY Increased retail portfolio percent leased 230 bps YOY to 91.0% and increased retail portfolio occupancy 180 bps YOY to 88.1% Executed 148 new and renewal retail
Slide 8: Strengthening Balance Sheet
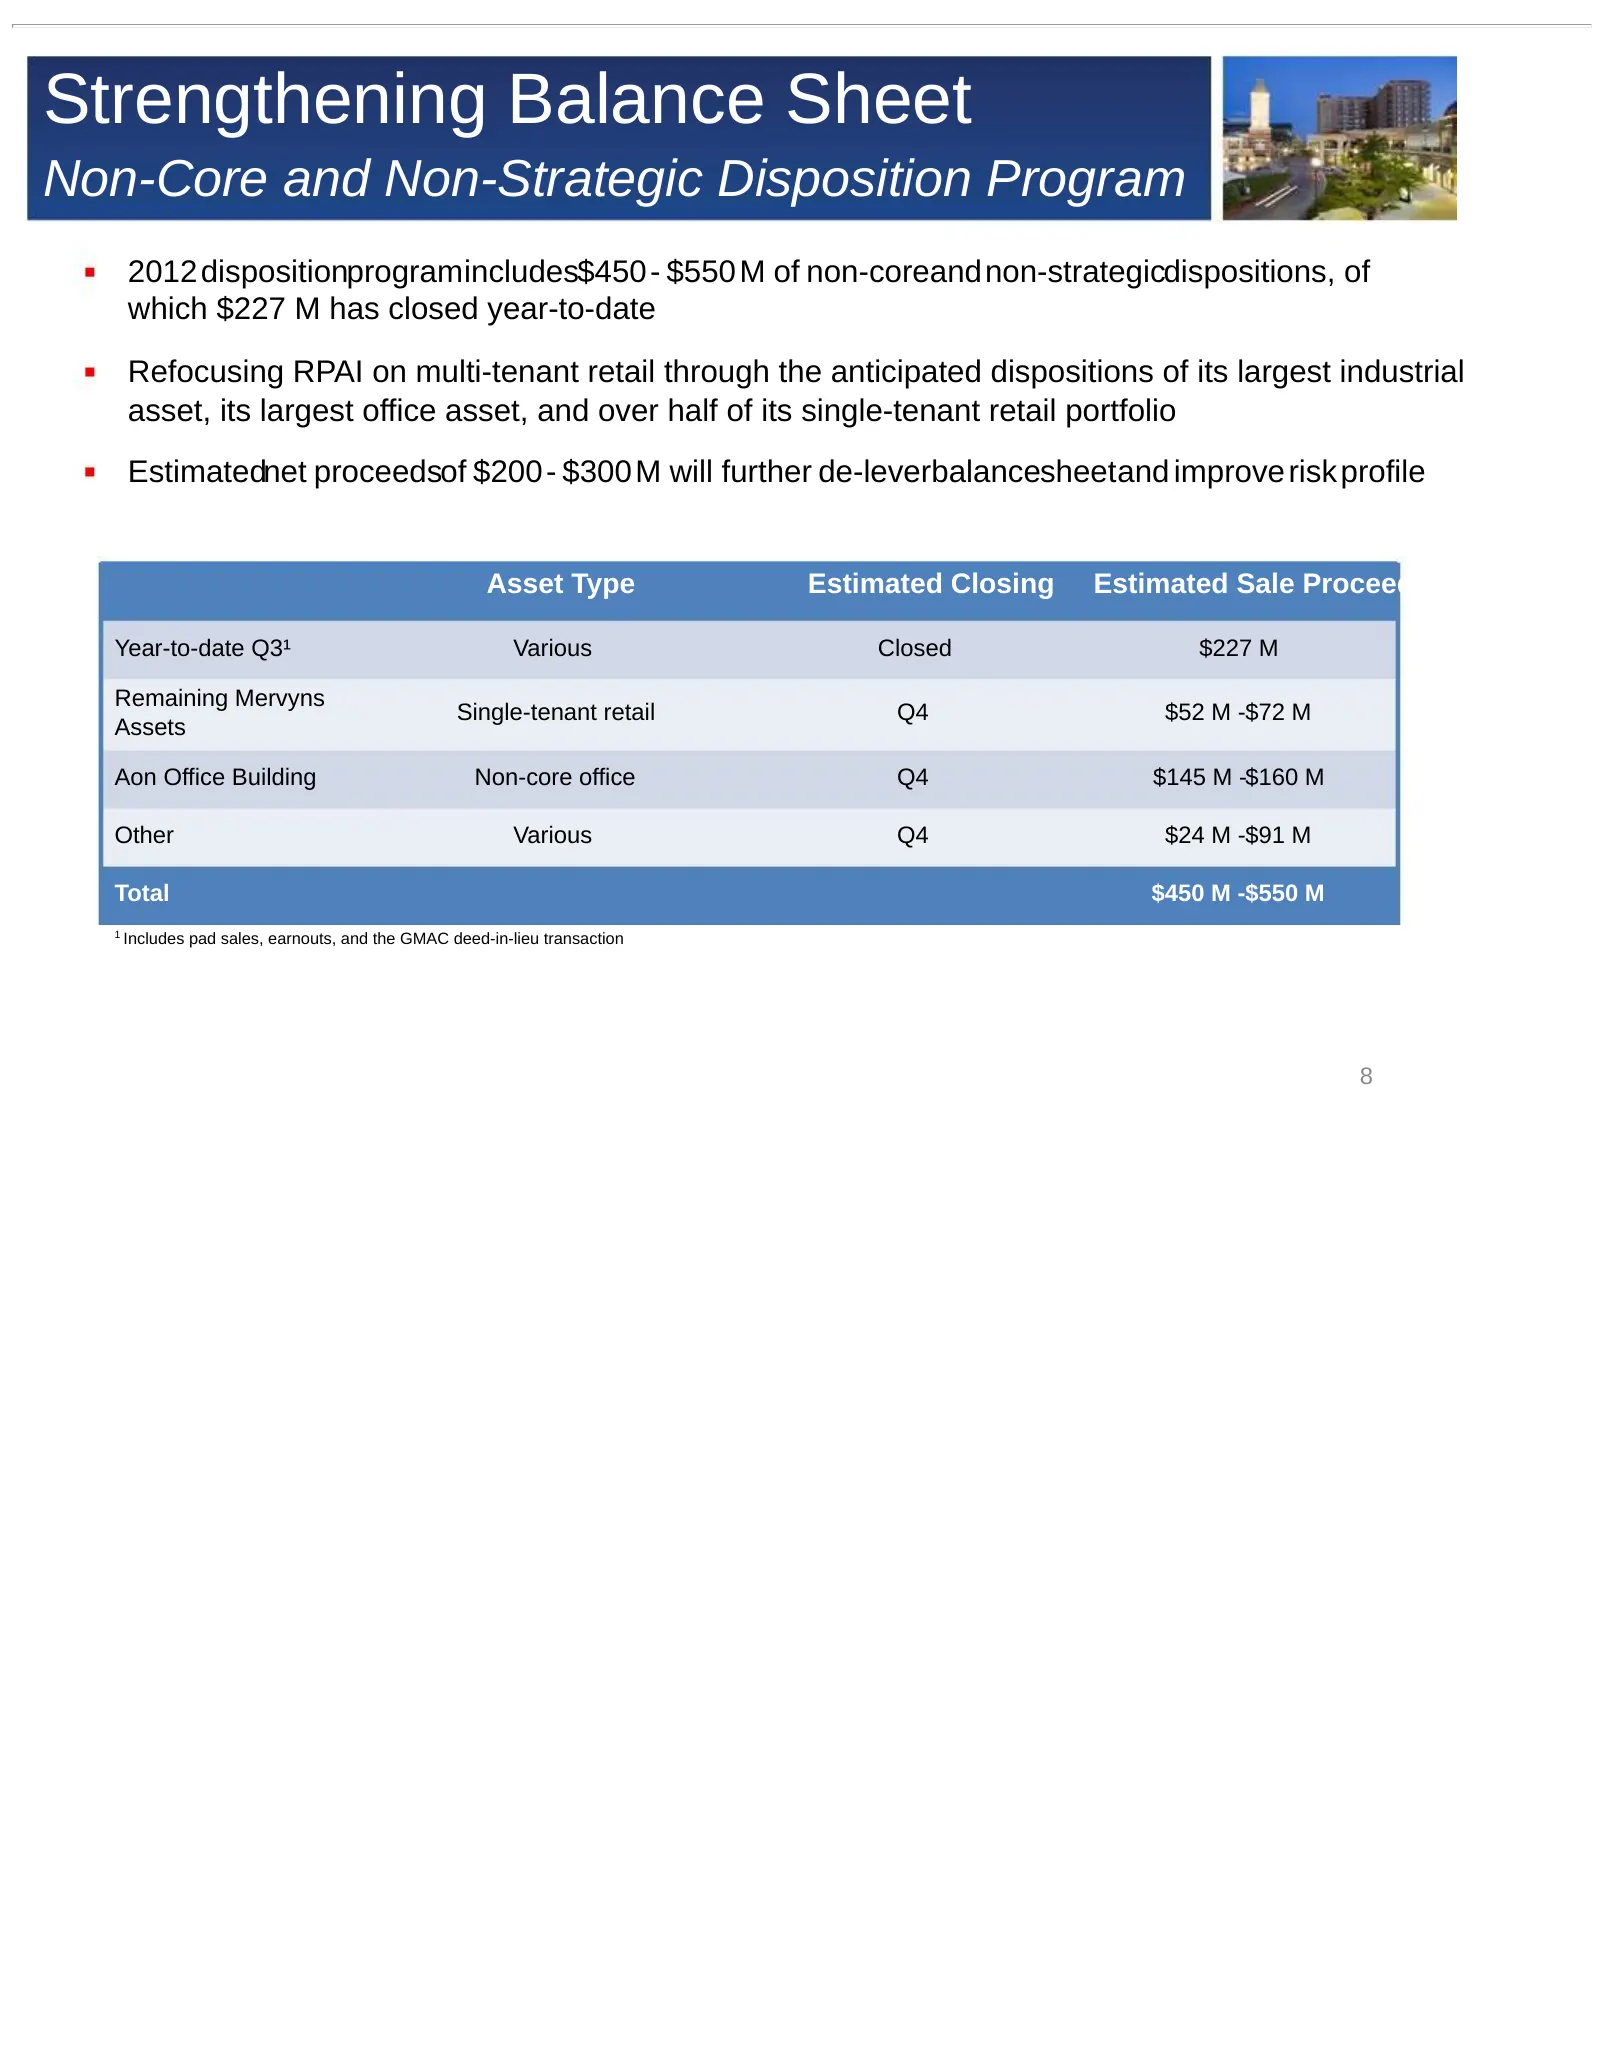
Strengthening Balance Sheet Non-Core and Non-Strategic Disposition Program 2012 dispositionprogramincludes$450 - $550 M of non-coreandnon-strategicdispositions, of which $227 M has closed year-to-date Refocusing RPAI on multi-tenant retail through the anticipated dispositions of its largest industri
Slide 9: Enhancing Portfolio Value
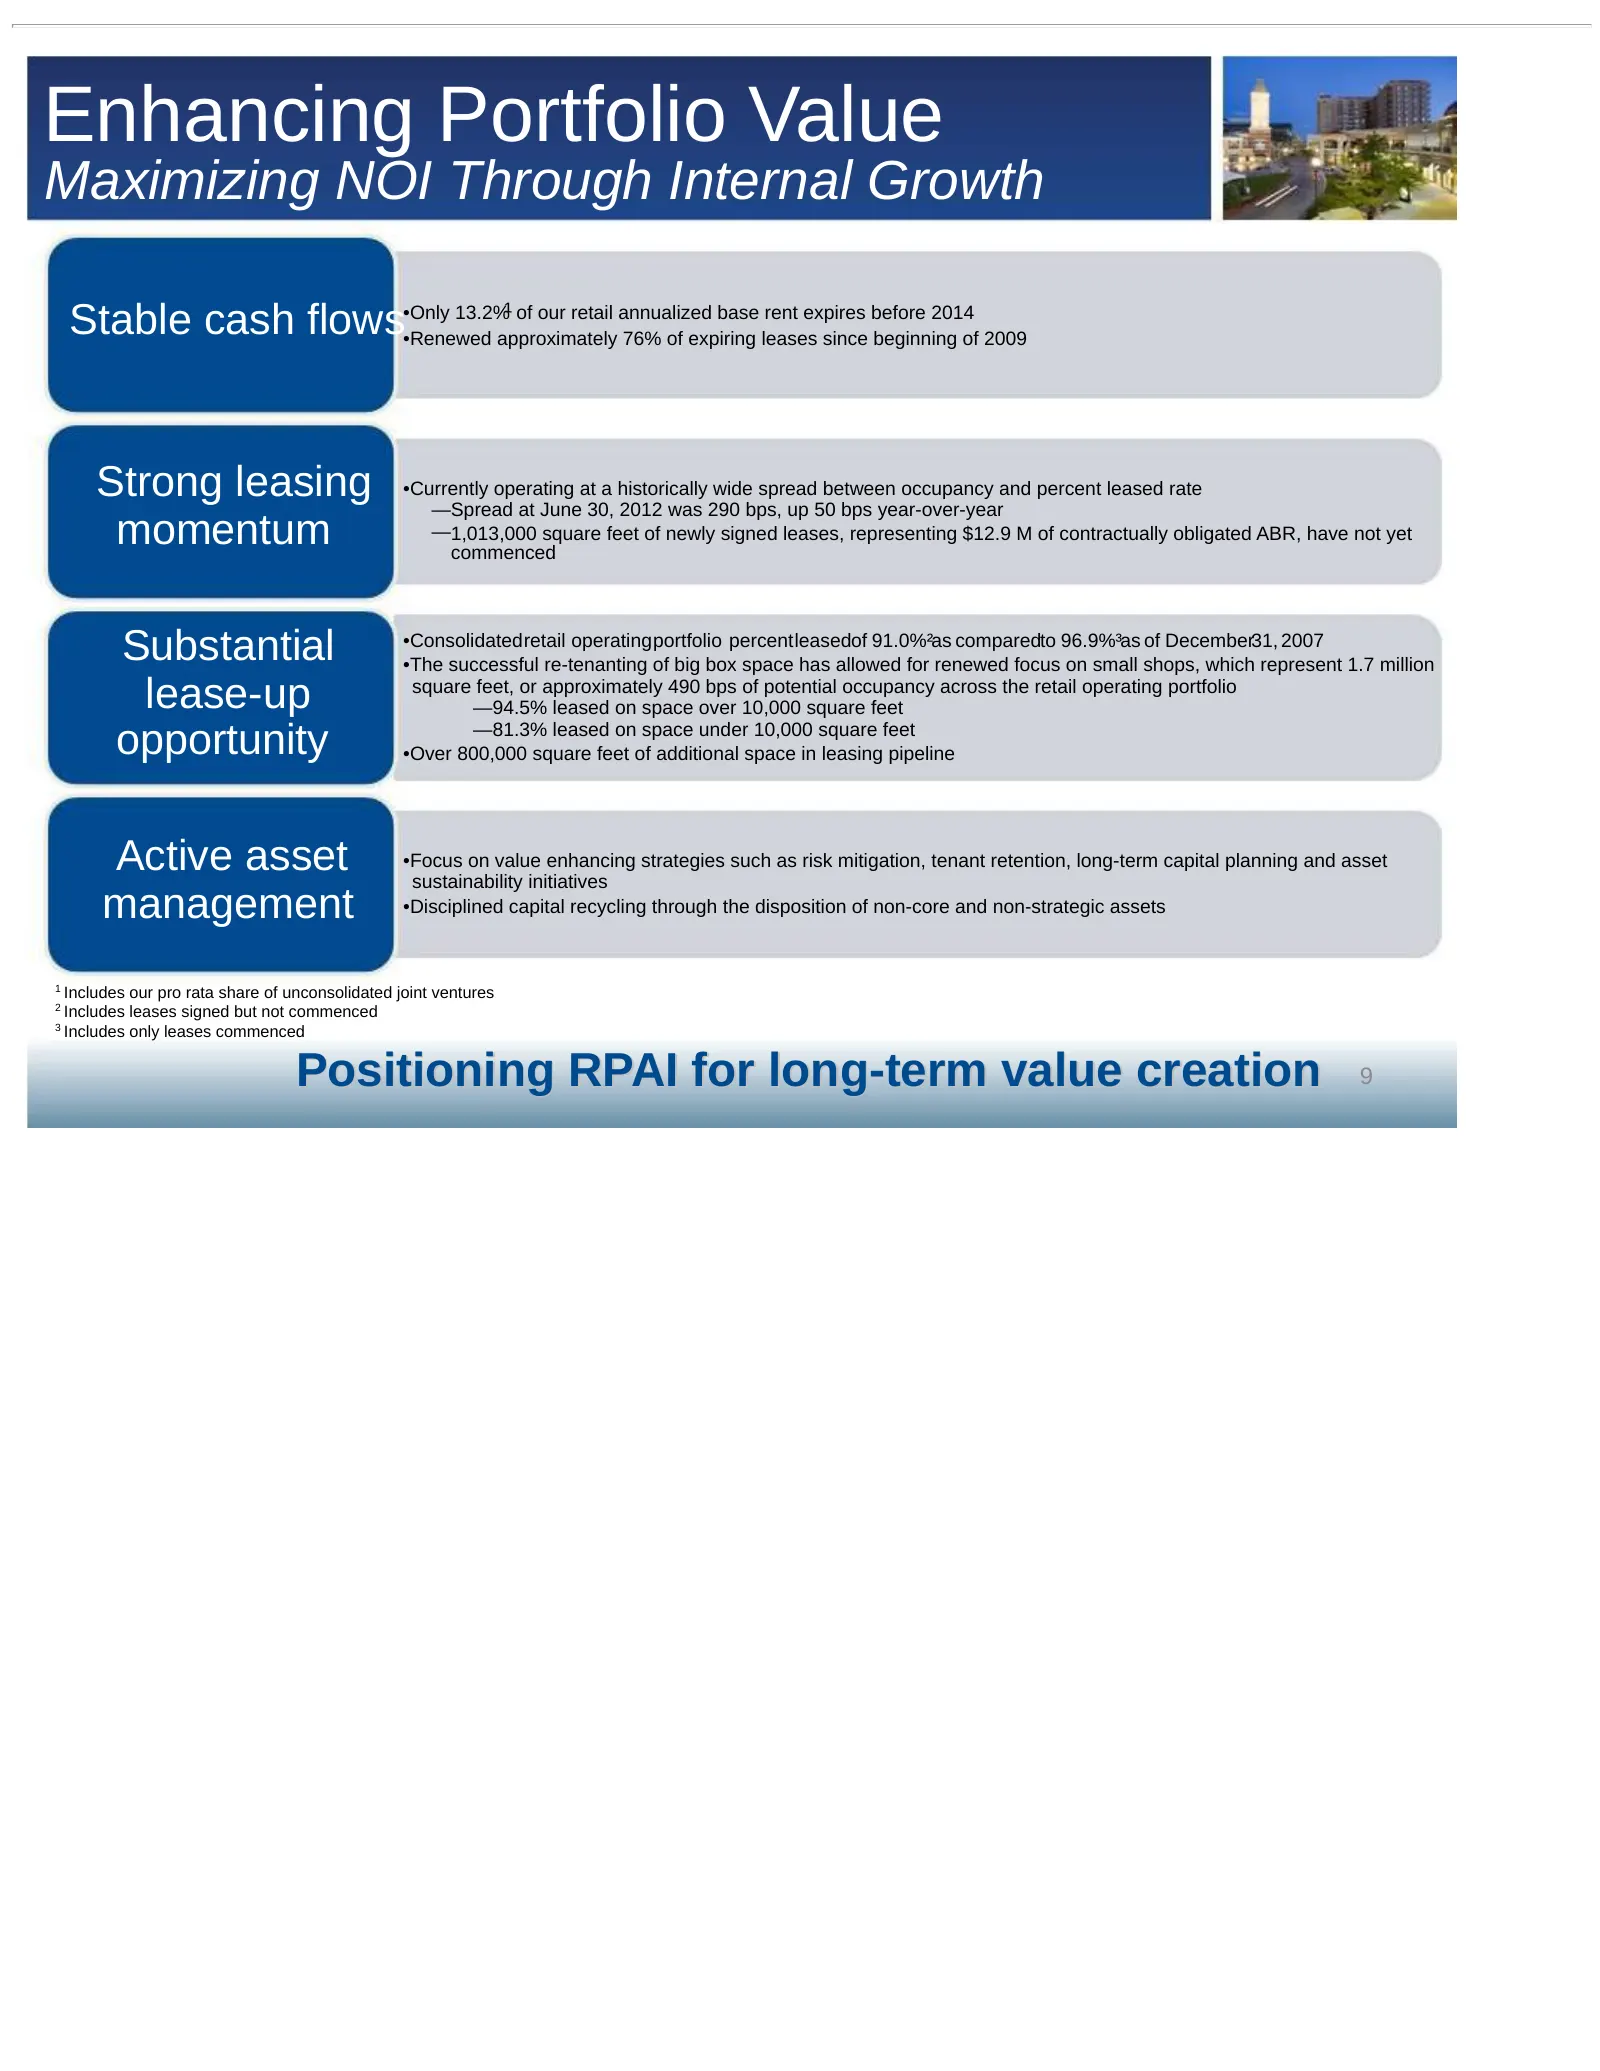
Enhancing Portfolio Value Maximizing NOI Through Internal Growth Stable cash flows•Only 13.2%¹ of our retail annualized base rent expires before 2014 •Renewed approximately 76% of expiring leases since beginning of 2009 Strong leasing •Currently operating at a historically wide spread between occupa
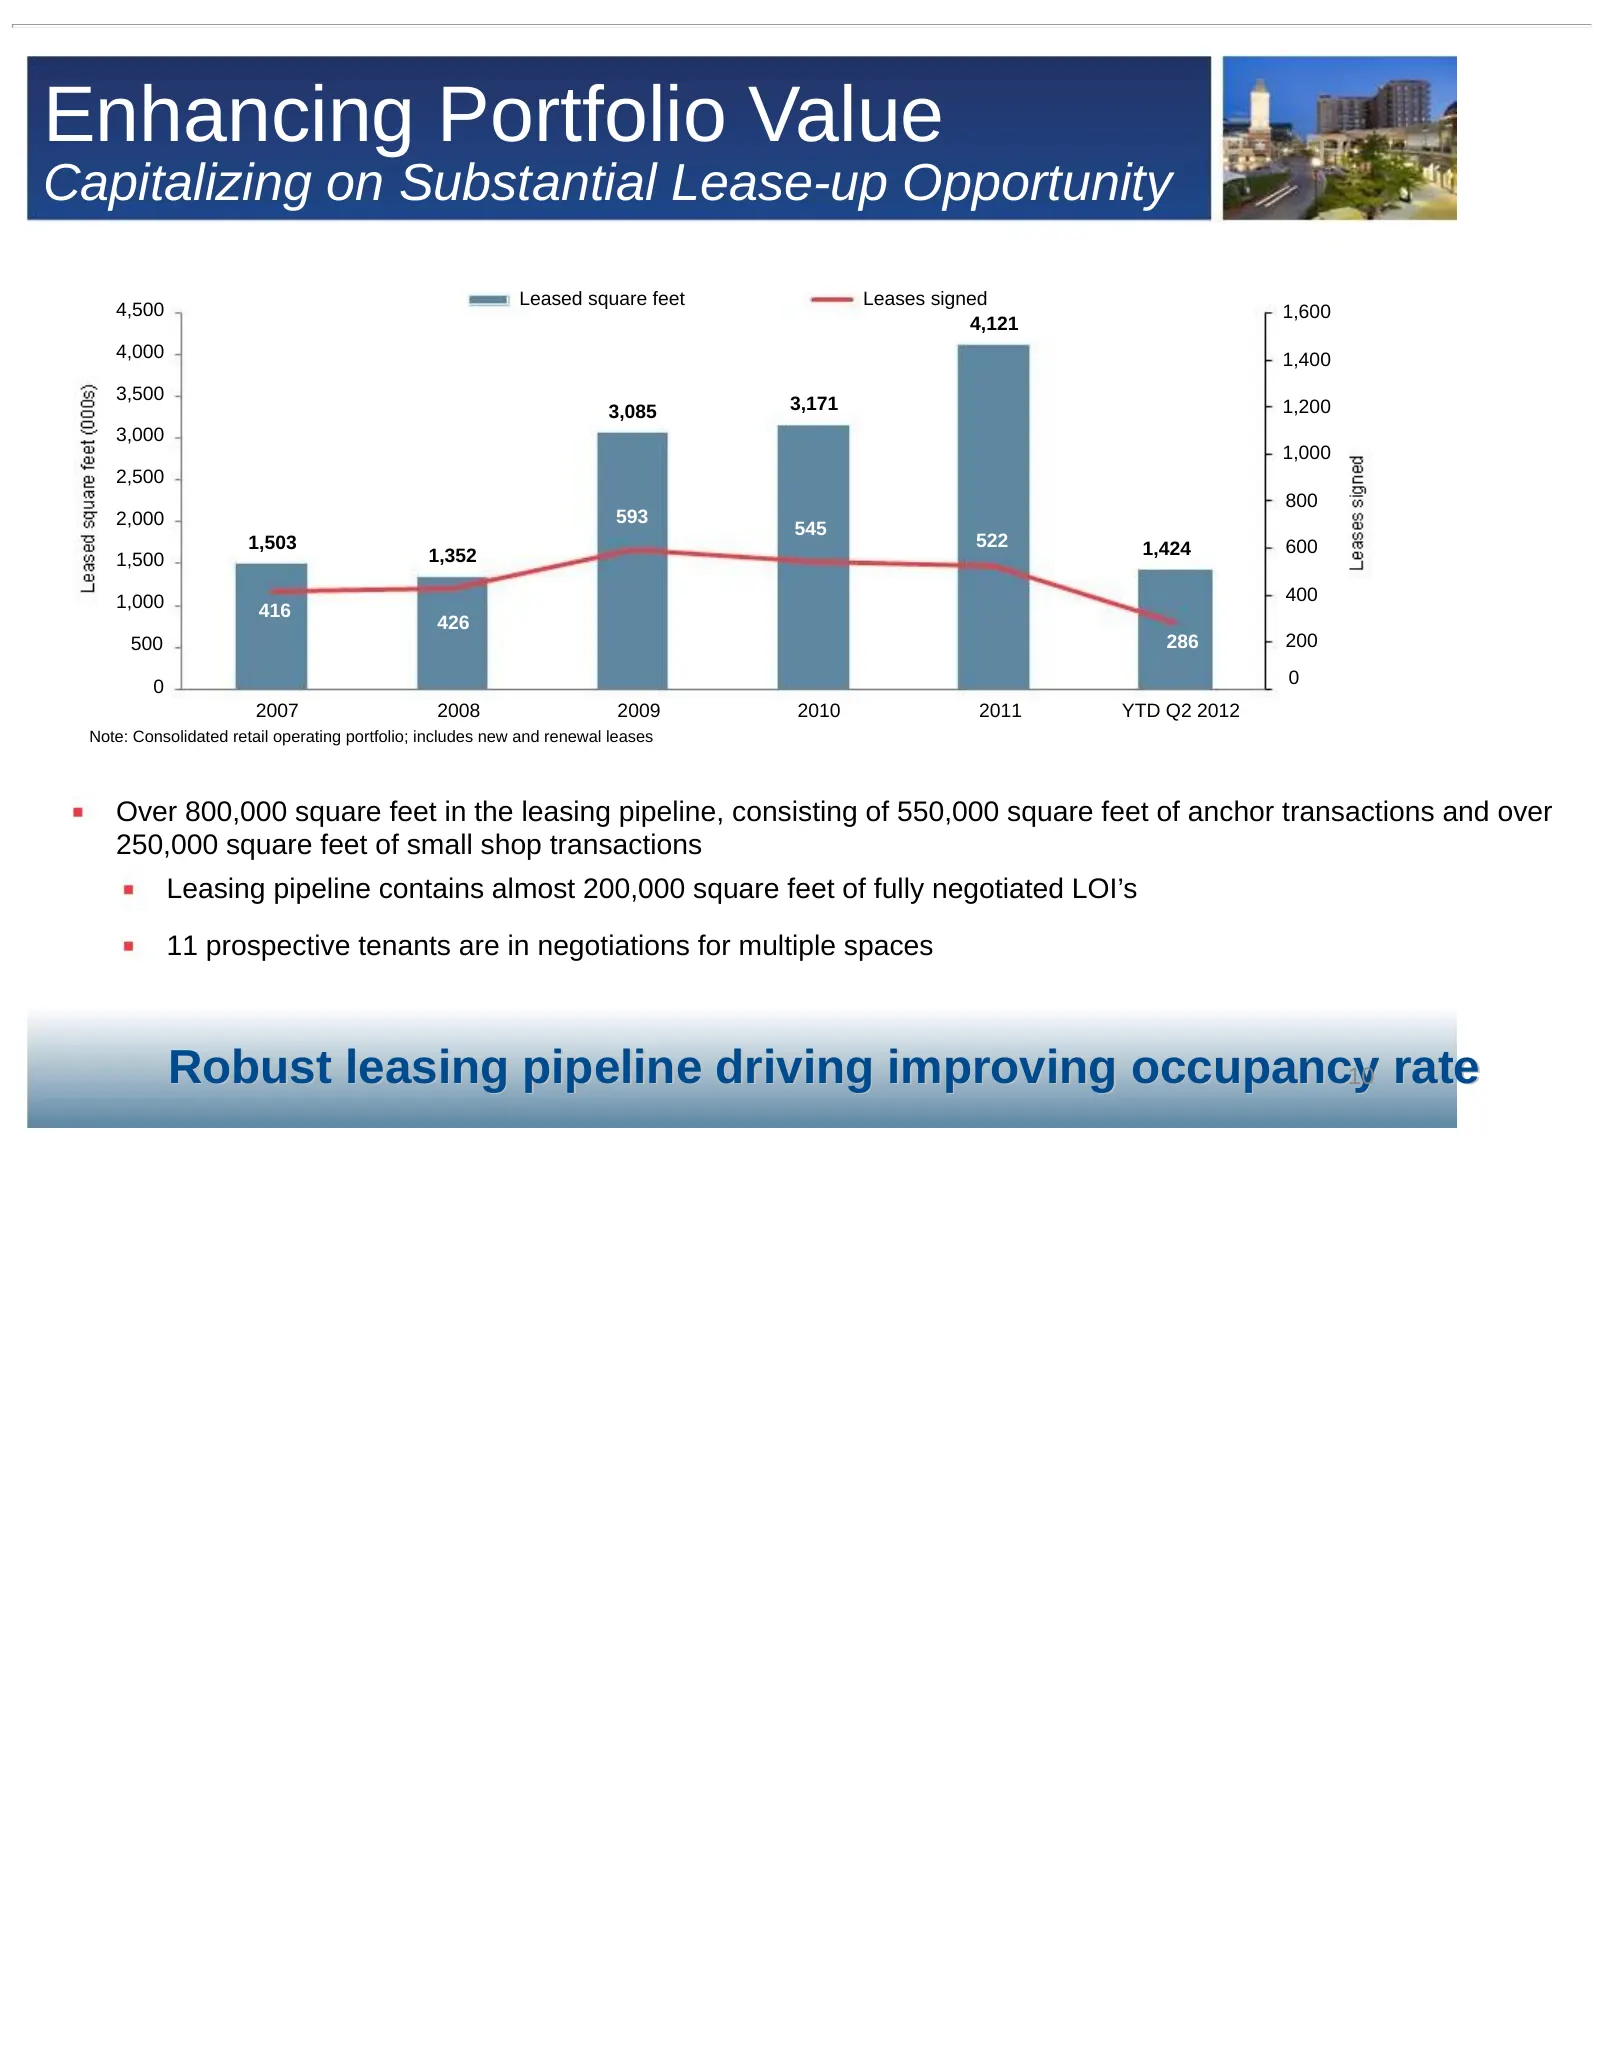
Slide 10: Enhancing Portfolio Value
Enhancing Portfolio Value Capitalizing on Substantial Lease-up Opportunity Leased square feet Leases signed 4,500 1,600 4,121 4,000 1,400 3,500 3,085 3,171 1,200 3,000 1,000 2,500 800 2,000 593 545 1,503 522 1,424 600 1,500 1,352 1,000 400 416 426 500 286 200 0 0 2007 2008 2009 2010 2011 YTD Q2 2012
Slide 11: Streamlining Operating Platform
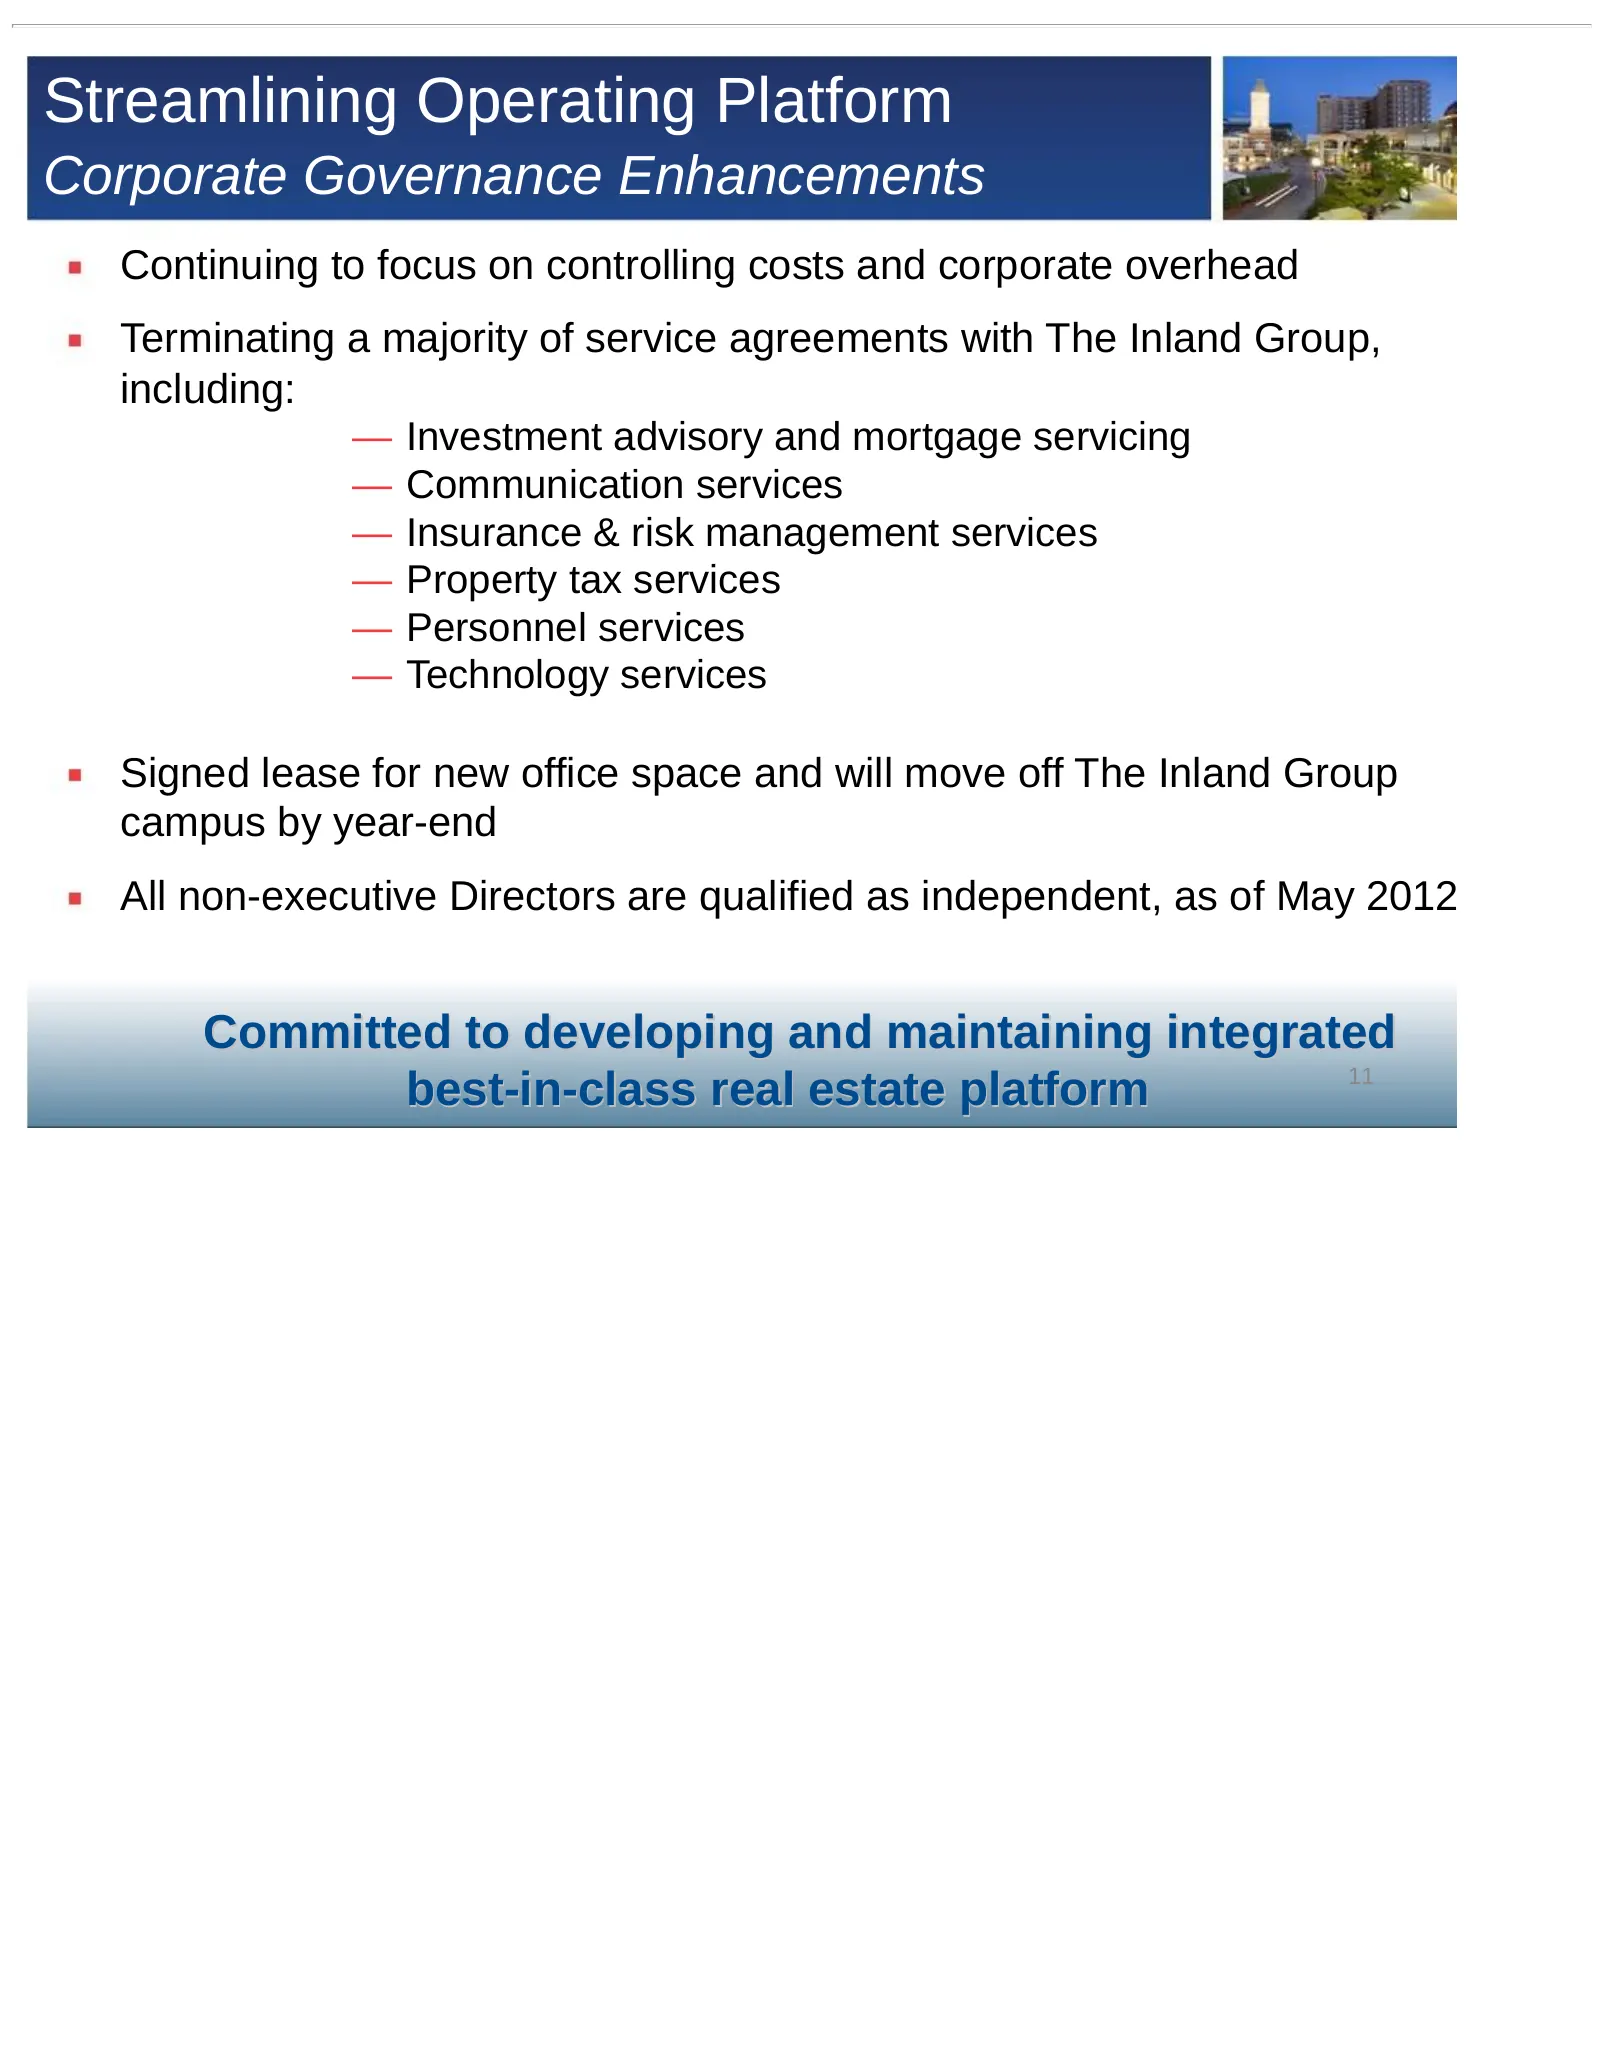
Streamlining Operating Platform Corporate Governance Enhancements Continuing to focus on controlling costs and corporate overhead Terminating a majority of service agreements with The Inland Group, including: — Investment advisory and mortgage servicing — Communication services — Insurance & risk ma

Slide 12: Company Overview
ra RPAI Retail Properties of America, Inc = Company Overview 12
Slide 13: RPAI at a Glance
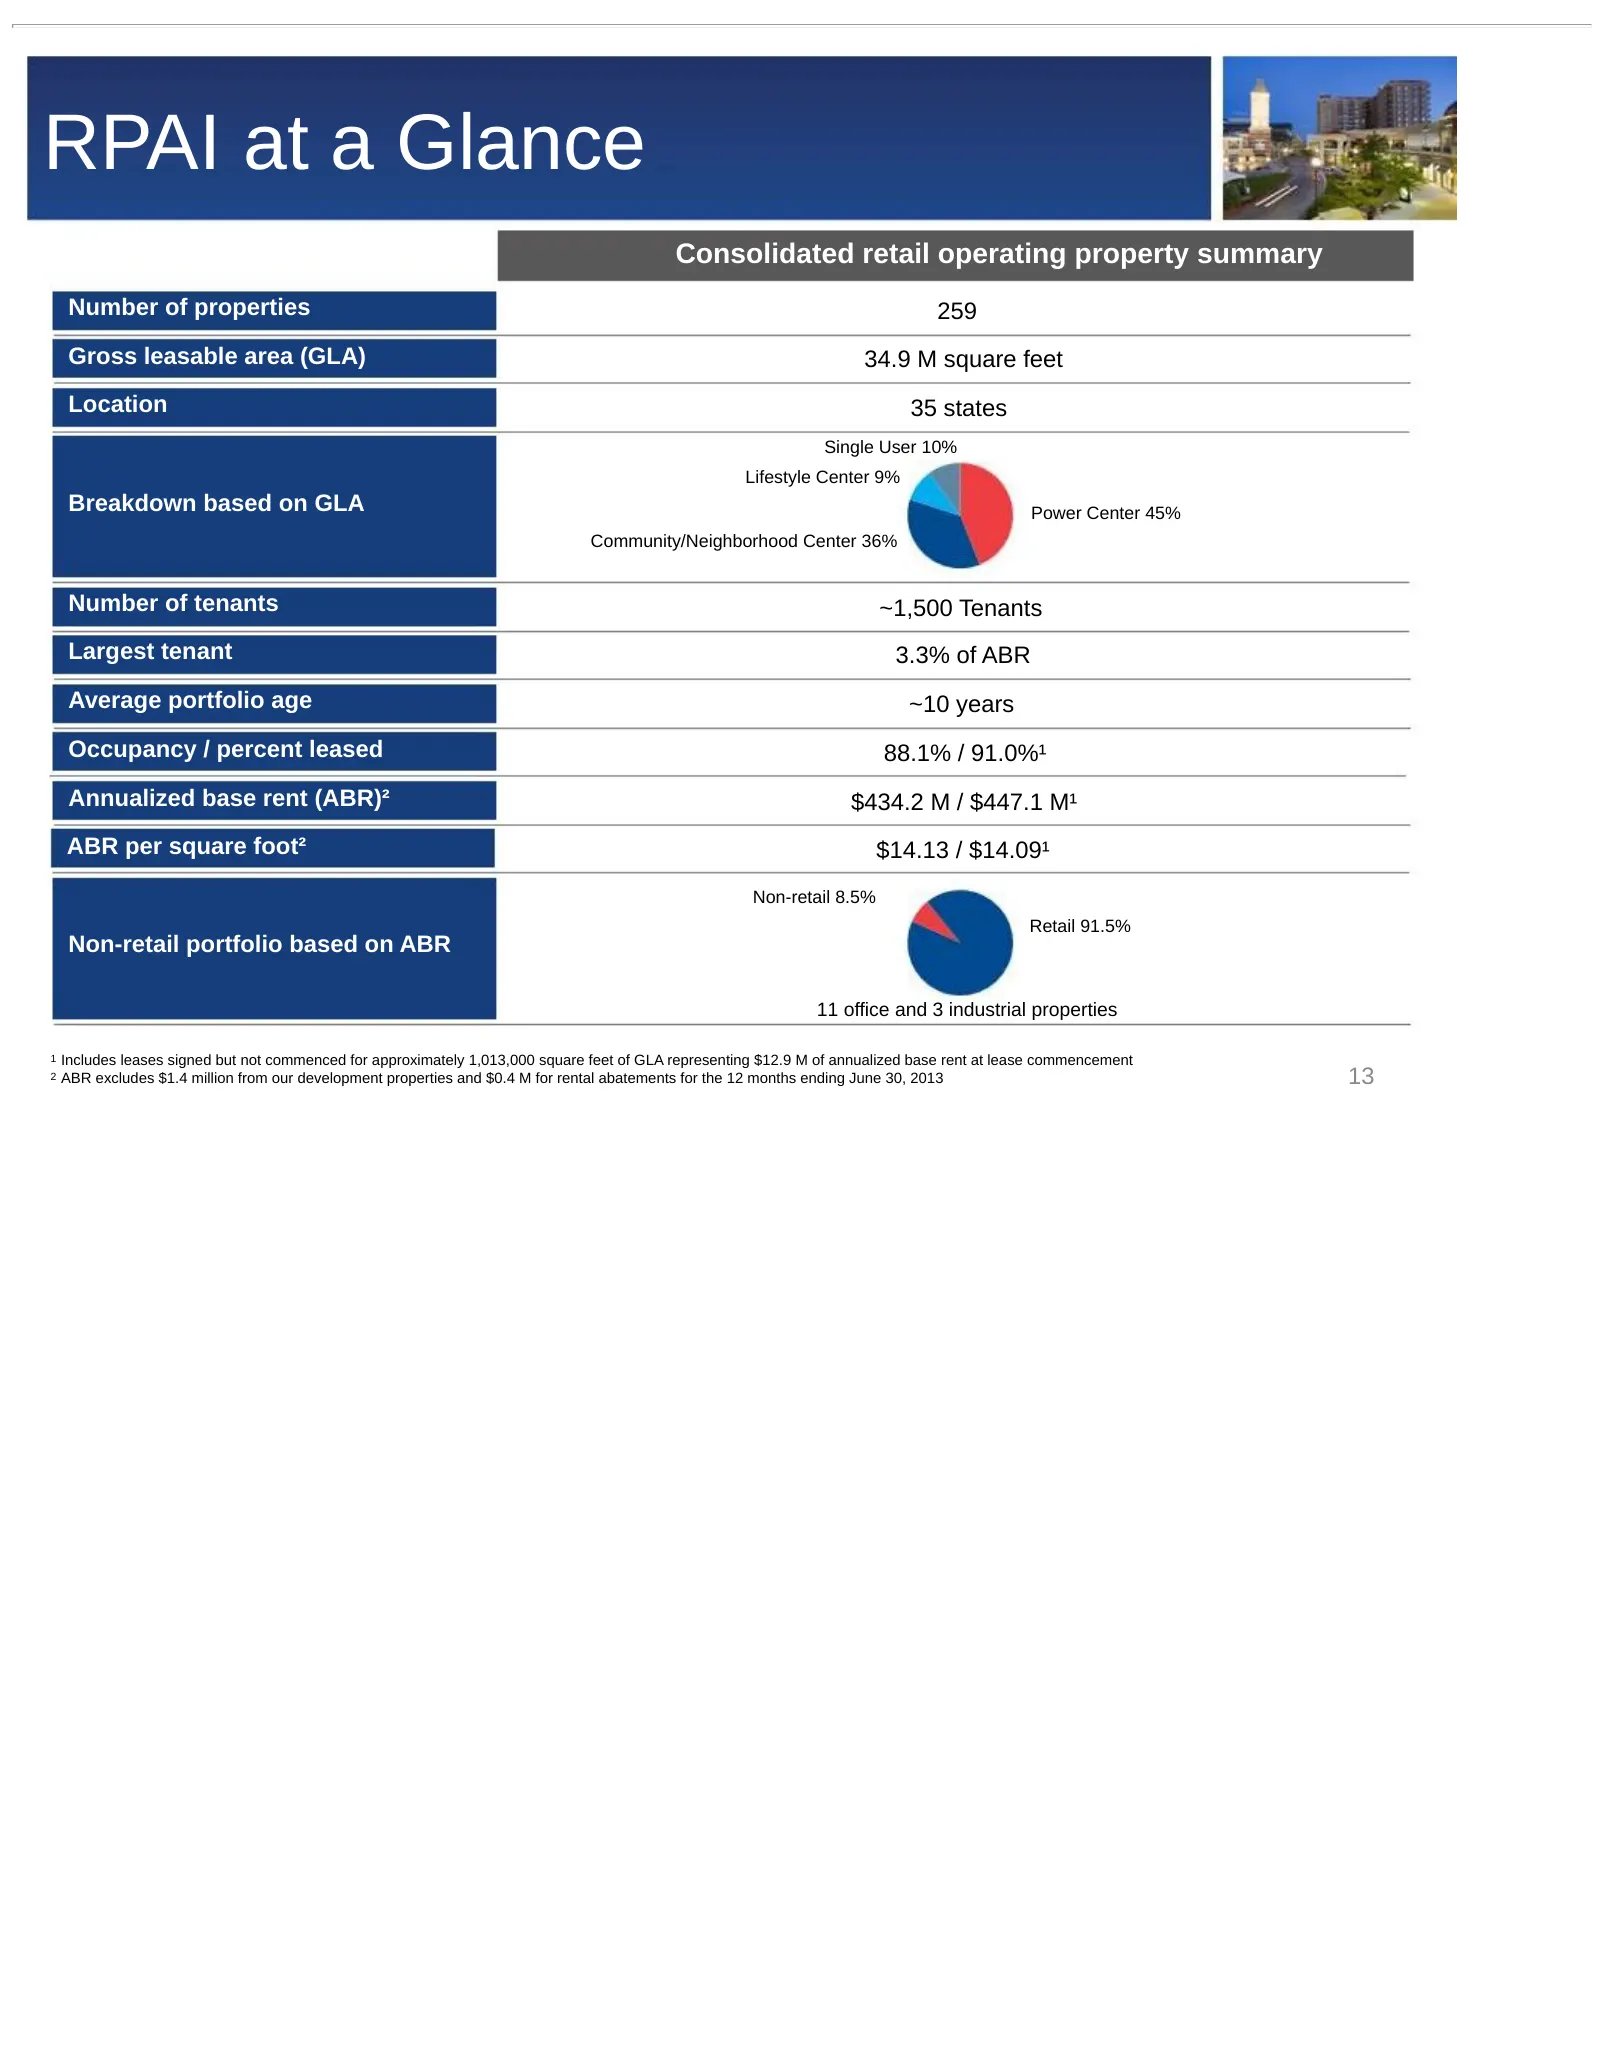
RPAI at a Glance Consolidated retail operating property summary Number of properties 259 Gross leasable area (GLA) 34.9 M square feet Location 35 states Single User 10% Lifestyle Center 9% Breakdown based on GLA Power Center 45% Community/Neighborhood Center 36% Number of tenants ~1,500 Tenants Larg
Slide 14: Large Diversified Retail Portfolio
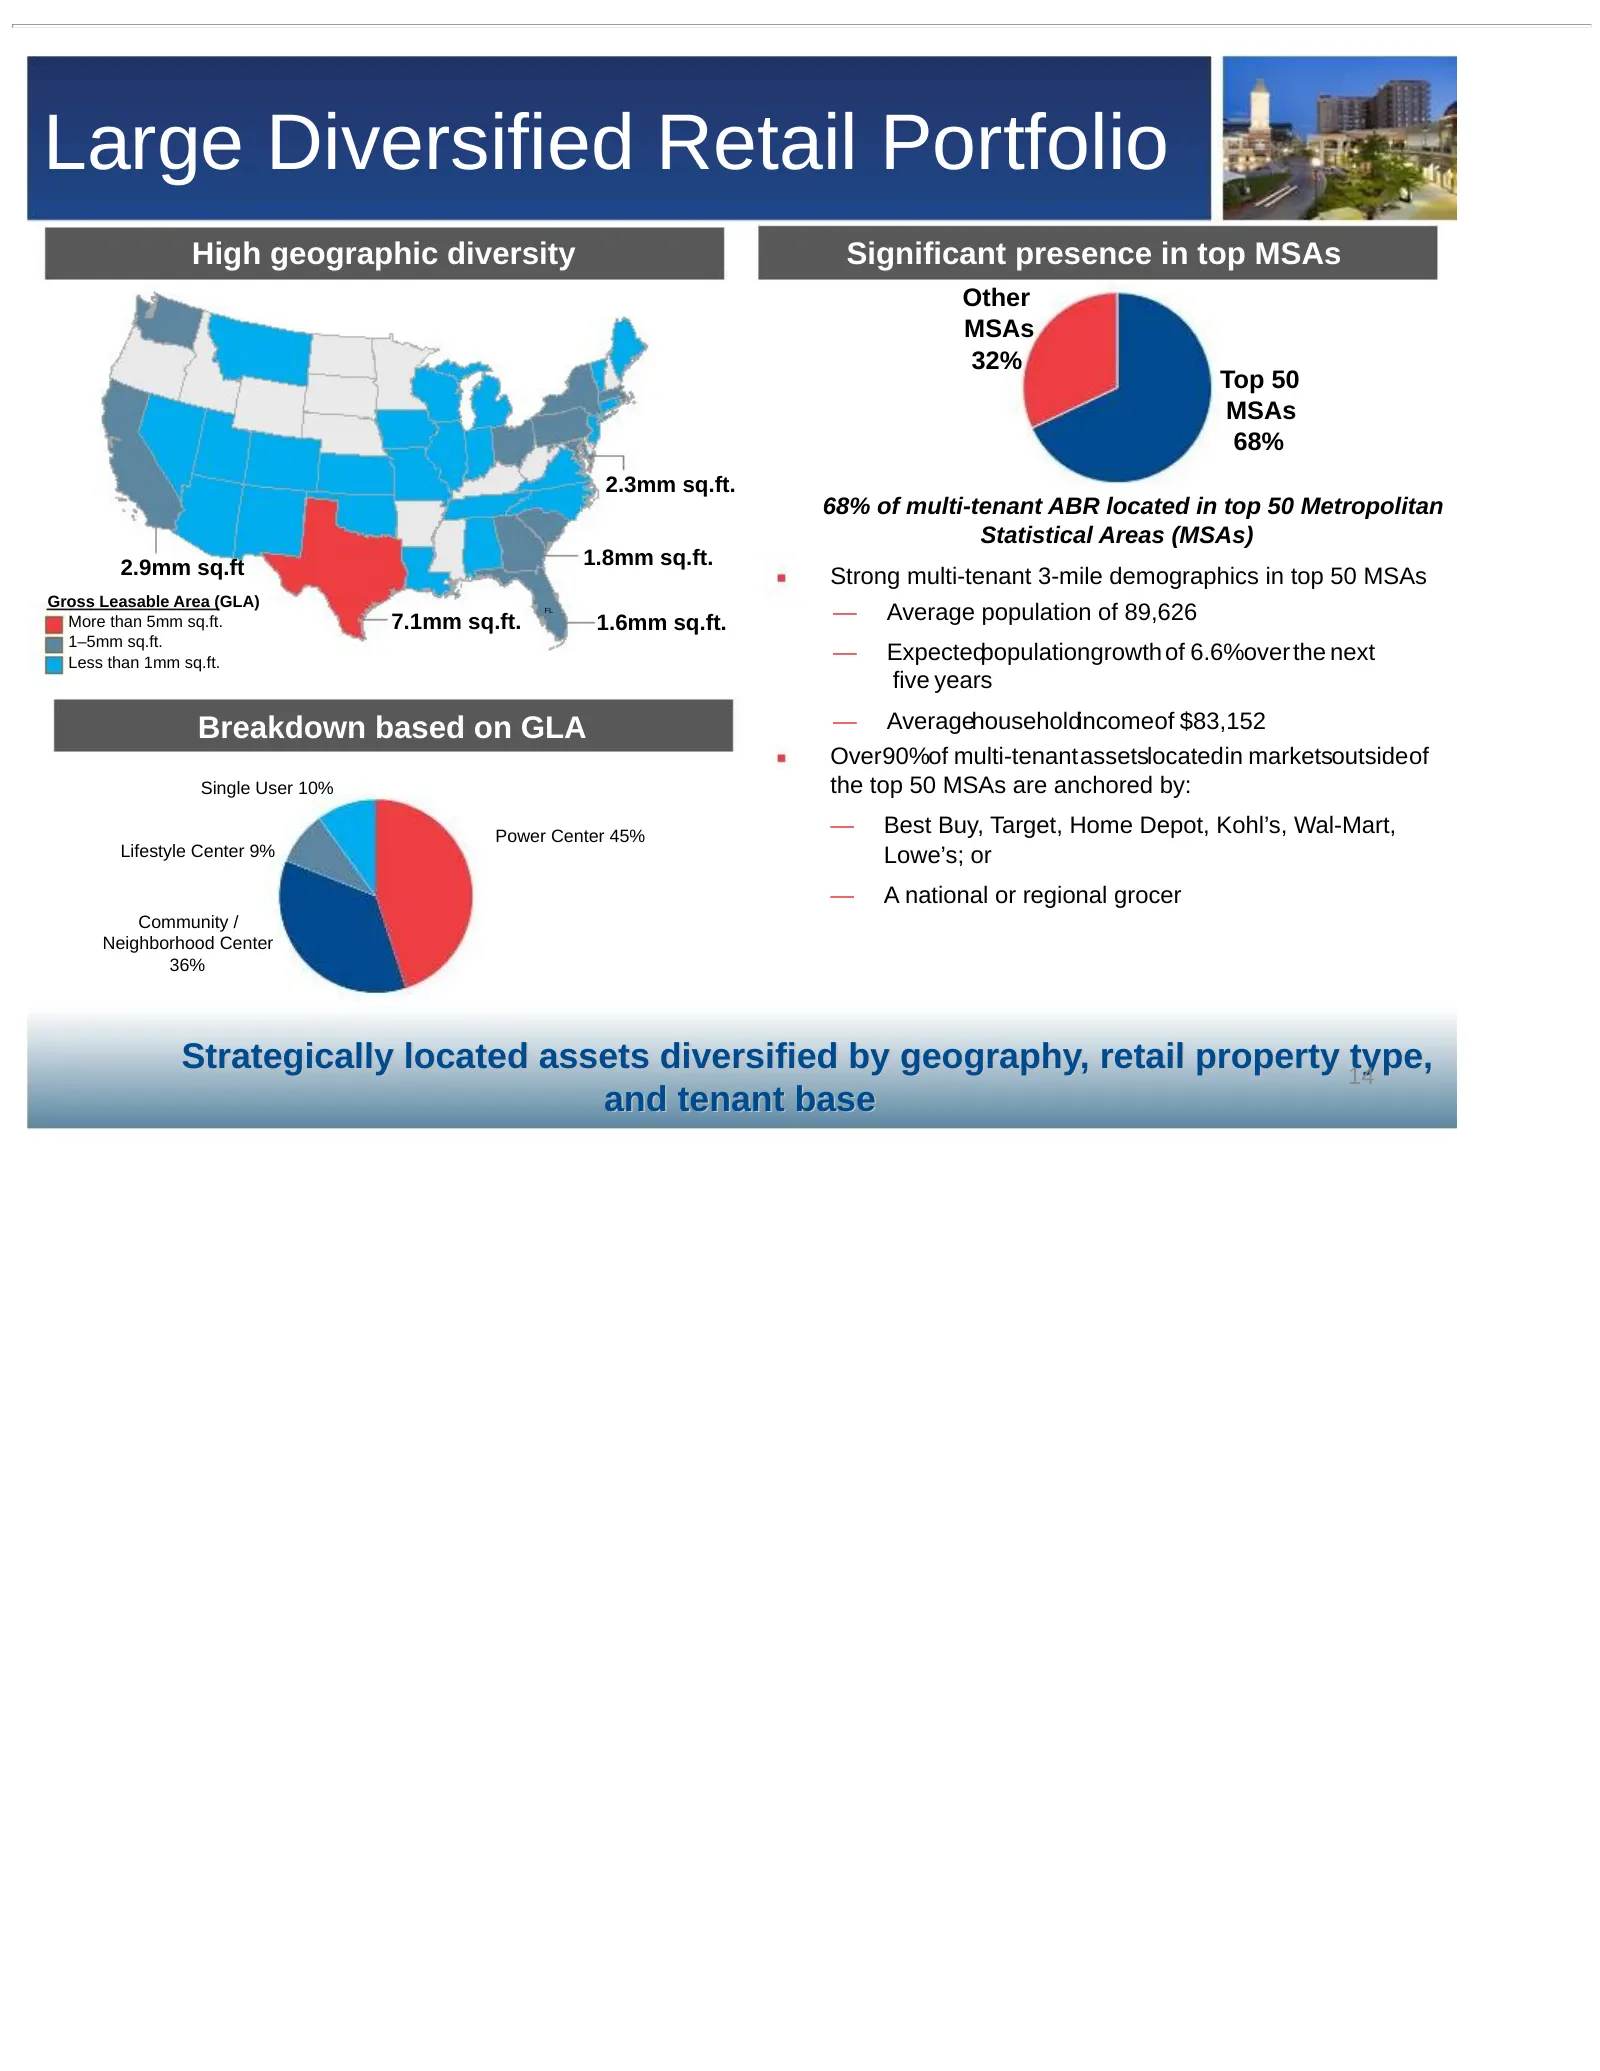
Large Diversified Retail Portfolio High geographic diversity Significant presence in top MSAs Other MSAs 32% Top 50 MSAs 68% 2.3mm sq.ft. 68% of multi-tenant ABR located in top 50 Metropolitan Statistical Areas (MSAs) 2.9mm sq.ft 1.8mm sq.ft. Strong multi-tenant 3-mile demographics in top 50 MSAs Gr
Slide 15: Representative Properties
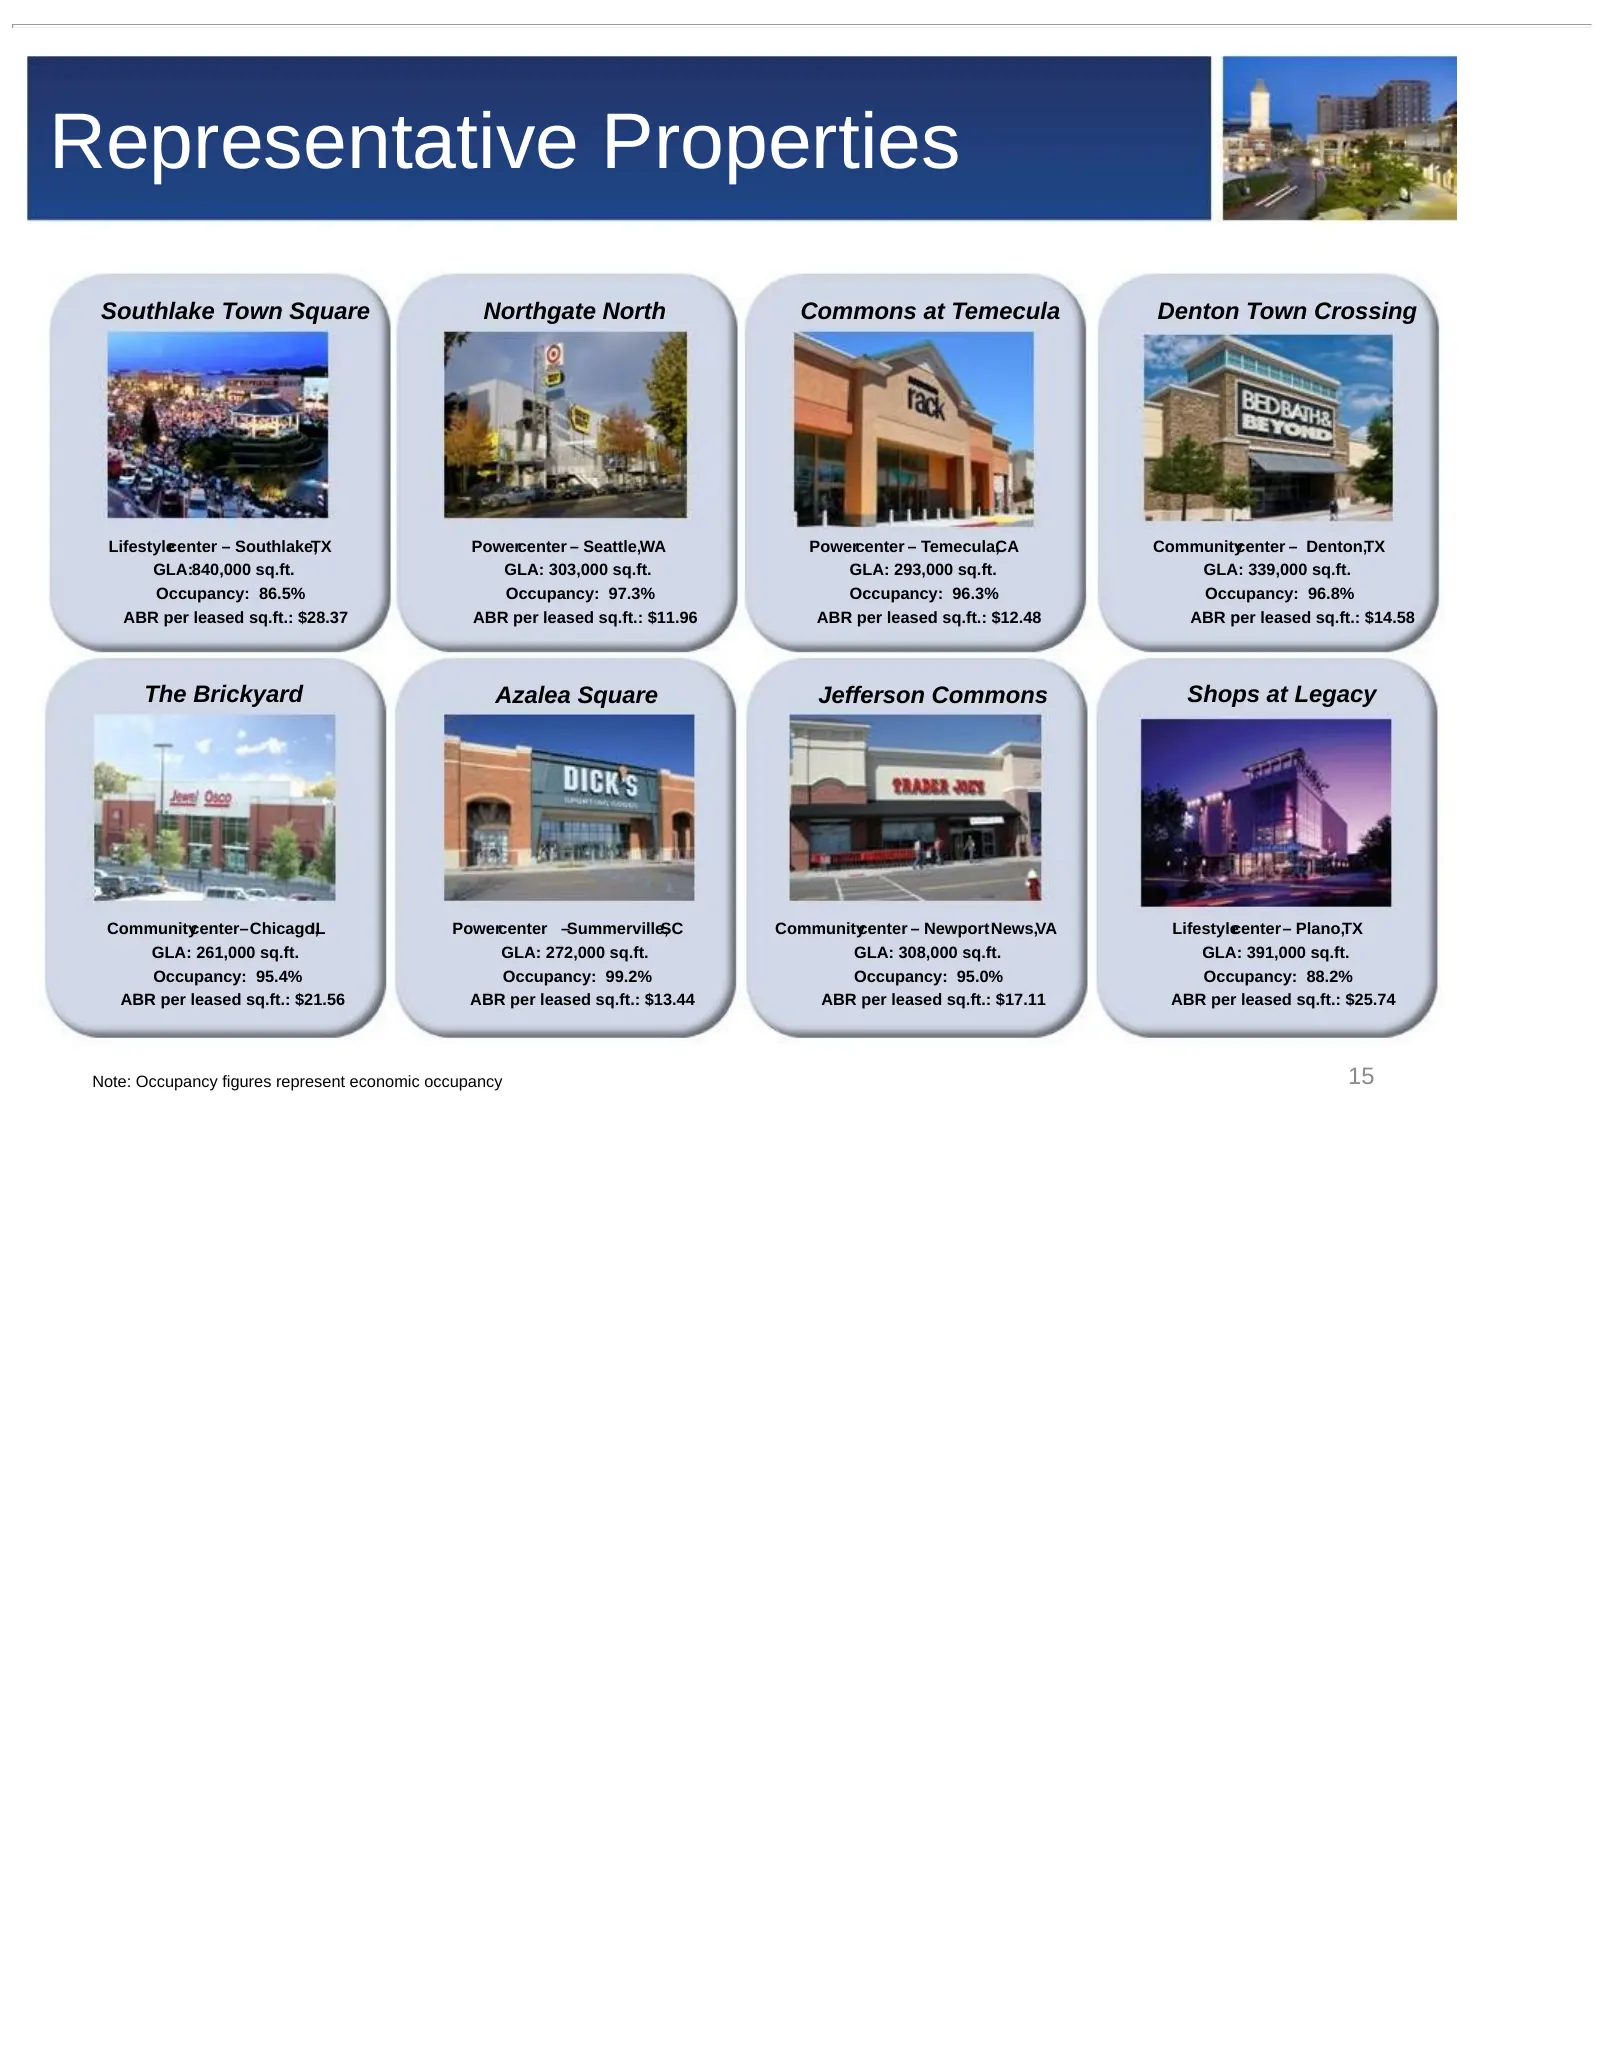
Representative Properties Southlake Town Square Northgate North Commons at Temecula Denton Town Crossing Lifestylecenter – Southlake,TX Powercenter – Seattle,WA Powercenter – Temecula,CA Communitycenter – Denton,TX GLA:840,000 sq.ft. GLA: 303,000 sq.ft. GLA: 293,000 sq.ft. GLA: 339,000 sq.ft. Occupa
Slide 16: National Platform with Local Focus
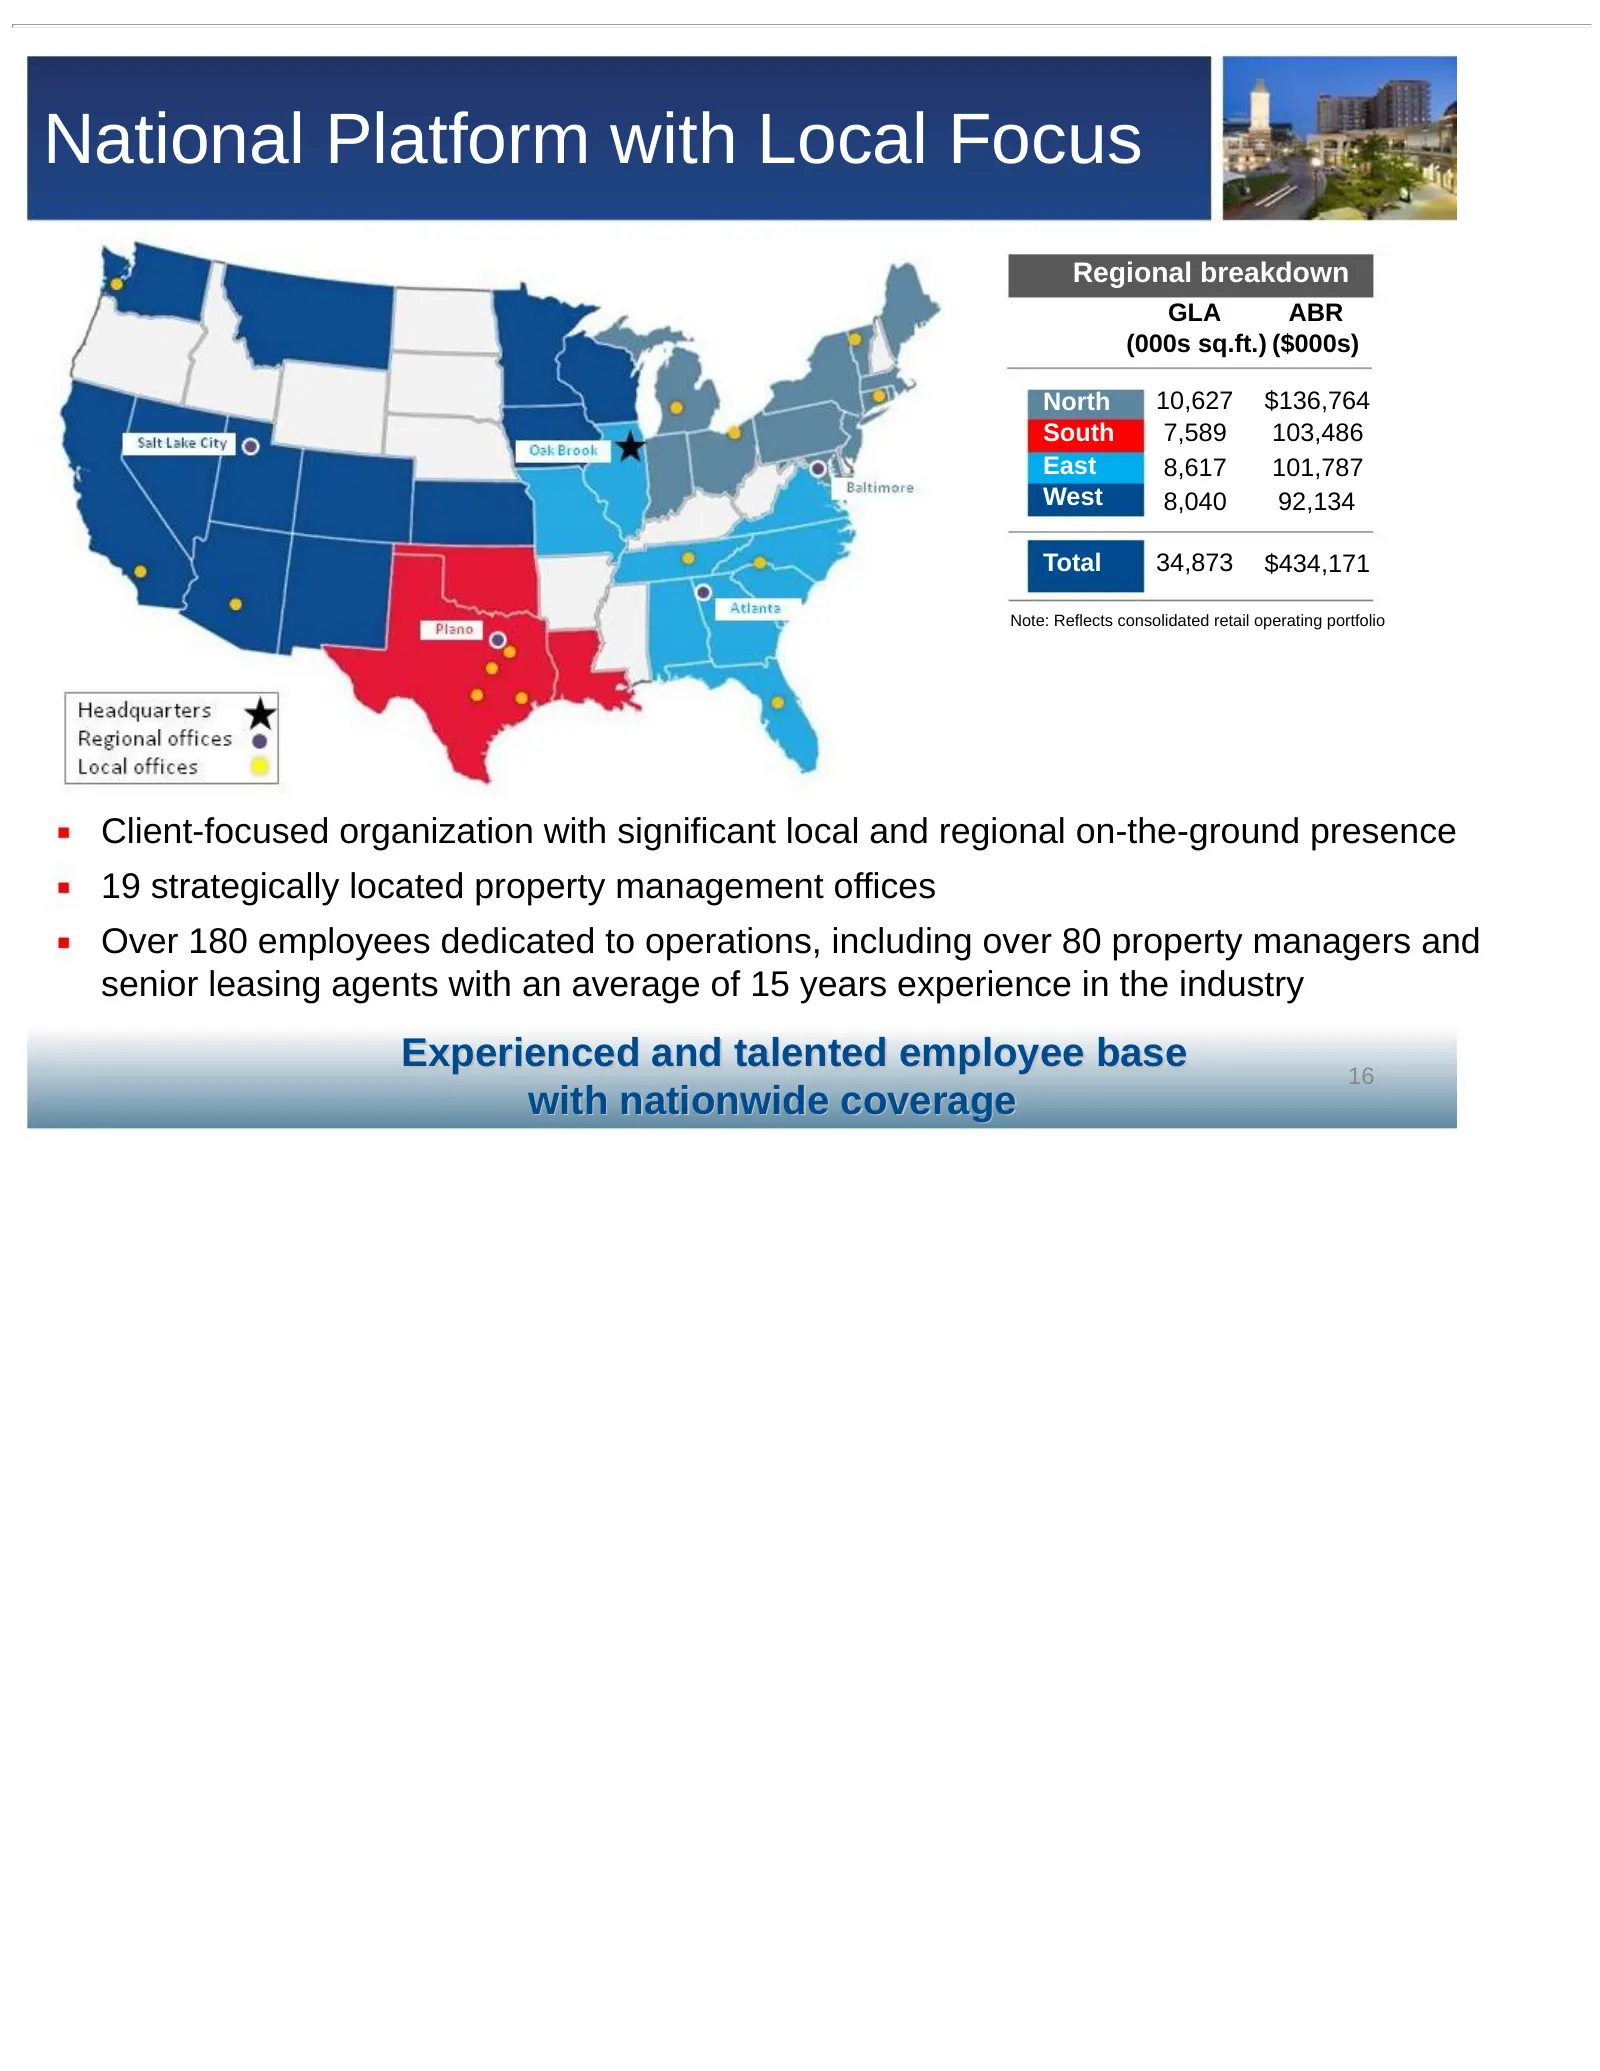
National Platform with Local Focus Regional breakdown GLA ABR (000s sq.ft.) ($000s) North 10,627 $136,764 South 7,589 103,486 East 8,617 101,787 West 8,040 92,134 Total 34,873 $434,171 Note: Reflects consolidated retail operating portfolio Client-focused organization with significant local and regio
Slide 17: Diversified Base of Value-Oriented Retail Tenants
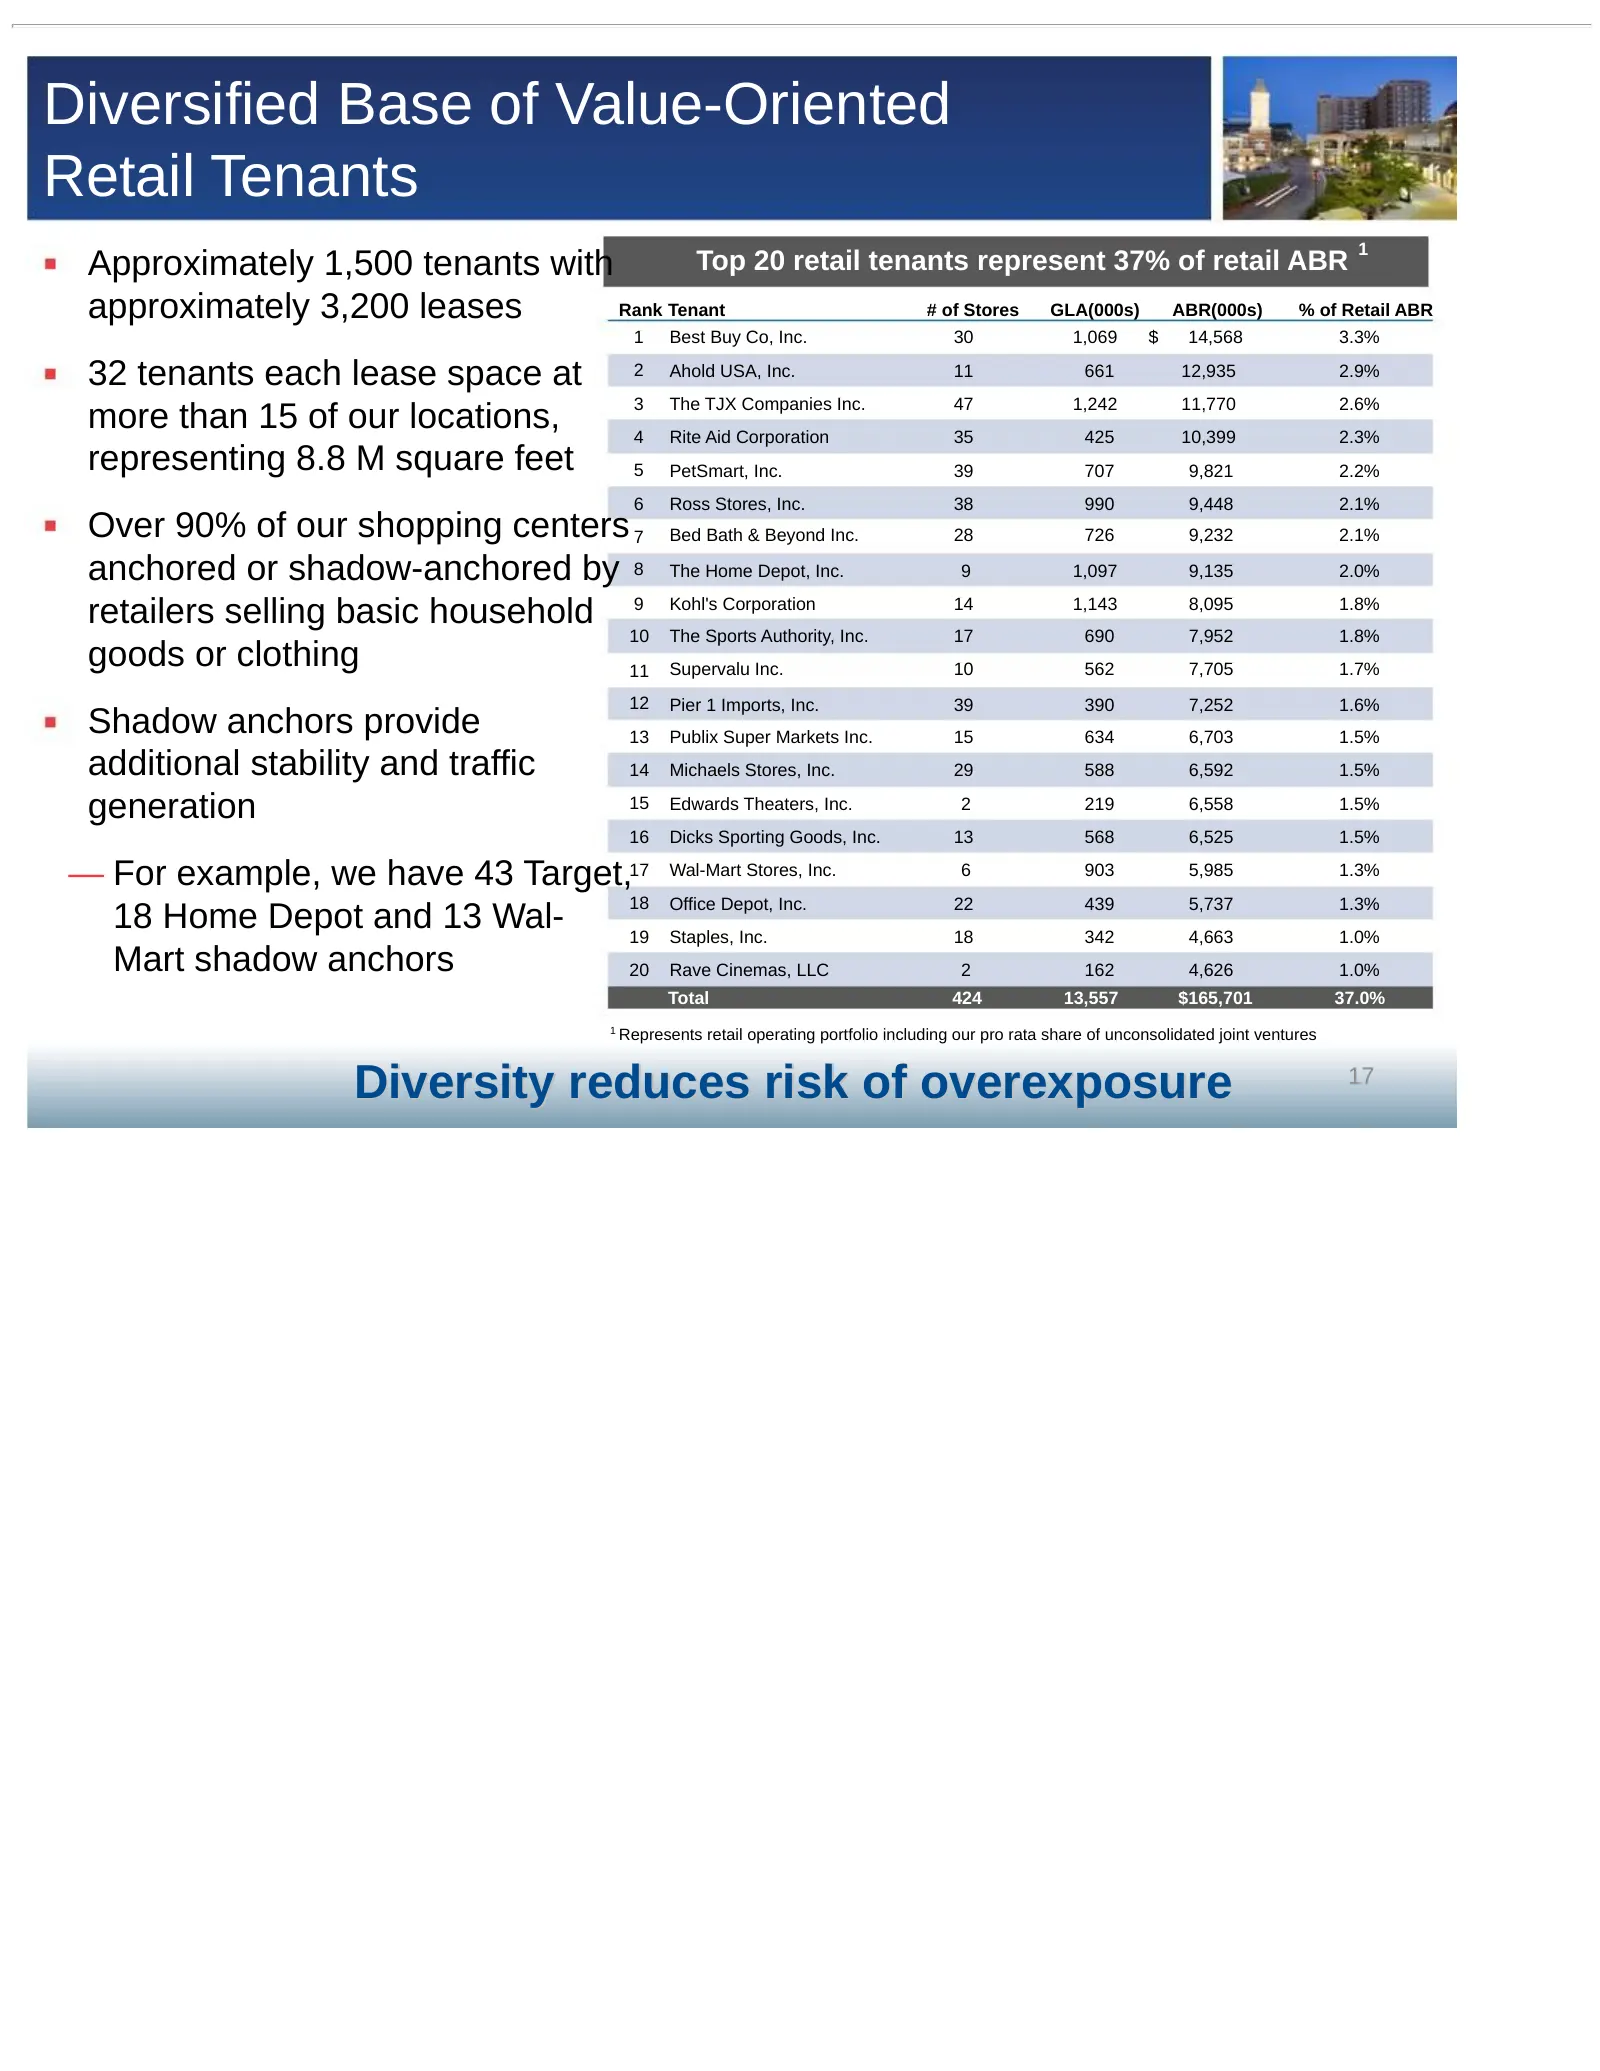
Diversified Base of Value-Oriented Retail Tenants 1 Approximately 1,500 tenants with Top 20 retail tenants represent 37% of retail ABR approximately 3,200 leases Rank Tenant # of Stores GLA(000s) ABR(000s) % of Retail ABR 1 Best Buy Co, Inc. 30 1,069 $ 14,568 3.3% 32 tenants each lease space at 2 Ah
Slide 18: Dominant Grocery Anchors Drive Traffic
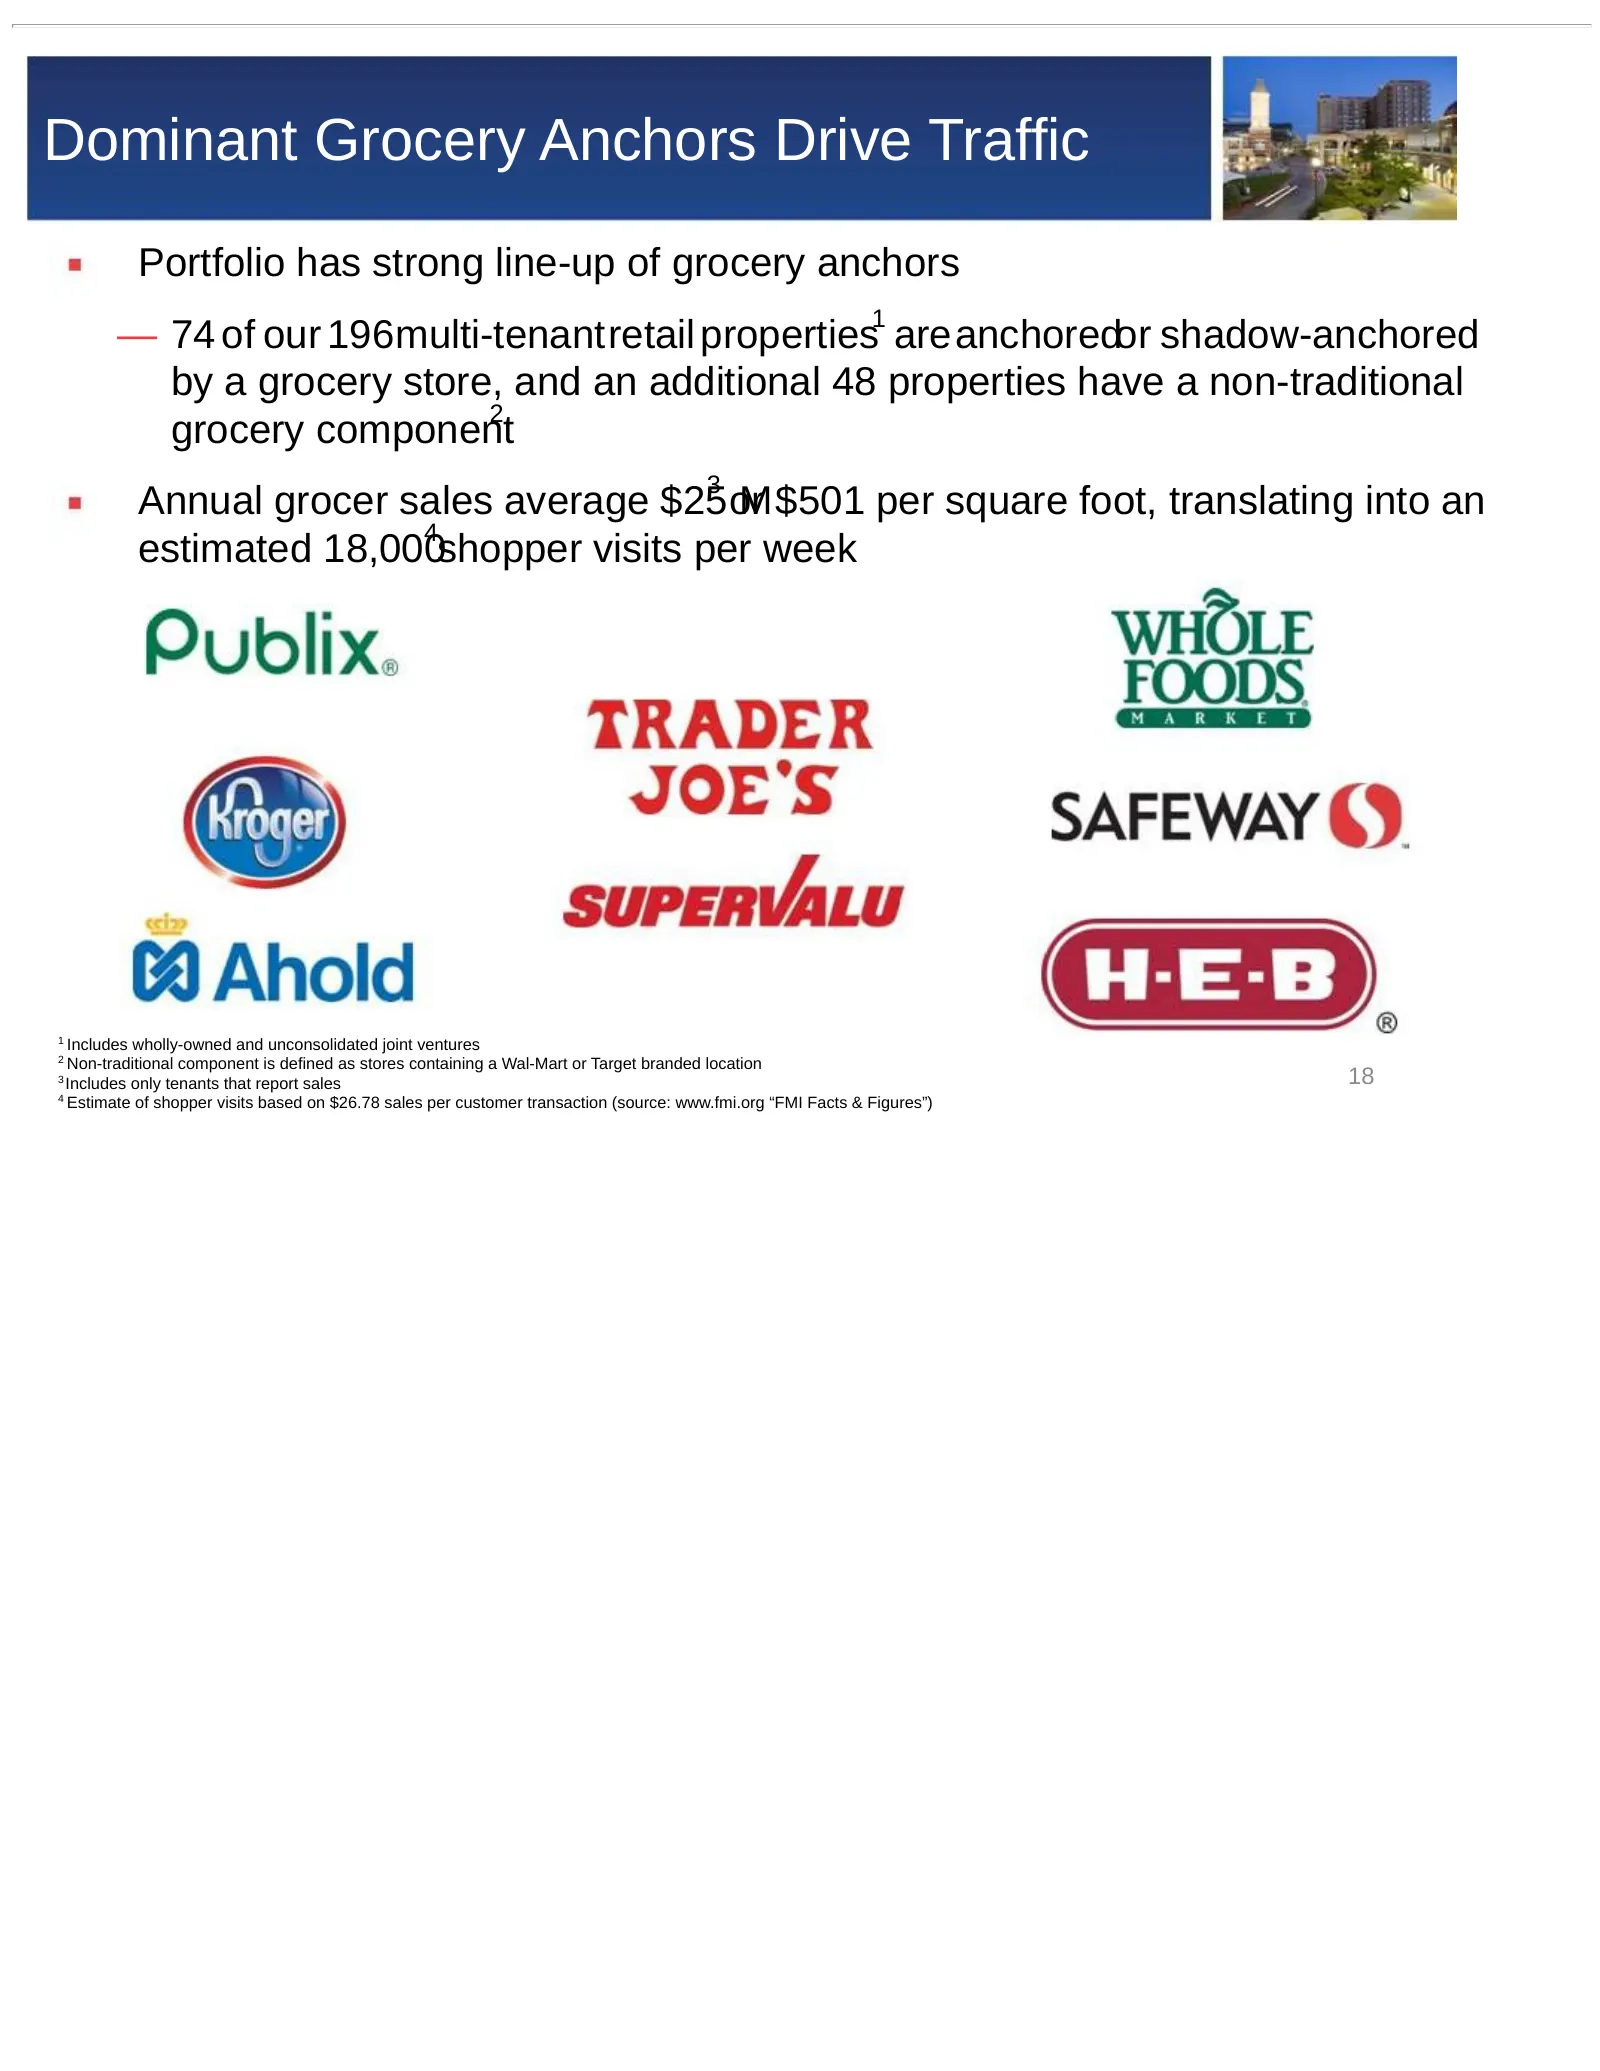
Dominant Grocery Anchors Drive Traffic Portfolio has strong line-up of grocery anchors 1 — 74 of our 196multi-tenantretail properties areanchoredor shadow-anchored by a grocery store, and an additional 48 properties have a non-traditional 2 grocery component 3 Annual grocer sales average $25orM $501

Slide 19: Capital Markets
| Retail Properties of America, Inc = CAPITAL MARKETS
Slide 20: Strengthening Balance Sheet
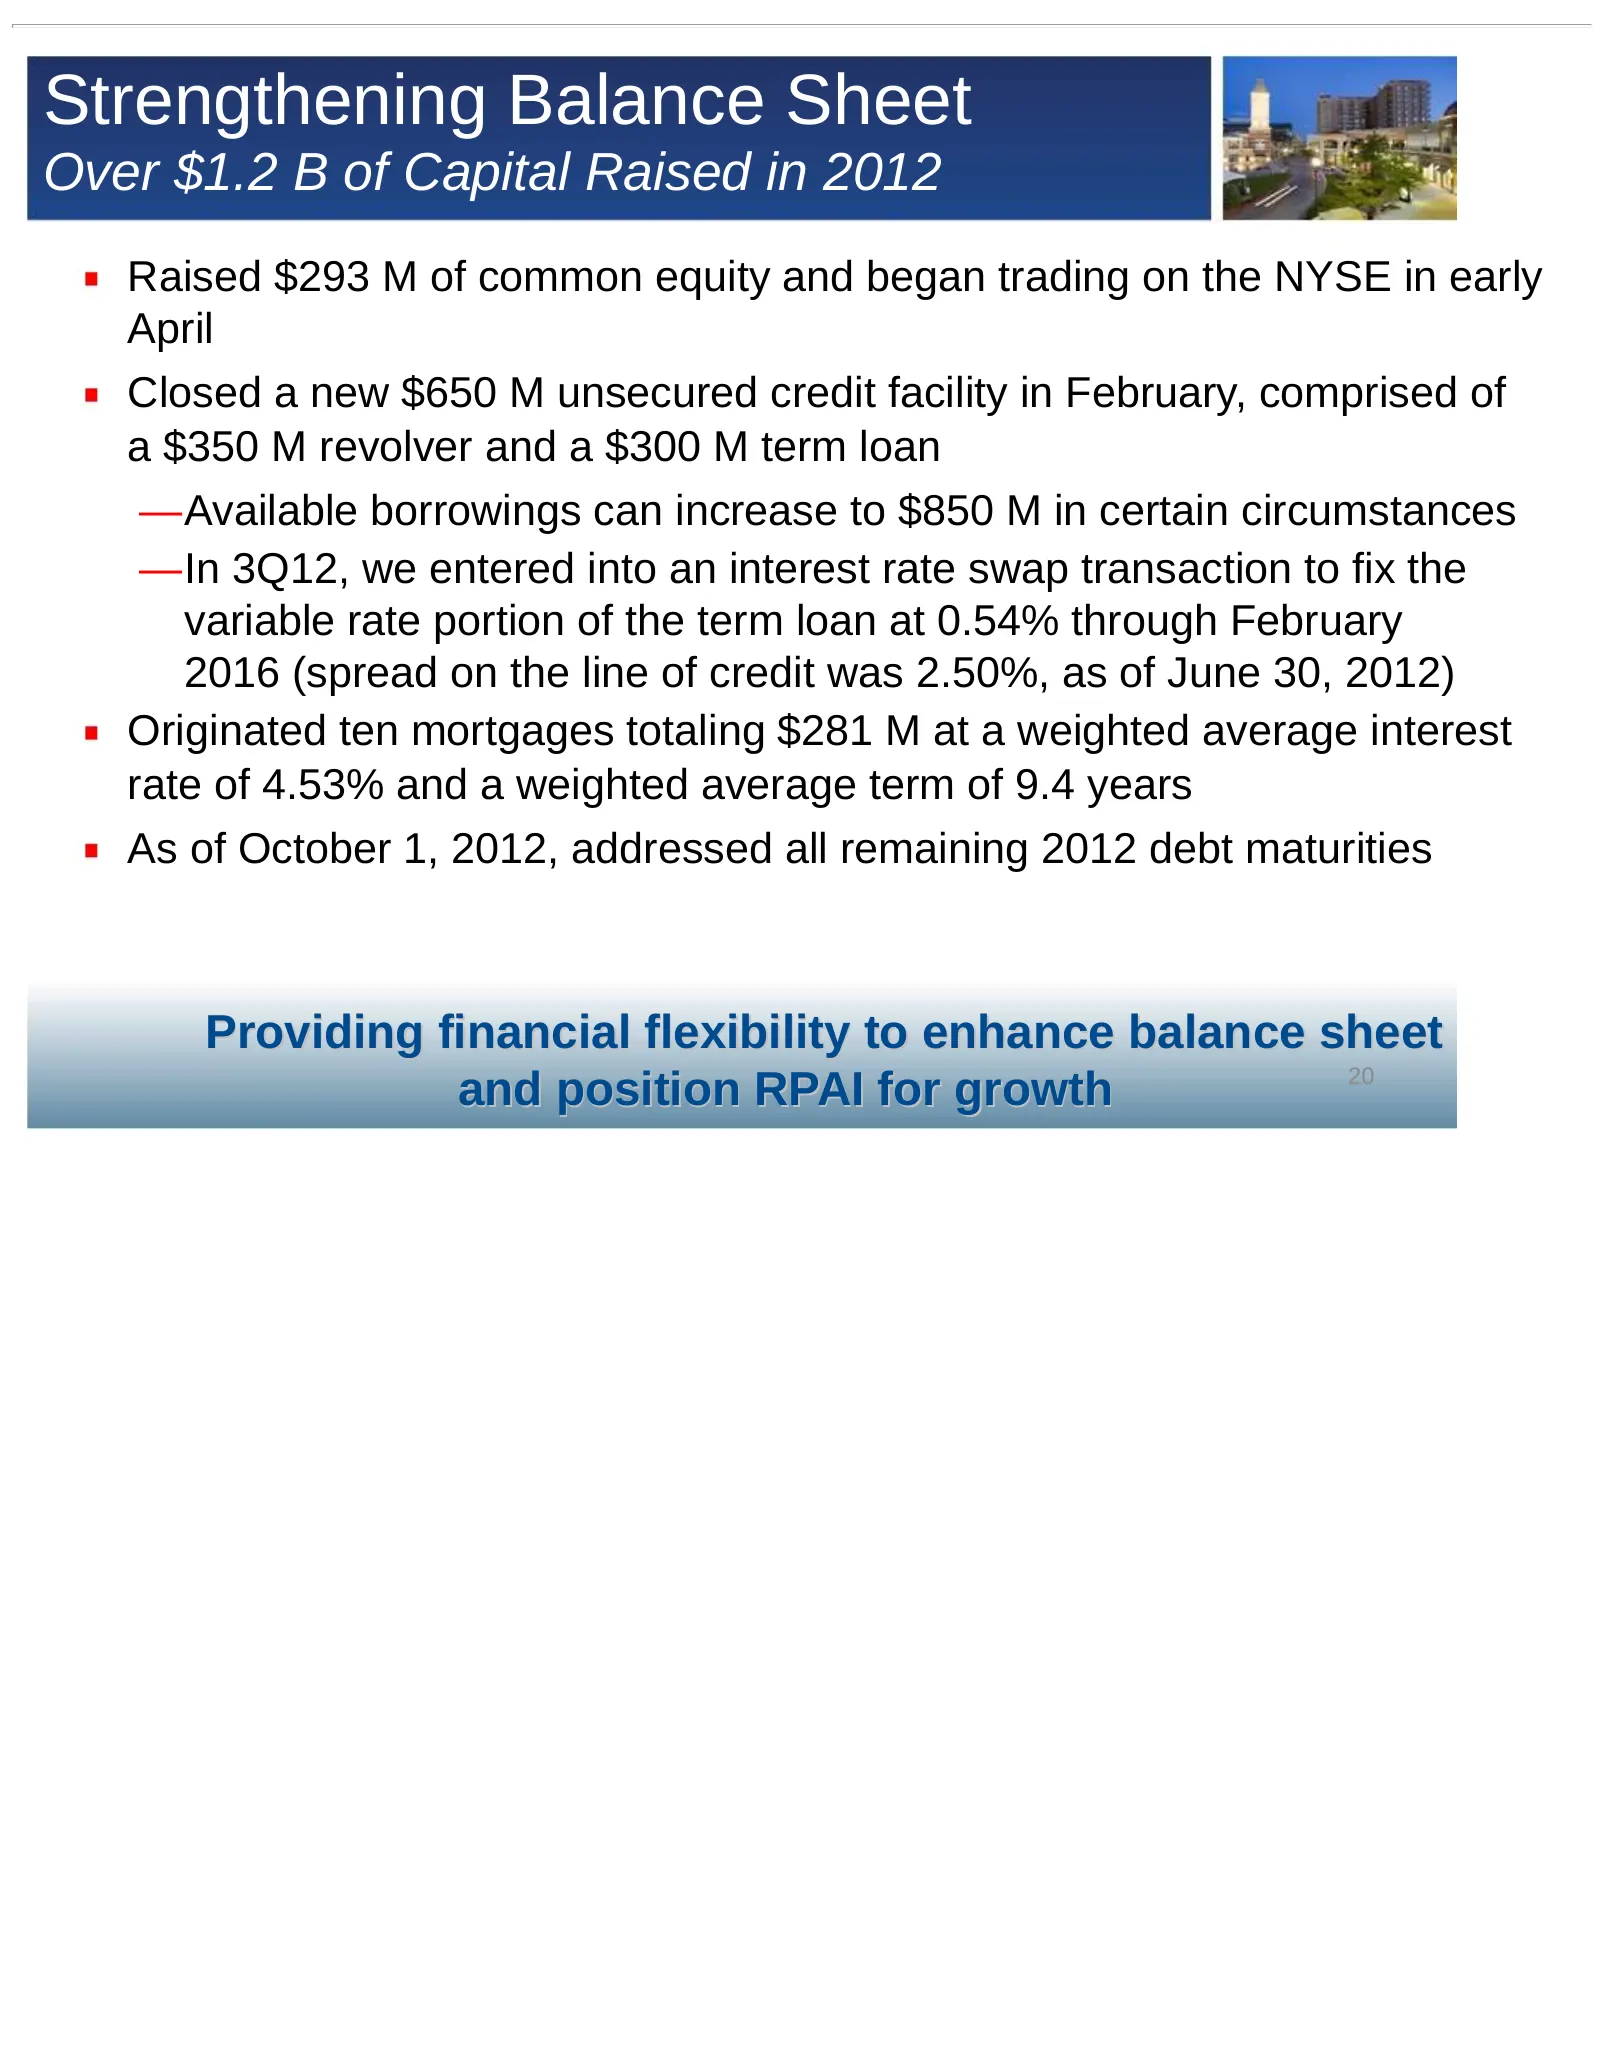
Strengthening Balance Sheet Over $1.2 B of Capital Raised in 2012 Raised $293 M of common equity and began trading on the NYSE in early April Closed a new $650 M unsecured credit facility in February, comprised of a $350 M revolver and a $300 M term loan —Available borrowings can increase to $850 M
Slide 21: Historical Leverage Profile
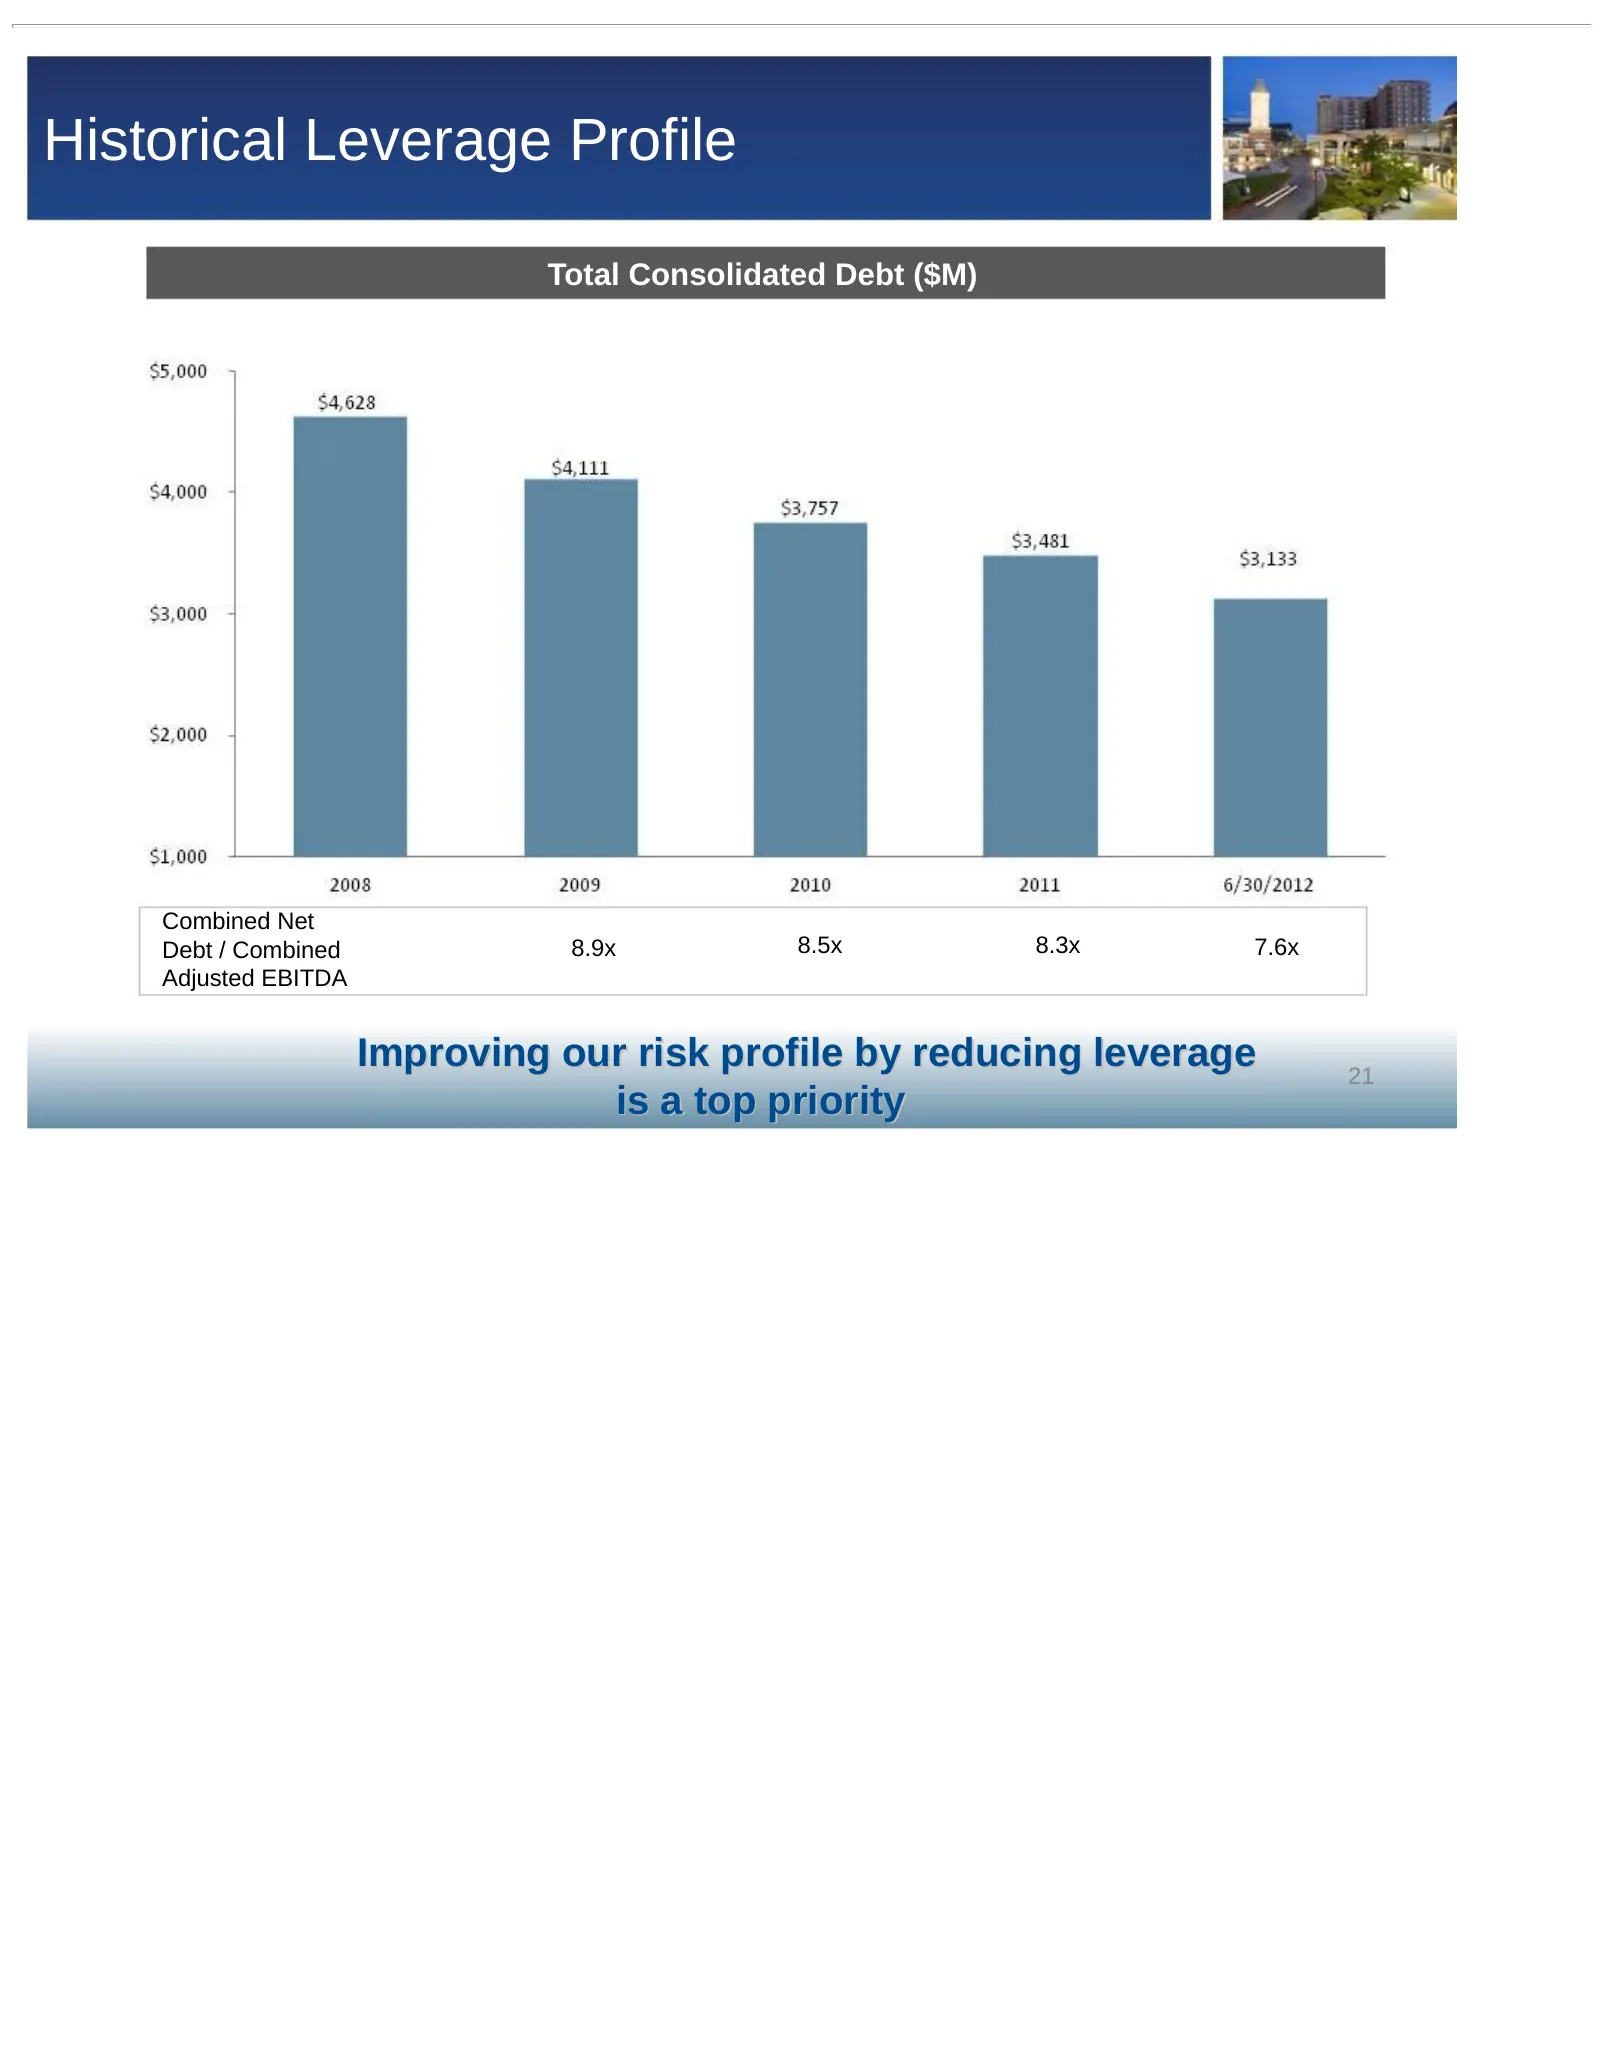
Historical Leverage Profile Total Consolidated Debt ($M) Combined Net Debt / Combined 8.9x 8.5x 8.3x 7.6x Adjusted EBITDA Improving our risk profile by reducing leverage 21 is a top priority
Slide 22: Capital Structure Positioned for Growth
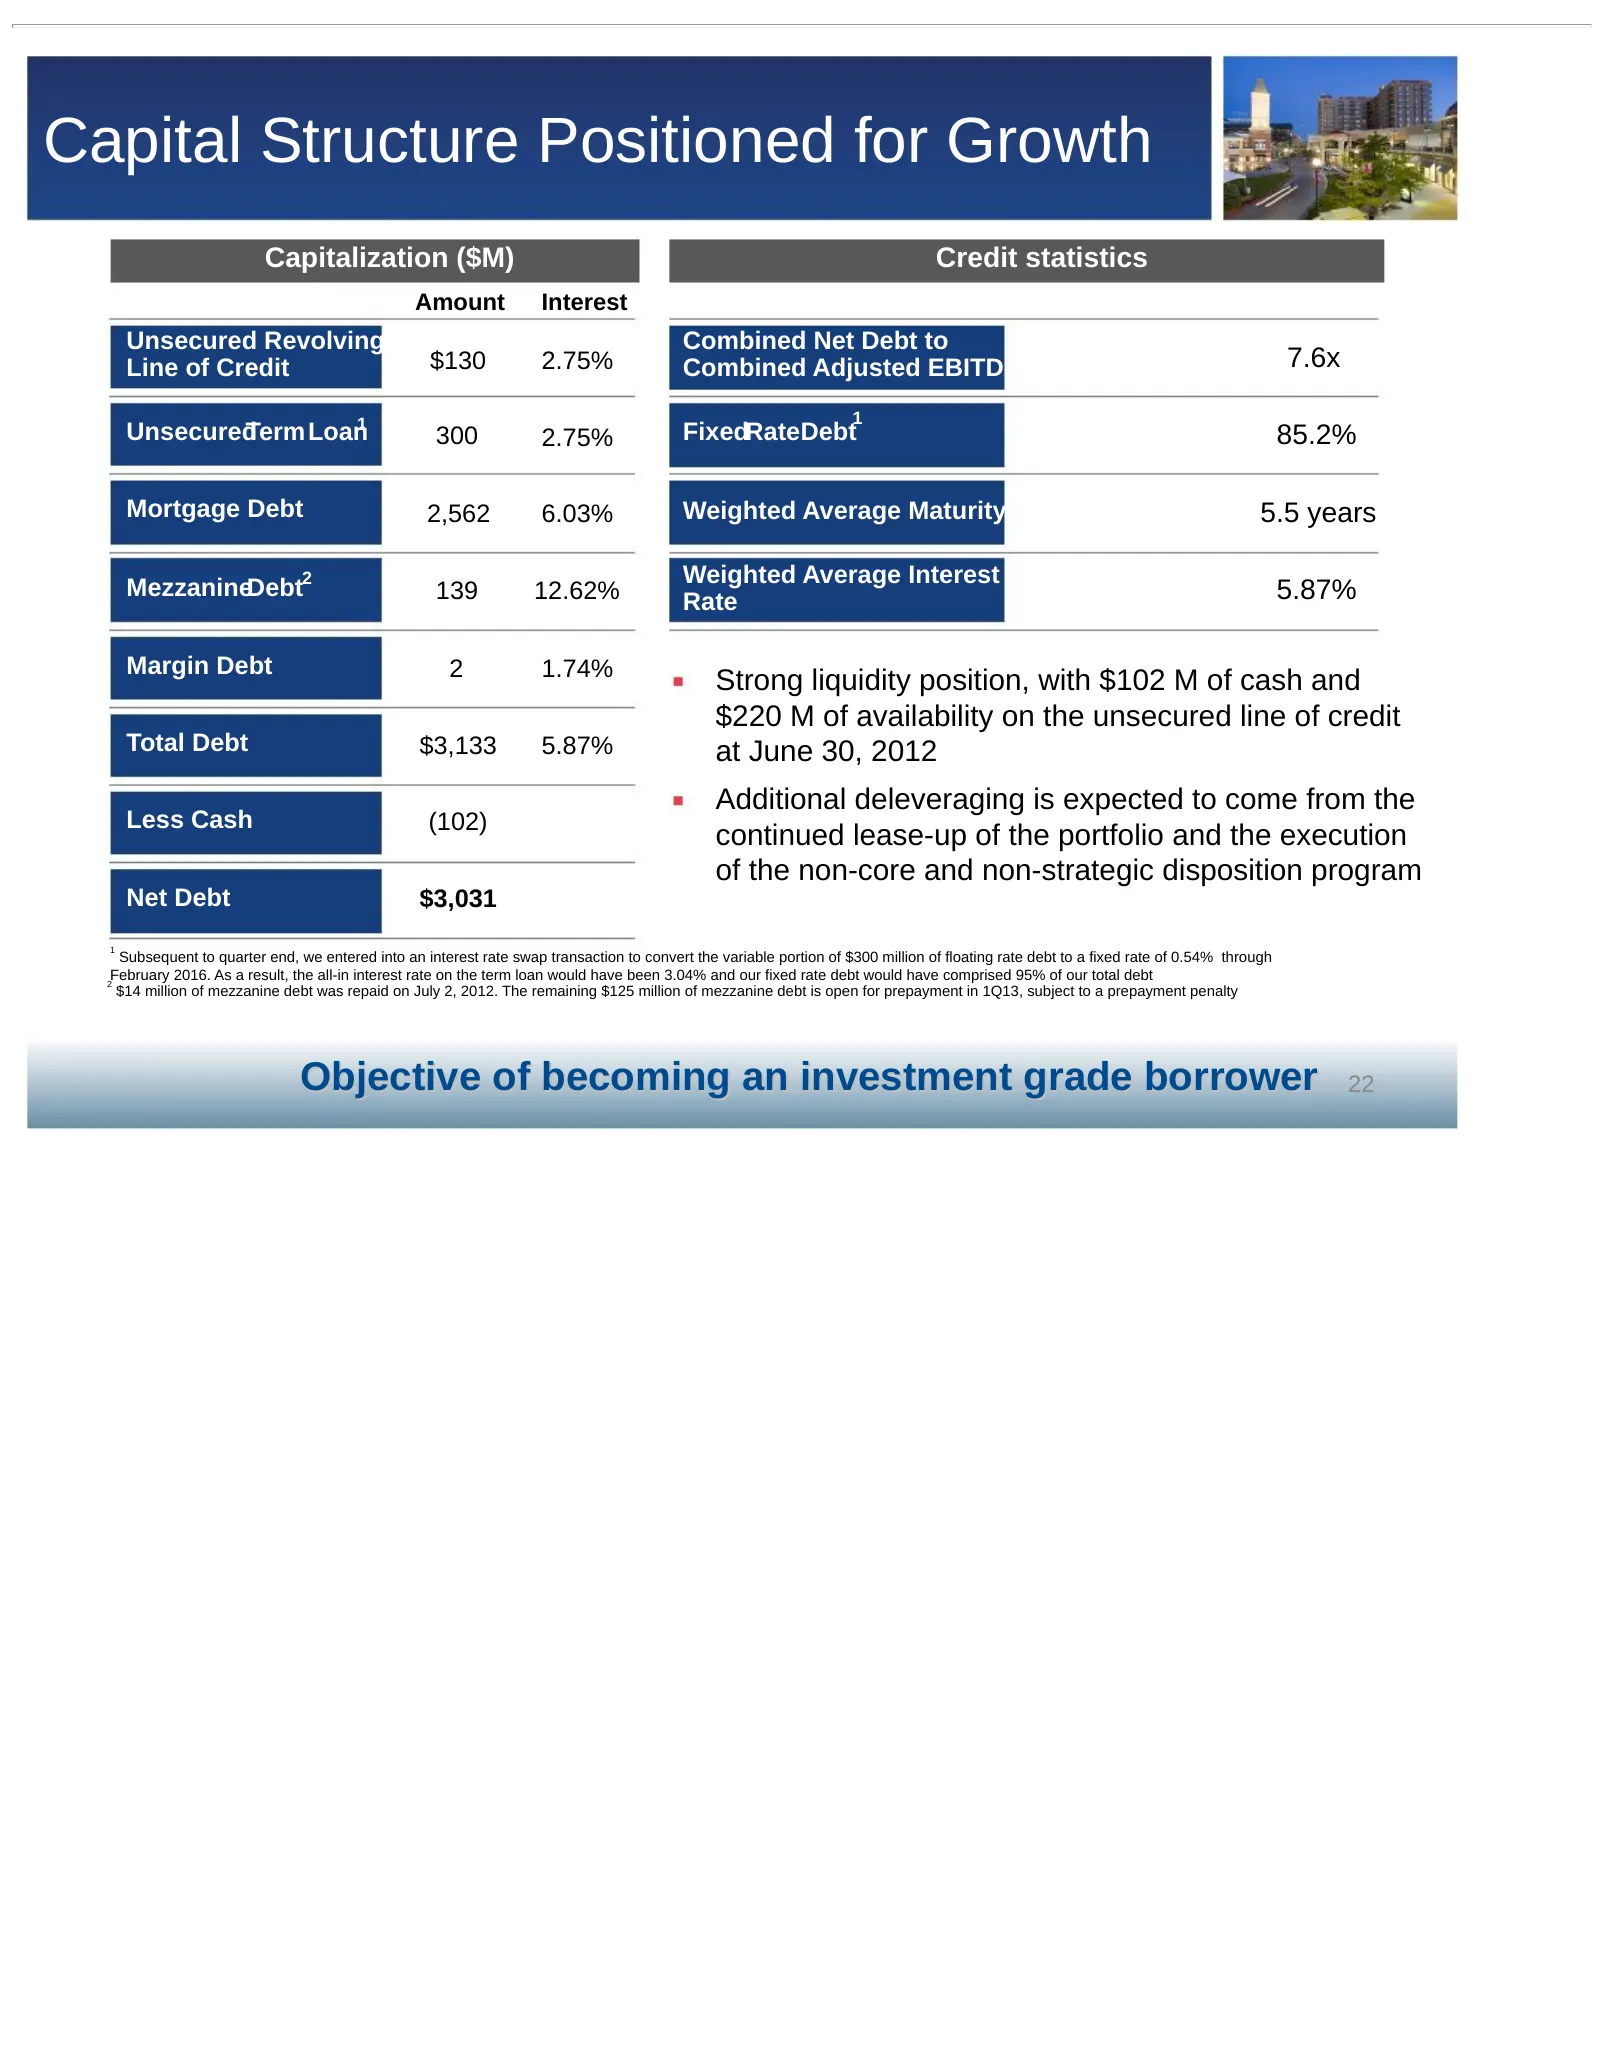
Capital Structure Positioned for Growth Capitalization ($M) Credit statistics Amount Interest Unsecured Revolving Combined Net Debt to Line of Credit $130 2.75% Combined Adjusted EBITDA 7.6x 1 UnsecuredTermLoan1 300 2.75% FixedRateDebt 85.2% Mortgage Debt 2,562 6.03% Weighted Average Maturity 5.5 ye
Slide 23: Manageable Near-Term Debt Maturities
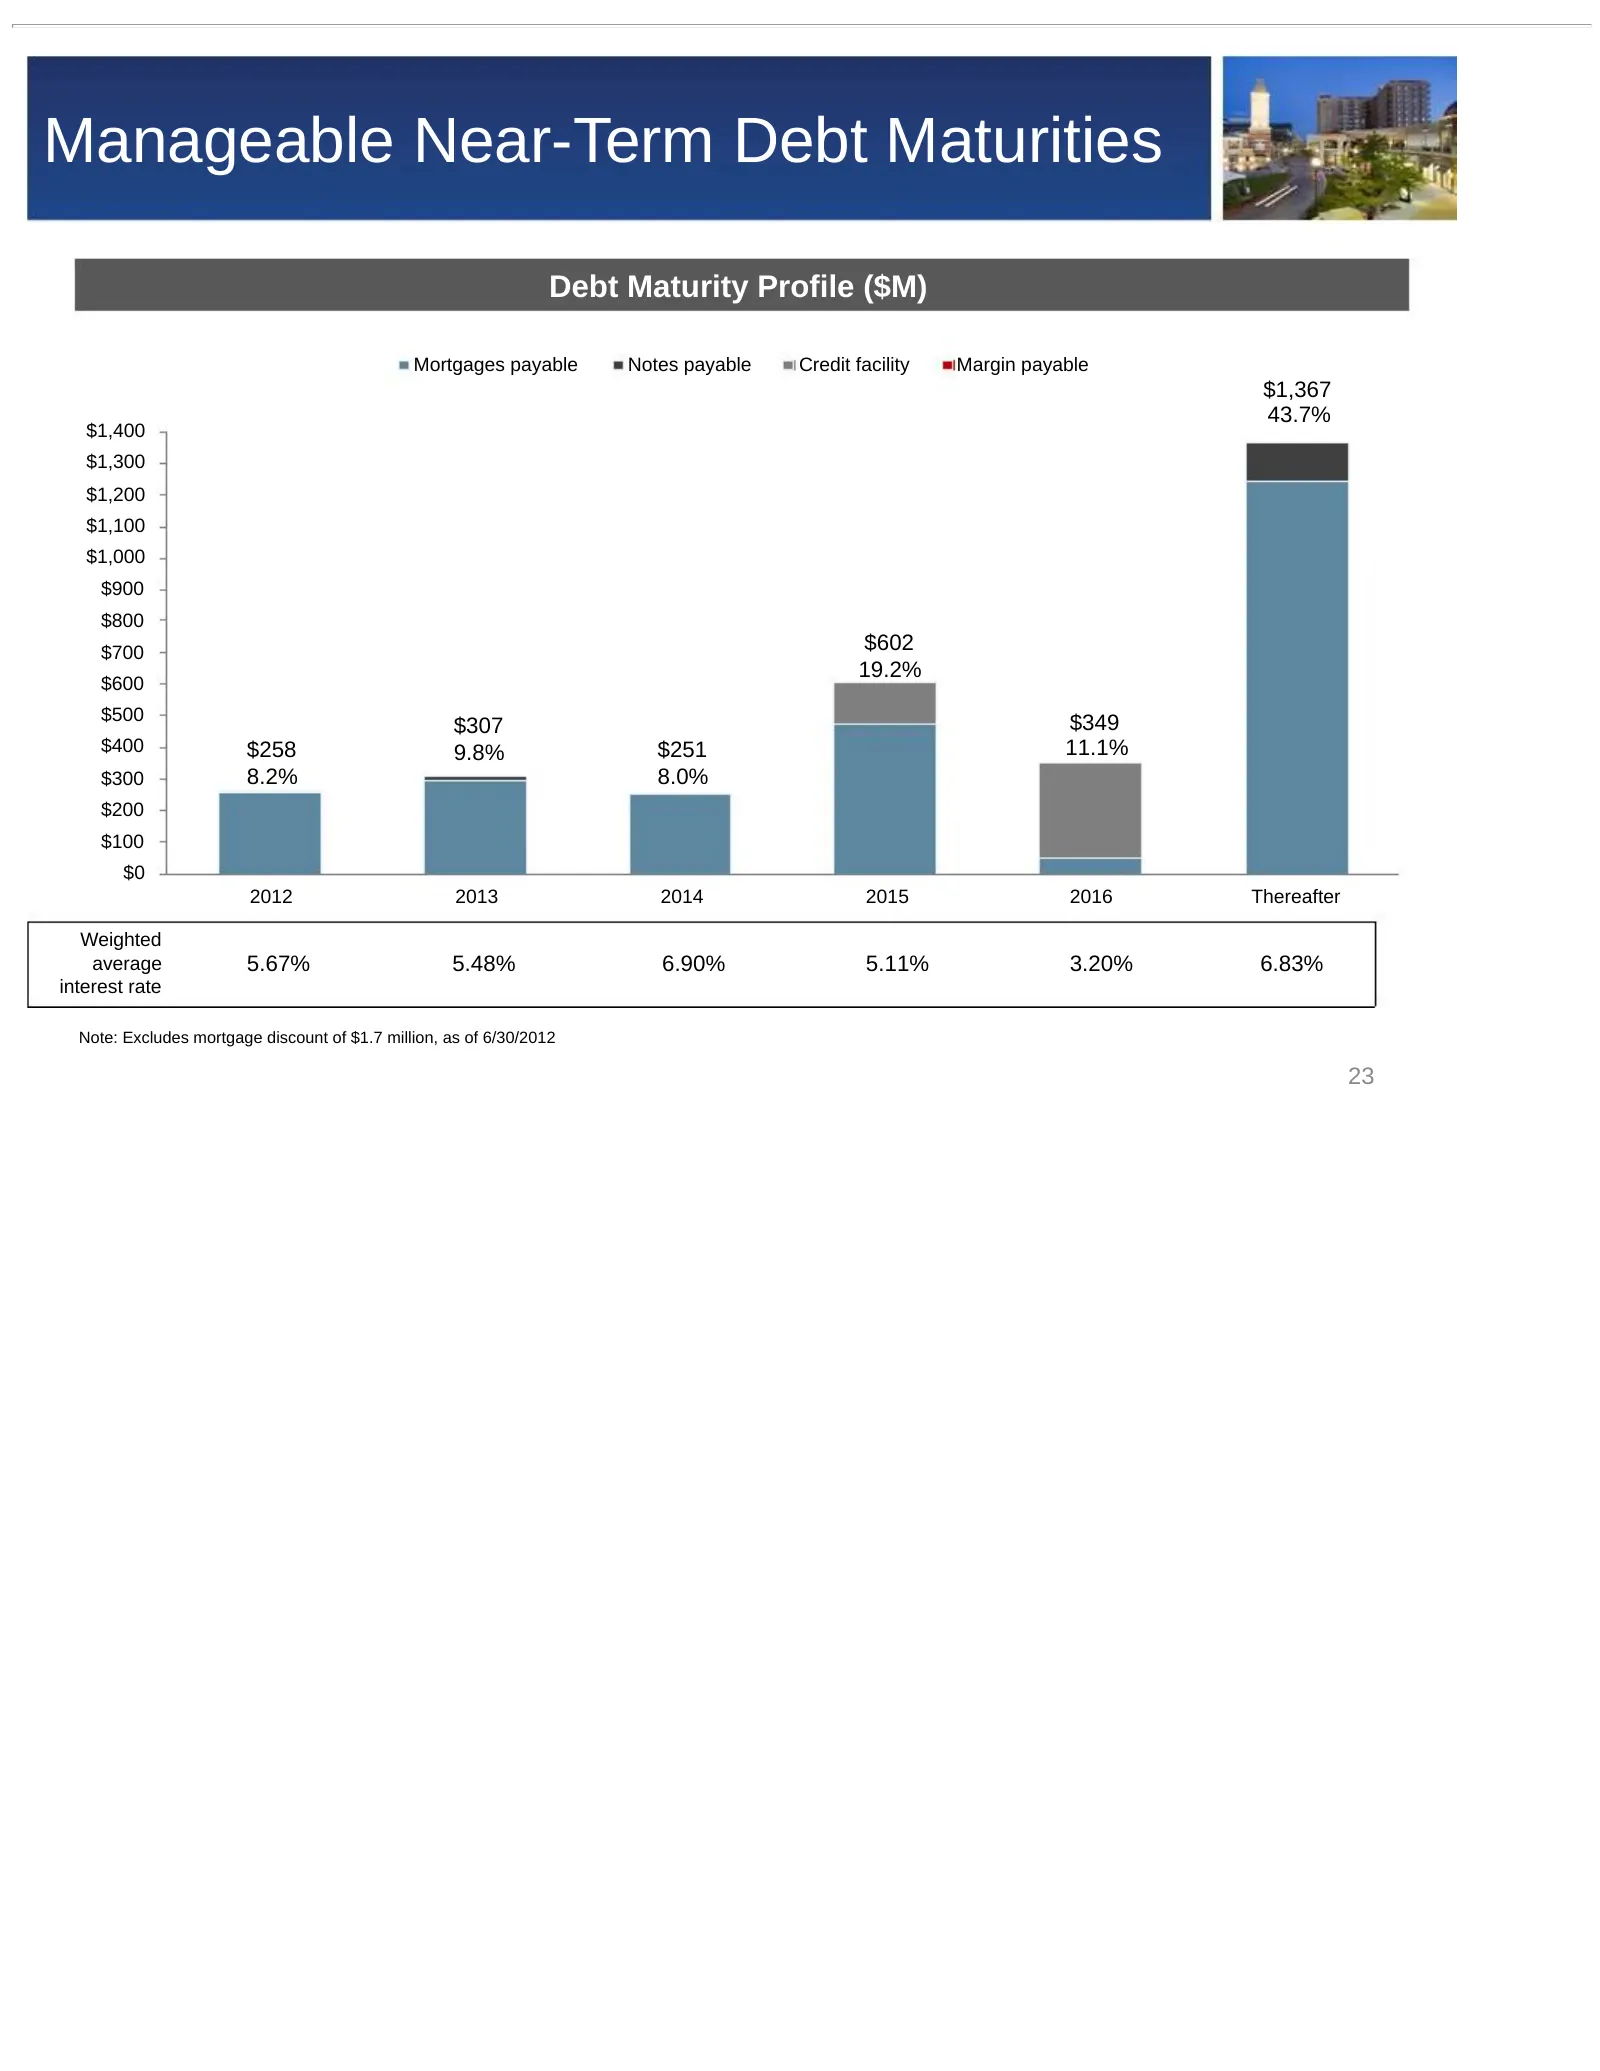
Manageable Near-Term Debt Maturities Debt Maturity Profile ($M) Mortgages payable Notes payable Credit facility Margin payable $1,367 43.7% $1,400 $1,300 $1,200 $1,100 $1,000 $900 $800 $700 $602 19.2% $600 $500 $349 $307 $400 $258 9.8% $251 11.1% $300 8.2% 8.0% $200 $100 $0 2012 2013 2014 2015 2016
Slide 24: Experienced Management Team
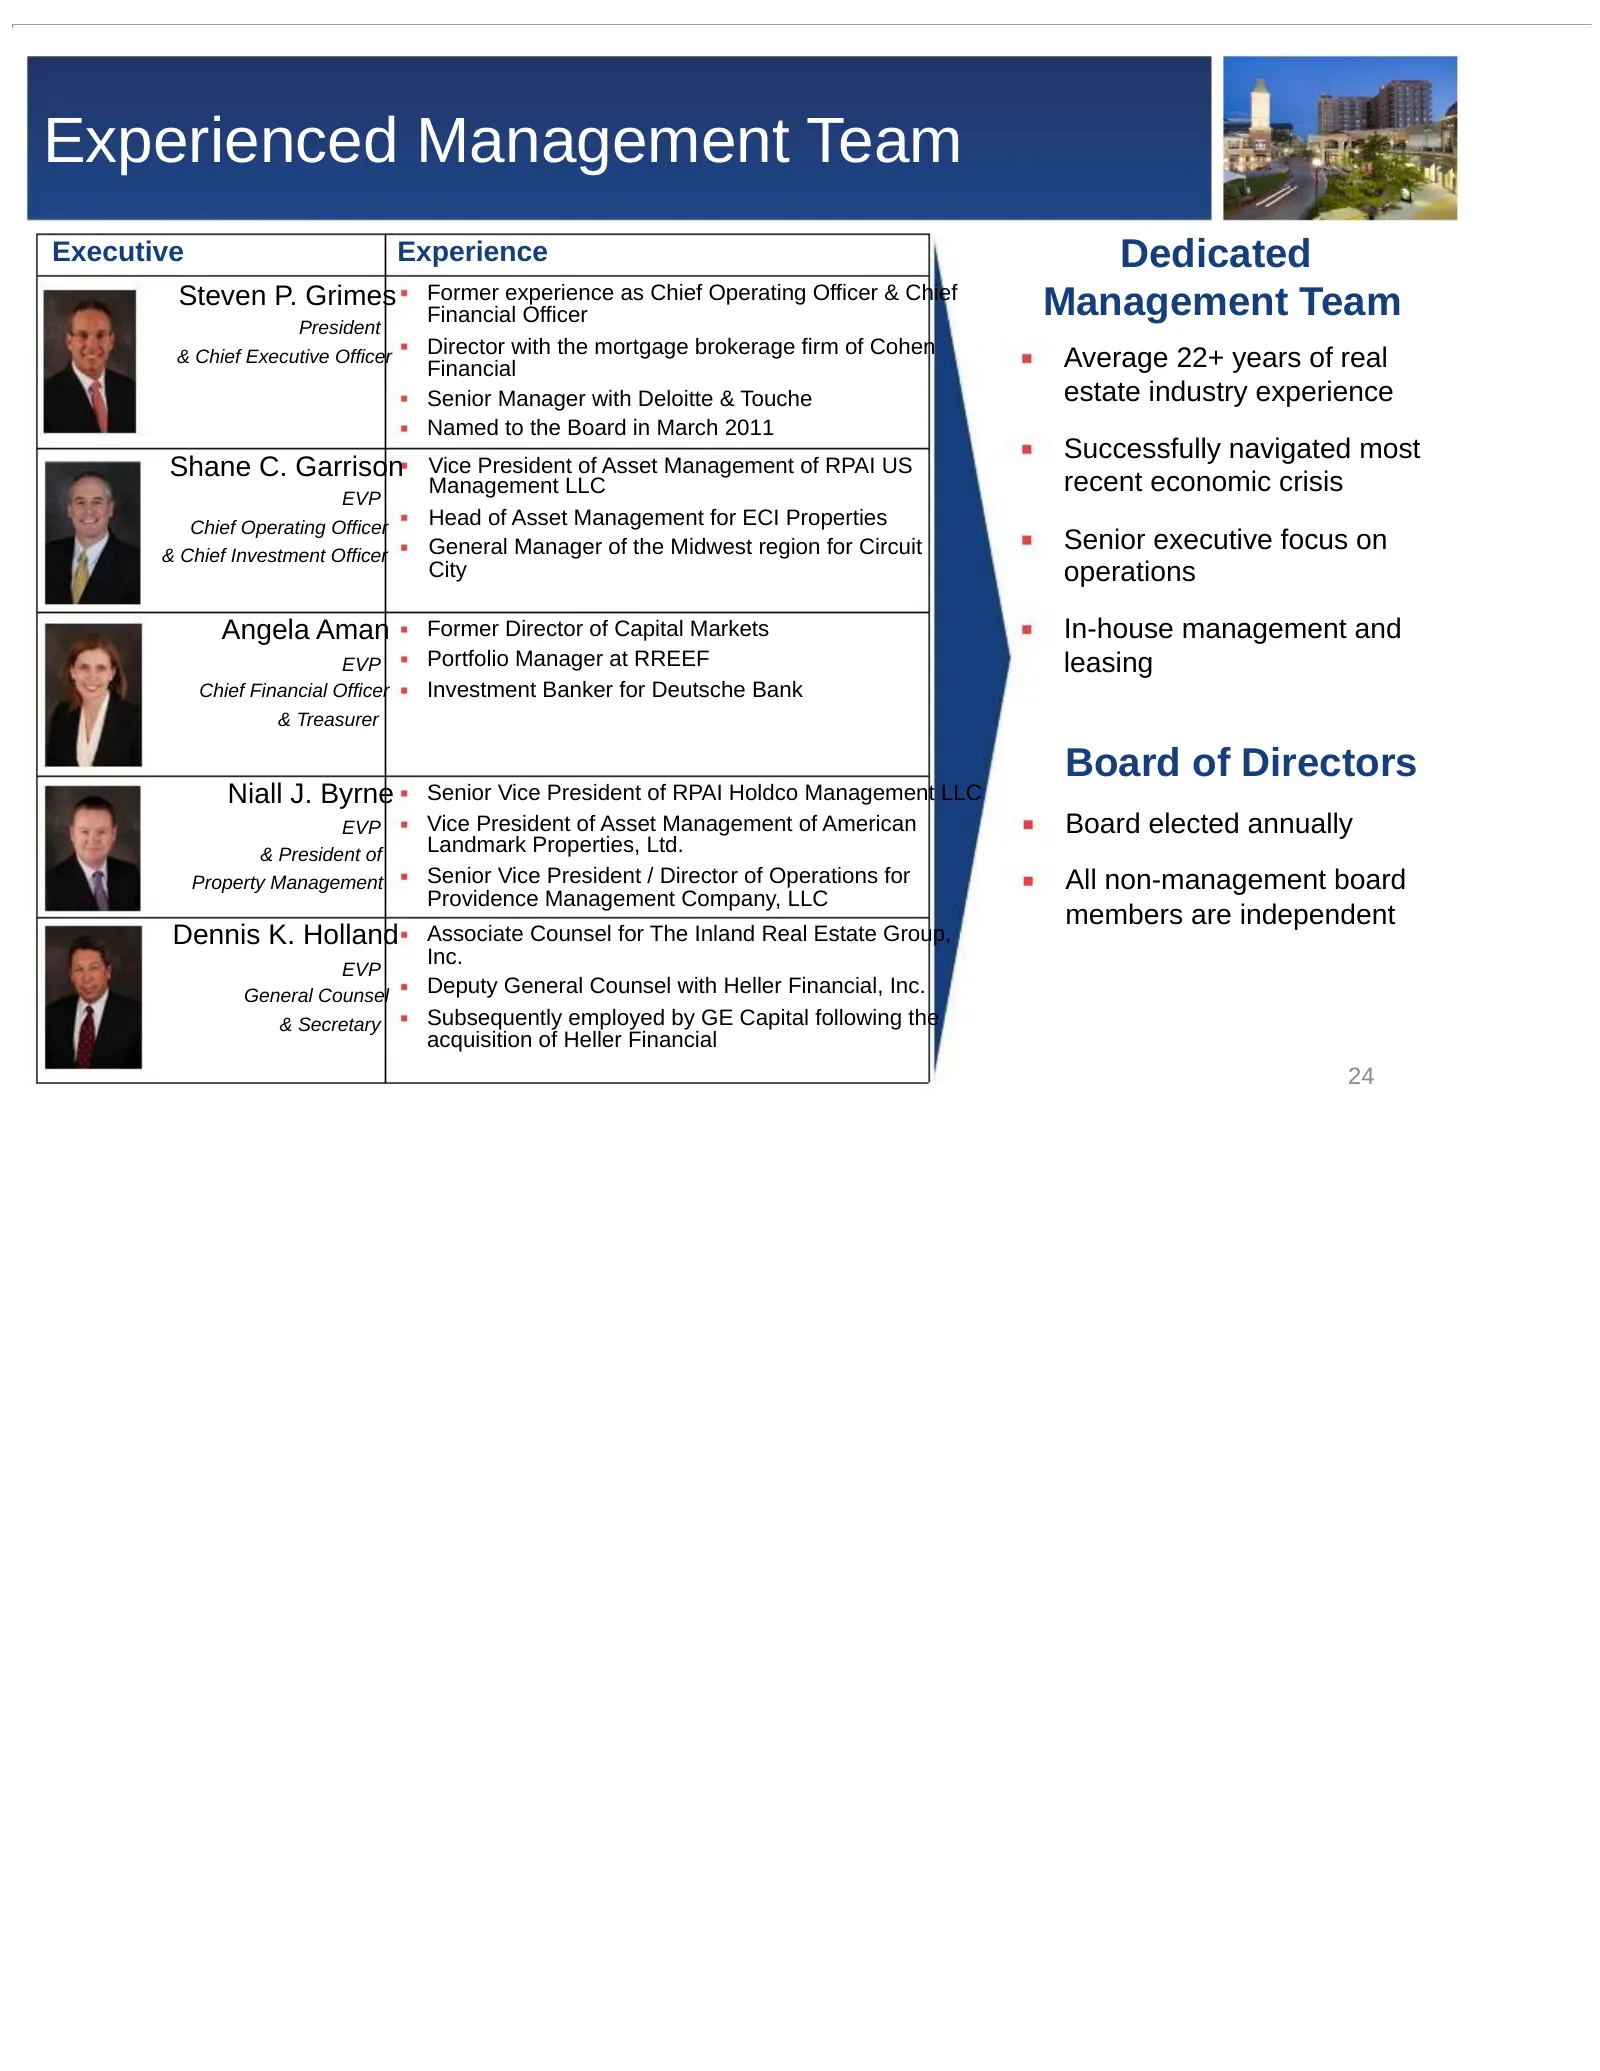
Experienced Management Team Executive Experience Dedicated Steven P. Grimes President Former experience as Chief Operating Officer & Chief Financial Officer Management Team Director with the mortgage brokerage firm of Cohen & Chief Executive Officer Financial Average 22+ years of real Senior Manager

Slide 25: Appendix: Non-GAAP Reconciliations
APPENDIX NON-GAAP RECONCILIATIONS 25
Slide 26: Non-GAAP Financial Measures
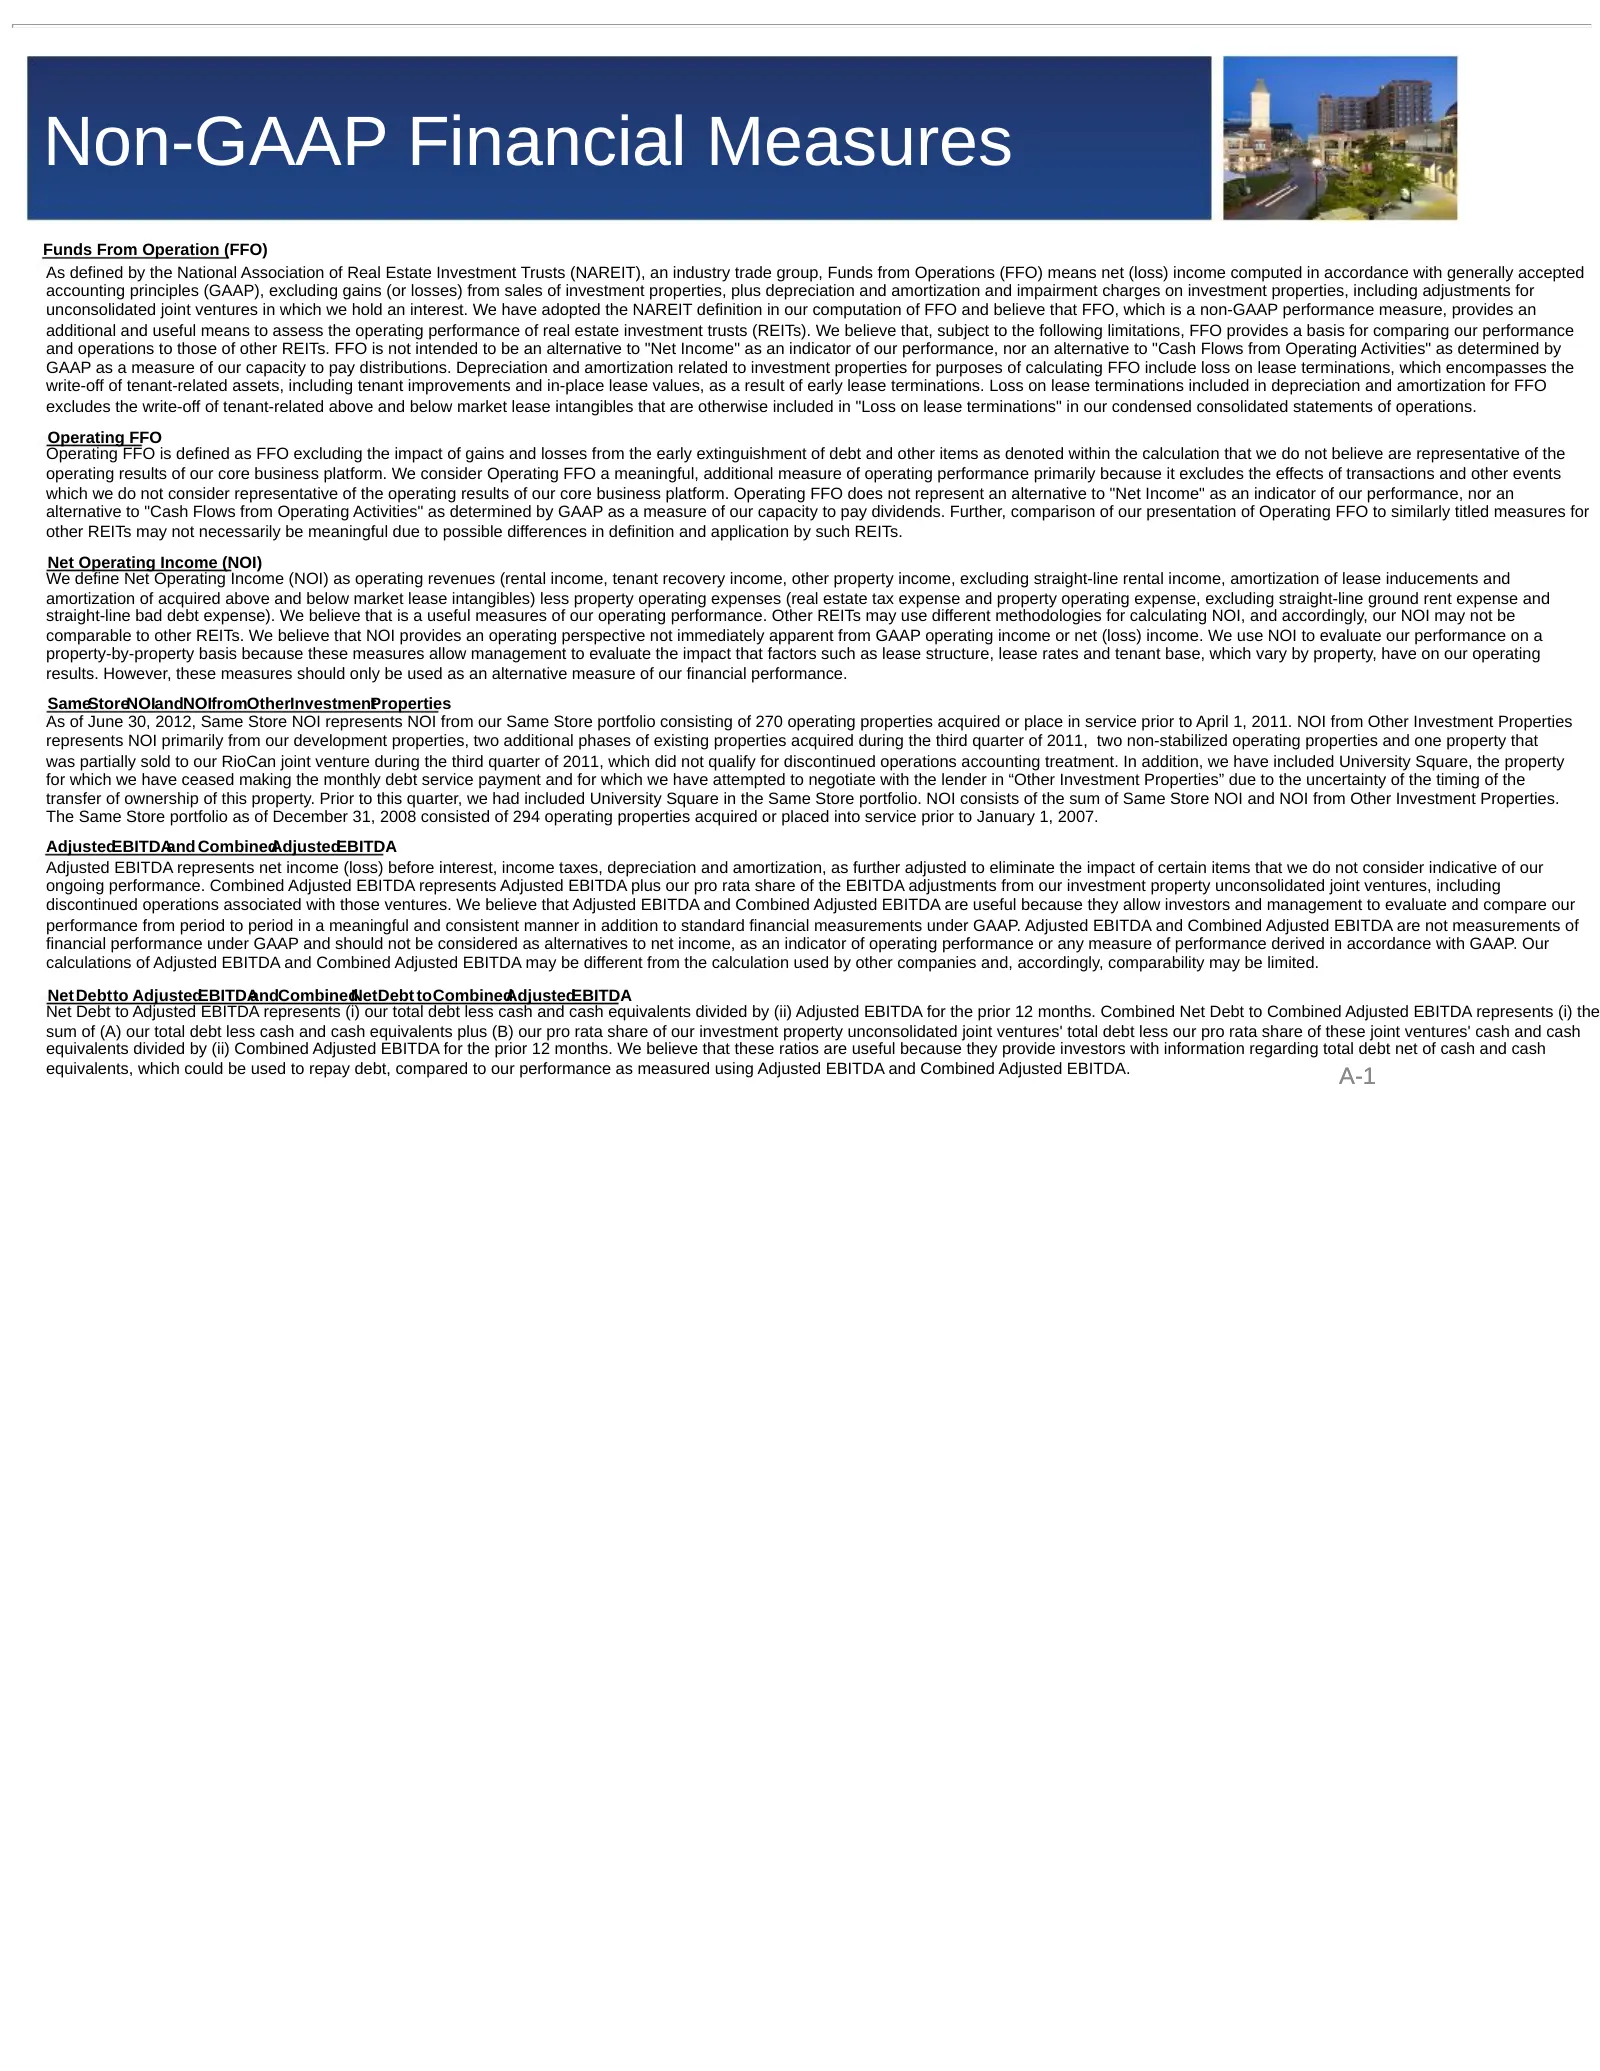
Non-GAAP Financial Measures Funds From Operation (FFO) As defined by the National Association of Real Estate Investment Trusts (NAREIT), an industry trade group, Funds from Operations (FFO) means net (loss) income computed in accordance with generally accepted accounting principles (GAAP), excluding
Slide 27: Reconciliation of NOI to Net Income
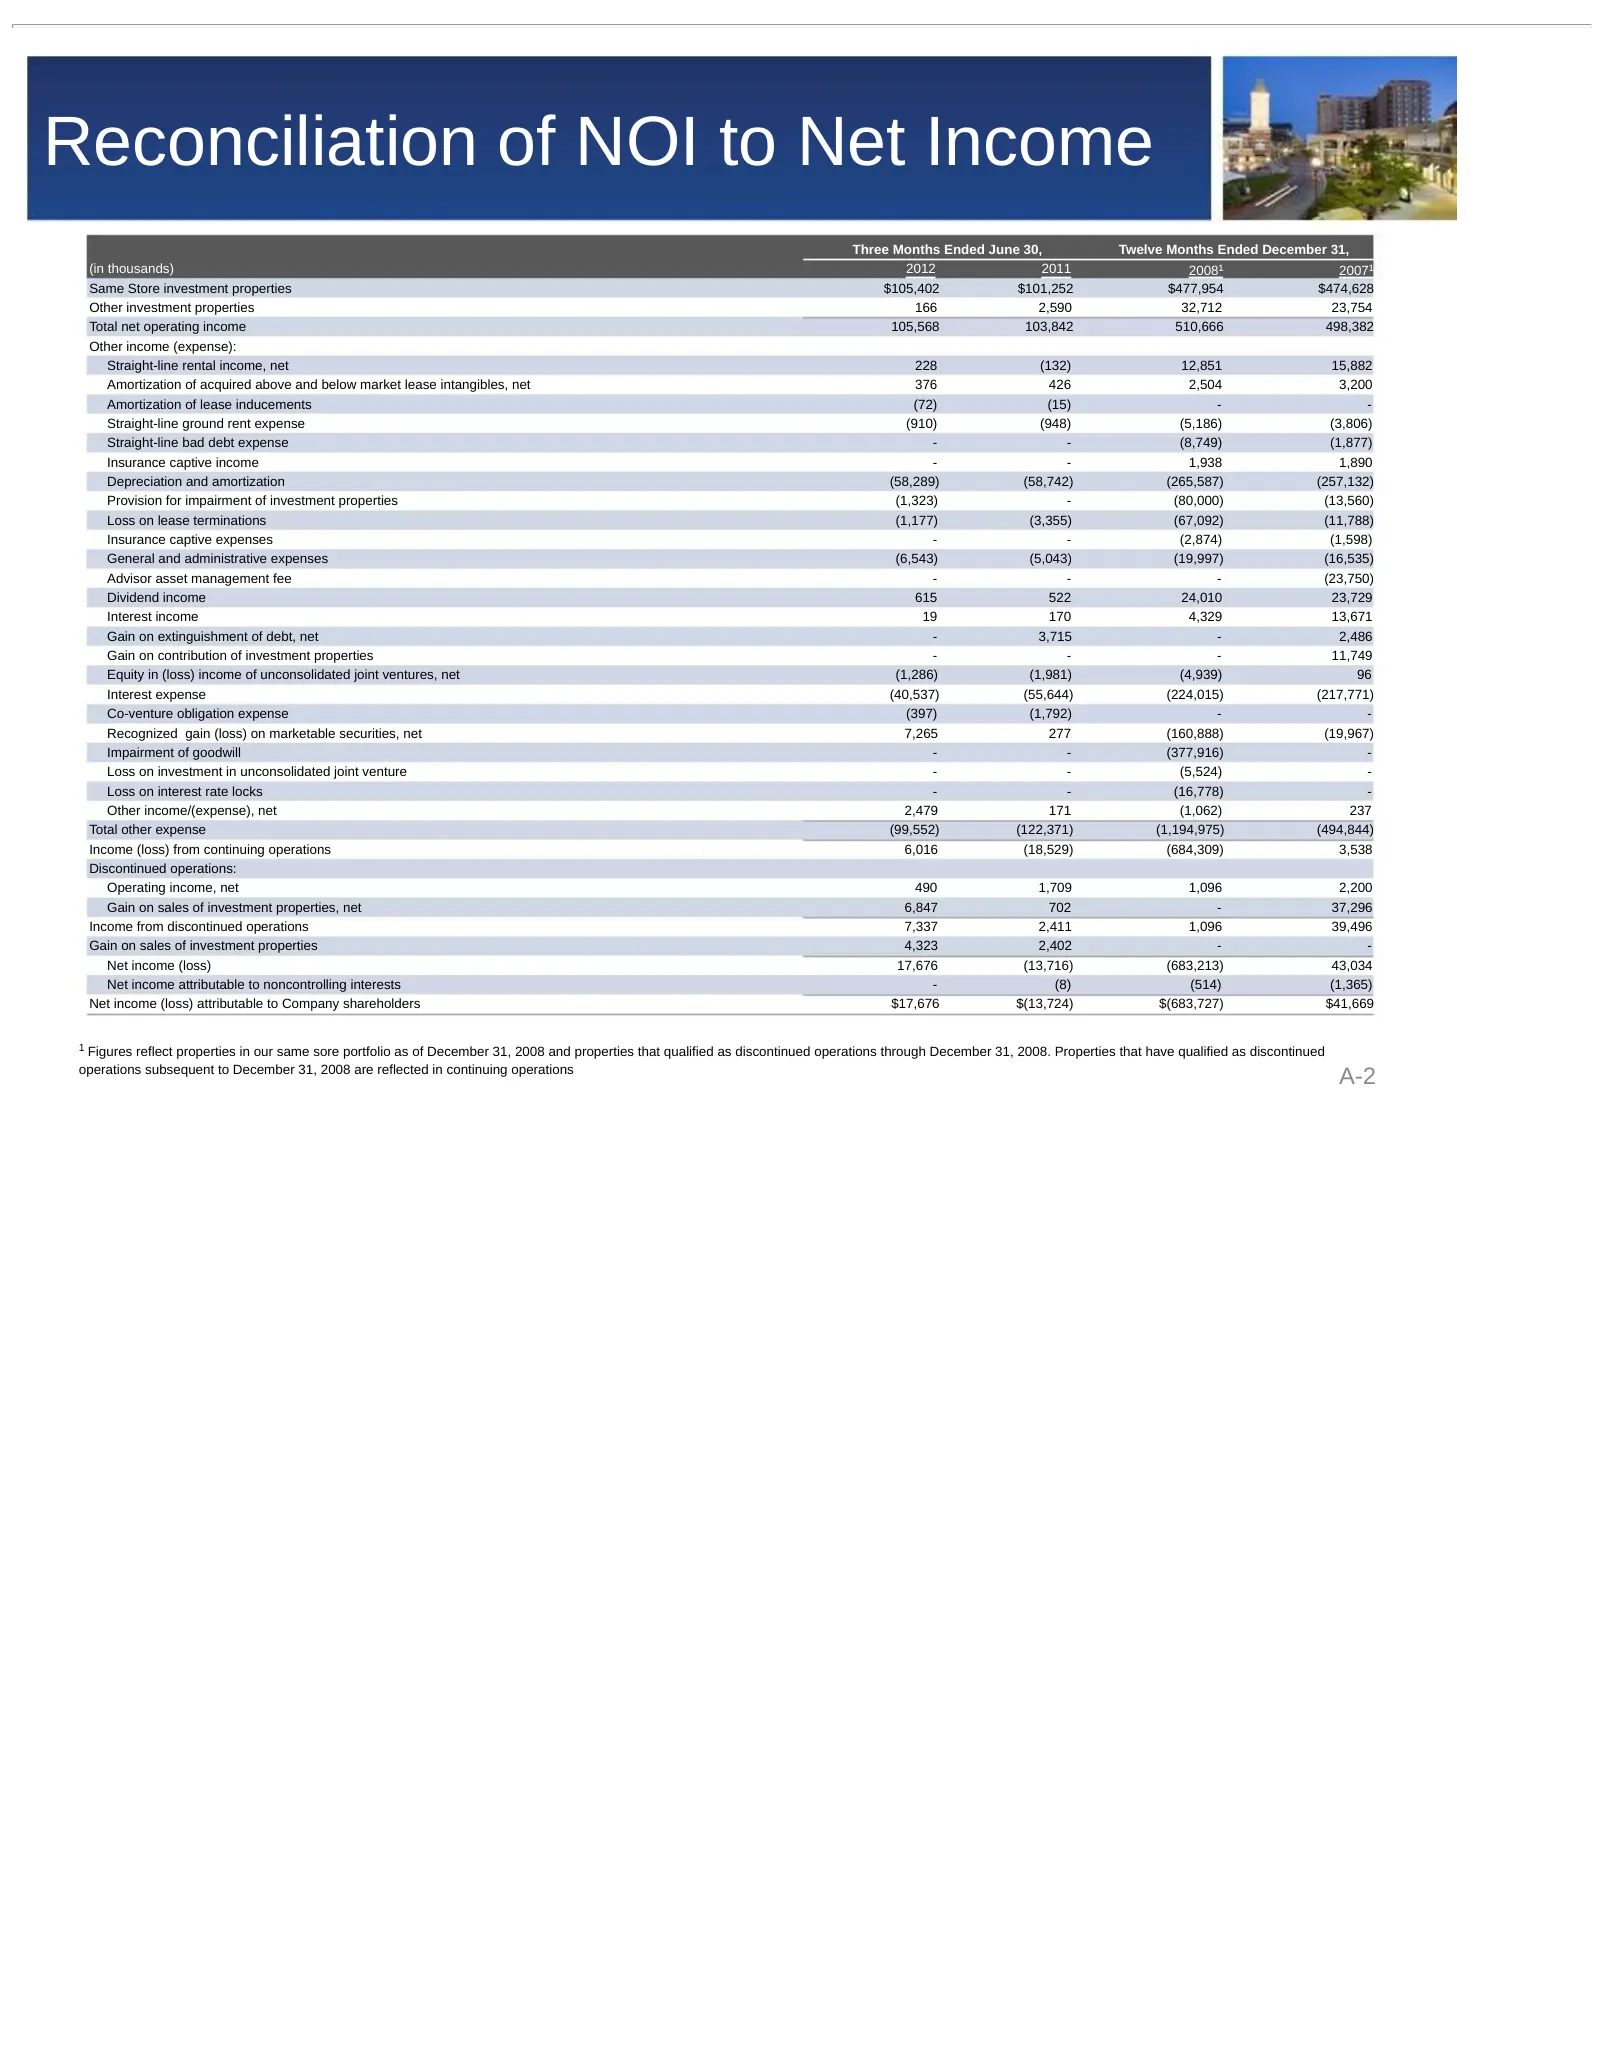
Reconciliation of NOI to Net Income Three Months Ended June 30, Twelve Months Ended December 31, (in thousands) 2012 2011 2008¹ 2007¹ Same Store investment properties $105,402 $101,252 $477,954 $474,628 Other investment properties 166 2,590 32,712 23,754 Total net operating income 105,568 103,842 51
Slide 28: Reconciliation of Operating FFO
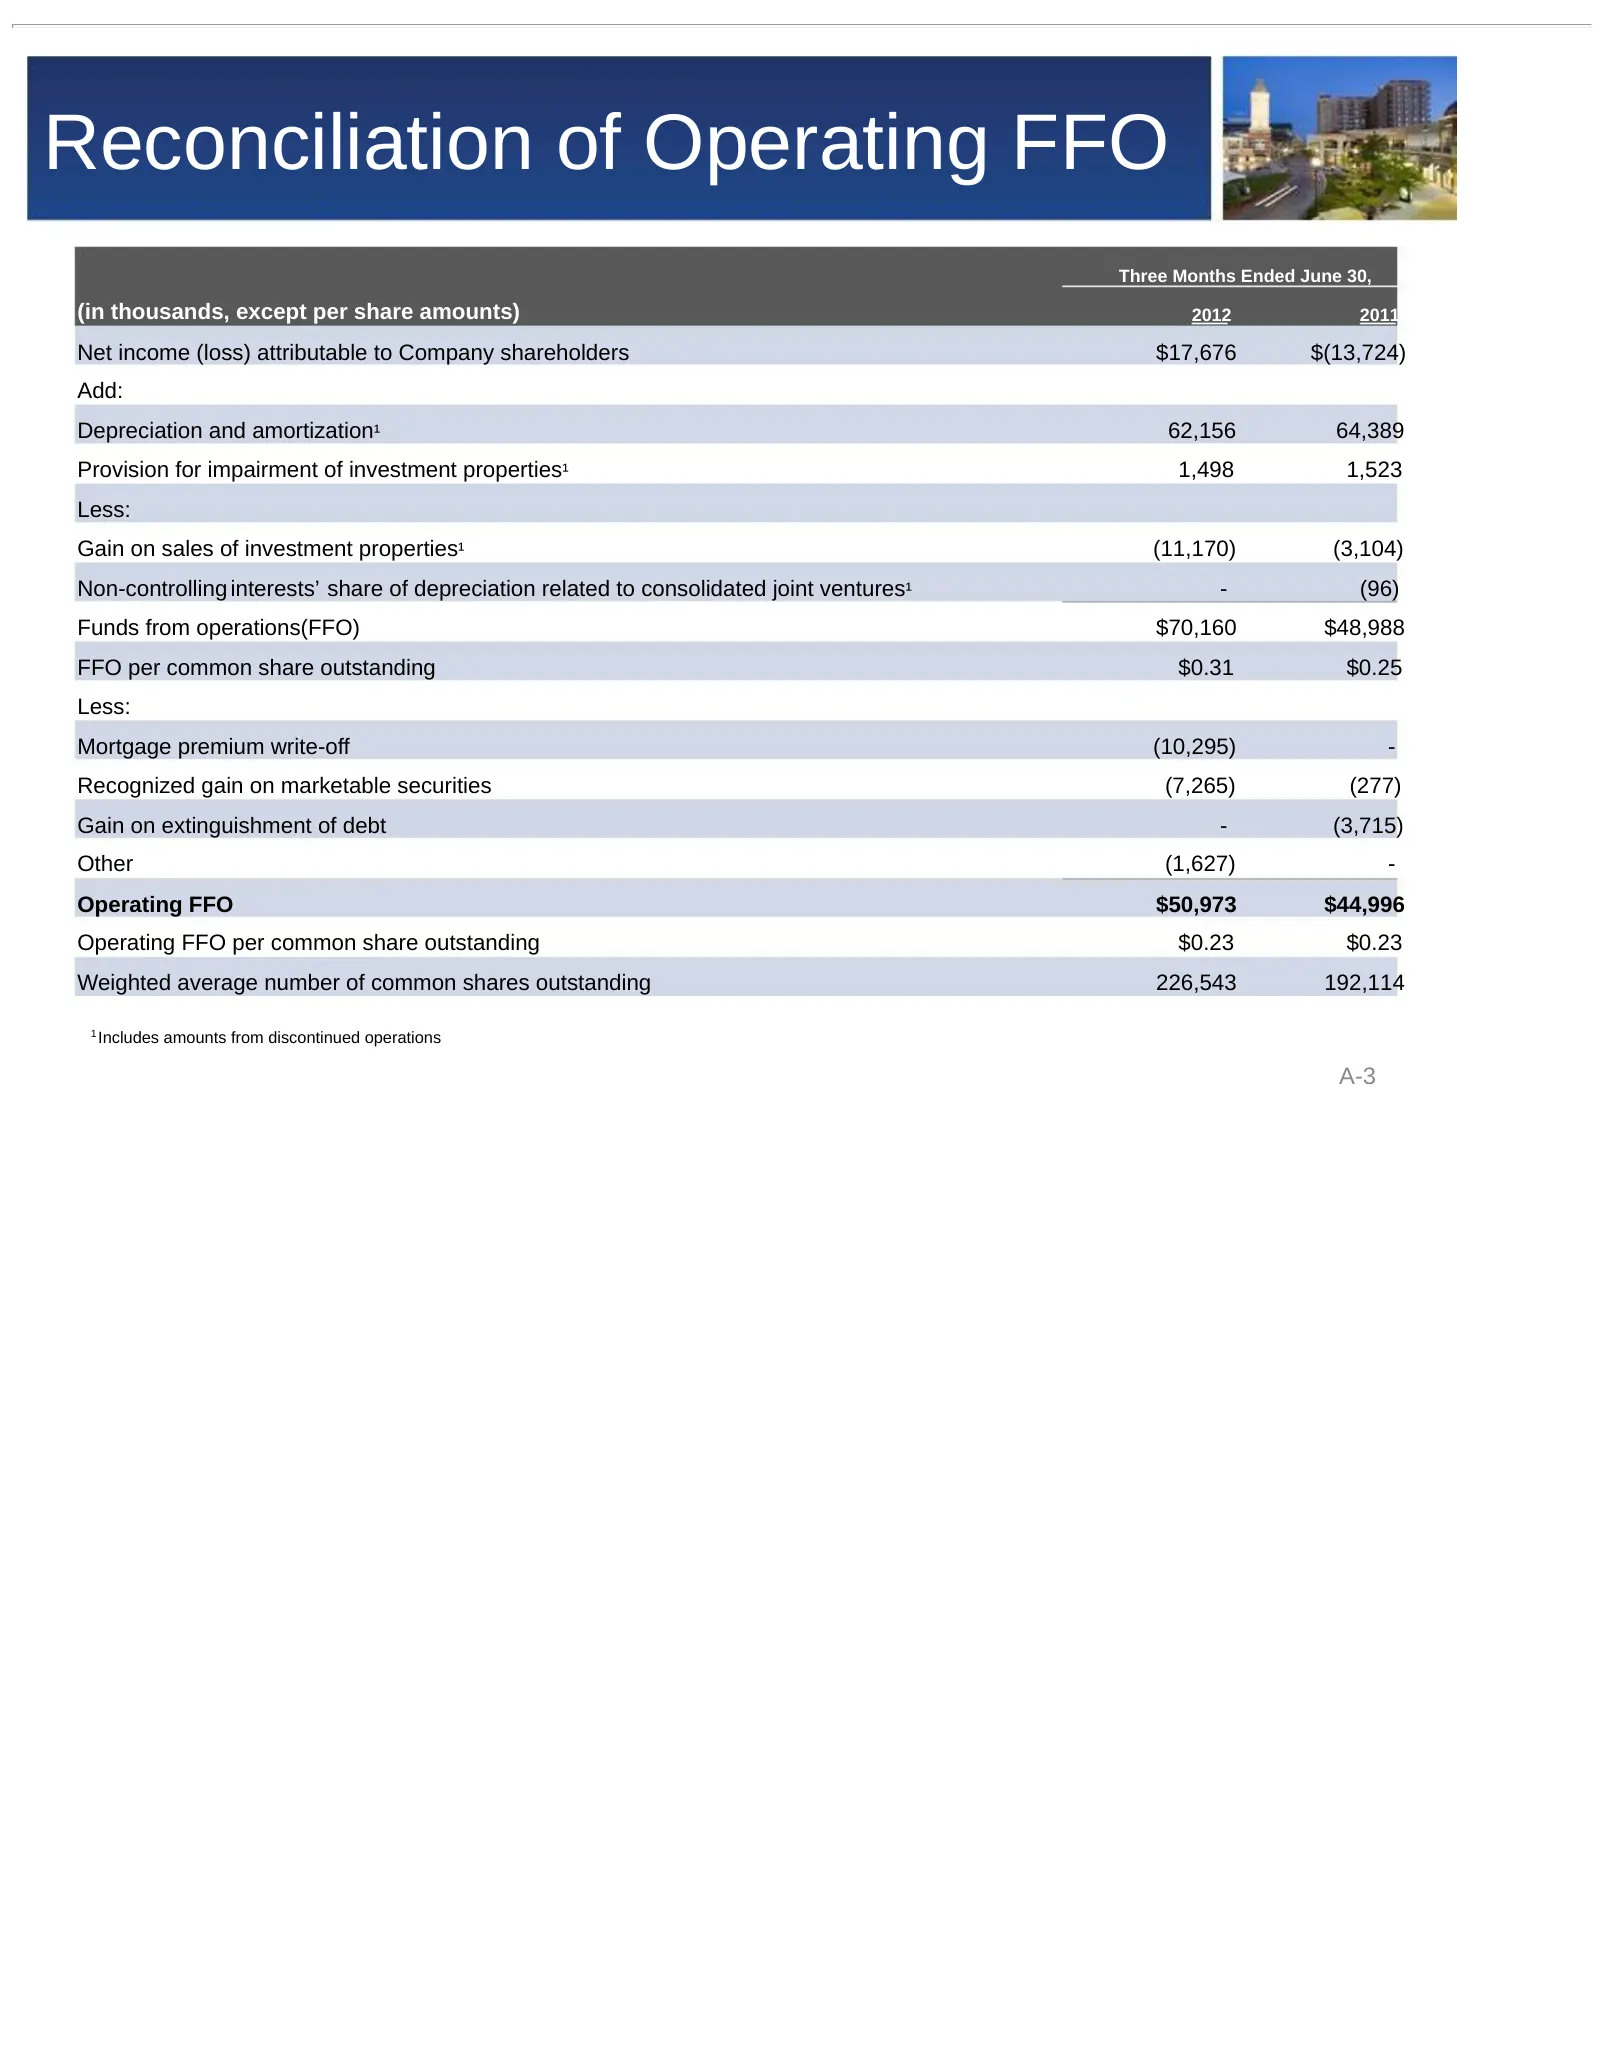
Reconciliation of Operating FFO Three Months Ended June 30, (in thousands, except per share amounts) 2012 2011 Net income (loss) attributable to Company shareholders $17,676 $(13,724) Add: Depreciation and amortization¹ 62,156 64,389 Provision for impairment of investment properties¹ 1,498 1,523 Les
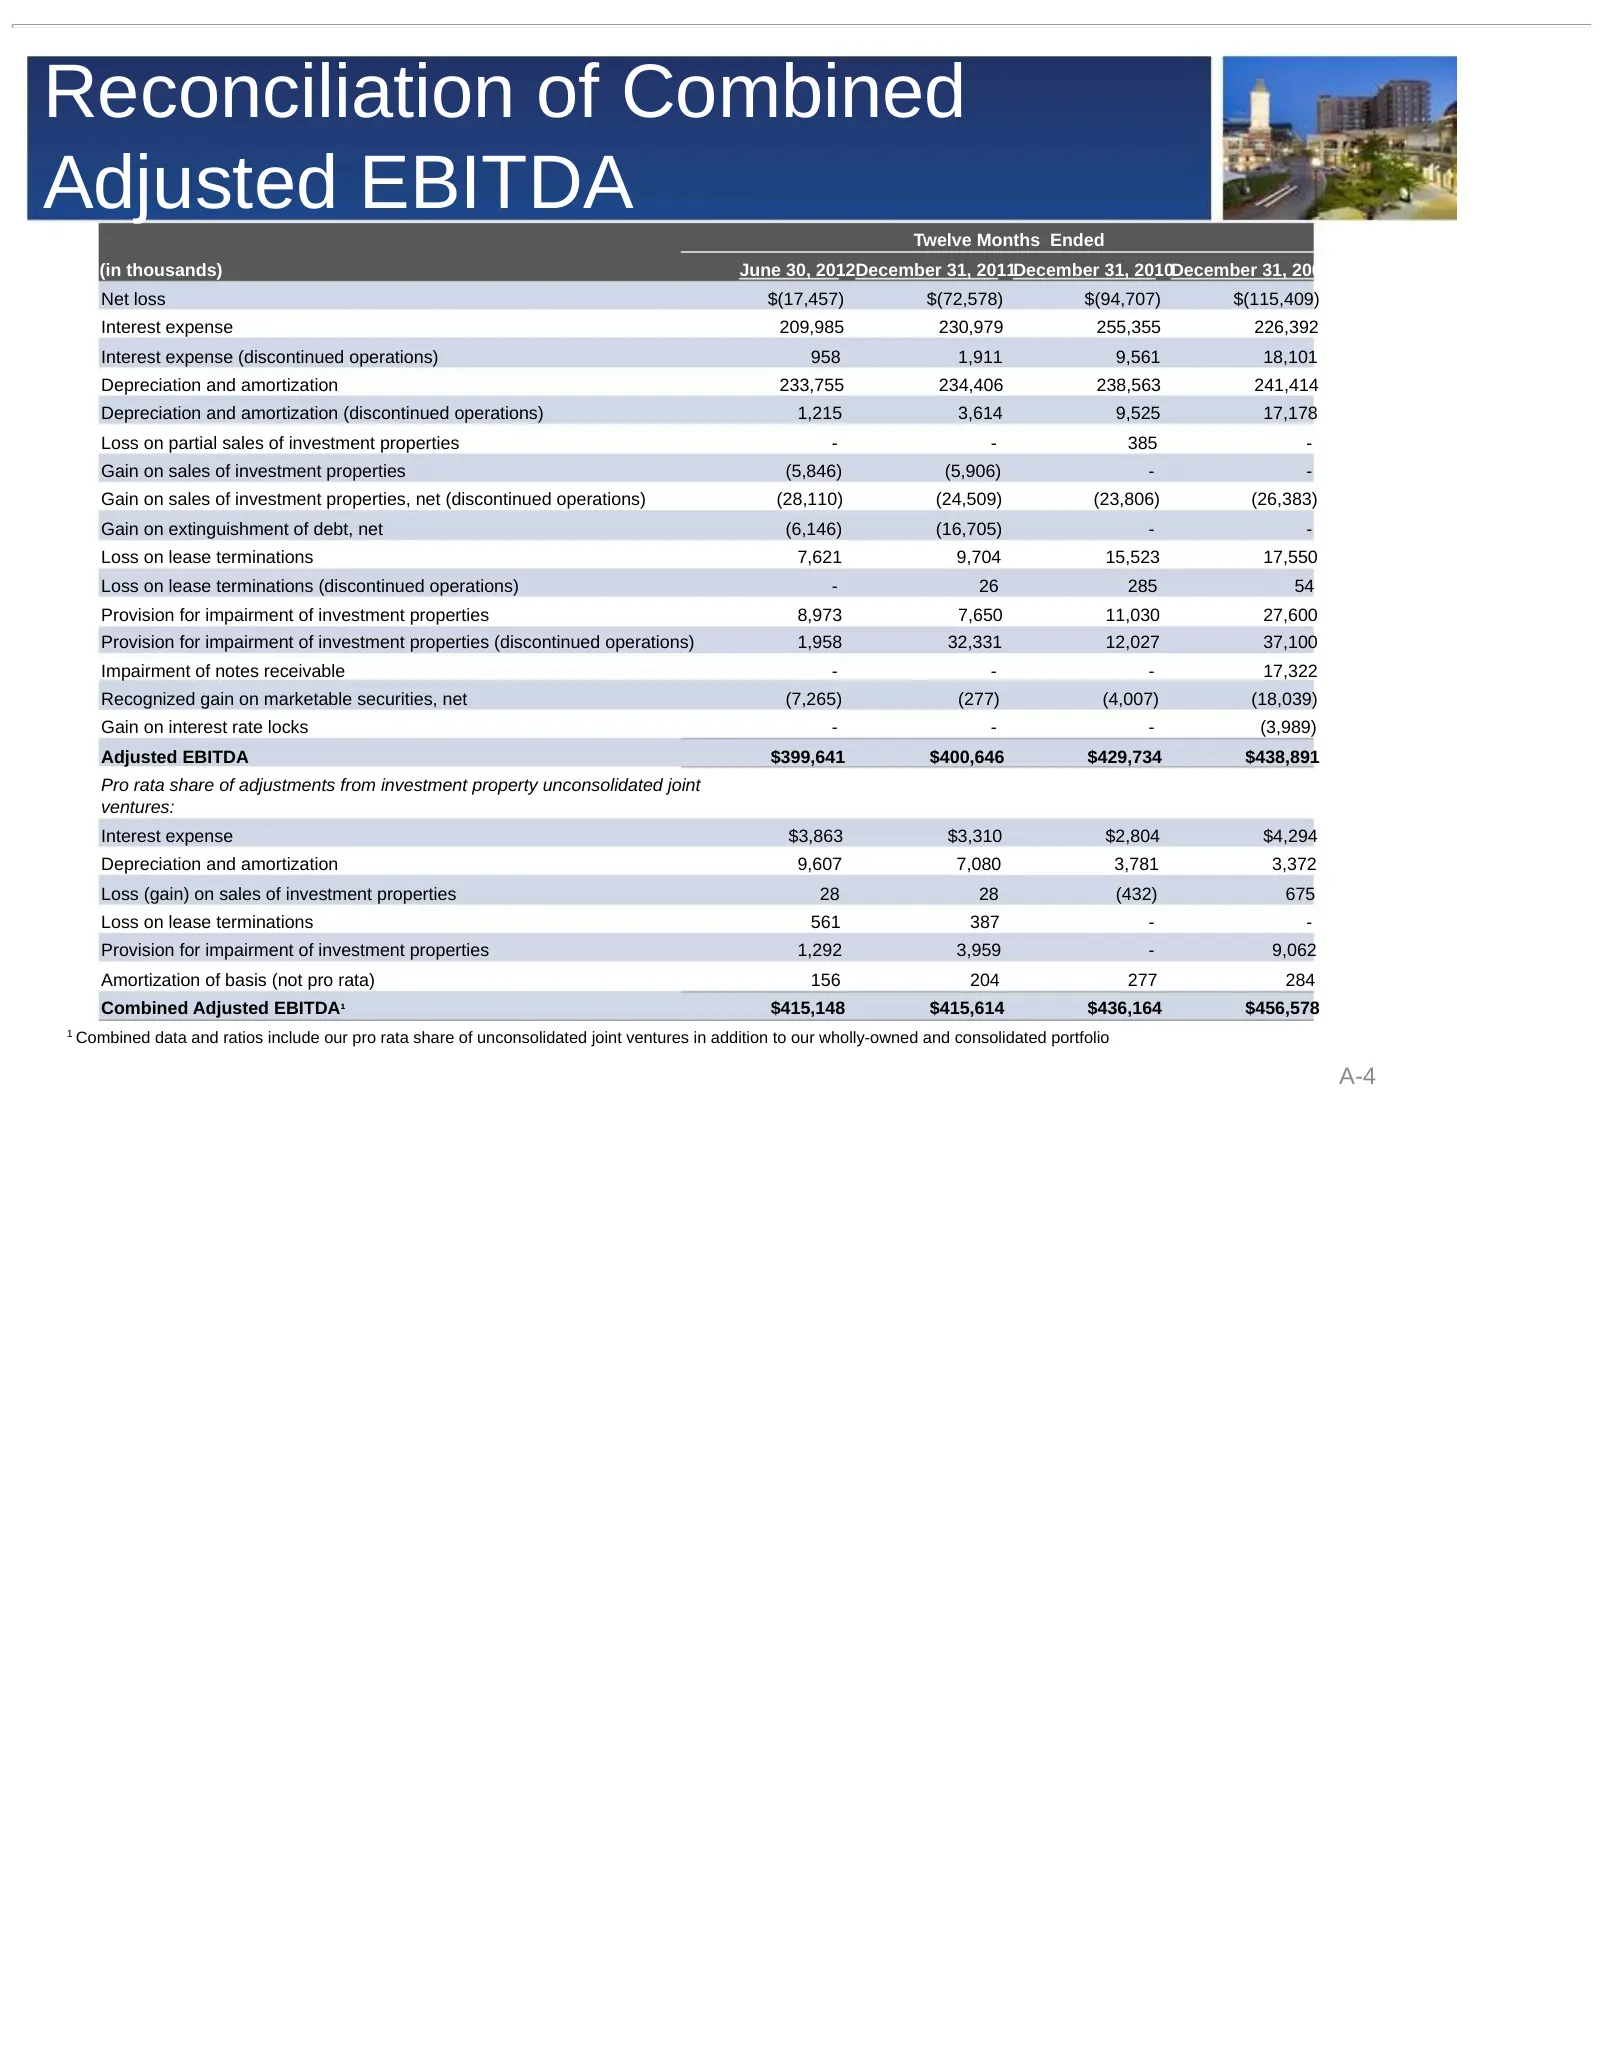
Slide 29: Reconciliation of Combined Adjusted EBITDA
Reconciliation of Combined Adjusted EBITDA Twelve Months Ended (in thousands) June 30, 2012December 31, 2011December 31, 2010December 31, 2009 Net loss $(17,457) $(72,578) $(94,707) $(115,409) Interest expense 209,985 230,979 255,355 226,392 Interest expense (discontinued operations) 958 1,911 9,561
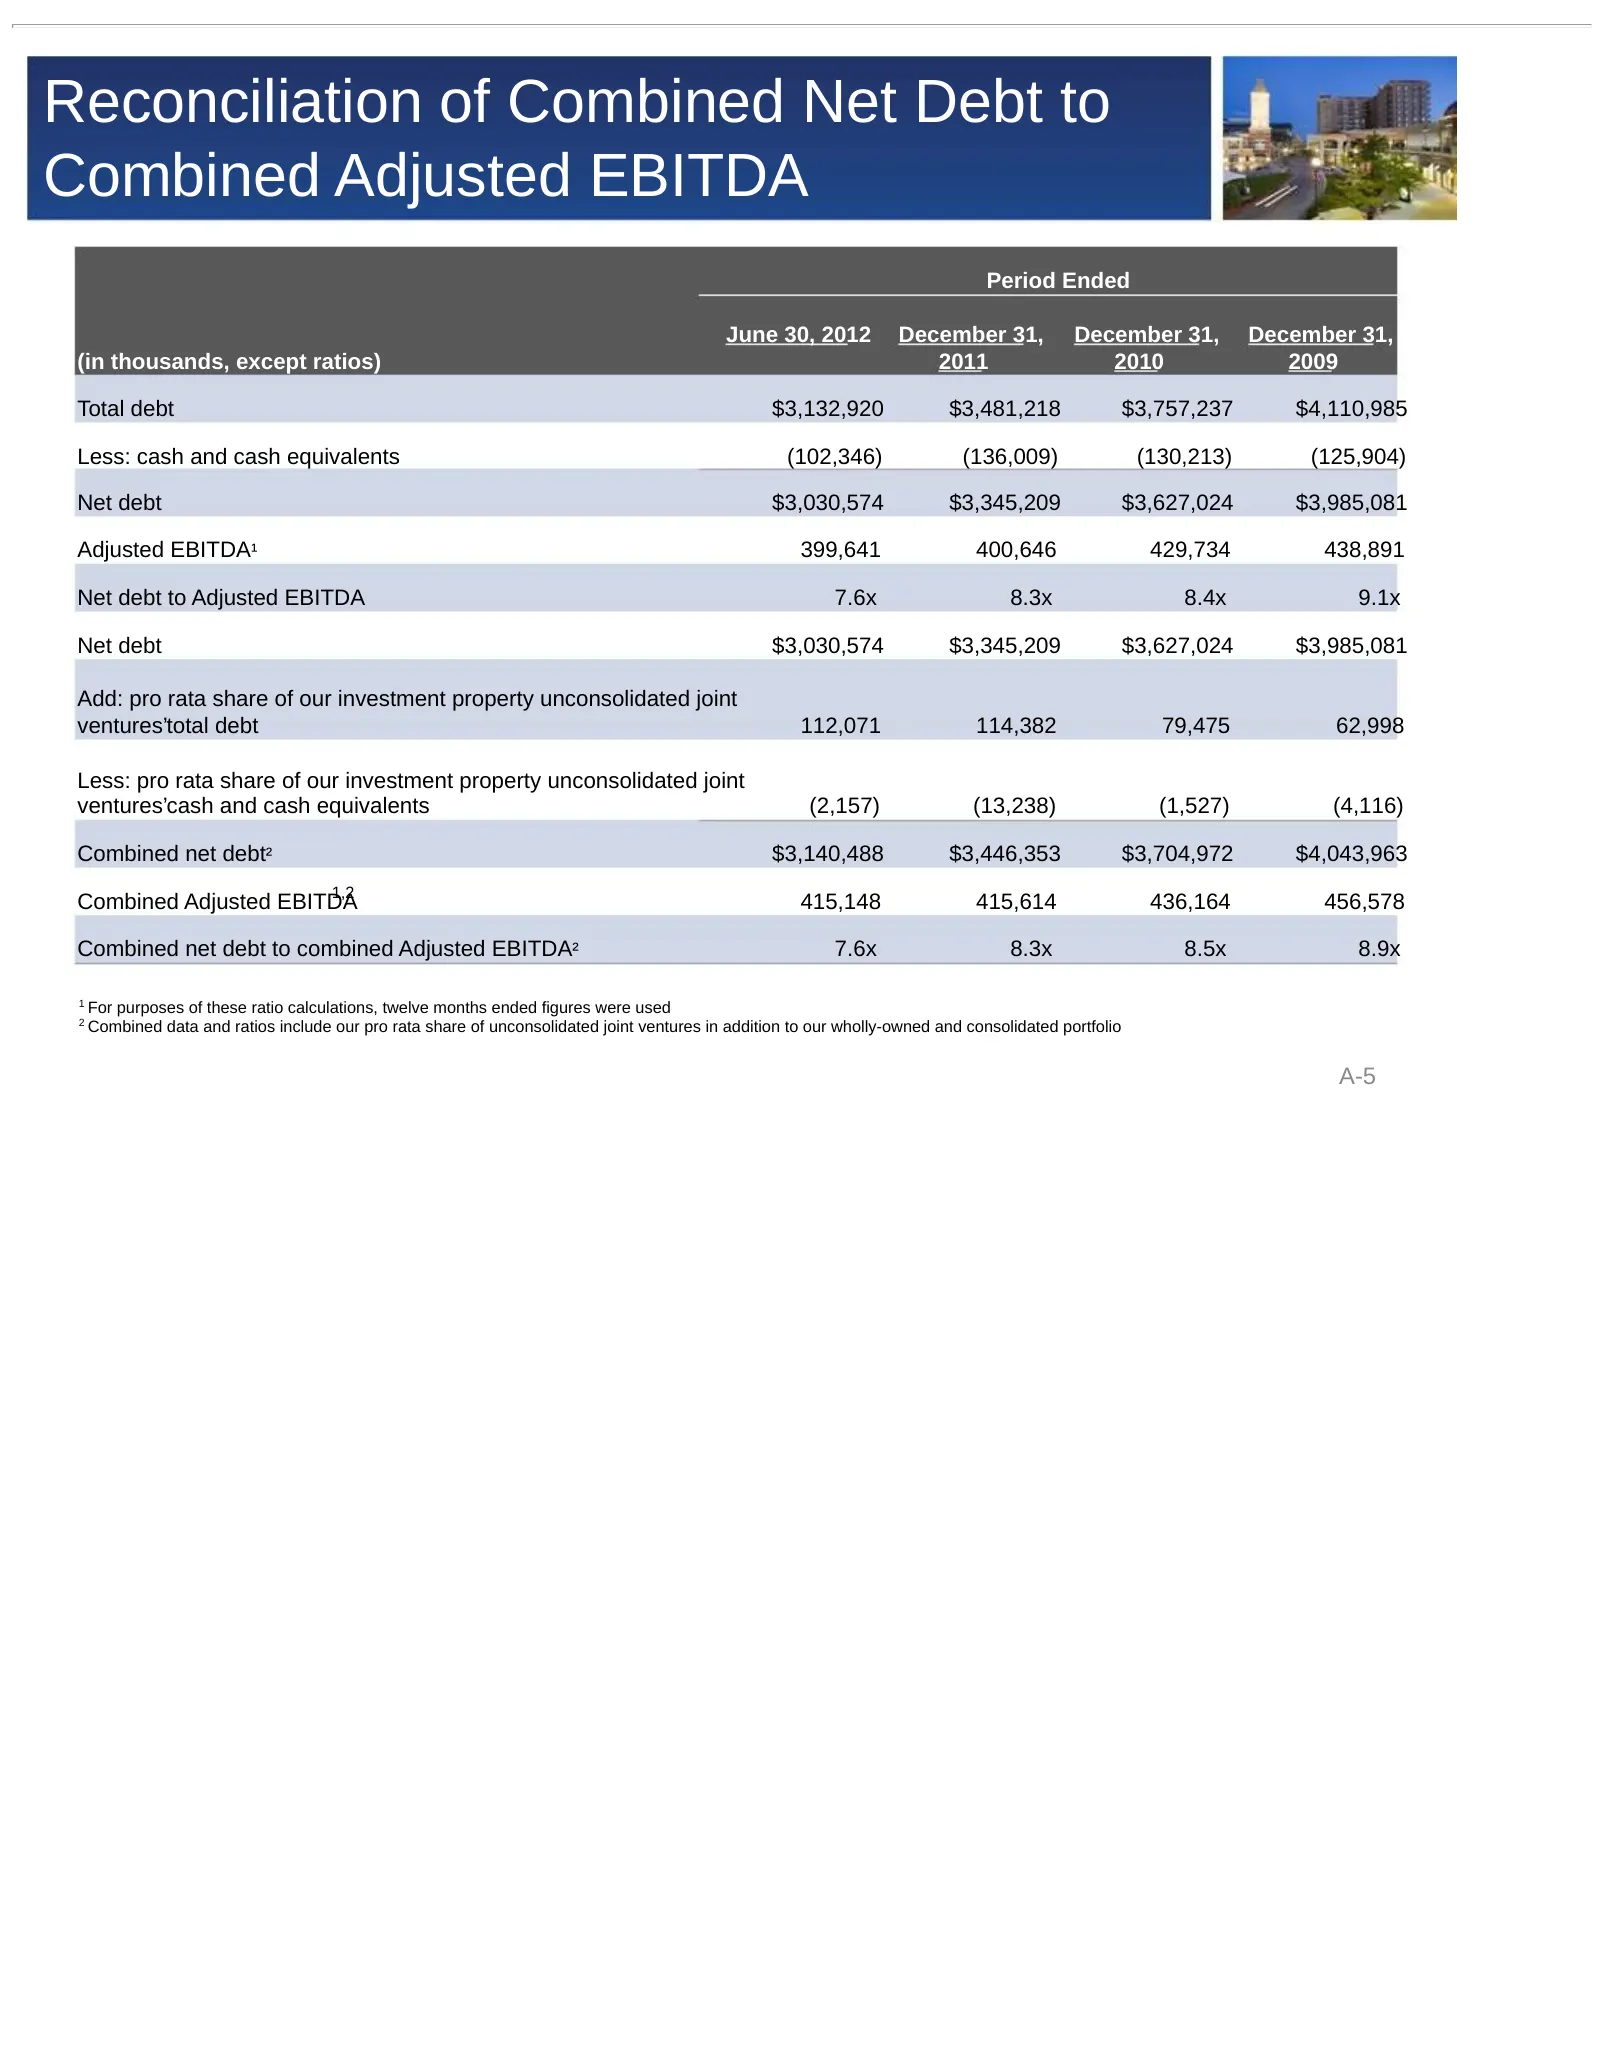
Slide 30: Reconciliation of Combined Net Debt to Combined Adjusted EBITDA
Reconciliation of Combined Net Debt to Combined Adjusted EBITDA Period Ended June 30, 2012 December 31, December 31, December 31, (in thousands, except ratios) 2011 2010 2009 Total debt $3,132,920 $3,481,218 $3,757,237 $4,110,985 Less: cash and cash equivalents (102,346) (136,009) (130,213) (125,904
Slide 31
Source: SEC EDGAR · 8-K filed Oct 2, 2012
More decks from Retail Properties of America Inc
 Merger or Acquisition (July 2021)17 slides · Jul 19, 2021
 Investor Presentation (July 2020)23 slides · Jul 17, 2020
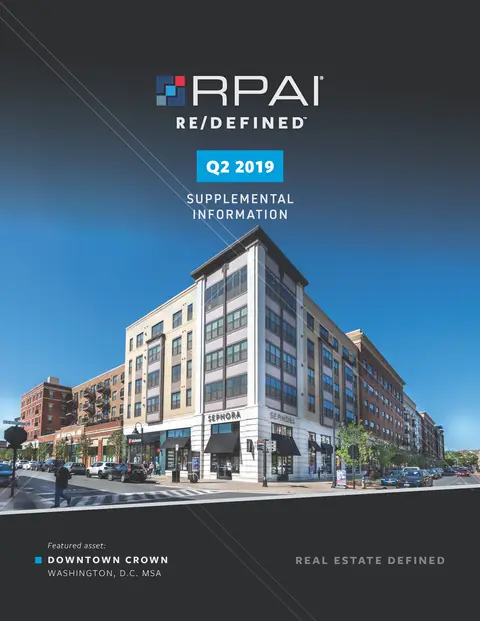 Q2 2019 Earnings Presentation5 slides · Jul 30, 2019
 Investor Day (September 2016)100 slides · Sep 21, 2016
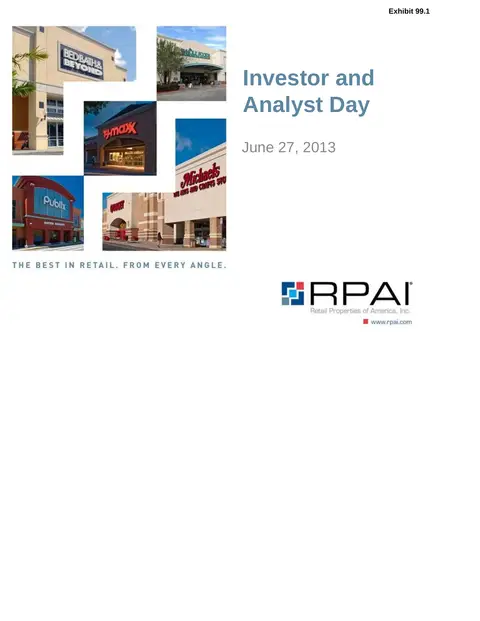 Investor Day (June 2013)68 slides · Jun 27, 2013
 Q4 2012 Earnings Presentation21 slides · Feb 26, 2013