Freedom Financial Holdings Inc · OTC:FDVA
Freedom Financial — Investor Presentation (August 2020)
38 slides from Freedom Financial's investor presentation, August 2020
Slide 1: Presentation to Investors
Presentation to Investors August 2020 Joseph J. Thomas – President and CEO · freedom.bank ·
Slide 2: Disclosure
Disclosure This presentation contains forward-looking statements, including our expectations with respect to future events that are subject to various risks and uncertainties. Factors that could cause actual results to differ materially from management's projections, forecasts, estimates, and expect
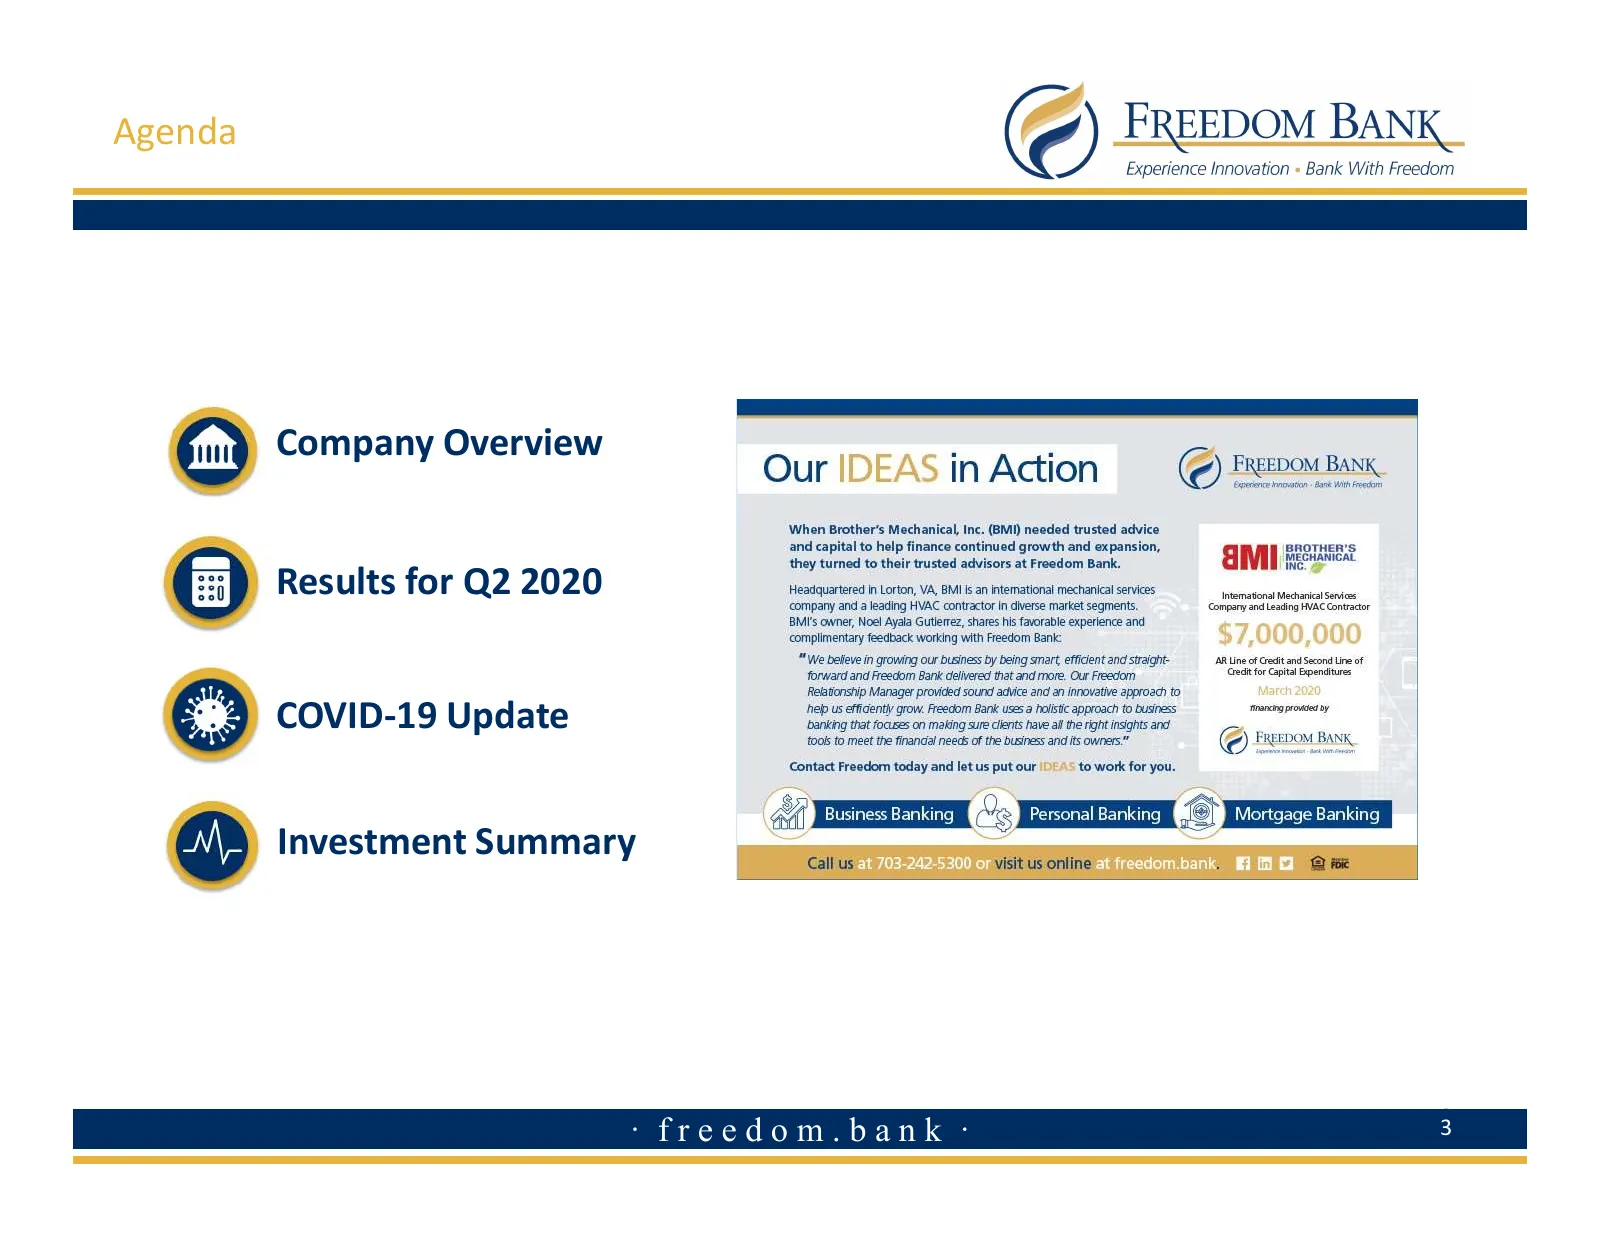
Slide 3: Agenda
Agenda Company Overview Results for Q2 2020 COVID-19 Update Investment Summary · freedom.bank · 33
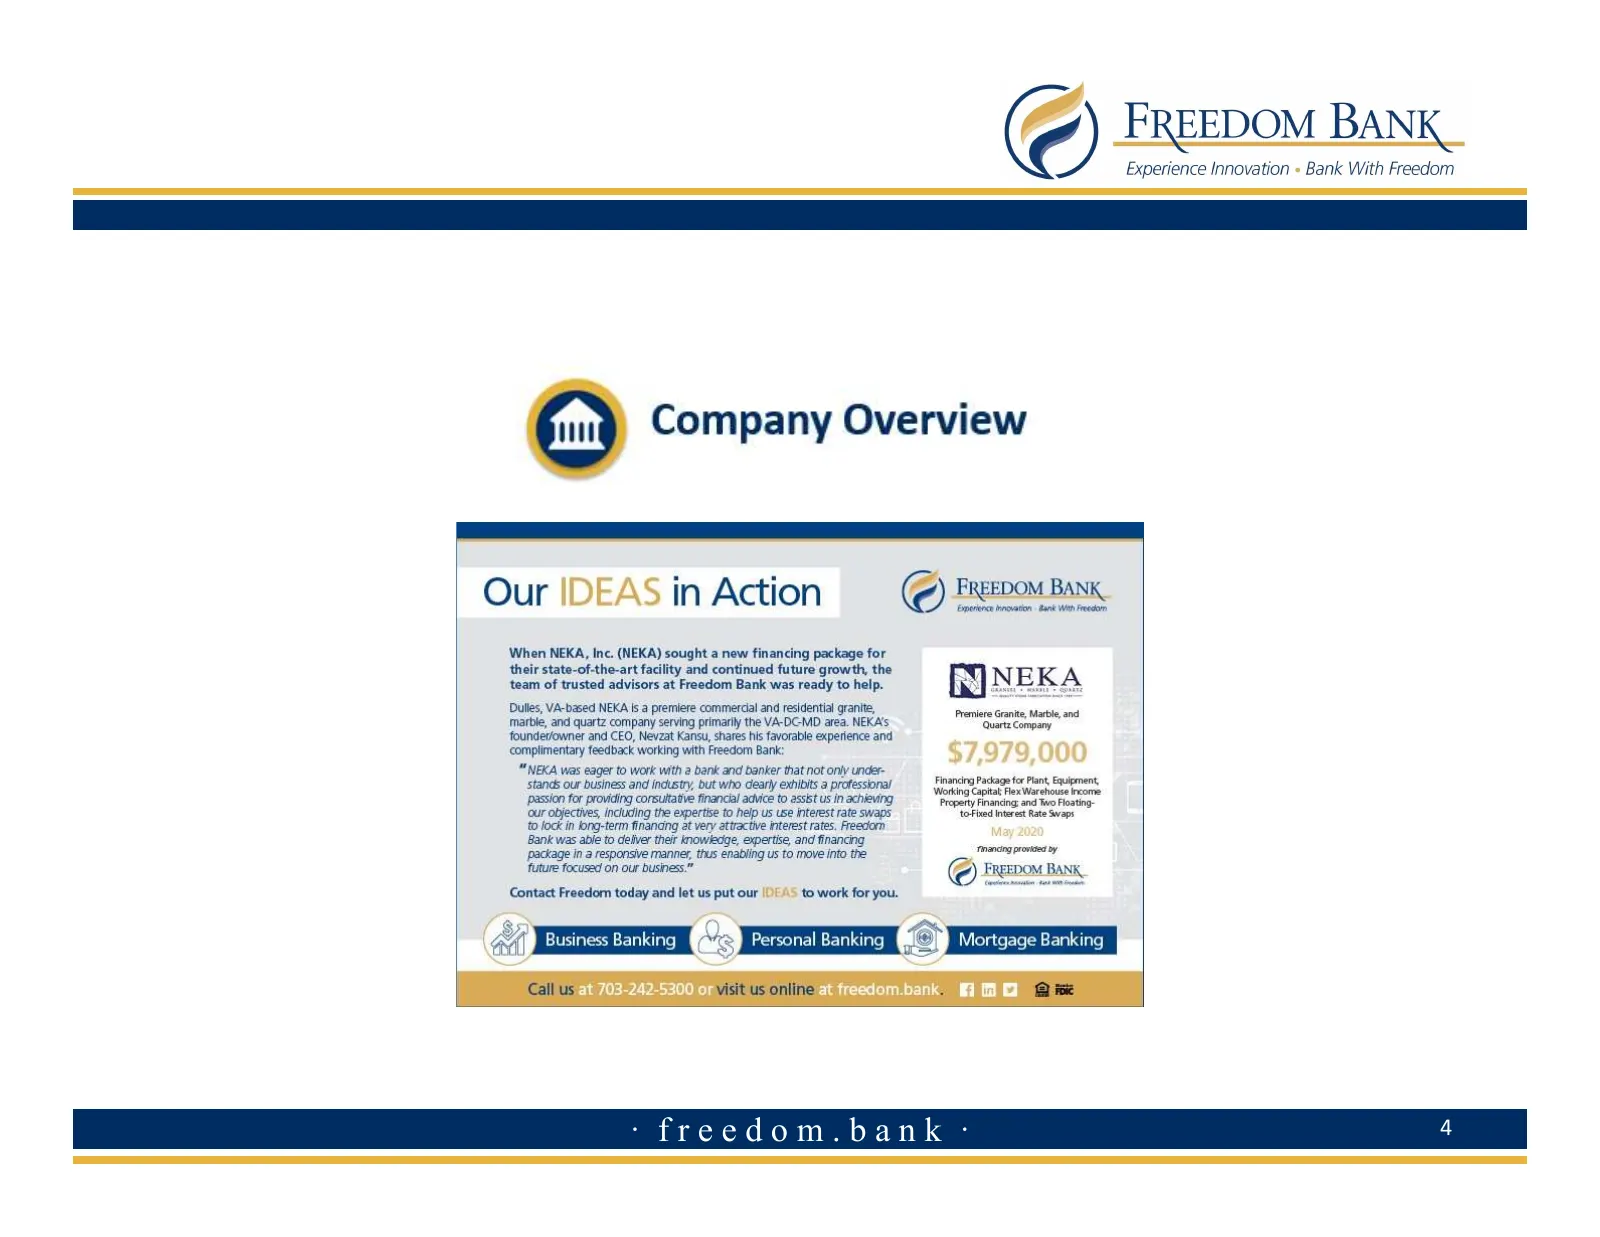
Slide 4: Company Overview
FREEDOM BANK Experience Innovation + Bank With Freedom Company Overview Our !DEAS in Action When NEKA, Inc. (NEKA) sought a new financing package for their state-of-the-art facility and continued future growth, the team of trusted advisors at Freedom Bank was ready to help. Dulles, VA-based NEKA ls
Slide 5: Vision - Experience Innovation, Bank with Freedom
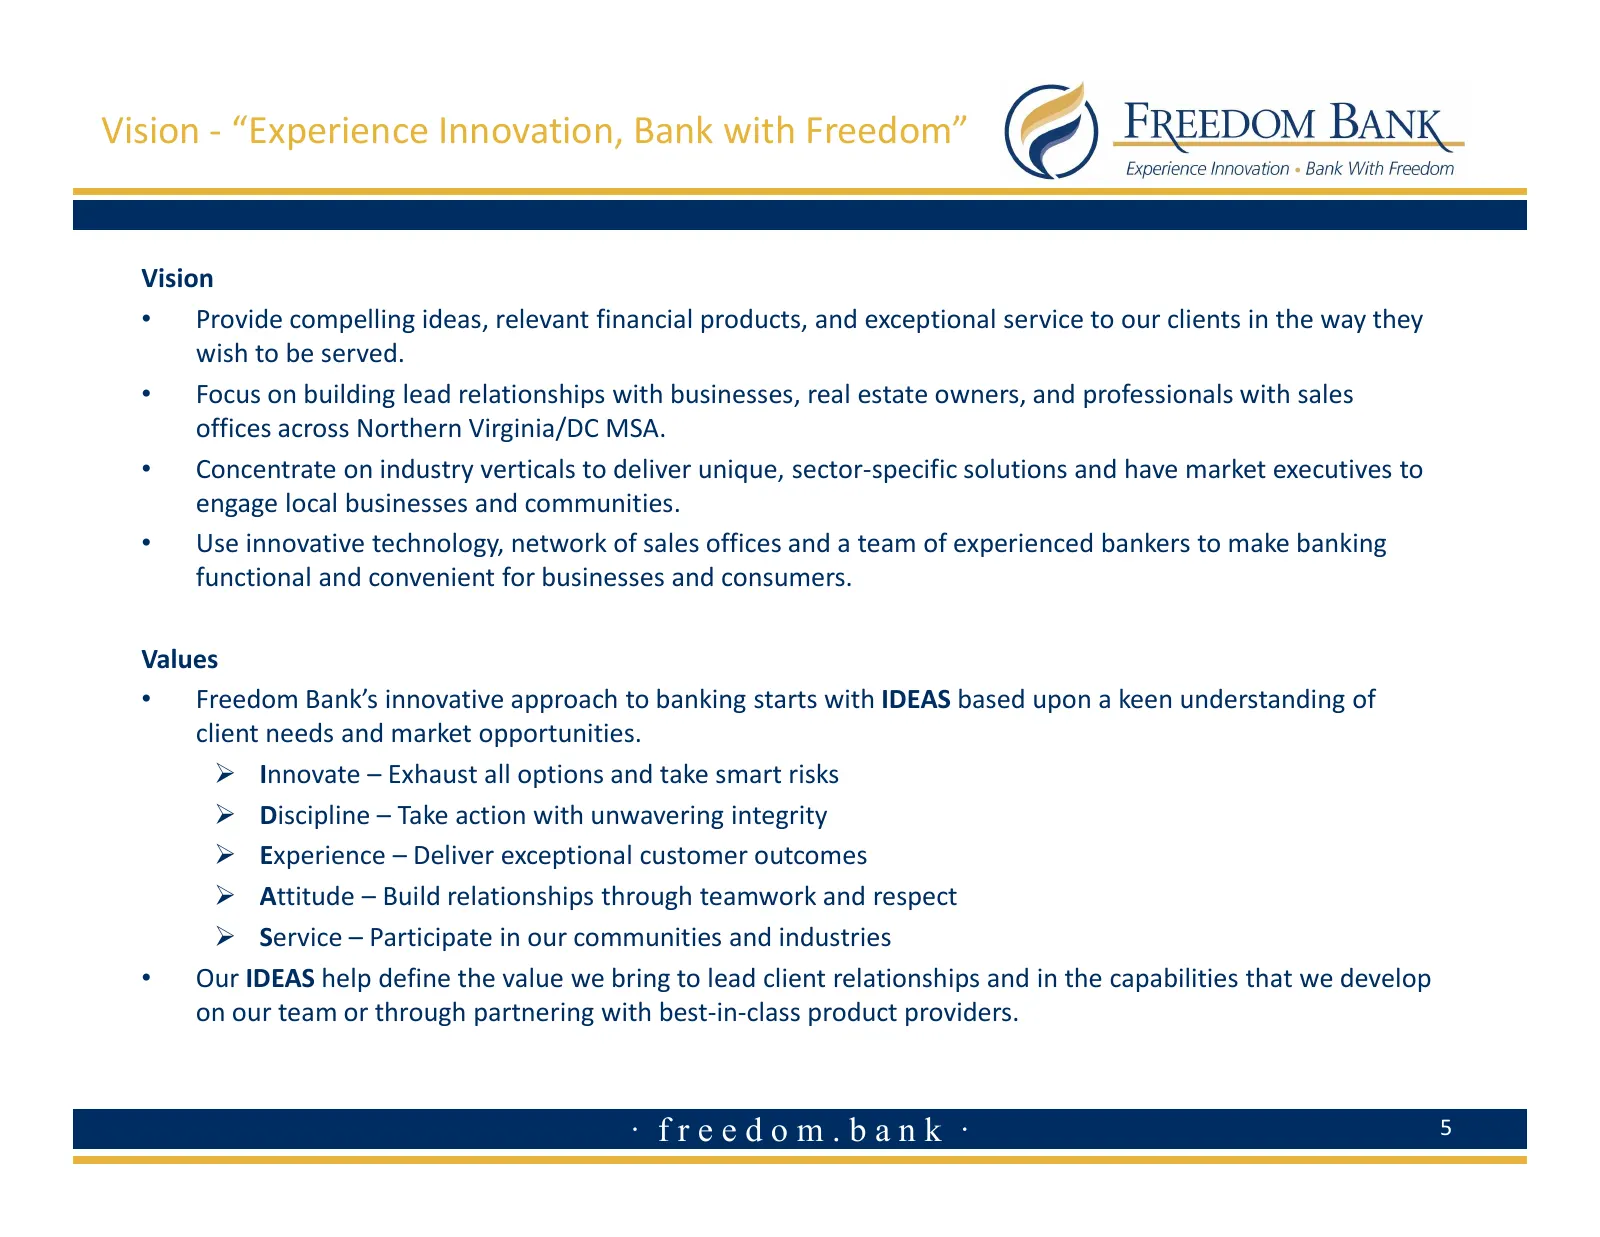
Vision - “Experience Innovation, Bank with Freedom” Vision • Provide compelling ideas, relevant financial products, and exceptional service to our clients in the way they wish to be served. • Focus on building lead relationships with businesses, real estate owners, and professionals with sales offic
Slide 6: Strategic Plan
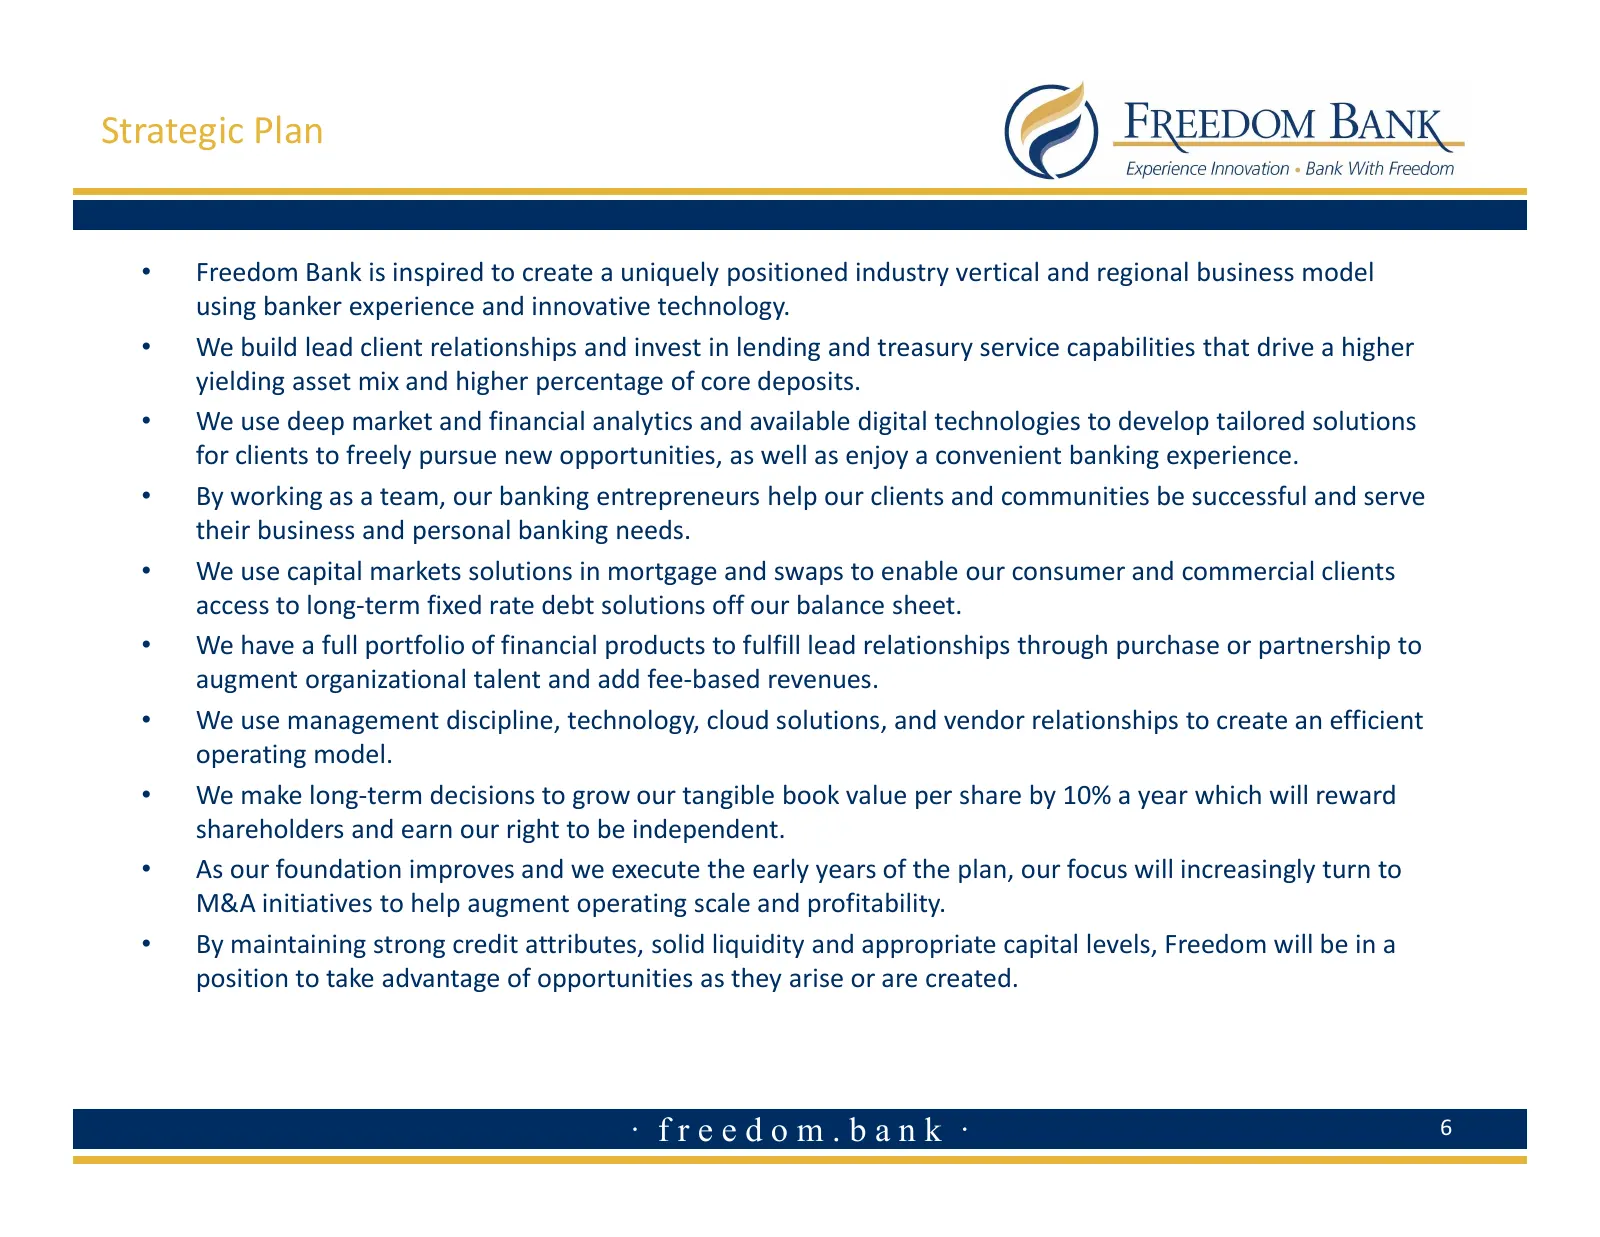
Strategic Plan • Freedom Bank is inspired to create a uniquely positioned industry vertical and regional business model using banker experience and innovative technology. • We build lead client relationships and invest in lending and treasury service capabilities that drive a higher yielding asset m
Slide 7: Franchise Overview
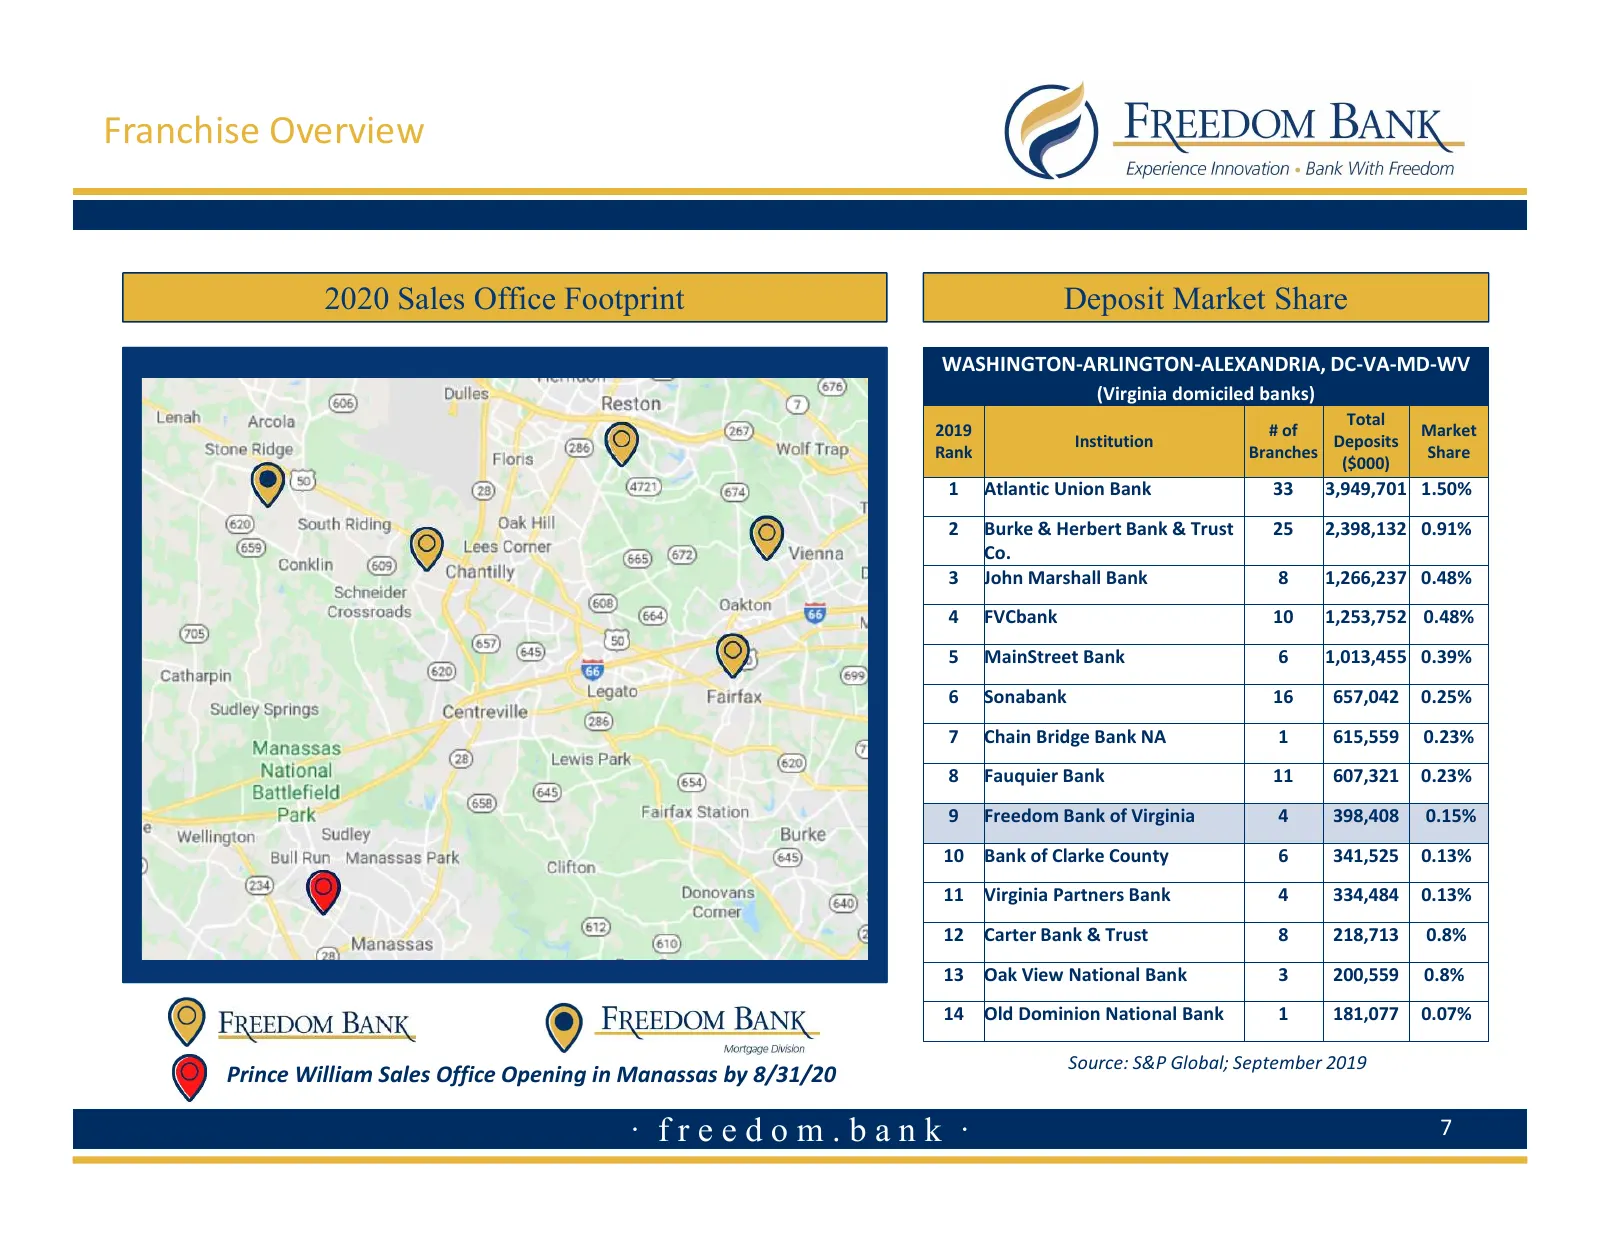
Franchise Overview 2020 Sales Office Footprint Deposit Market Share WASHINGTON-ARLINGTON-ALEXANDRIA, DC-VA-MD-WV (Virginia domiciled banks) Total 2019 # of Market Institution Deposits Rank Branches Share ($000) 1 Atlantic Union Bank 33 3,949,701 1.50% 2 Burke & Herbert Bank & Trust 25 2,398,132 0.91
Slide 8: Comprehensive & Diverse Business Units
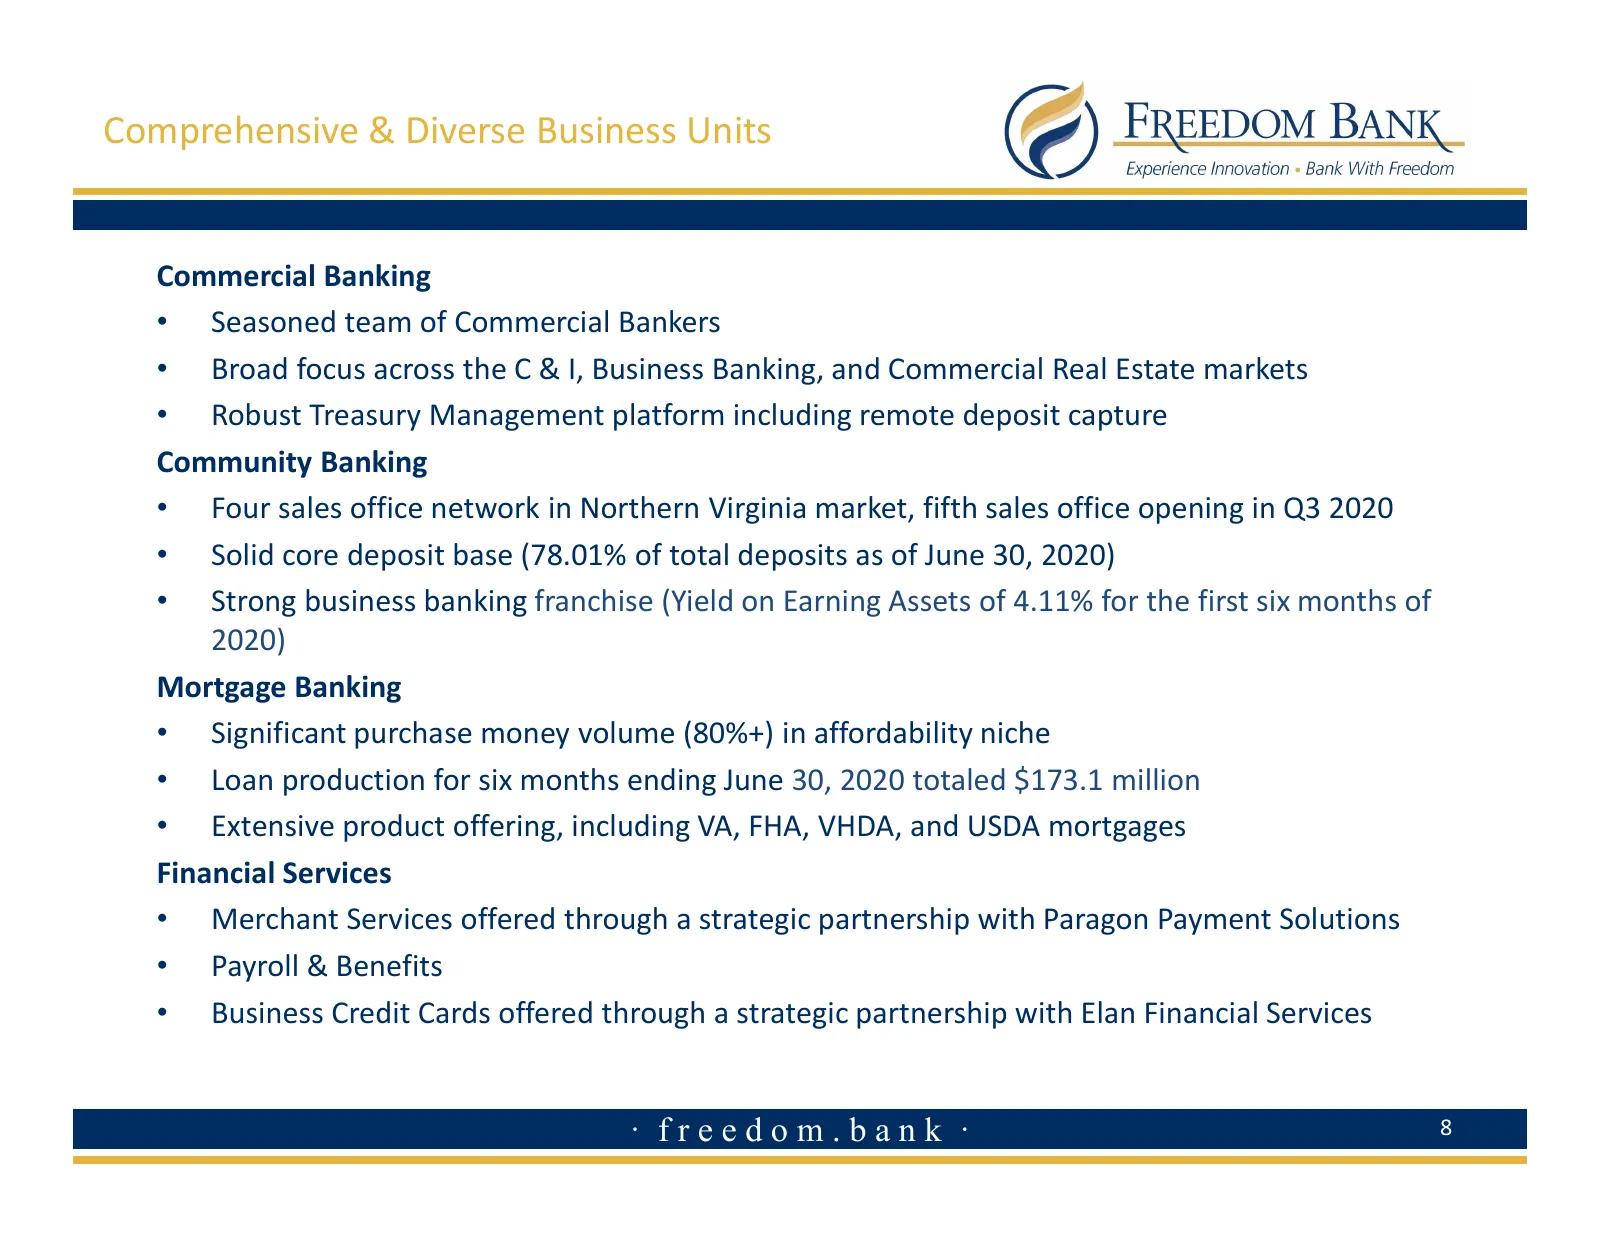
Comprehensive & Diverse Business Units Commercial Banking • Seasoned team of Commercial Bankers • Broad focus across the C & I, Business Banking, and Commercial Real Estate markets • Robust Treasury Management platform including remote deposit capture Community Banking • Four sales office network in
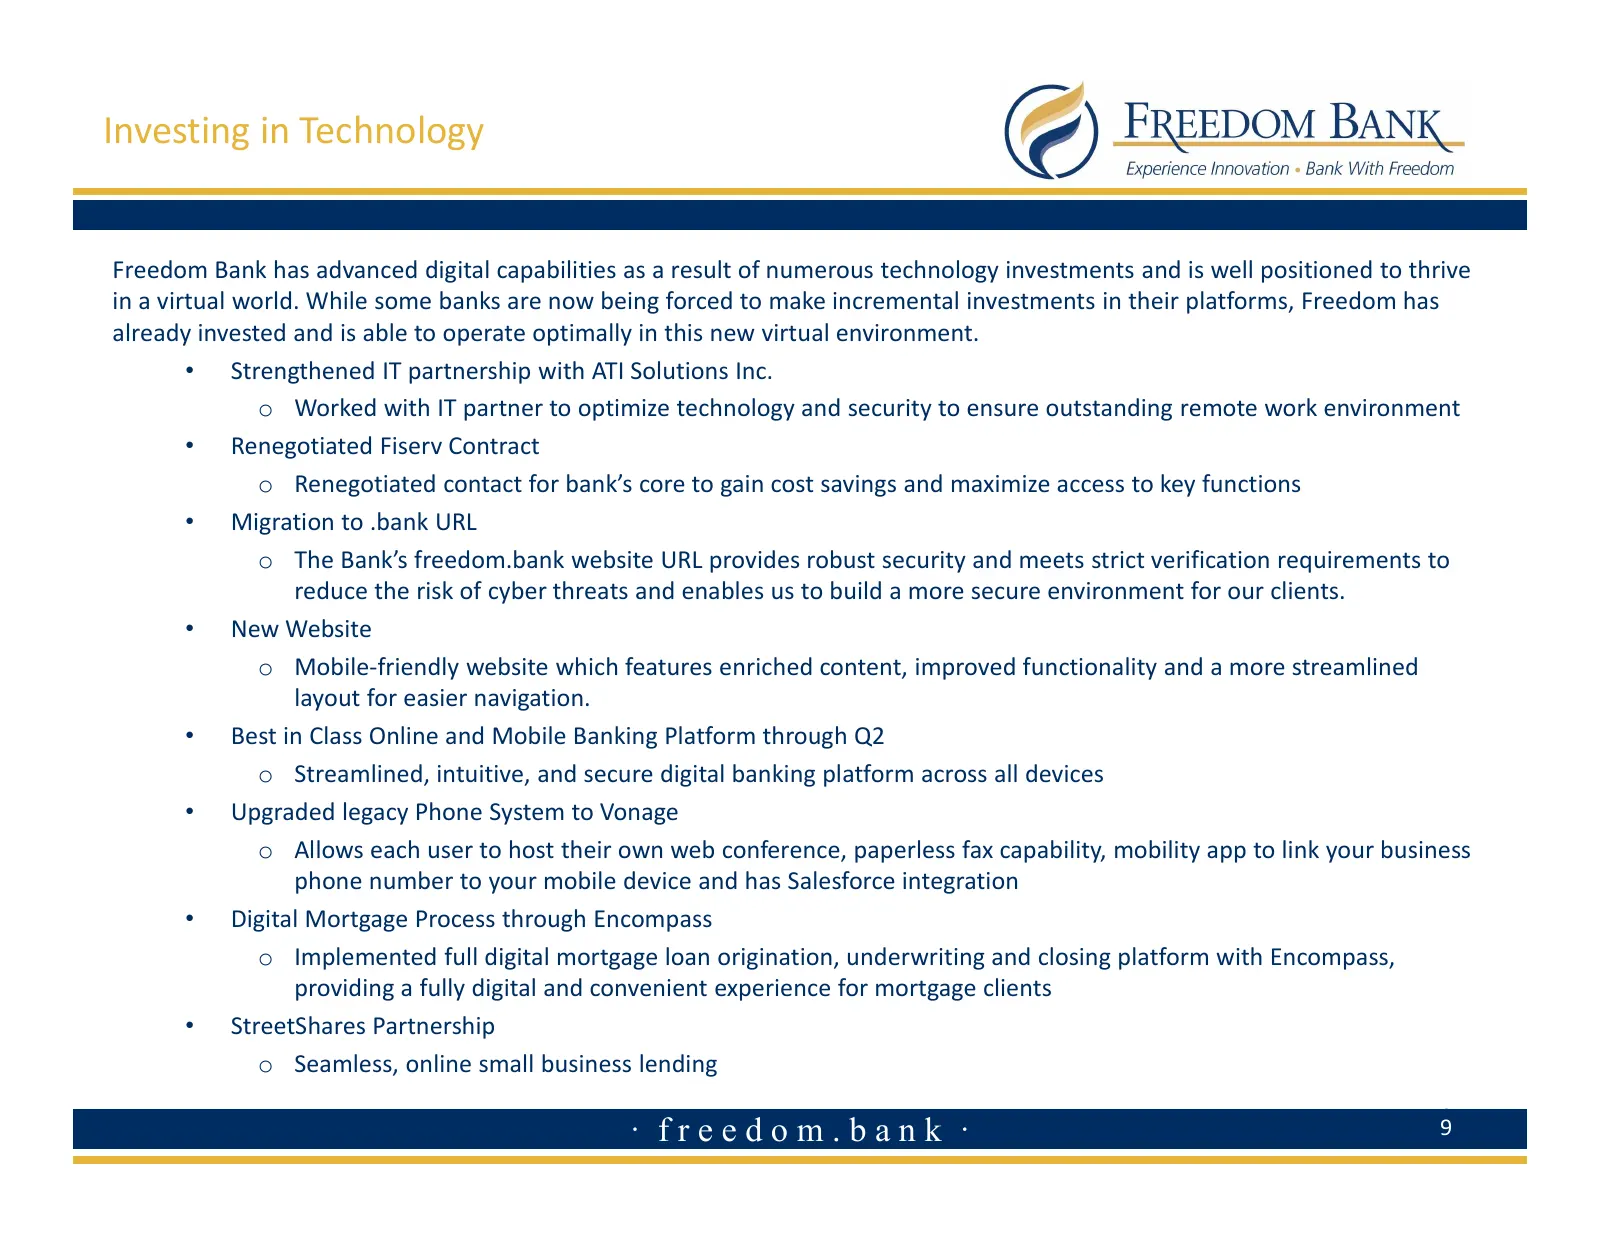
Slide 9: Investing in Technology
Investing in Technology Freedom Bank has advanced digital capabilities as a result of numerous technology investments and is well positioned to thrive in a virtual world. While some banks are now being forced to make incremental investments in their platforms, Freedom has already invested and is abl
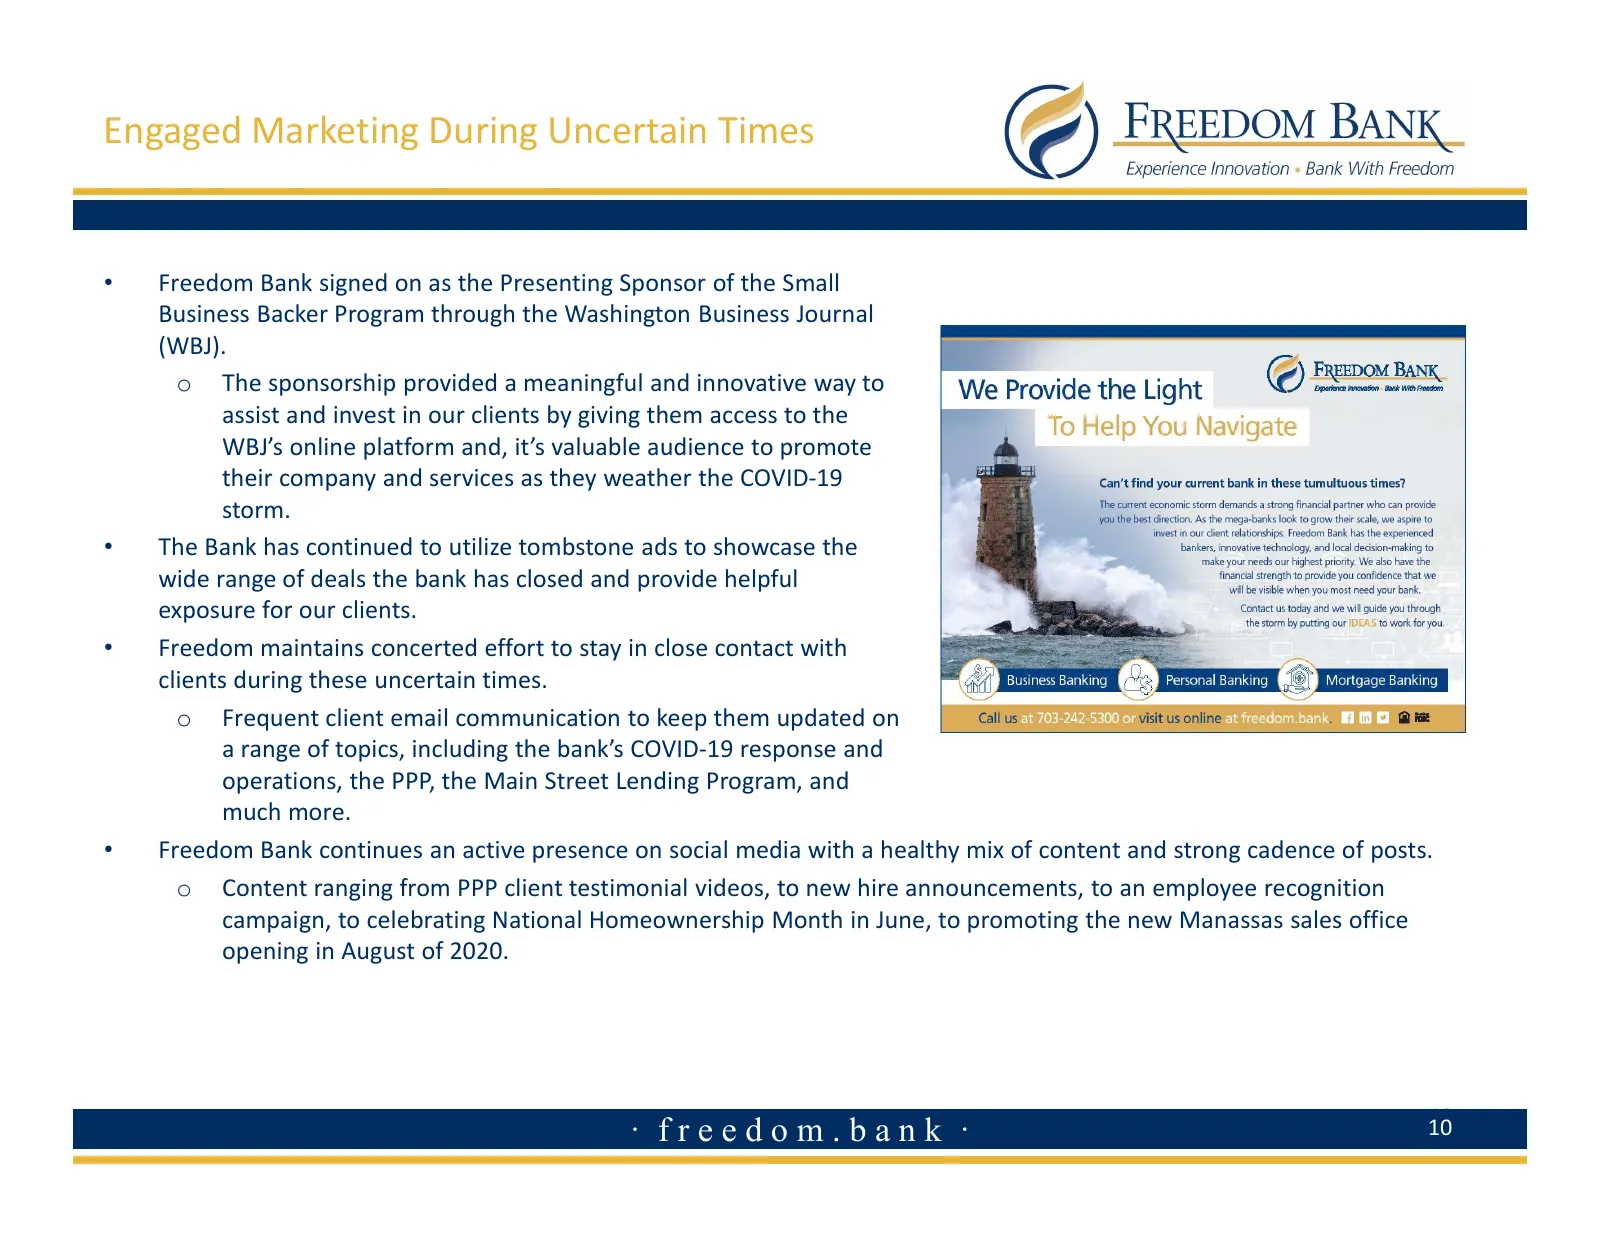
Slide 10: Engaged Marketing During Uncertain Times
Engaged Marketing During Uncertain Times • Freedom Bank signed on as the Presenting Sponsor of the Small Business Backer Program through the Washington Business Journal (WBJ). o The sponsorship provided a meaningful and innovative way to assist and invest in our clients by giving them access to the
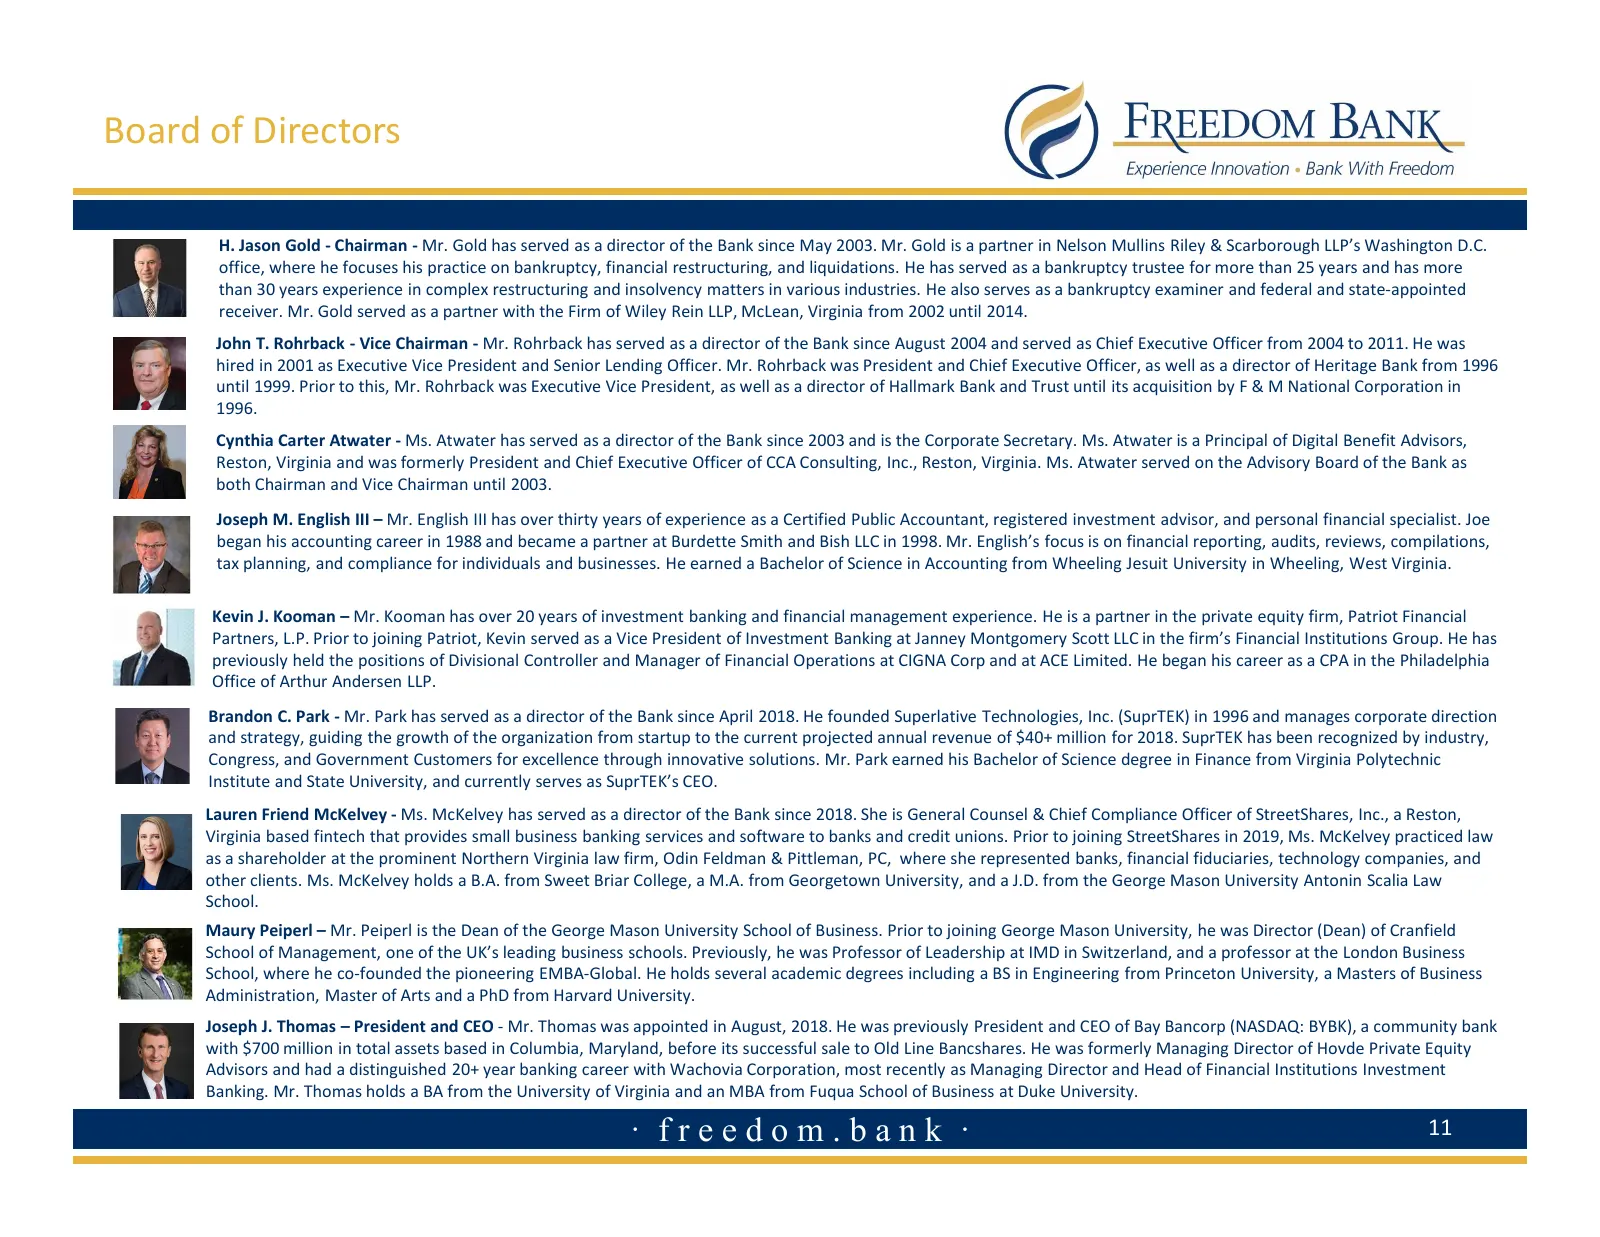
Slide 11: Board of Directors
Board of Directors H. Jason Gold - Chairman - Mr. Gold has served as a director of the Bank since May 2003. Mr. Gold is a partner in Nelson Mullins Riley & Scarborough LLP’s Washington D.C. office, where he focuses his practice on bankruptcy, financial restructuring, and liquidations. He has served
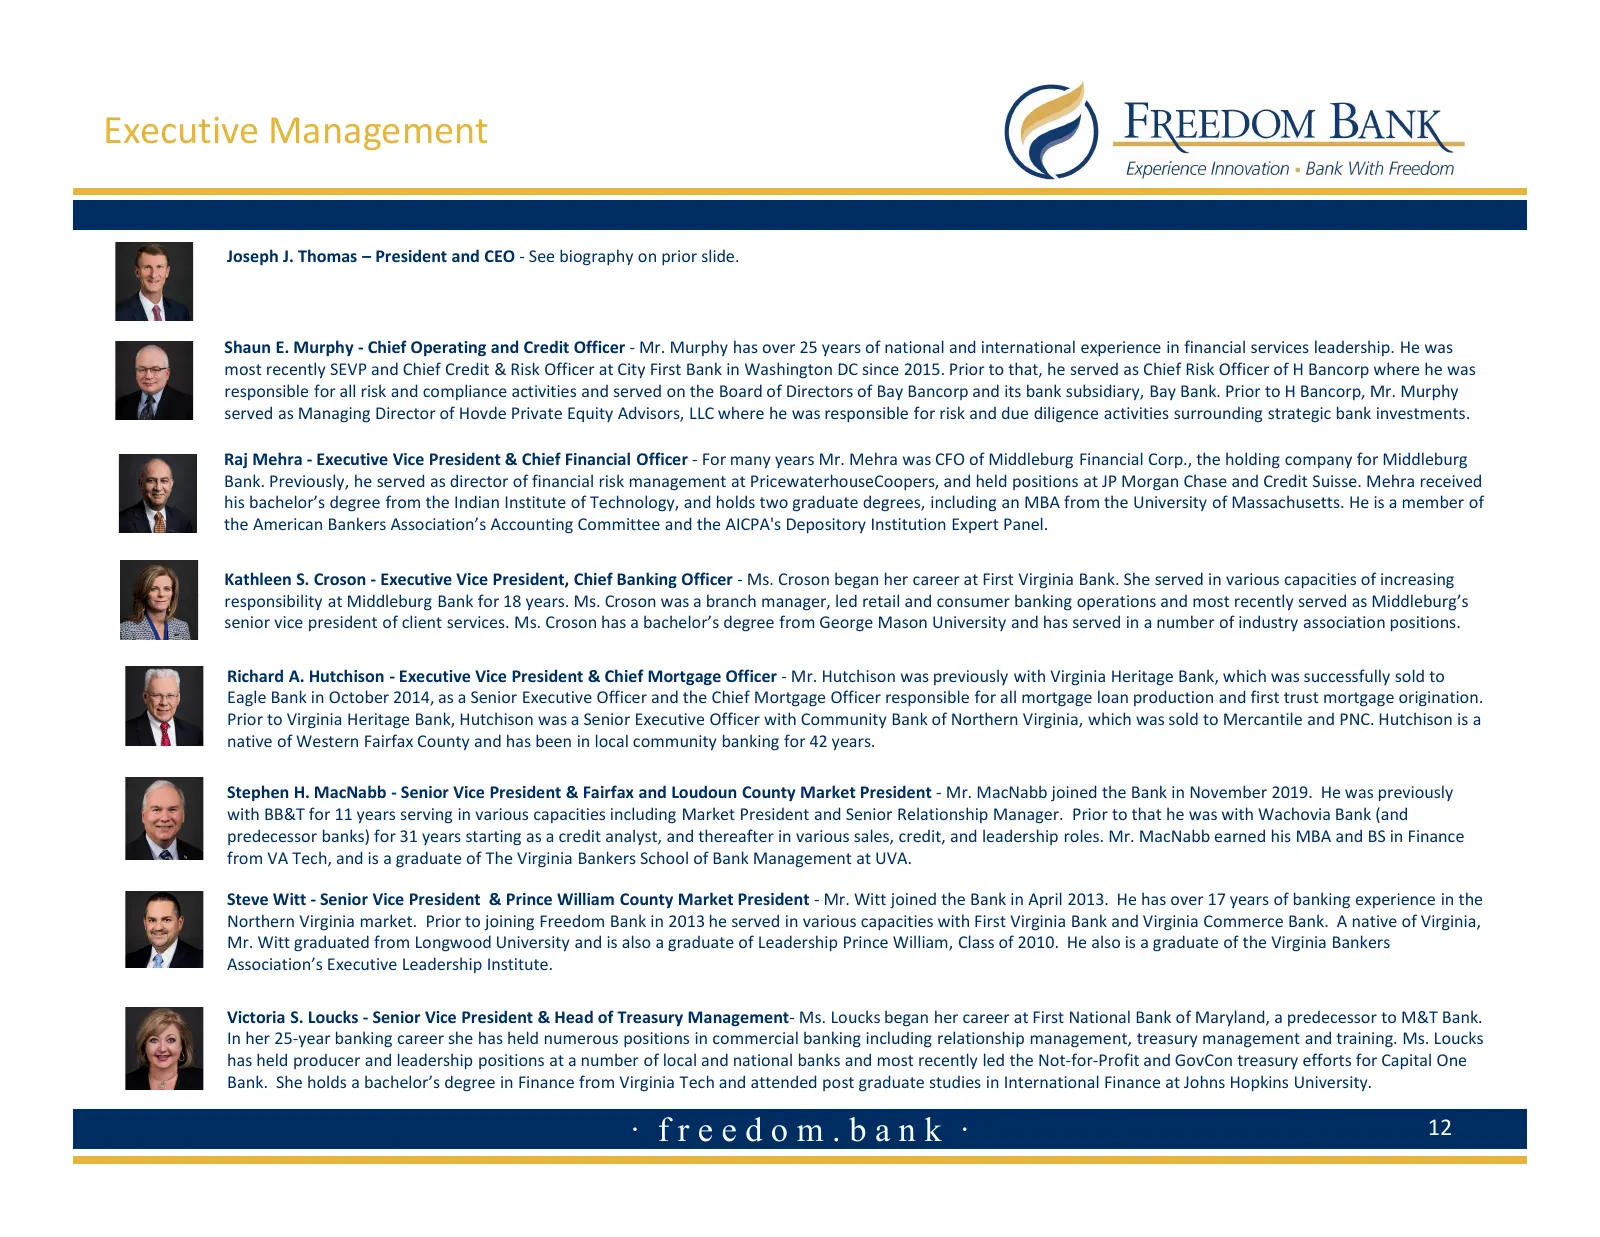
Slide 12: Executive Management
Executive Management Joseph J. Thomas – President and CEO - See biography on prior slide. Shaun E. Murphy - Chief Operating and Credit Officer - Mr. Murphy has over 25 years of national and international experience in financial services leadership. He was most recently SEVP and Chief Credit & Risk O
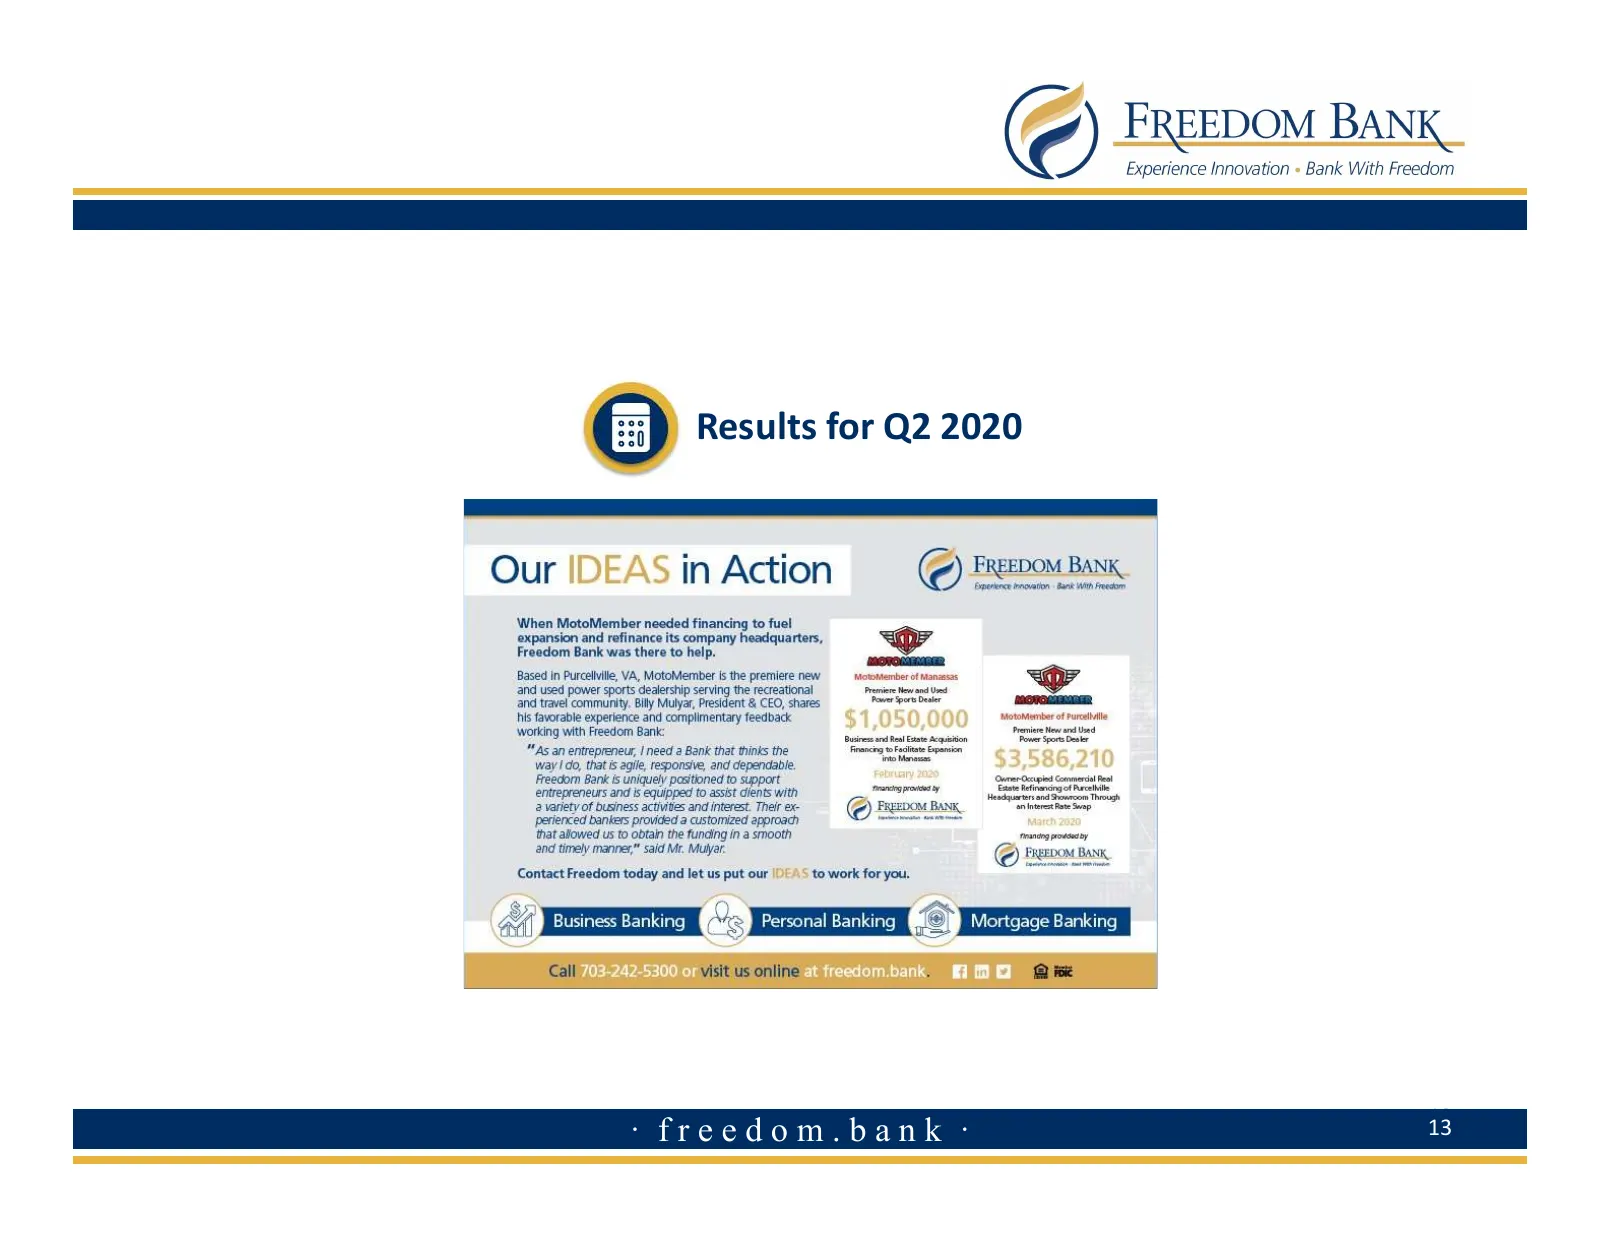
Slide 13: Results for Q2 2020
Results for Q2 2020 13 · freedom.bank · 13
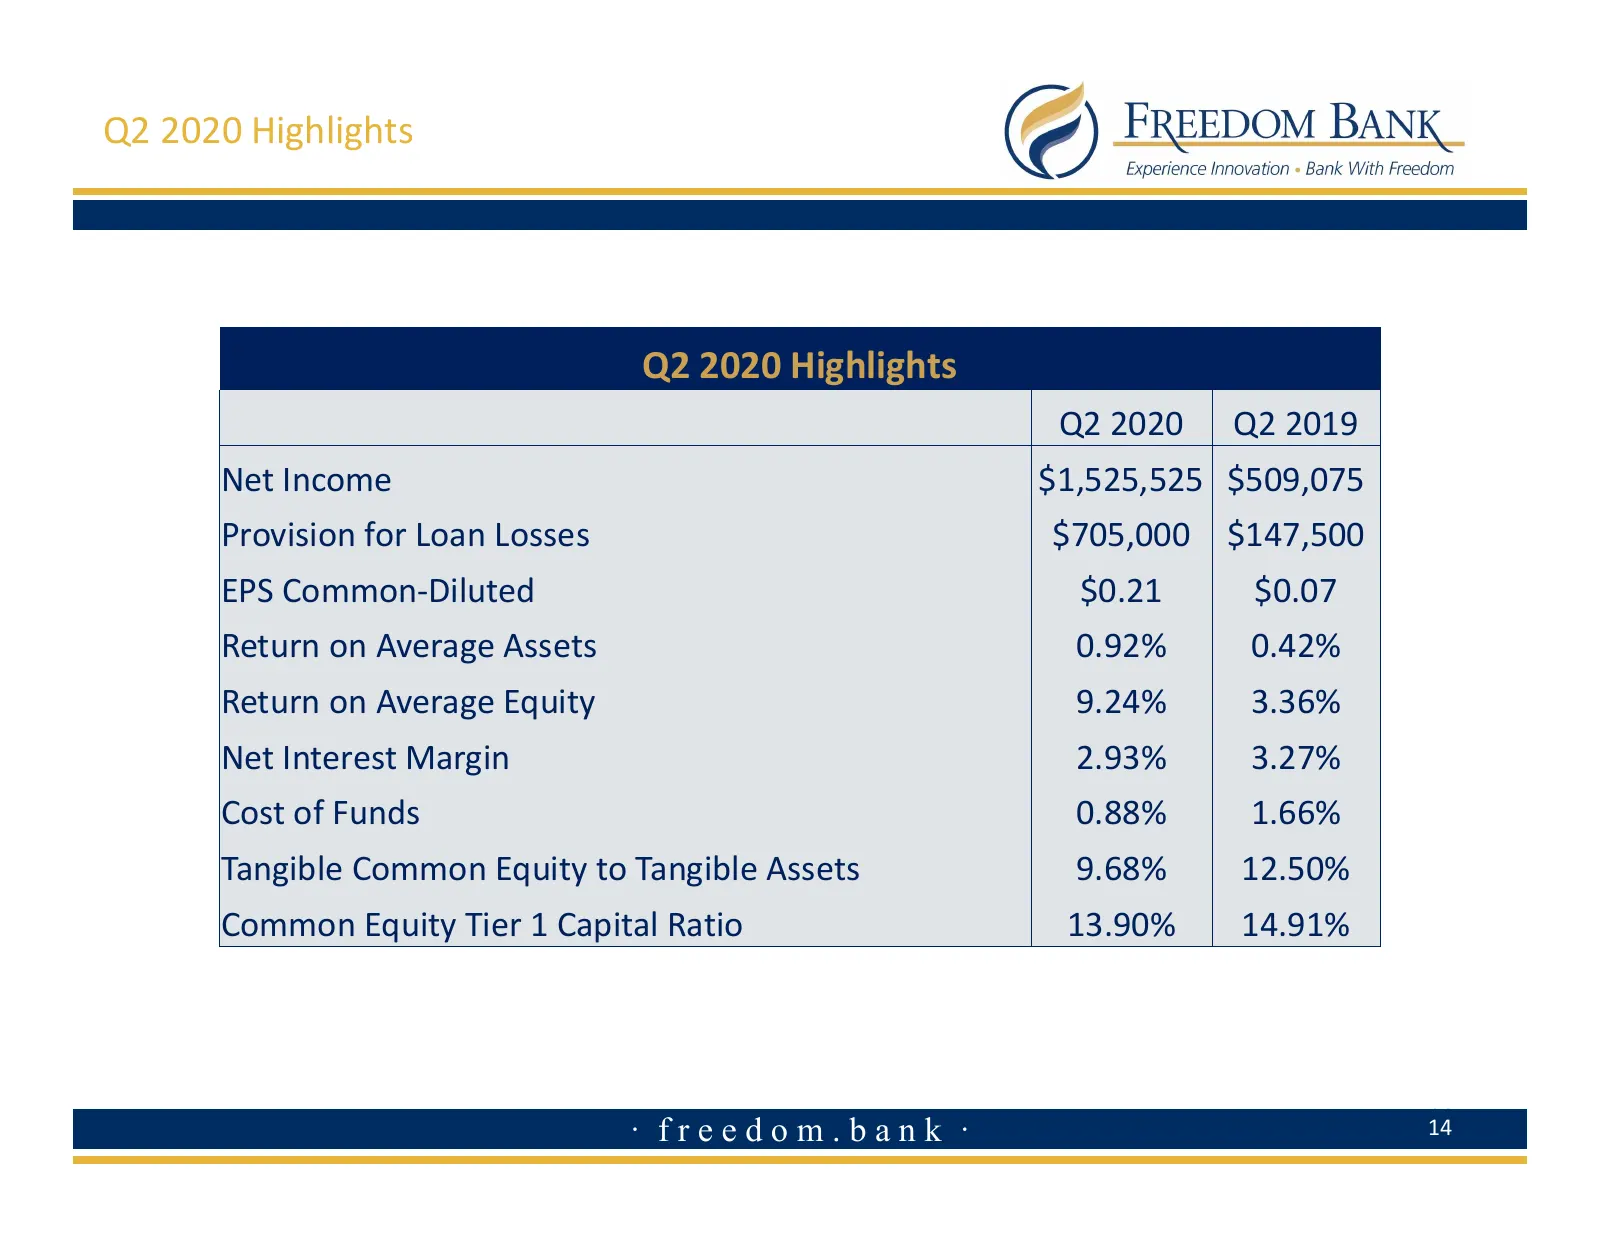
Slide 14: Q2 2020 Highlights
Q2 2020 Highlights Q2 2020 Highlights Q2 2020 Q2 2019 Net Income $1,525,525 $509,075 Provision for Loan Losses $705,000 $147,500 EPS Common-Diluted $0.21 $0.07 Return on Average Assets 0.92% 0.42% Return on Average Equity 9.24% 3.36% Net Interest Margin 2.93% 3.27% Cost of Funds 0.88% 1.66% Tangible
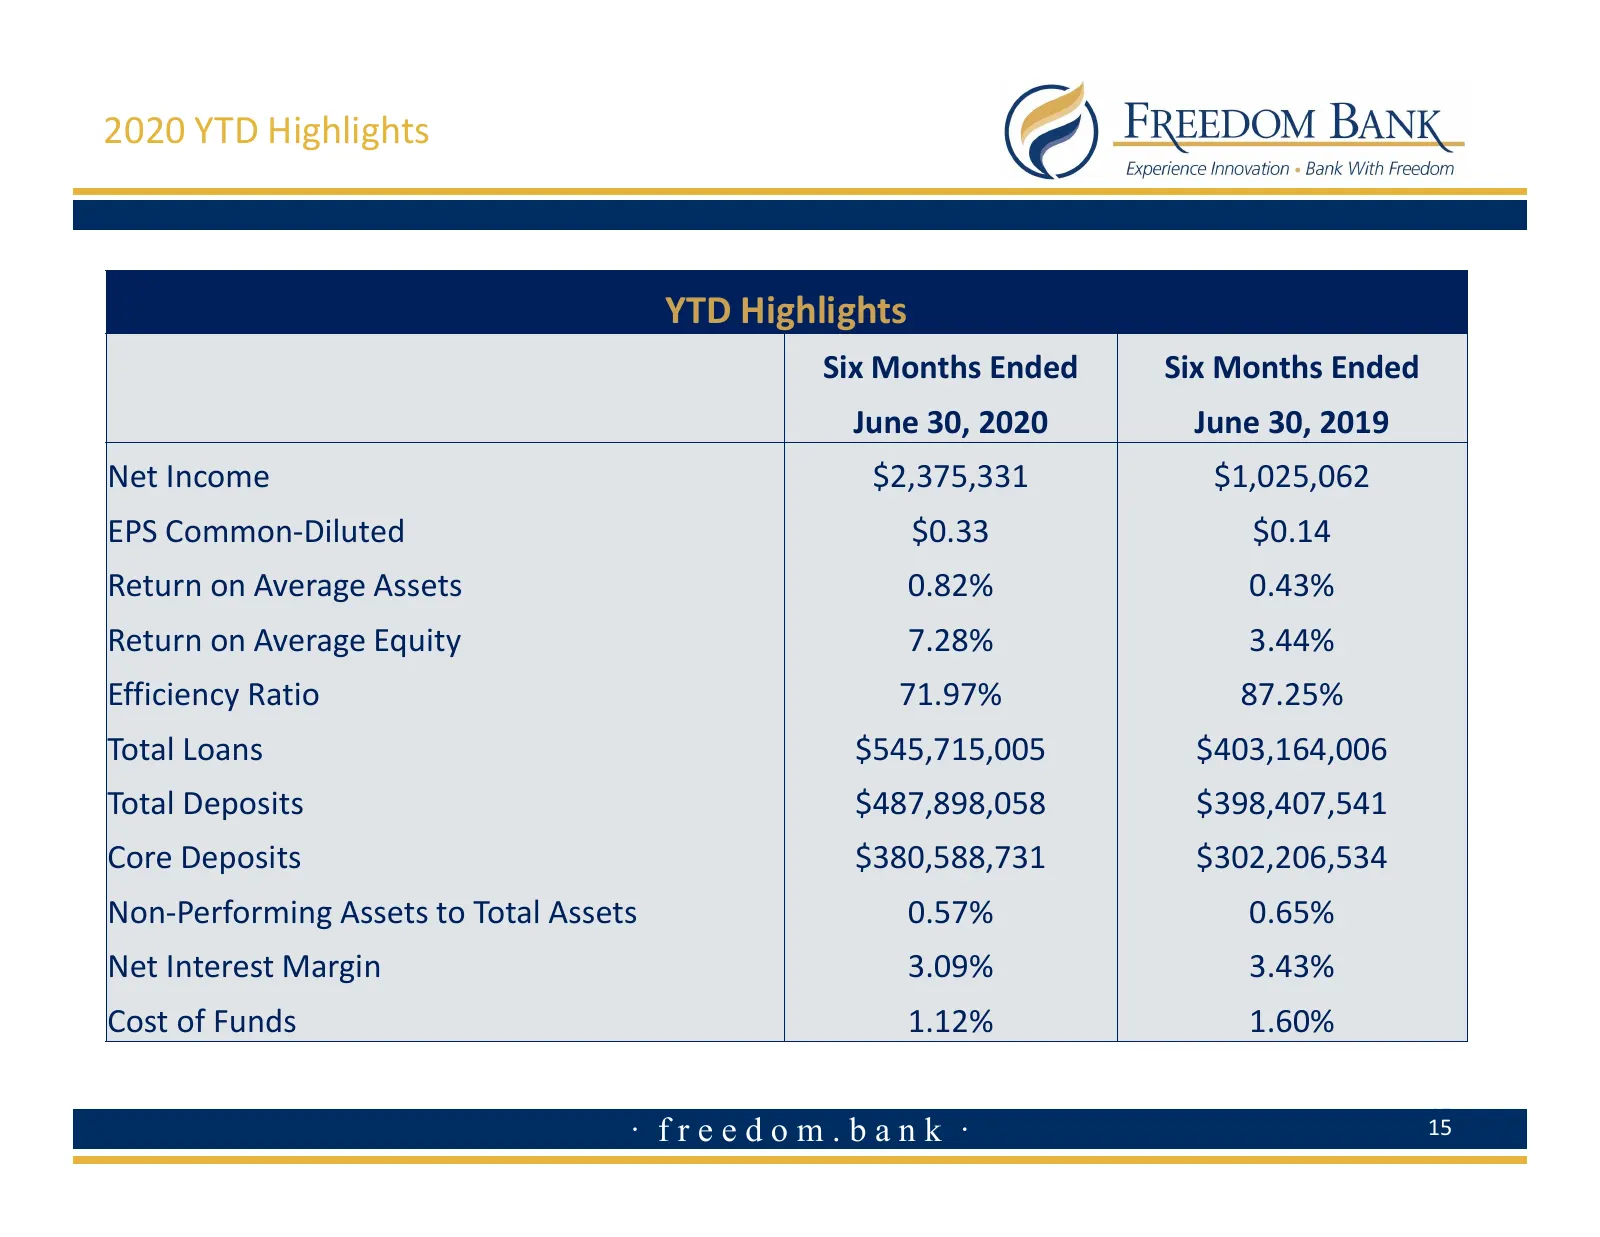
Slide 15: 2020 YTD Highlights
2020 YTD Highlights YTD Highlights Six Months Ended Six Months Ended June 30, 2020 June 30, 2019 Net Income $2,375,331 $1,025,062 EPS Common-Diluted $0.33 $0.14 Return on Average Assets 0.82% 0.43% Return on Average Equity 7.28% 3.44% Efficiency Ratio 71.97% 87.25% Total Loans $545,715,005 $403,164,
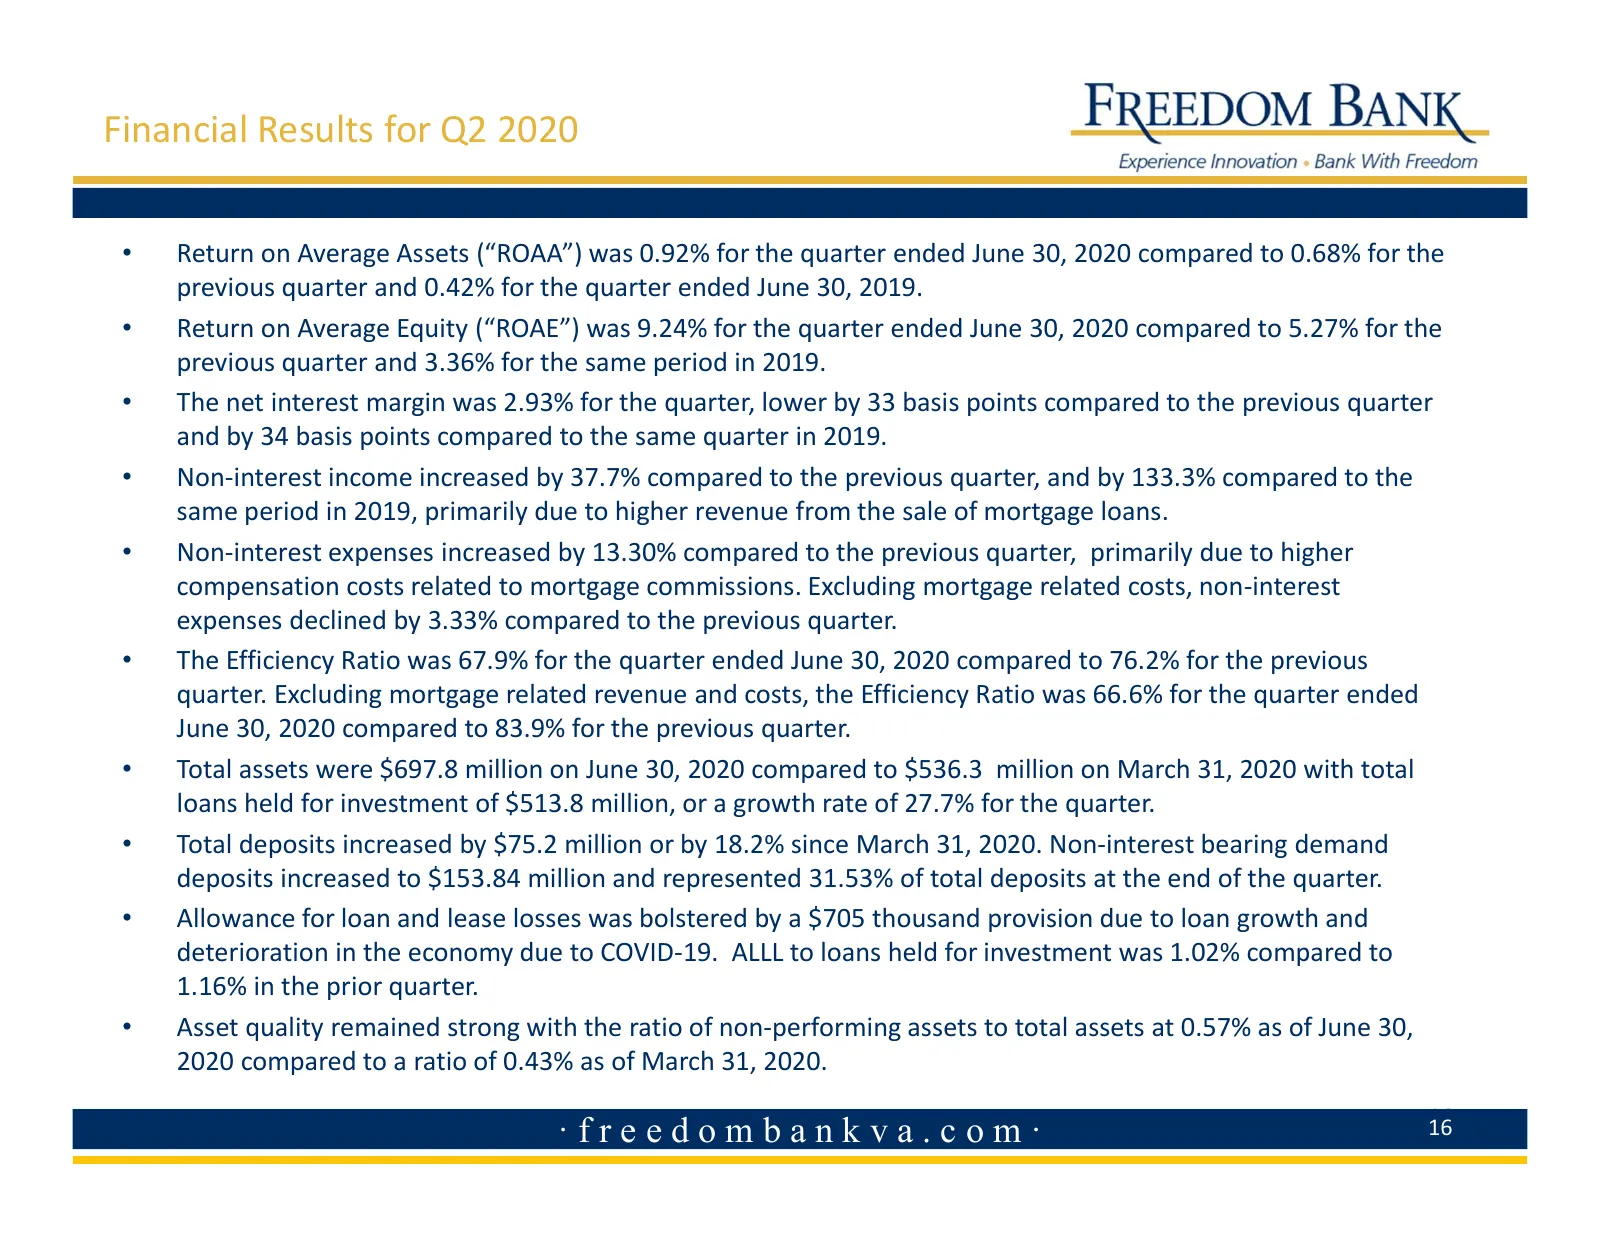
Slide 16: Financial Results for Q2 2020
Financial Results for Q2 2020 • Return on Average Assets (“ROAA”) was 0.92% for the quarter ended June 30, 2020 compared to 0.68% for the previous quarter and 0.42% for the quarter ended June 30, 2019. • Return on Average Equity (“ROAE”) was 9.24% for the quarter ended June 30, 2020 compared to 5.27
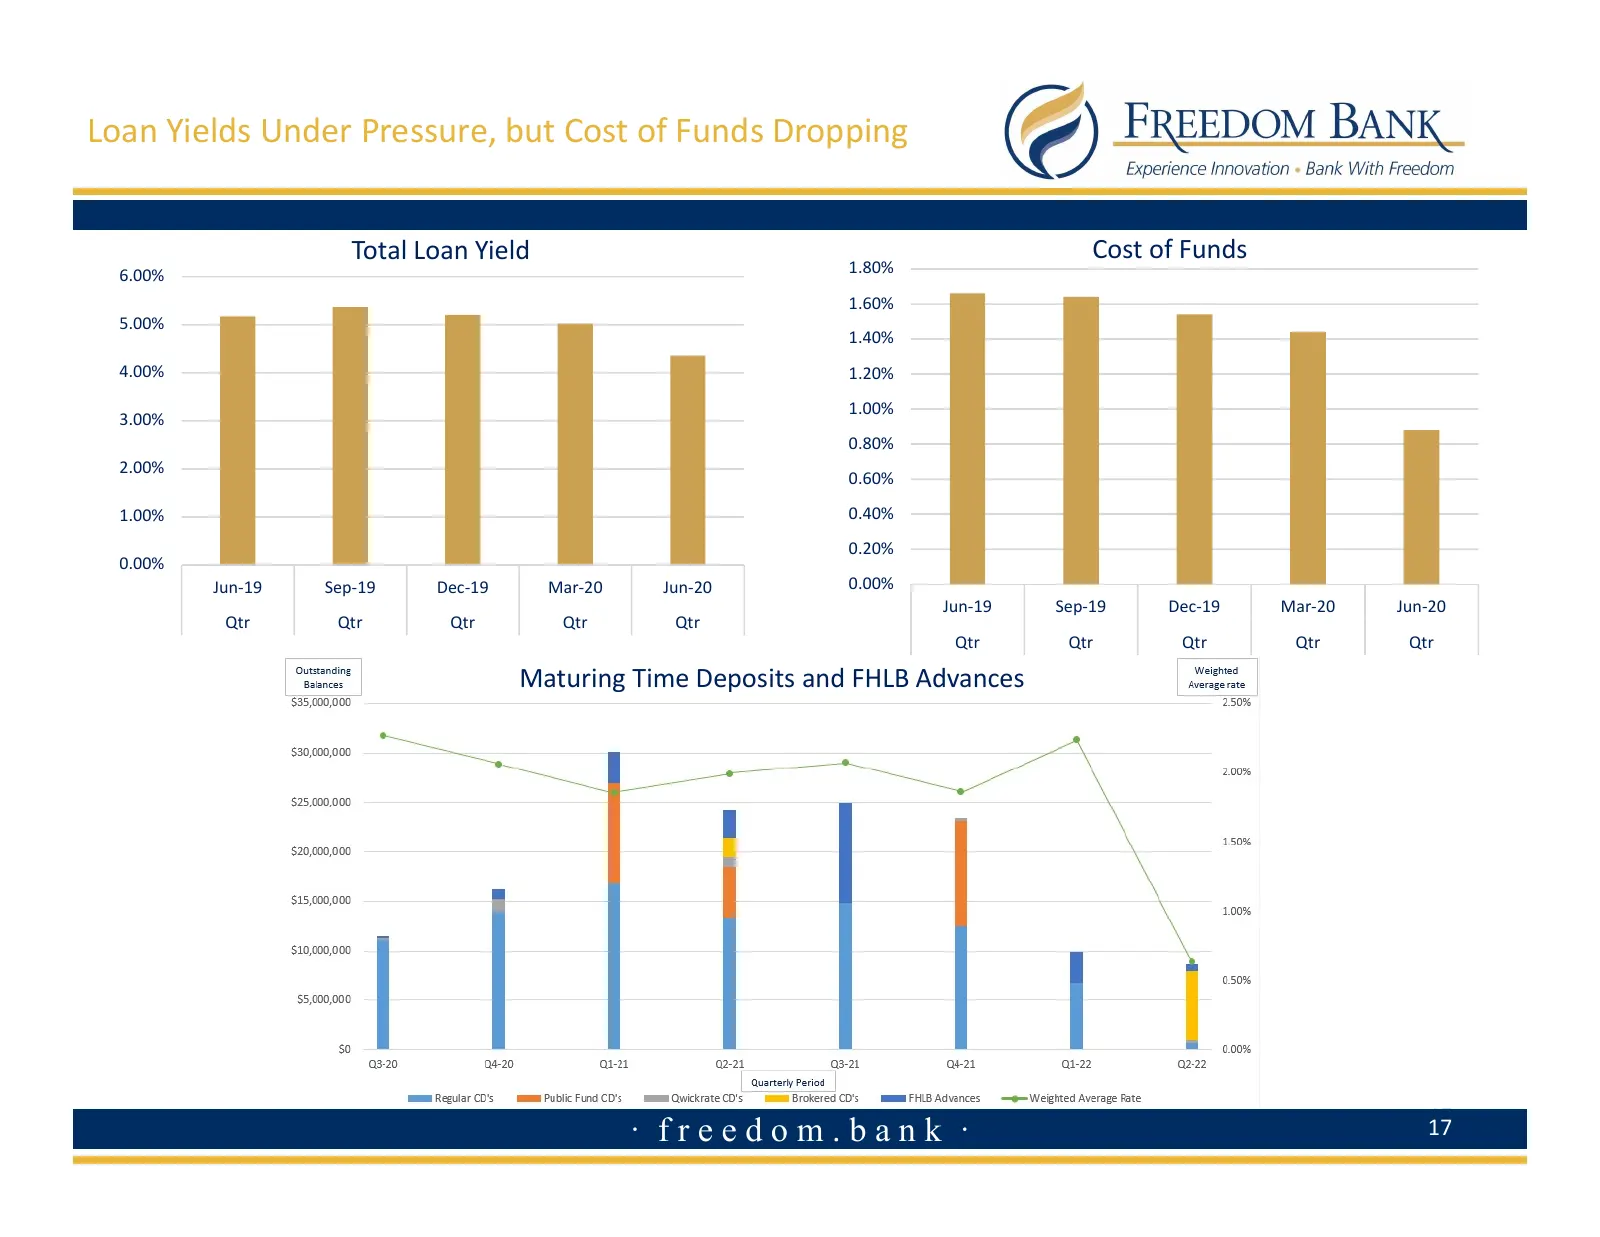
Slide 17: Loan Yields Under Pressure, but Cost of Funds Dropping
Loan Yields Under Pressure, but Cost of Funds Dropping Total Loan Yield Cost of Funds 6.00% 1.80% 1.60% 5.00% 1.40% 4.00% 1.20% 1.00% 3.00% 0.80% 2.00% 0.60% 1.00% 0.40% 0.20% 0.00% Jun-19 Sep-19 Dec-19 Mar-20 Jun-20 0.00% Jun-19 Sep-19 Dec-19 Mar-20 Jun-20 Qtr Qtr Qtr Qtr Qtr Qtr Qtr Qtr Qtr Qtr Ma
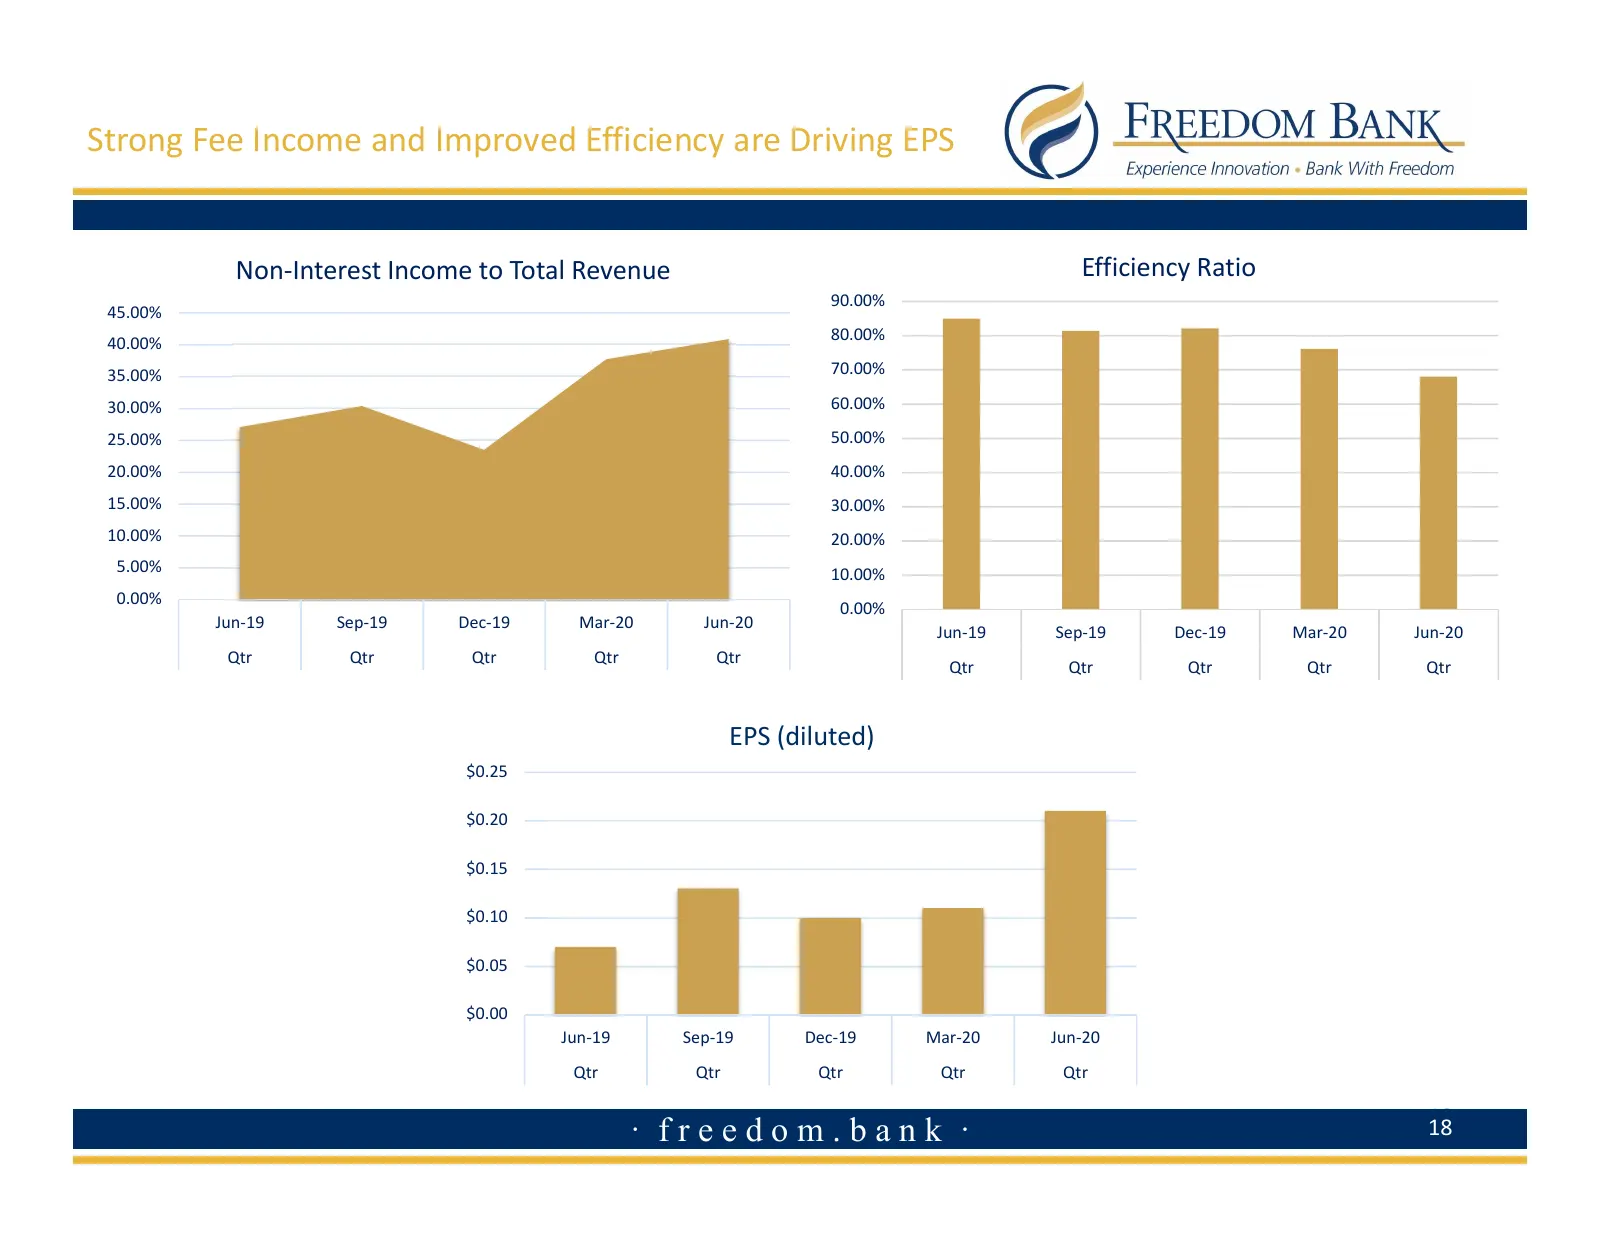
Slide 18: Strong Fee Income and Improved Efficiency are Driving EPS
Strong Fee Income and Improved Efficiency are Driving EPS Non-Interest Income to Total Revenue Efficiency Ratio 90.00% 45.00% 80.00% 40.00% 35.00% 70.00% 30.00% 60.00% 25.00% 50.00% 20.00% 40.00% 15.00% 30.00% 10.00% 20.00% 5.00% 10.00% 0.00% 0.00% Jun-19 Sep-19 Dec-19 Mar-20 Jun-20 Jun-19 Sep-19 De
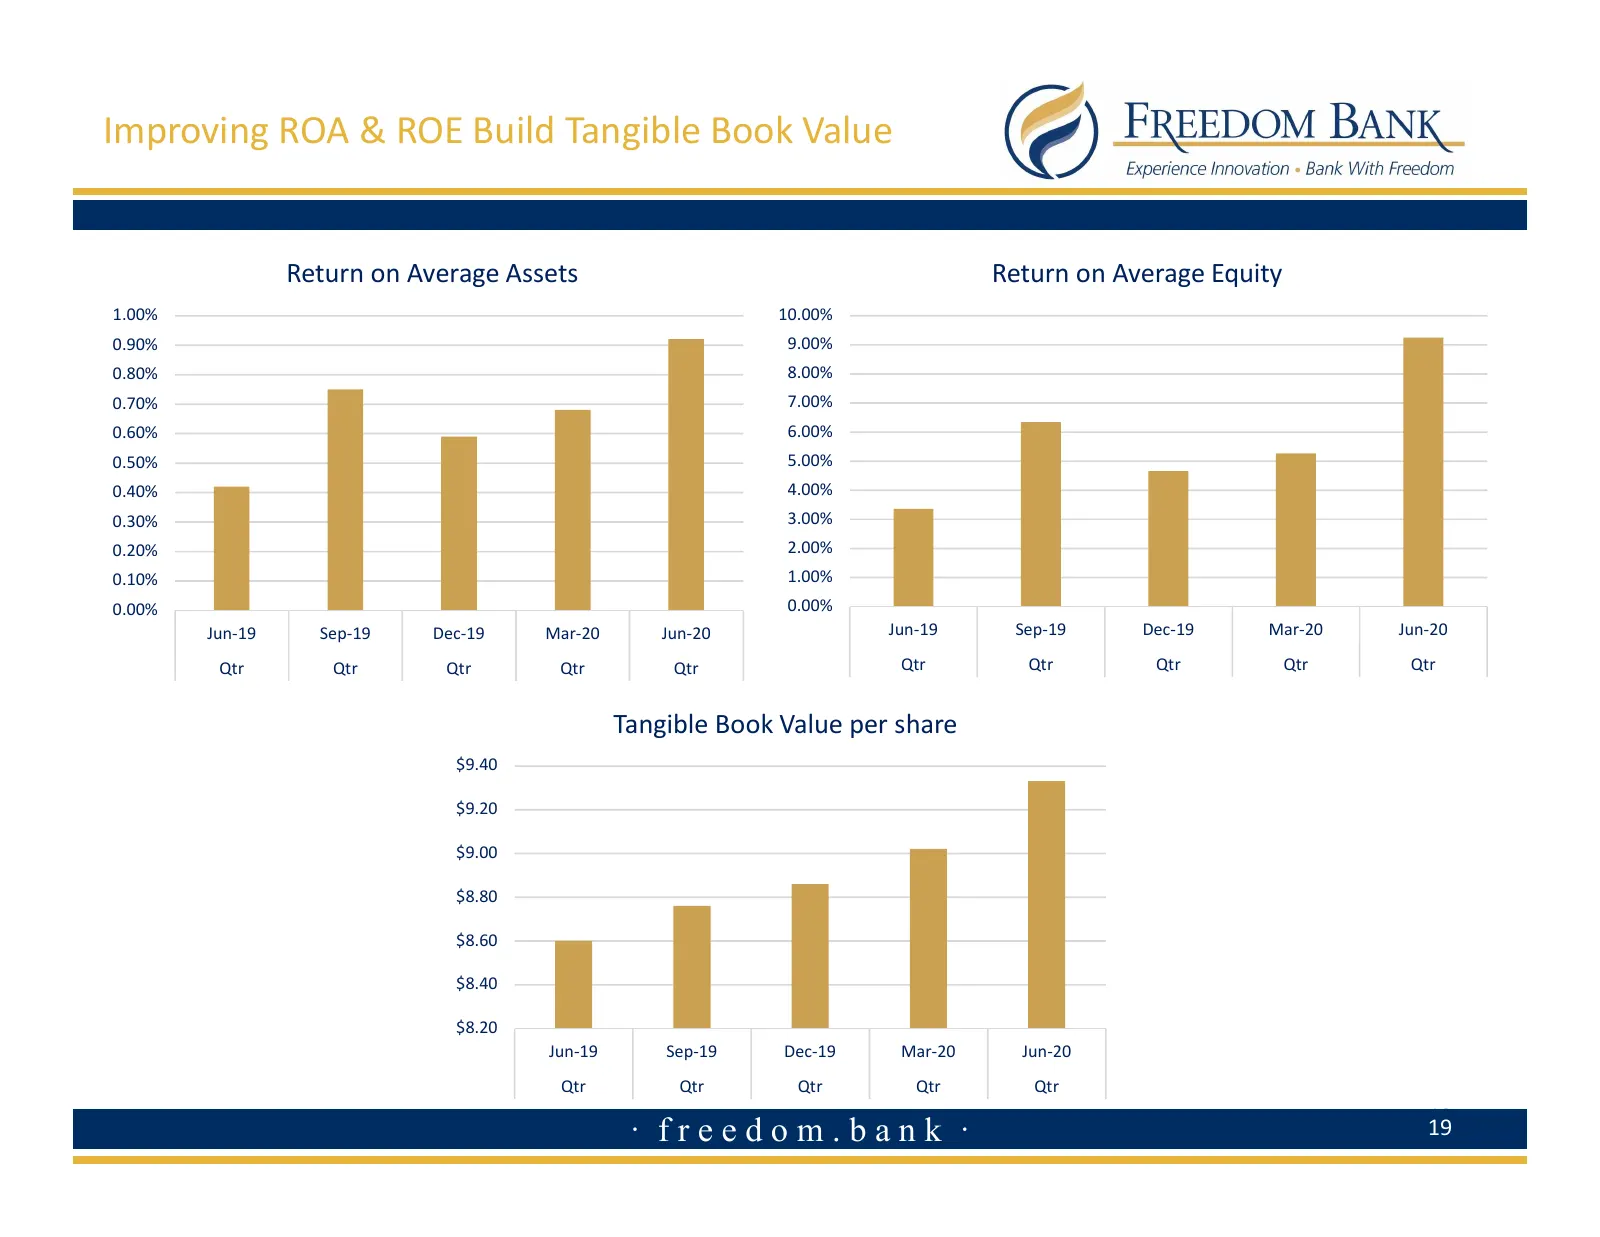
Slide 19: Improving ROA & ROE Build Tangible Book Value
Improving ROA & ROE Build Tangible Book Value Return on Average Assets Return on Average Equity 1.00% 10.00% 0.90% 9.00% 0.80% 8.00% 0.70% 7.00% 0.60% 6.00% 0.50% 5.00% 0.40% 4.00% 0.30% 3.00% 0.20% 2.00% 0.10% 1.00% 0.00% 0.00% Jun-19 Sep-19 Dec-19 Mar-20 Jun-20 Jun-19 Sep-19 Dec-19 Mar-20 Jun-20 Q
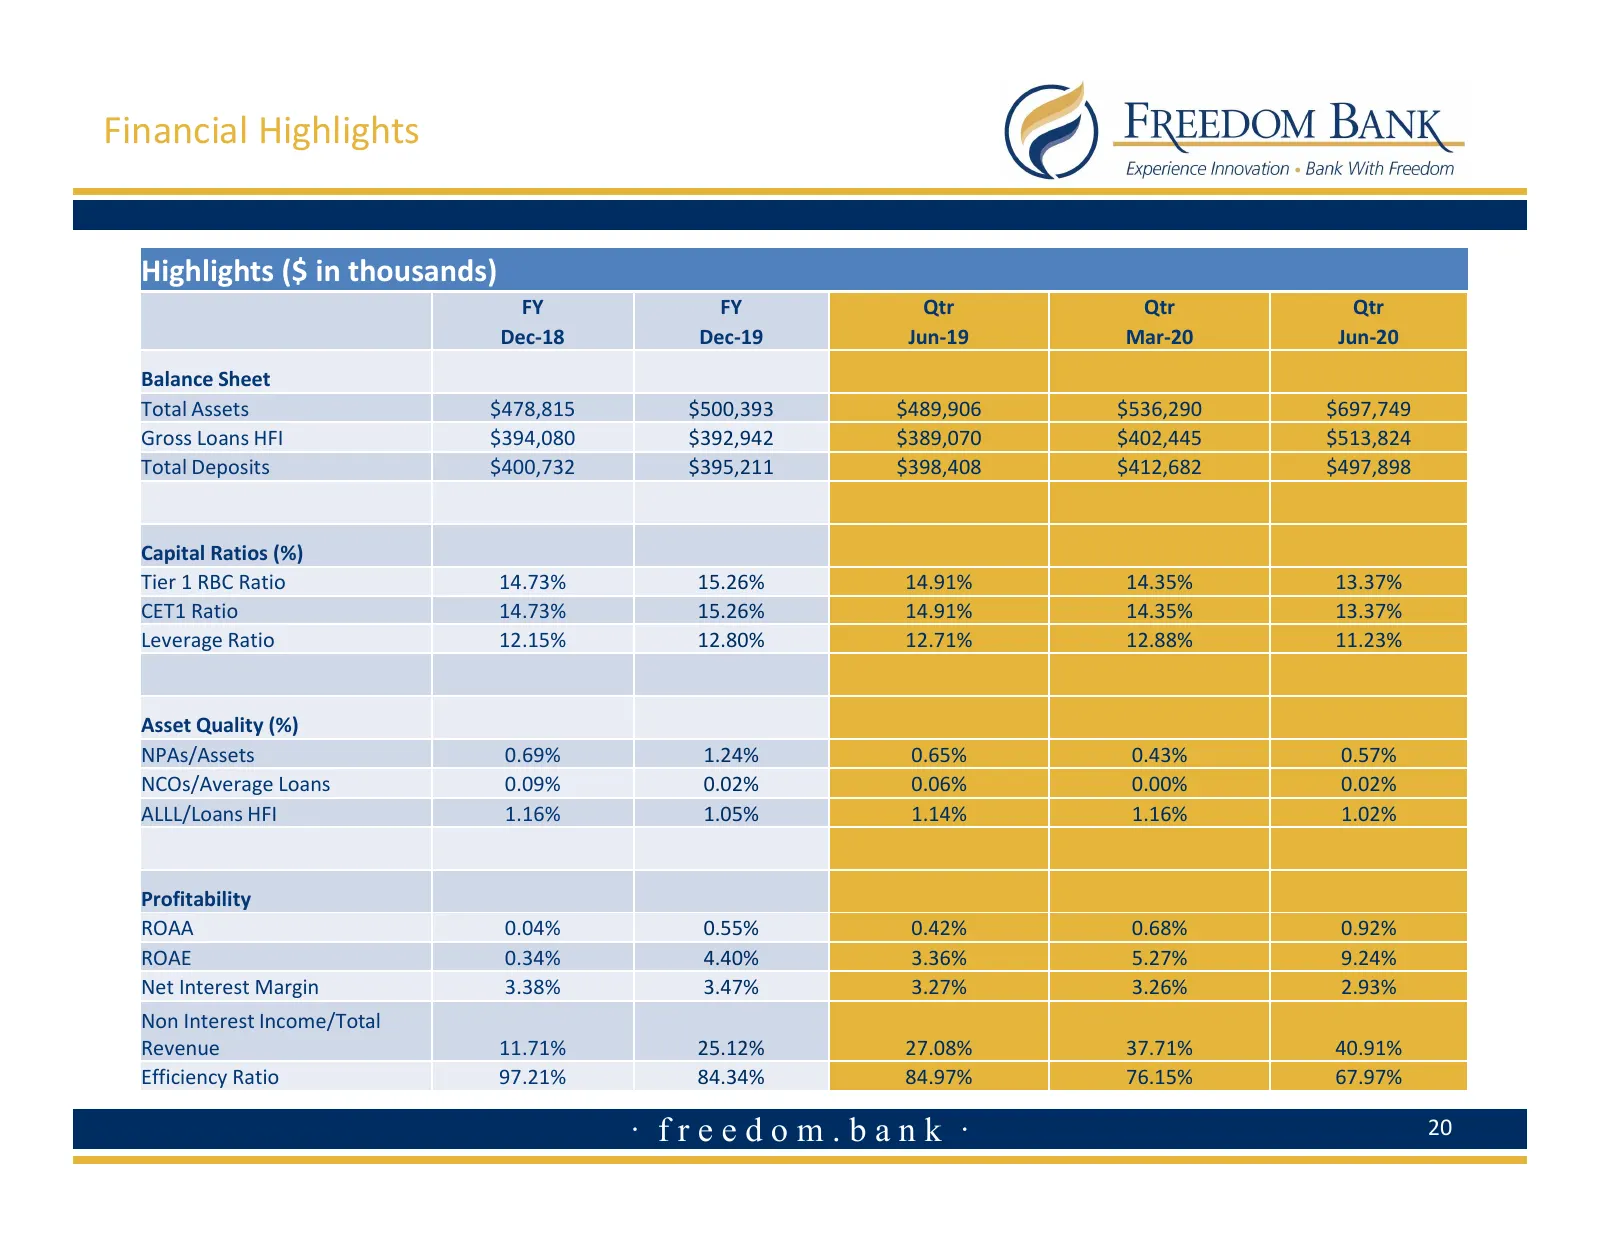
Slide 20: Financial Highlights
Financial Highlights Highlights ($ in thousands) FY FY Qtr Qtr Qtr Dec-18 Dec-19 Jun-19 Mar-20 Jun-20 Balance Sheet Total Assets $478,815 $500,393 $489,906 $536,290 $697,749 Gross Loans HFI $394,080 $392,942 $389,070 $402,445 $513,824 Total Deposits $400,732 $395,211 $398,408 $412,682 $497,898 Capit
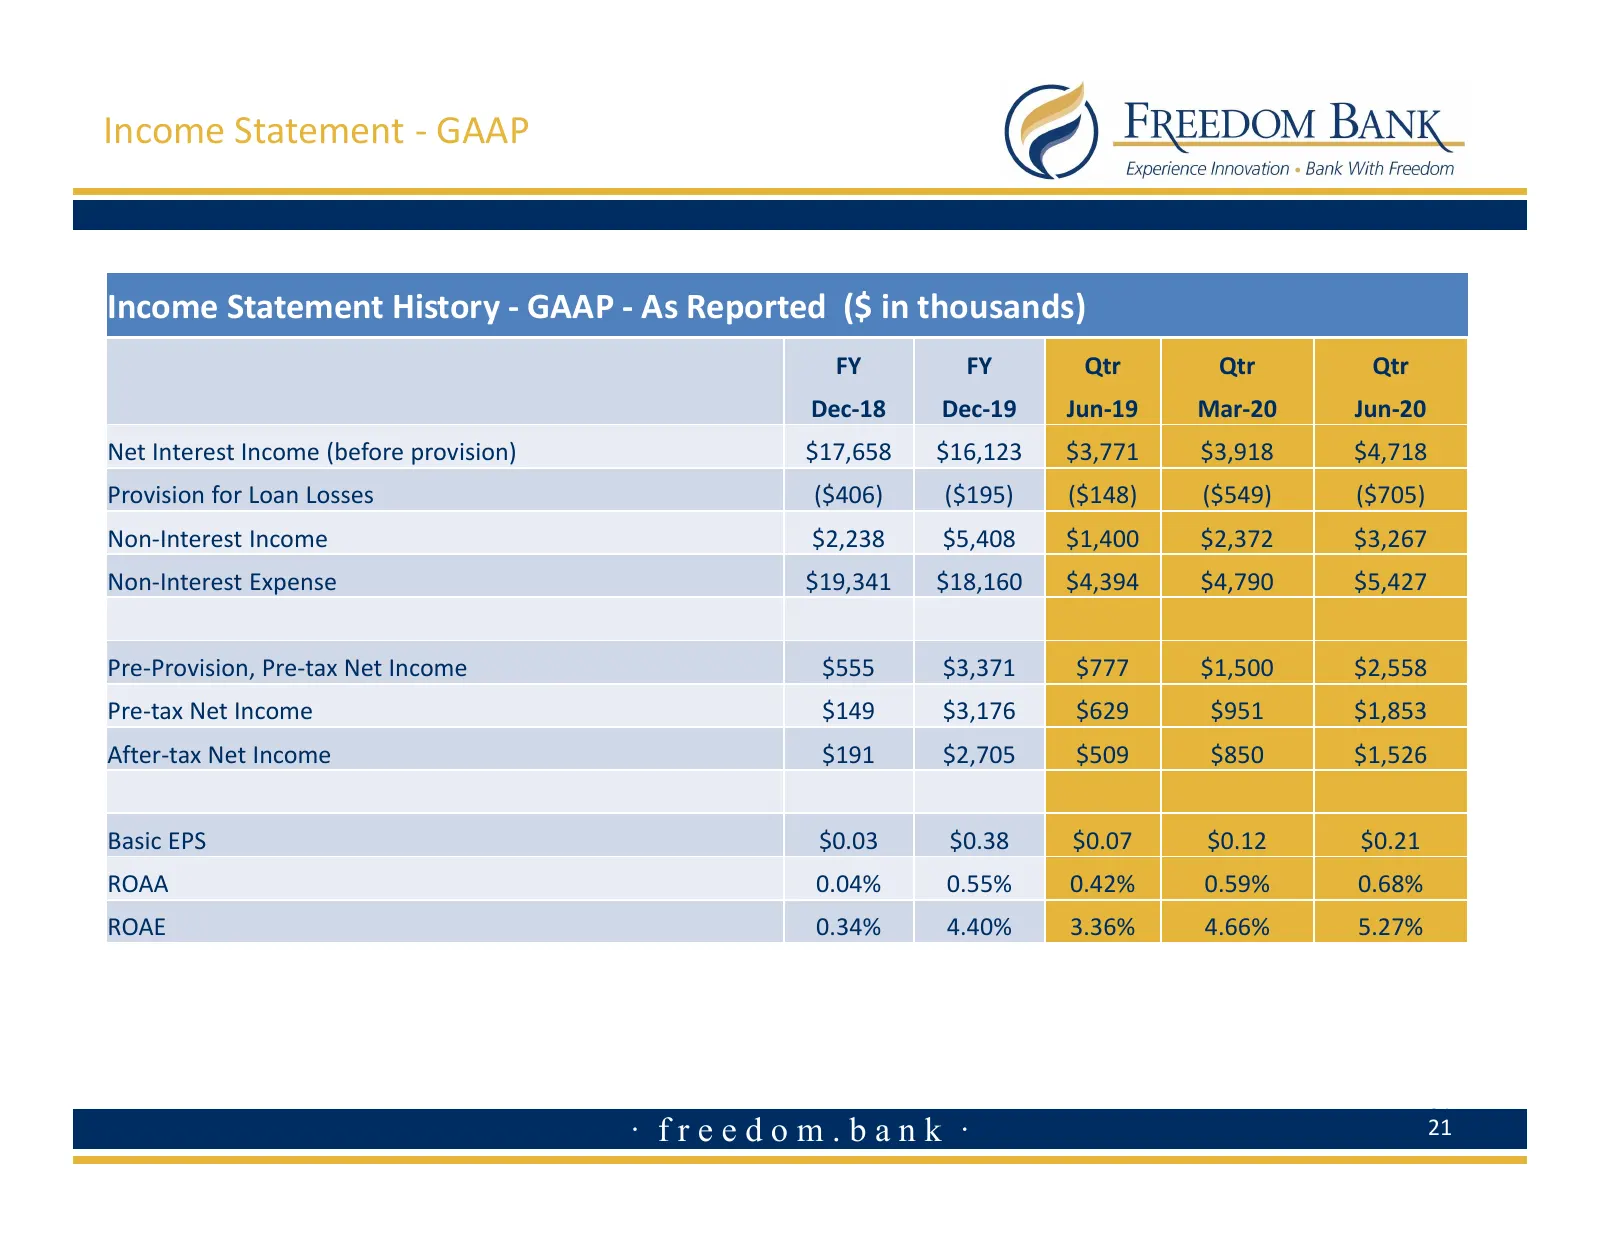
Slide 21: Income Statement - GAAP
Income Statement - GAAP Income Statement History - GAAP - As Reported ($ in thousands) FY FY Qtr Qtr Qtr Dec-18 Dec-19 Jun-19 Mar-20 Jun-20 Net Interest Income (before provision) $17,658 $16,123 $3,771 $3,918 $4,718 Provision for Loan Losses ($406) ($195) ($148) ($549) ($705) Non-Interest Income $2,
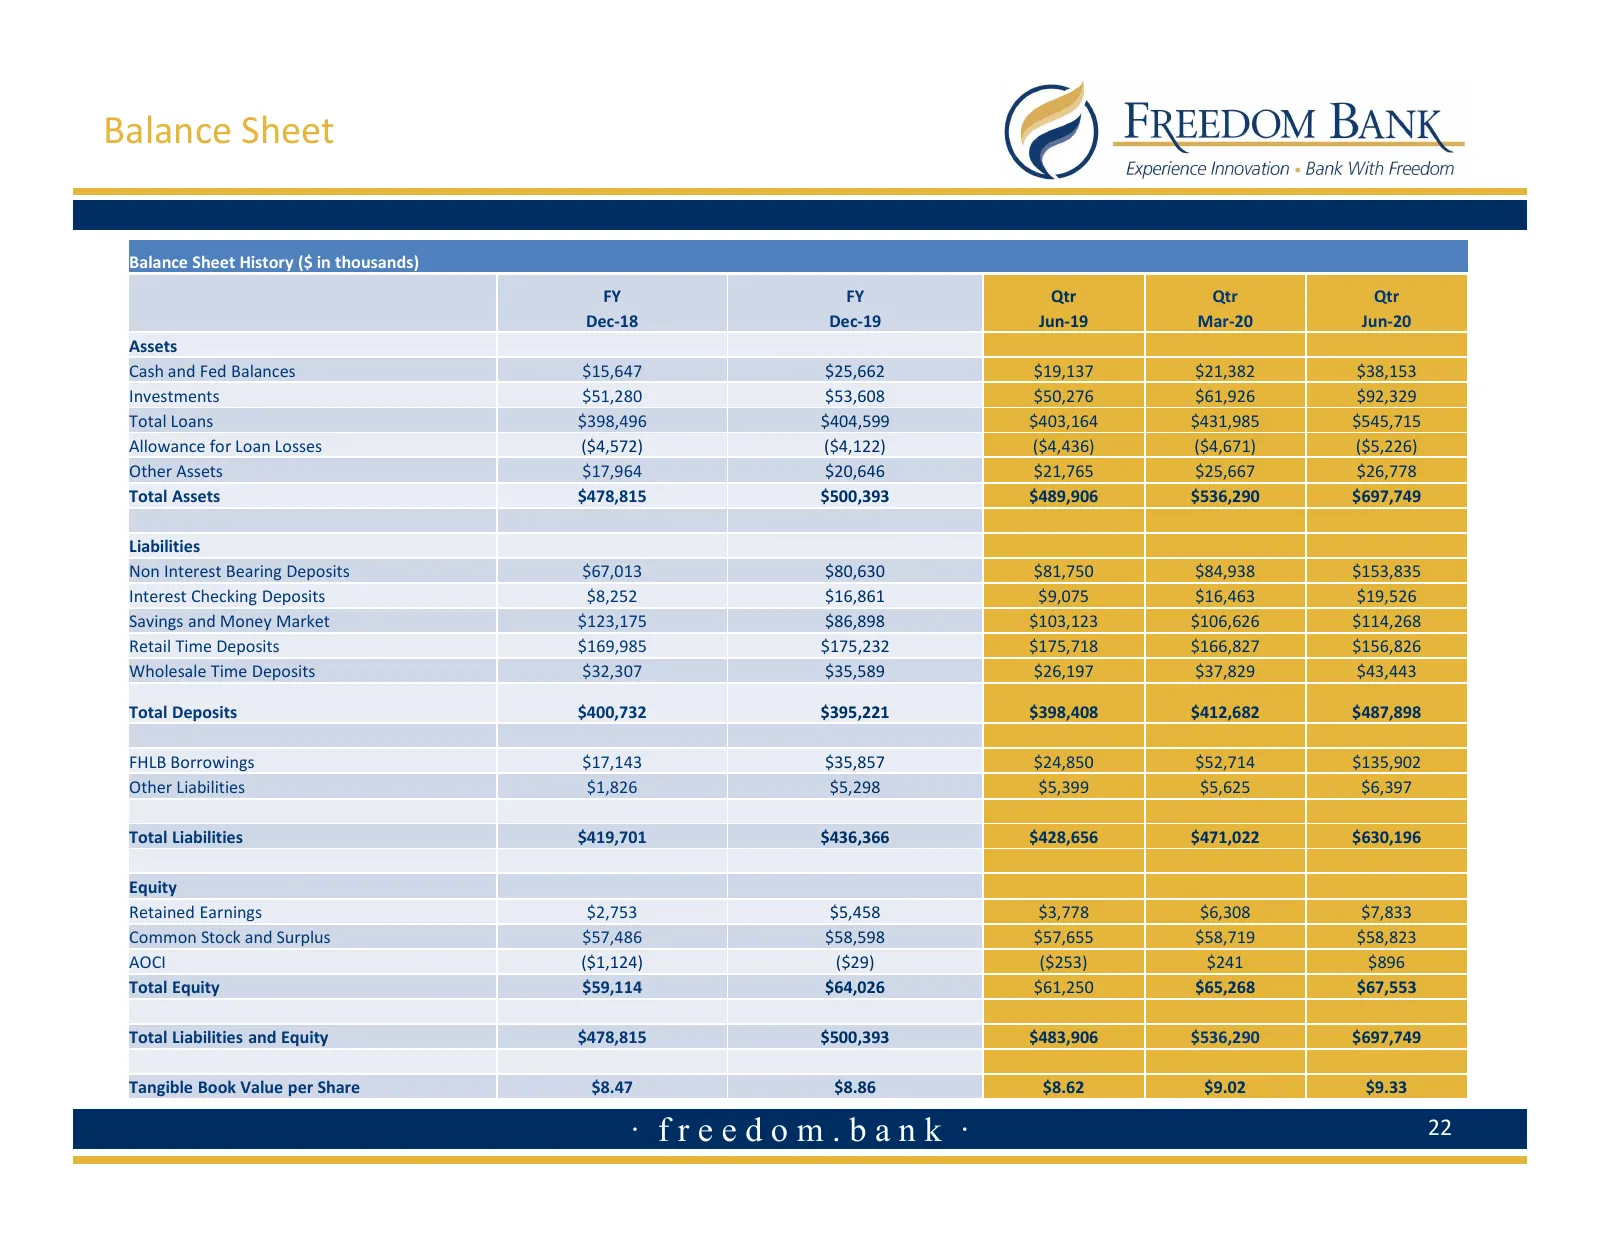
Slide 22: Balance Sheet
Balance Sheet Balance Sheet History ($ in thousands) FY FY Qtr Qtr Qtr Dec-18 Dec-19 Jun-19 Mar-20 Jun-20 Assets Cash and Fed Balances $15,647 $25,662 $19,137 $21,382 $38,153 Investments $51,280 $53,608 $50,276 $61,926 $92,329 Total Loans $398,496 $404,599 $403,164 $431,985 $545,715 Allowance for Lo
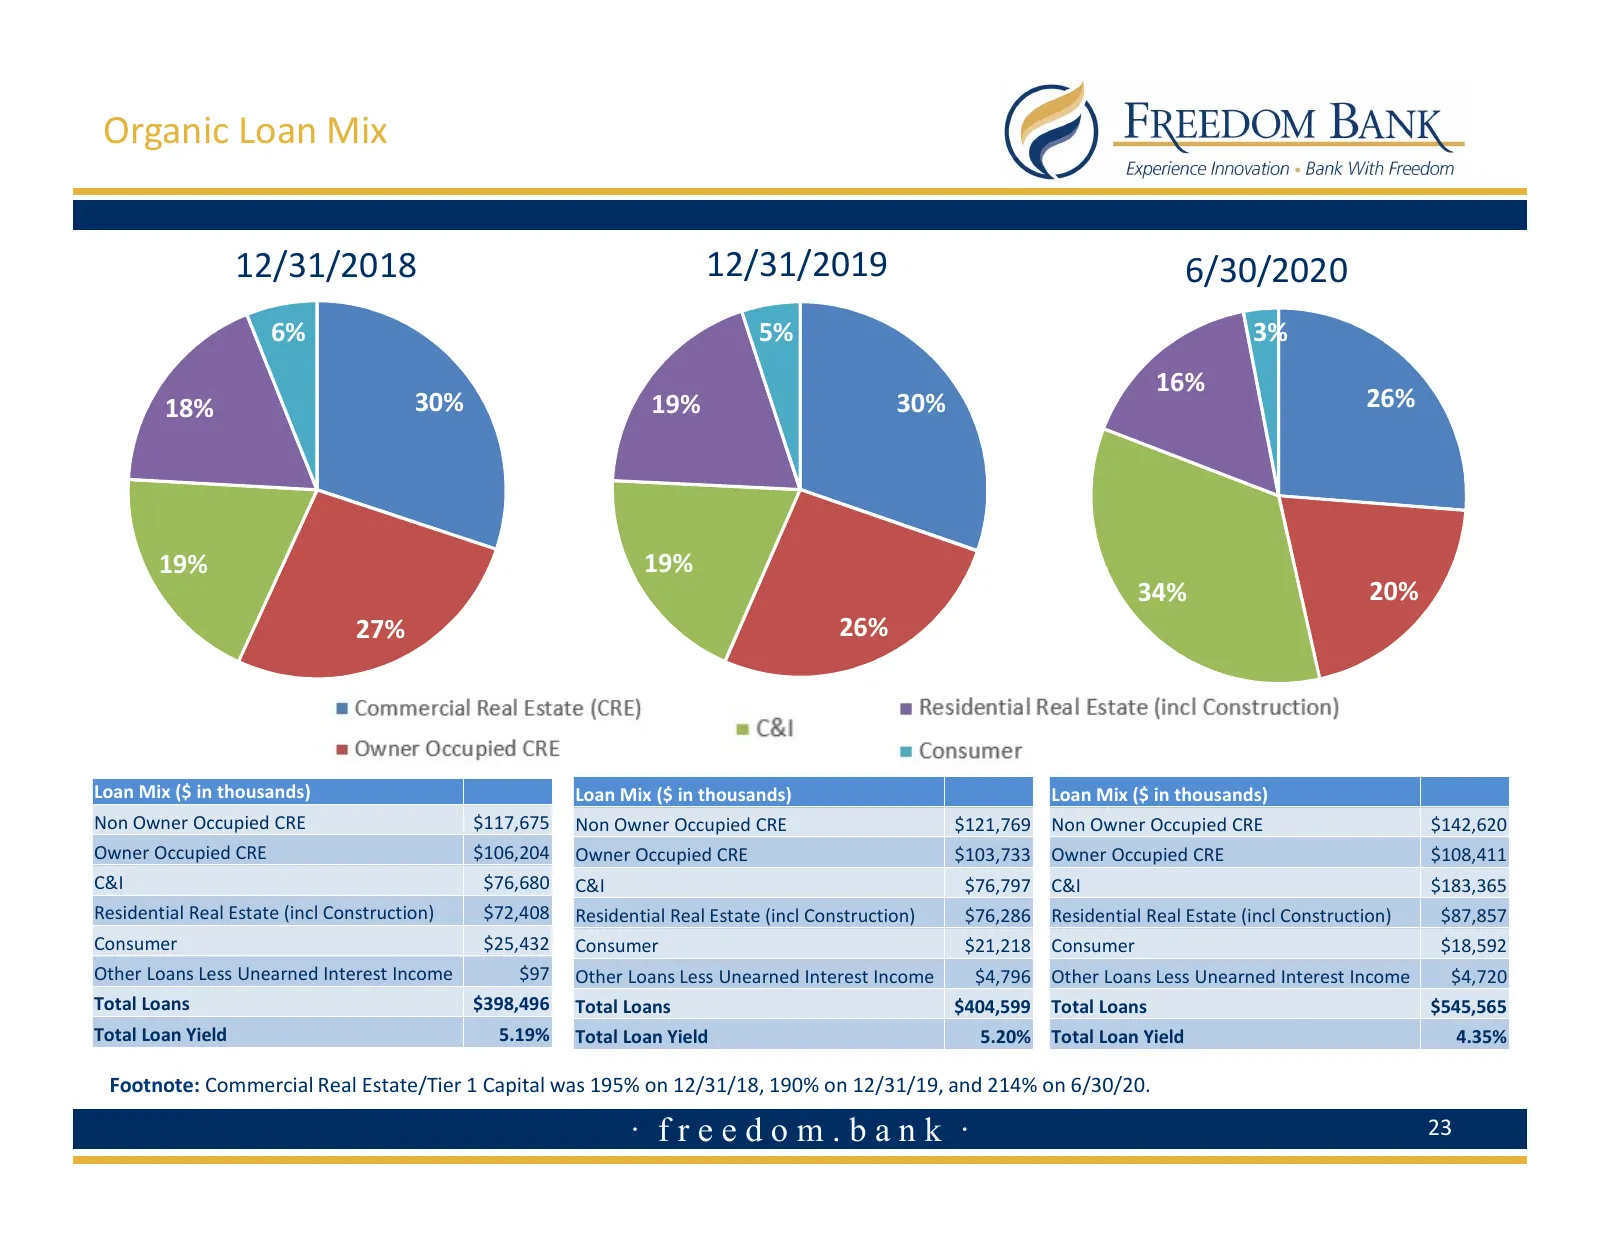
Slide 23: Organic Loan Mix
Organic Loan Mix 12/31/2018 12/31/2019 6/30/2020 6% 5% 3% 16% 18% 30% 19% 30% 26% 19% 19% 34% 20% 27% 26% Loan Mix ($ in thousands) Loan Mix ($ in thousands) Loan Mix ($ in thousands) Non Owner Occupied CRE $117,675 Non Owner Occupied CRE $121,769 Non Owner Occupied CRE $142,620 Owner Occupied CRE $
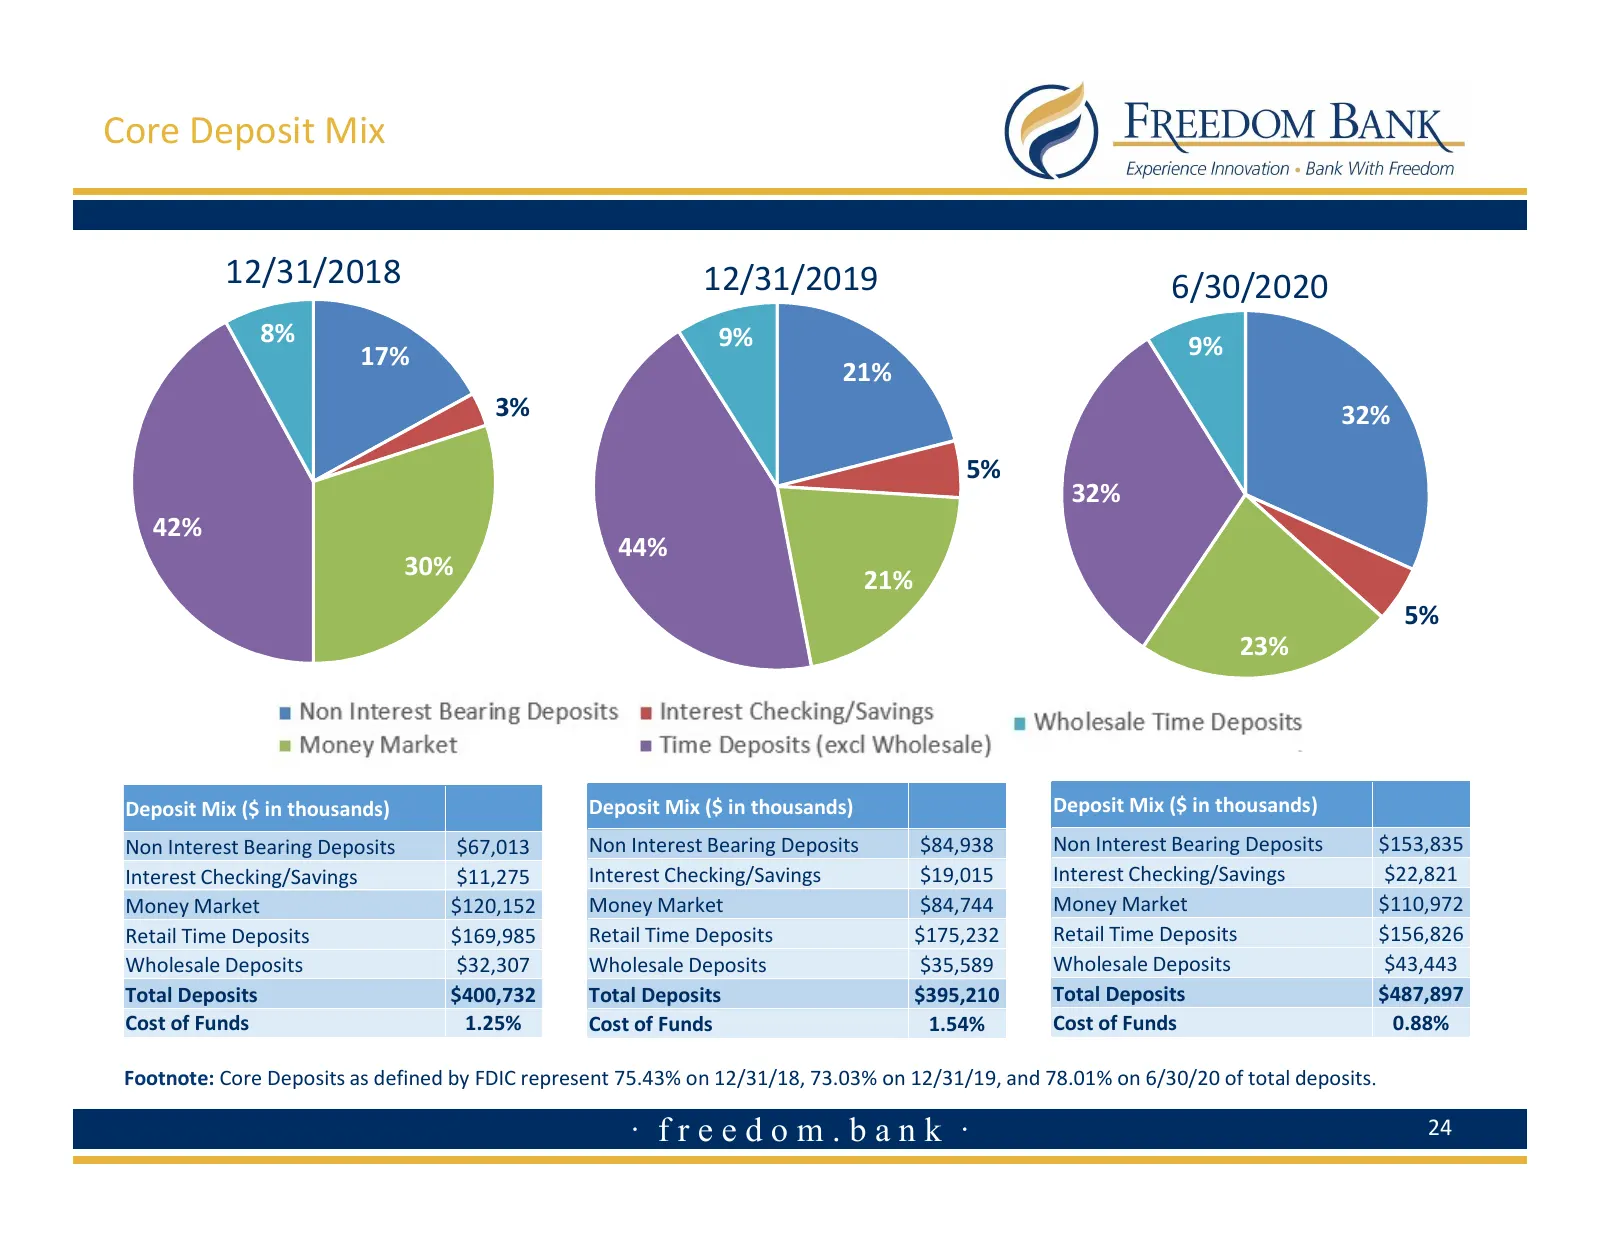
Slide 24: Core Deposit Mix
Core Deposit Mix 12/31/2018 12/31/2019 6/30/2020 8% 9% 9% 17% 21% 3% 32% 5% 32% 42% 44% 30% 21% 5% 23% Deposit Mix ($ in thousands) Deposit Mix ($ in thousands) Deposit Mix ($ in thousands) Non Interest Bearing Deposits $67,013 Non Interest Bearing Deposits $84,938 Non Interest Bearing Deposits $153
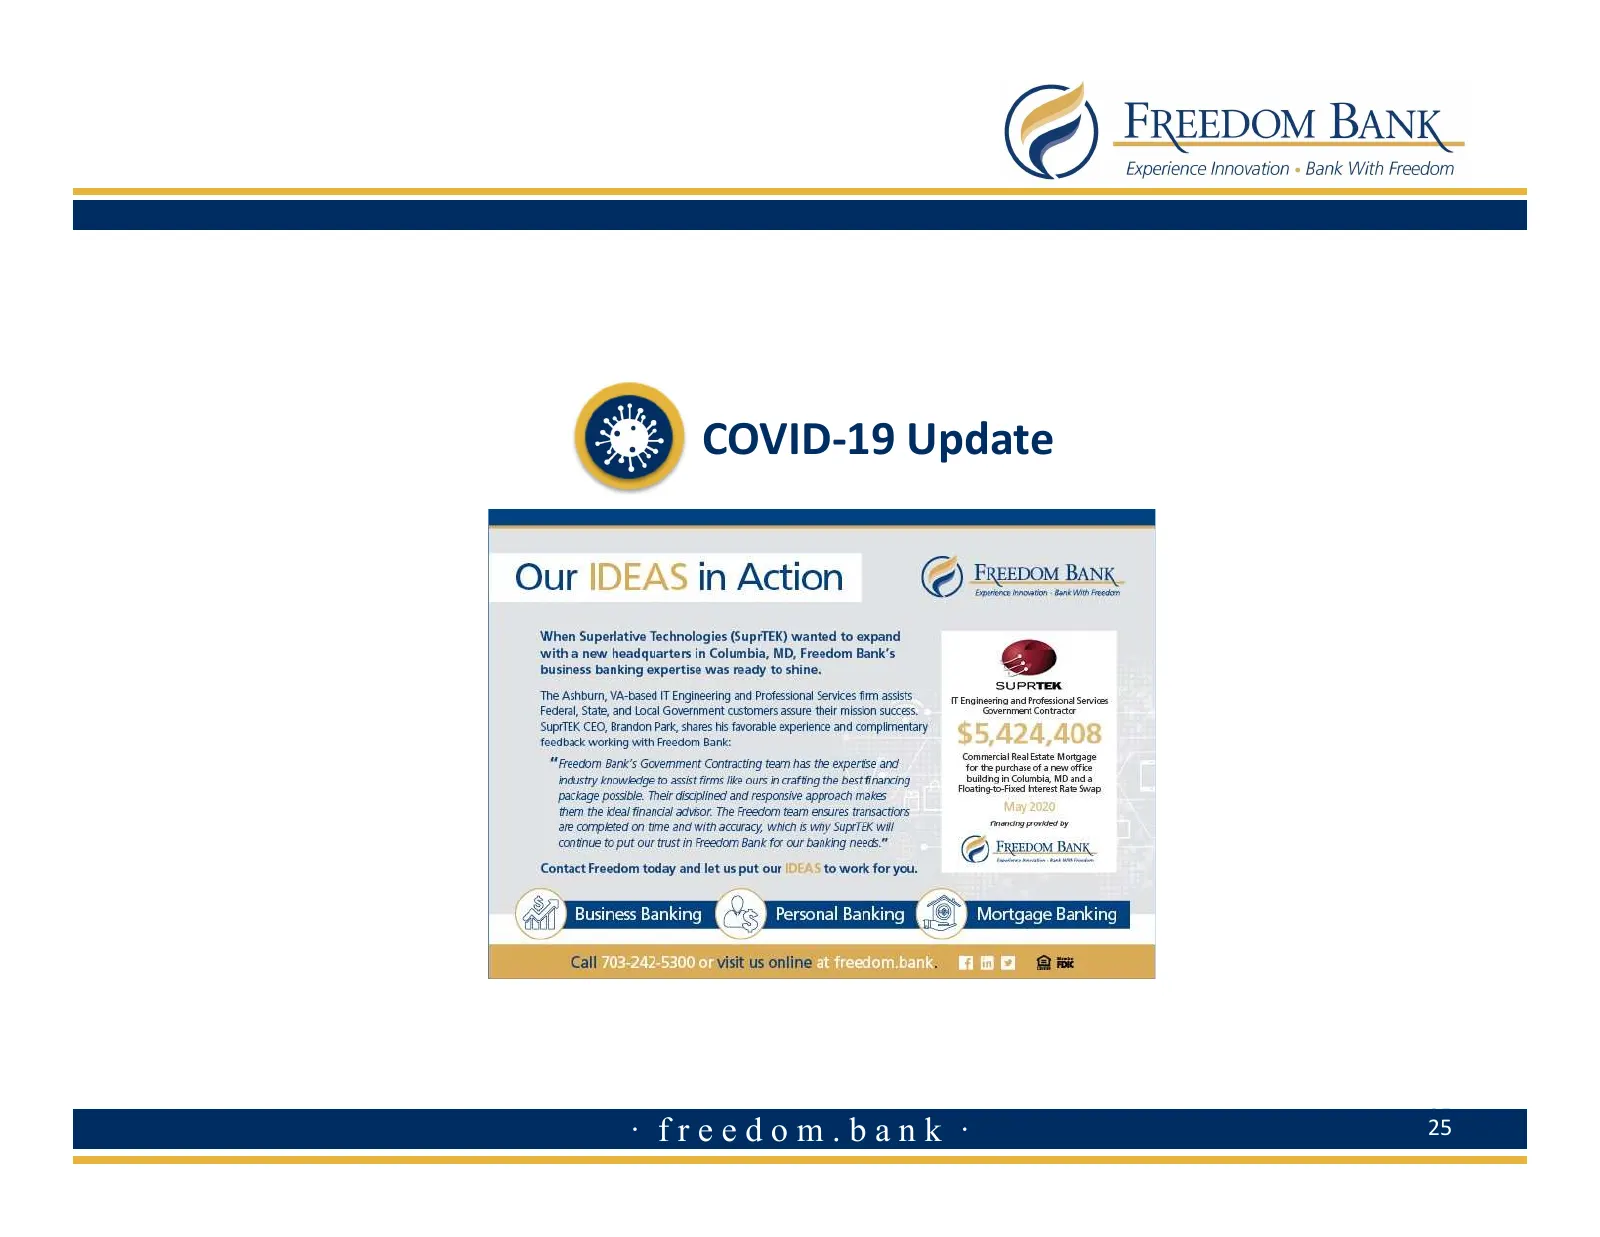
Slide 25: COVID-19 Update
COVID-19 Update 25 · freedom.bank · 25
Slide 26: Freedom Bank's Early Response to COVID-19
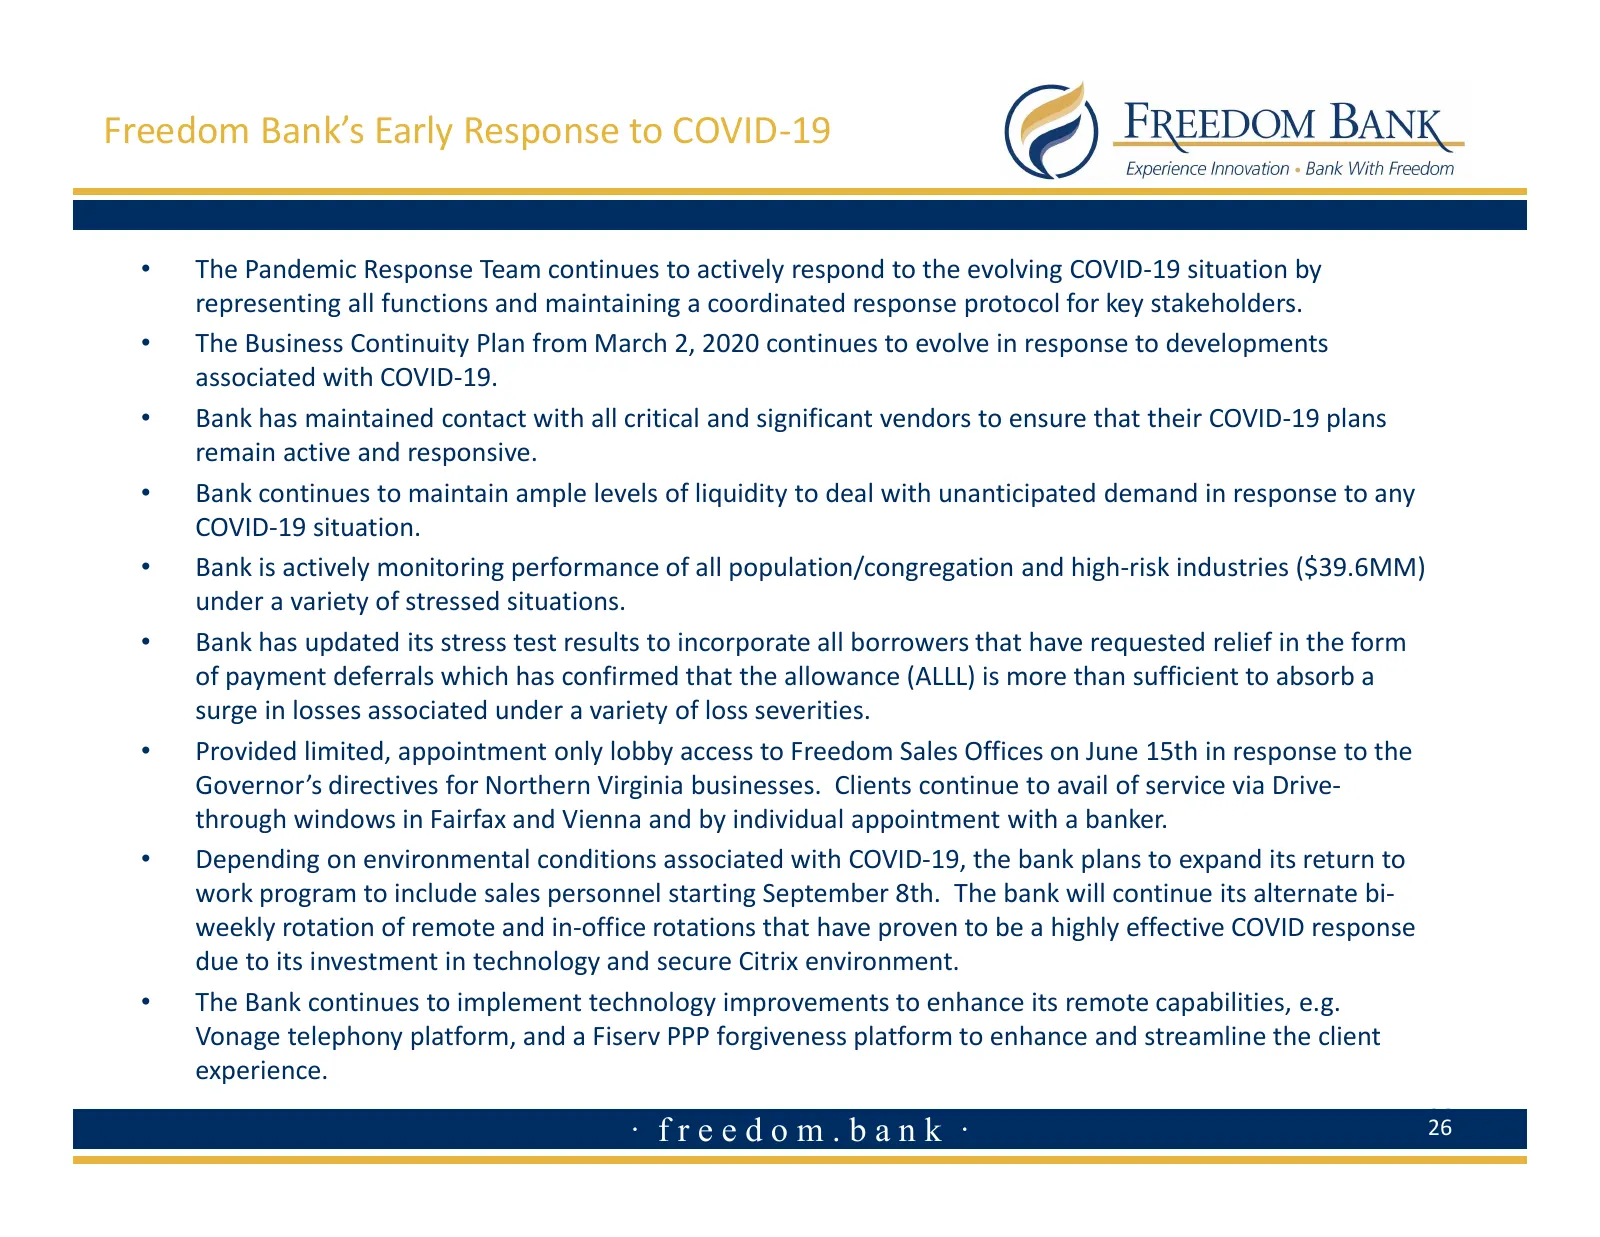
Freedom Bank’s Early Response to COVID-19 • The Pandemic Response Team continues to actively respond to the evolving COVID-19 situation by representing all functions and maintaining a coordinated response protocol for key stakeholders. • The Business Continuity Plan from March 2, 2020 continues to e
Slide 27: Supporting Employees, Clients & Communities
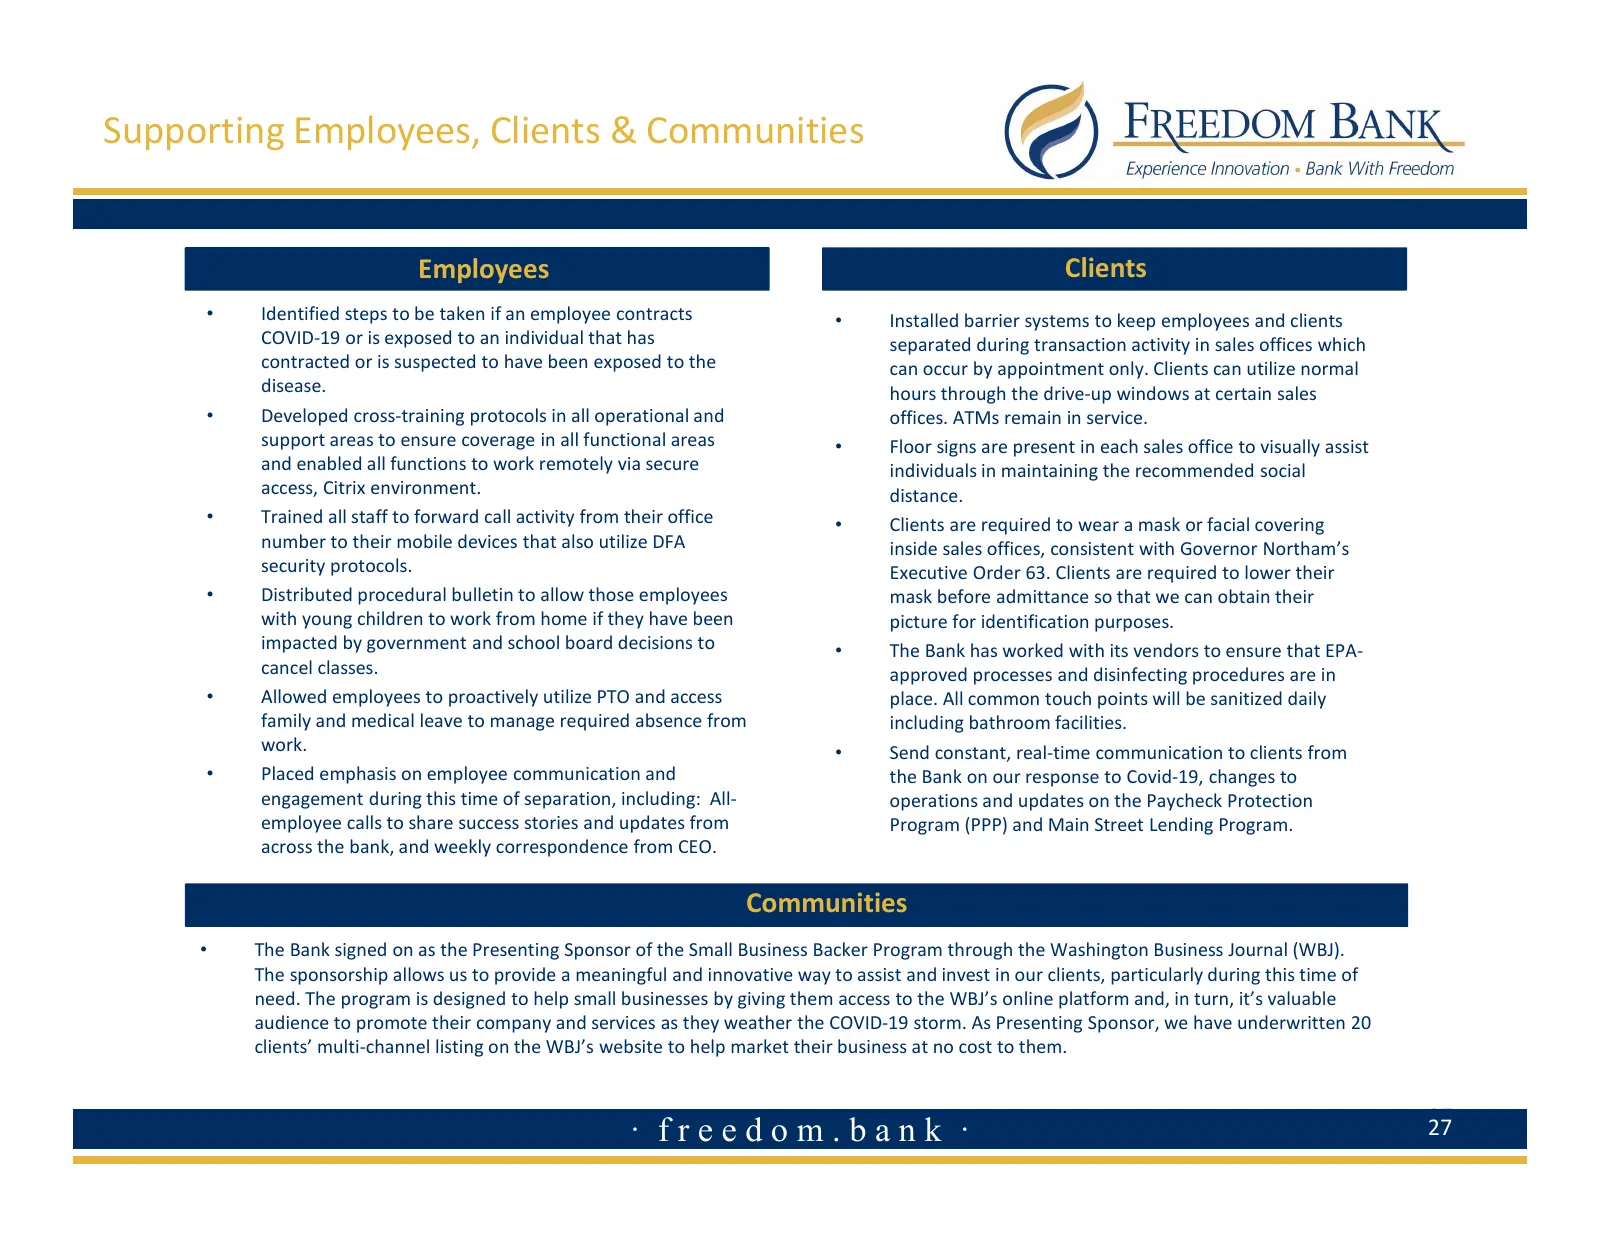
Supporting Employees, Clients & Communities Employees Clients • Identified steps to be taken if an employee contracts • Installed barrier systems to keep employees and clients COVID-19 or is exposed to an individual that has separated during transaction activity in sales offices which contracted or
Slide 28: CARES Act Payment Deferral
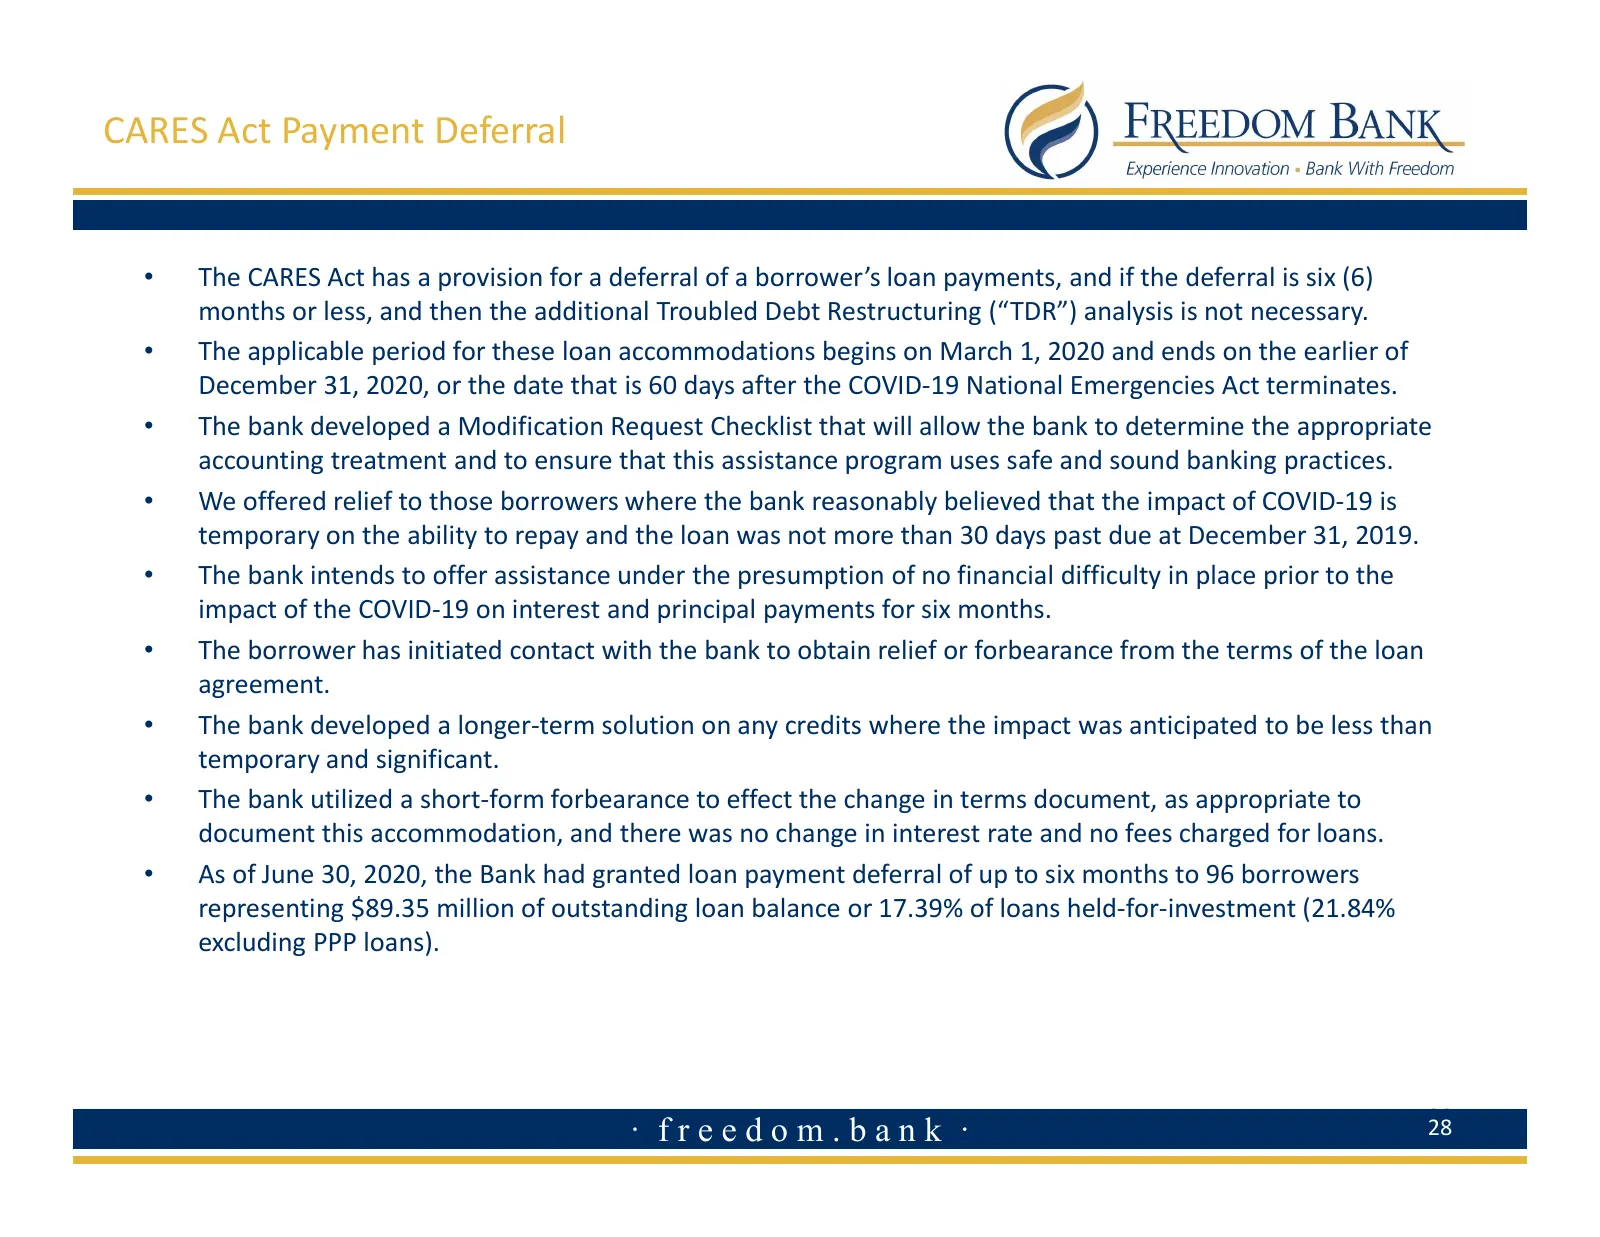
CARES Act Payment Deferral • The CARES Act has a provision for a deferral of a borrower’s loan payments, and if the deferral is six (6) months or less, and then the additional Troubled Debt Restructuring (“TDR”) analysis is not necessary. • The applicable period for these loan accommodations begins
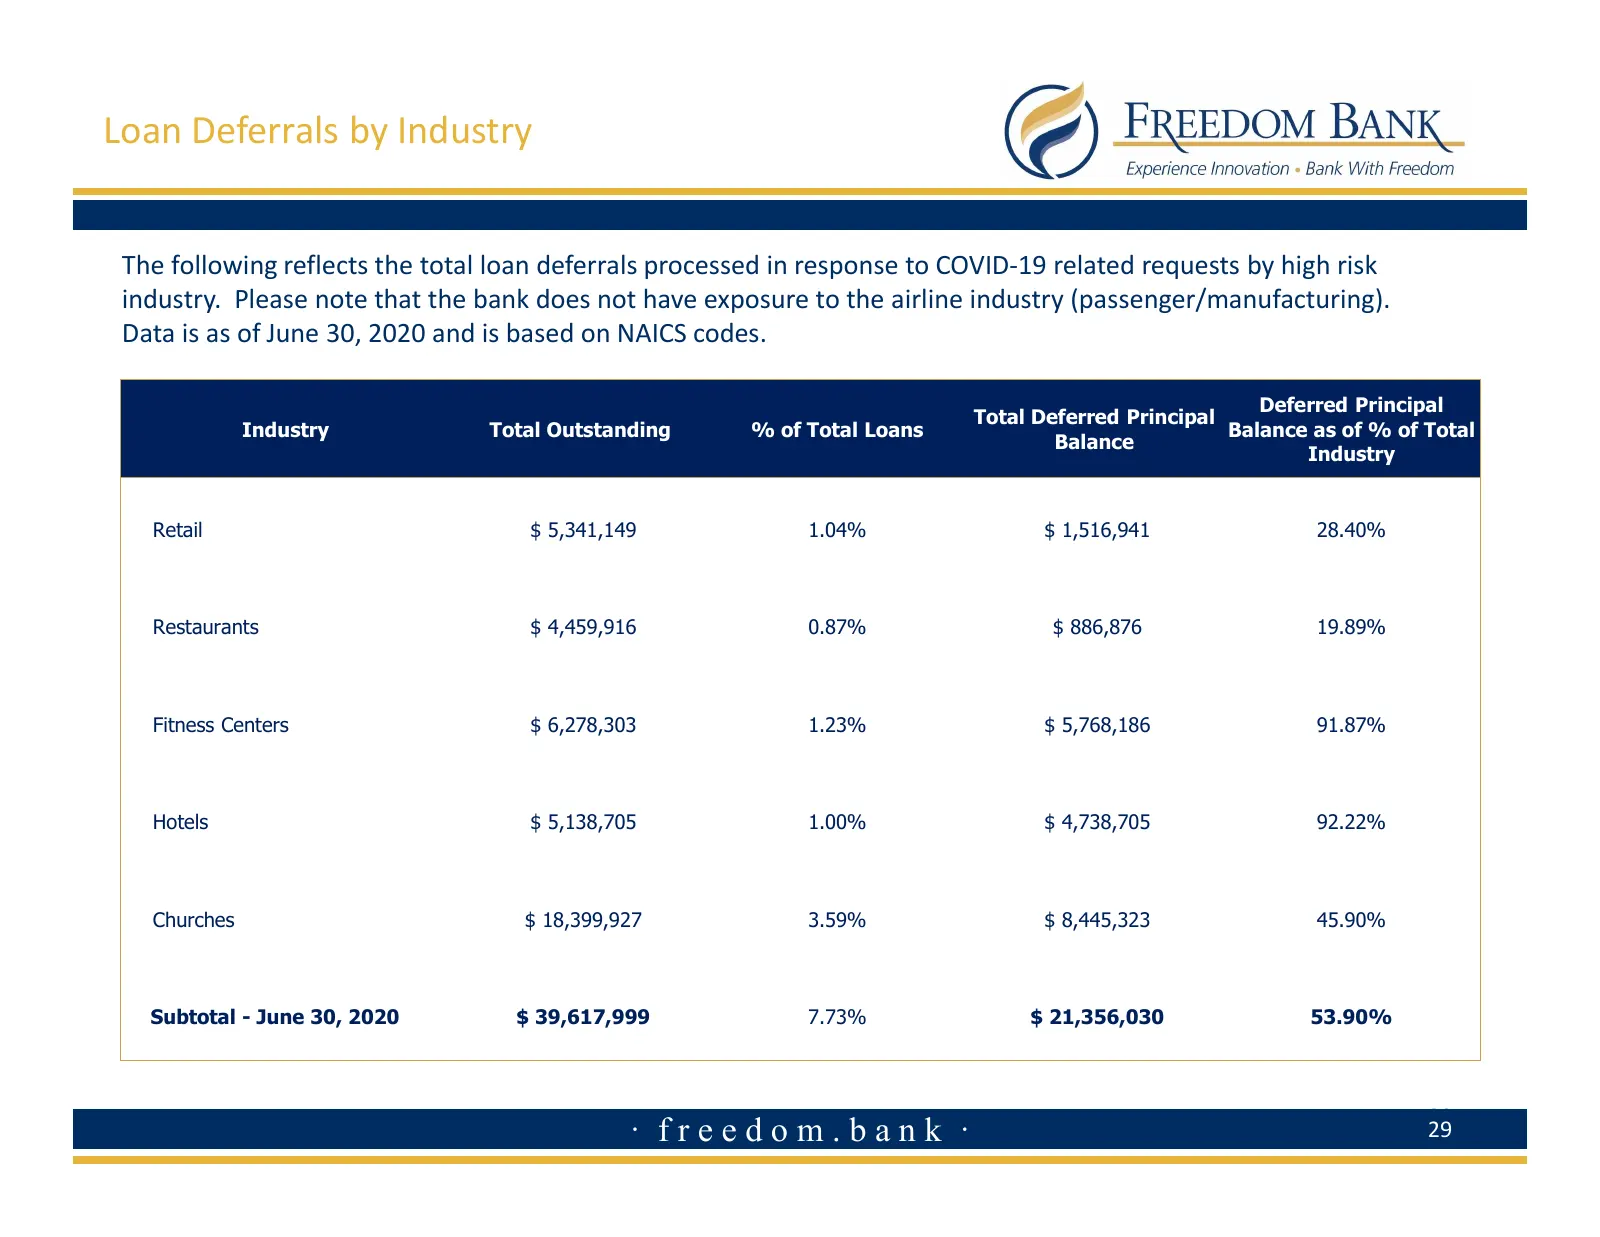
Slide 29: Loan Deferrals by Industry
Loan Deferrals by Industry The following reflects the total loan deferrals processed in response to COVID-19 related requests by high risk industry. Please note that the bank does not have exposure to the airline industry (passenger/manufacturing). Data is as of June 30, 2020 and is based on NAICS c
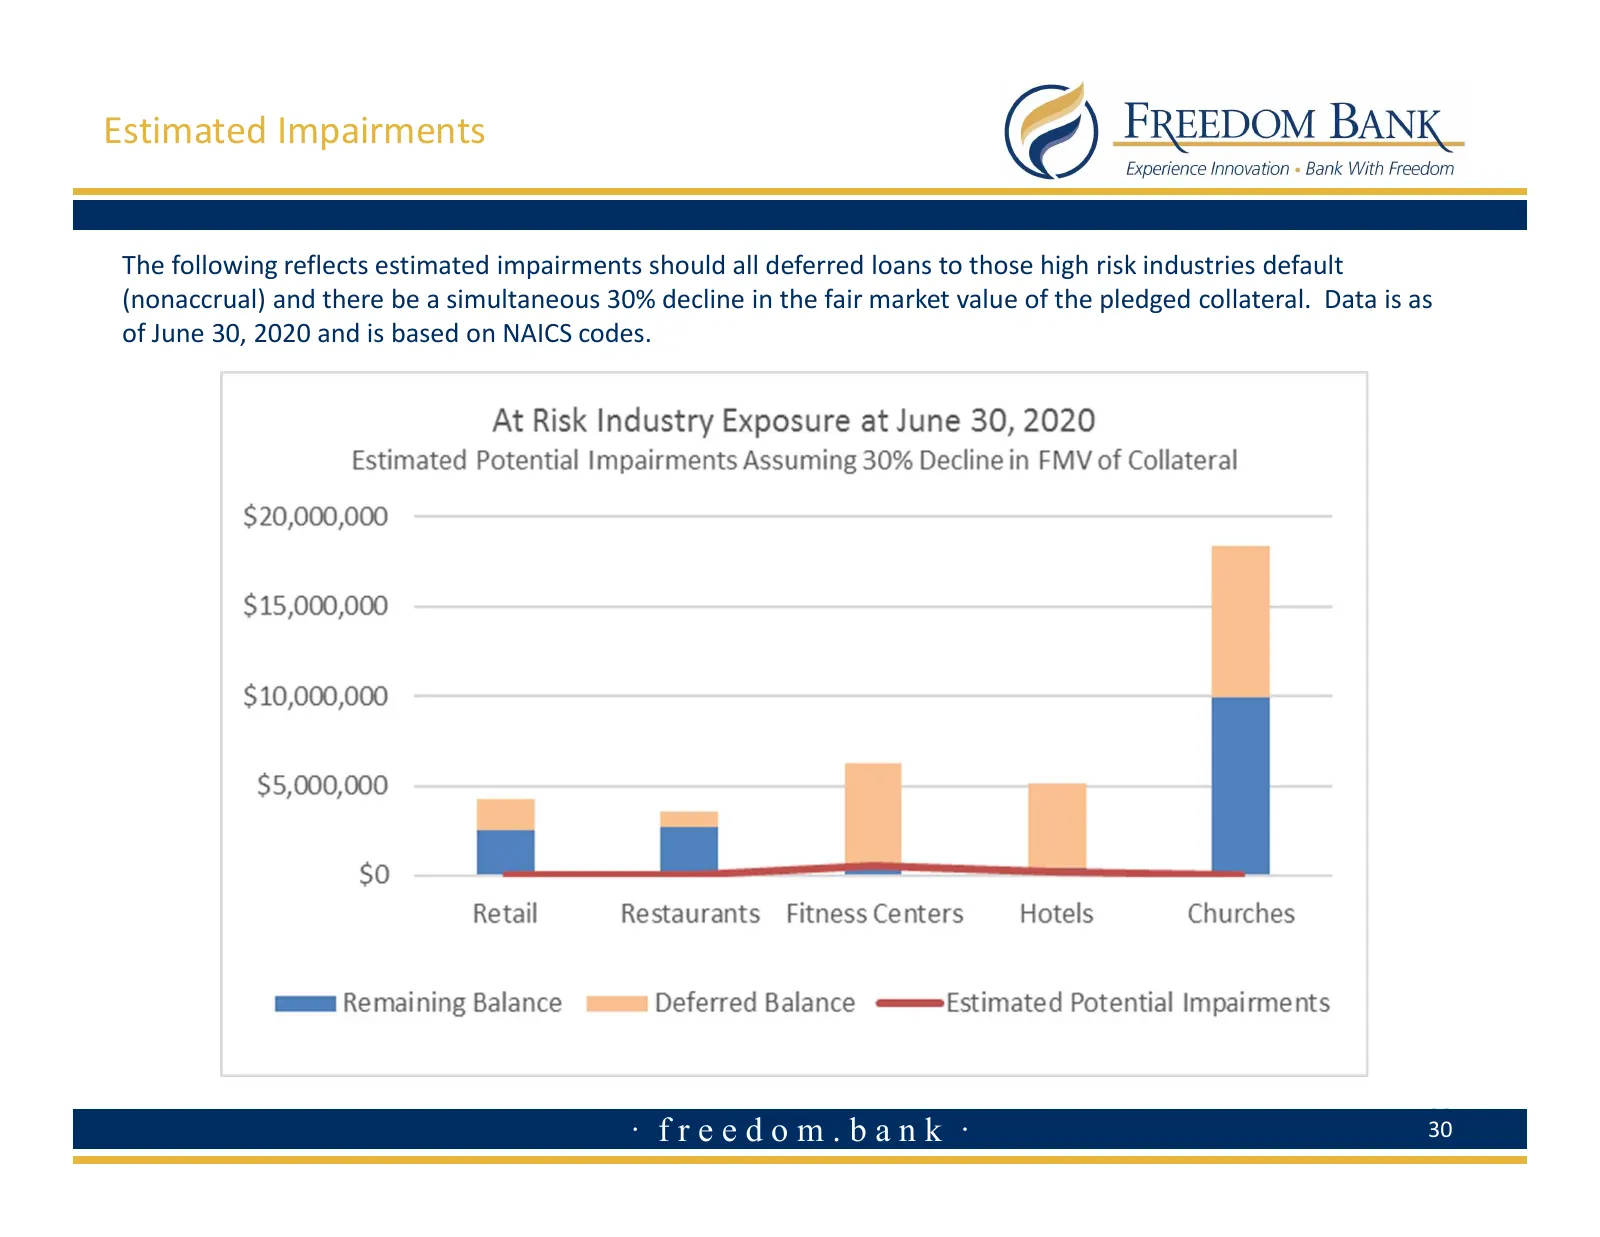
Slide 30: Estimated Impairments
Estimated Impairments The following reflects estimated impairments should all deferred loans to those high risk industries default (nonaccrual) and there be a simultaneous 30% decline in the fair market value of the pledged collateral. Data is as of June 30, 2020 and is based on NAICS codes. 30 · fr
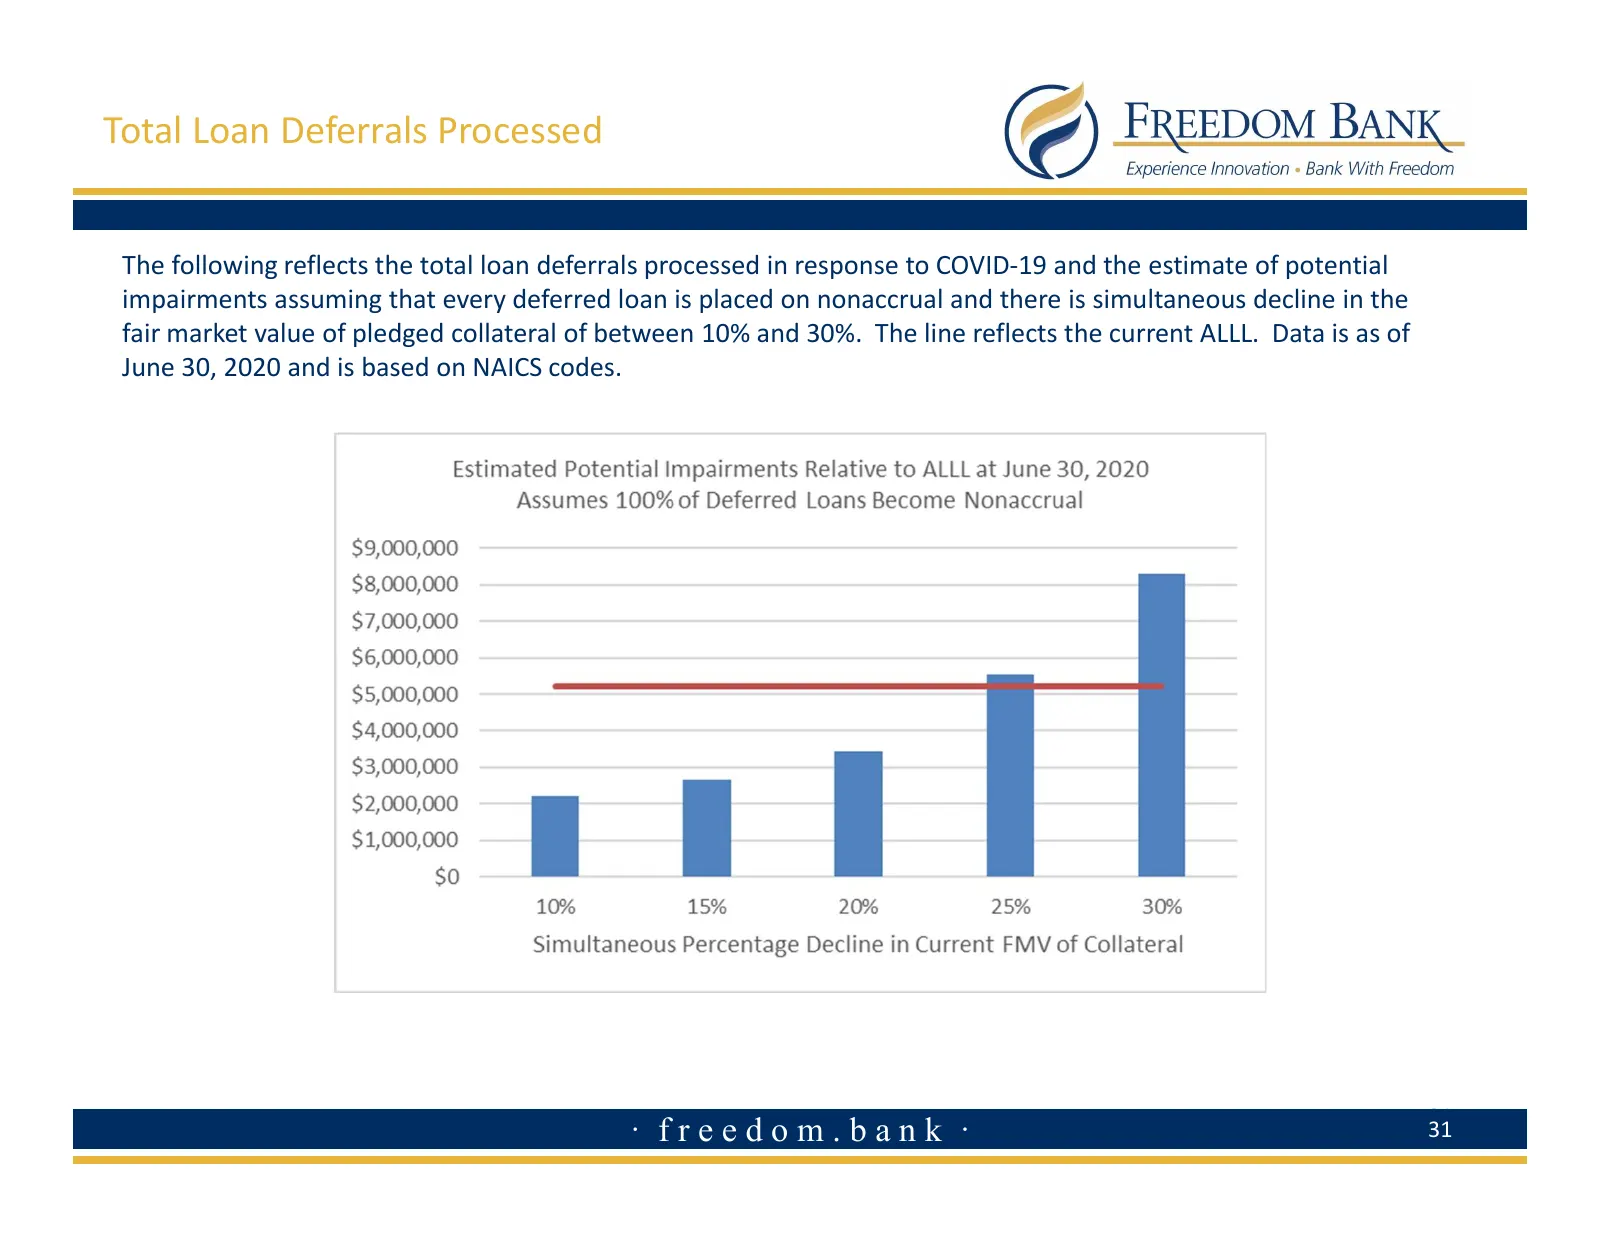
Slide 31: Total Loan Deferrals Processed
Total Loan Deferrals Processed The following reflects the total loan deferrals processed in response to COVID-19 and the estimate of potential impairments assuming that every deferred loan is placed on nonaccrual and there is simultaneous decline in the fair market value of pledged collateral of bet
Slide 32: Paycheck Protection Program (PPP)
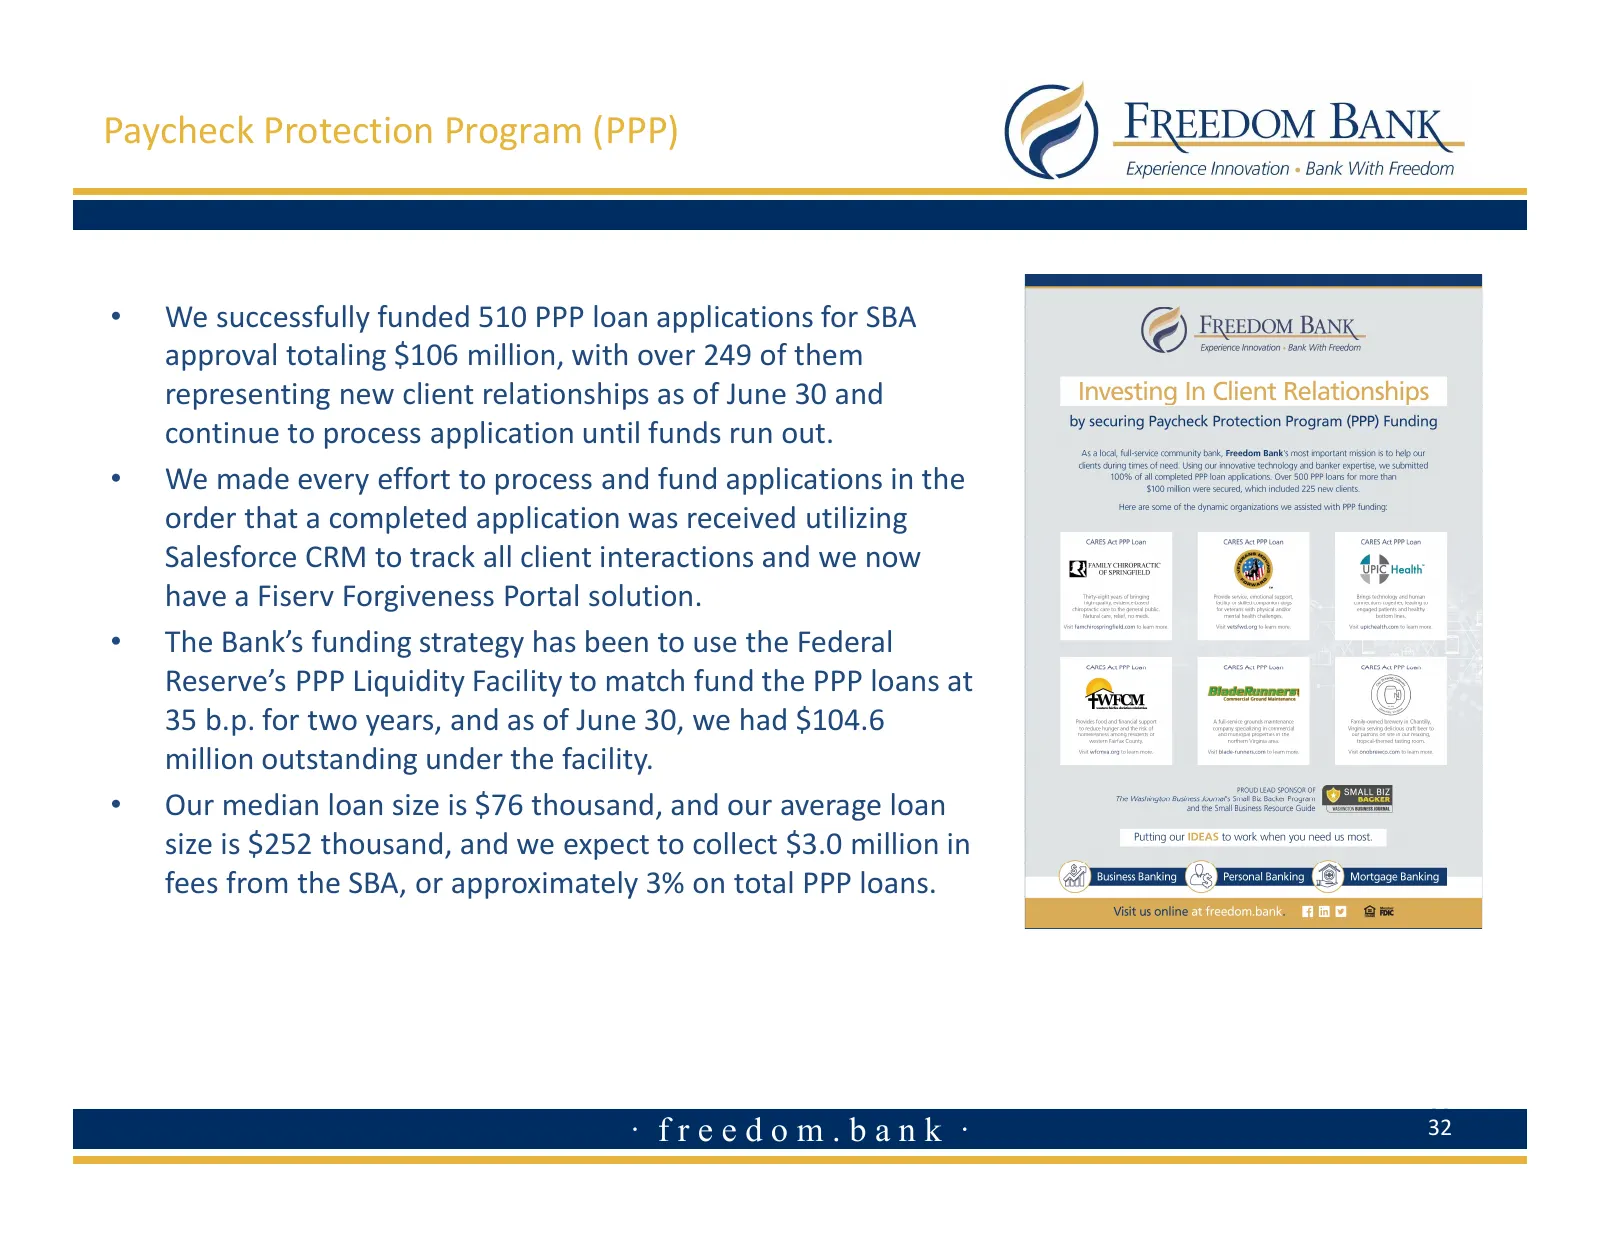
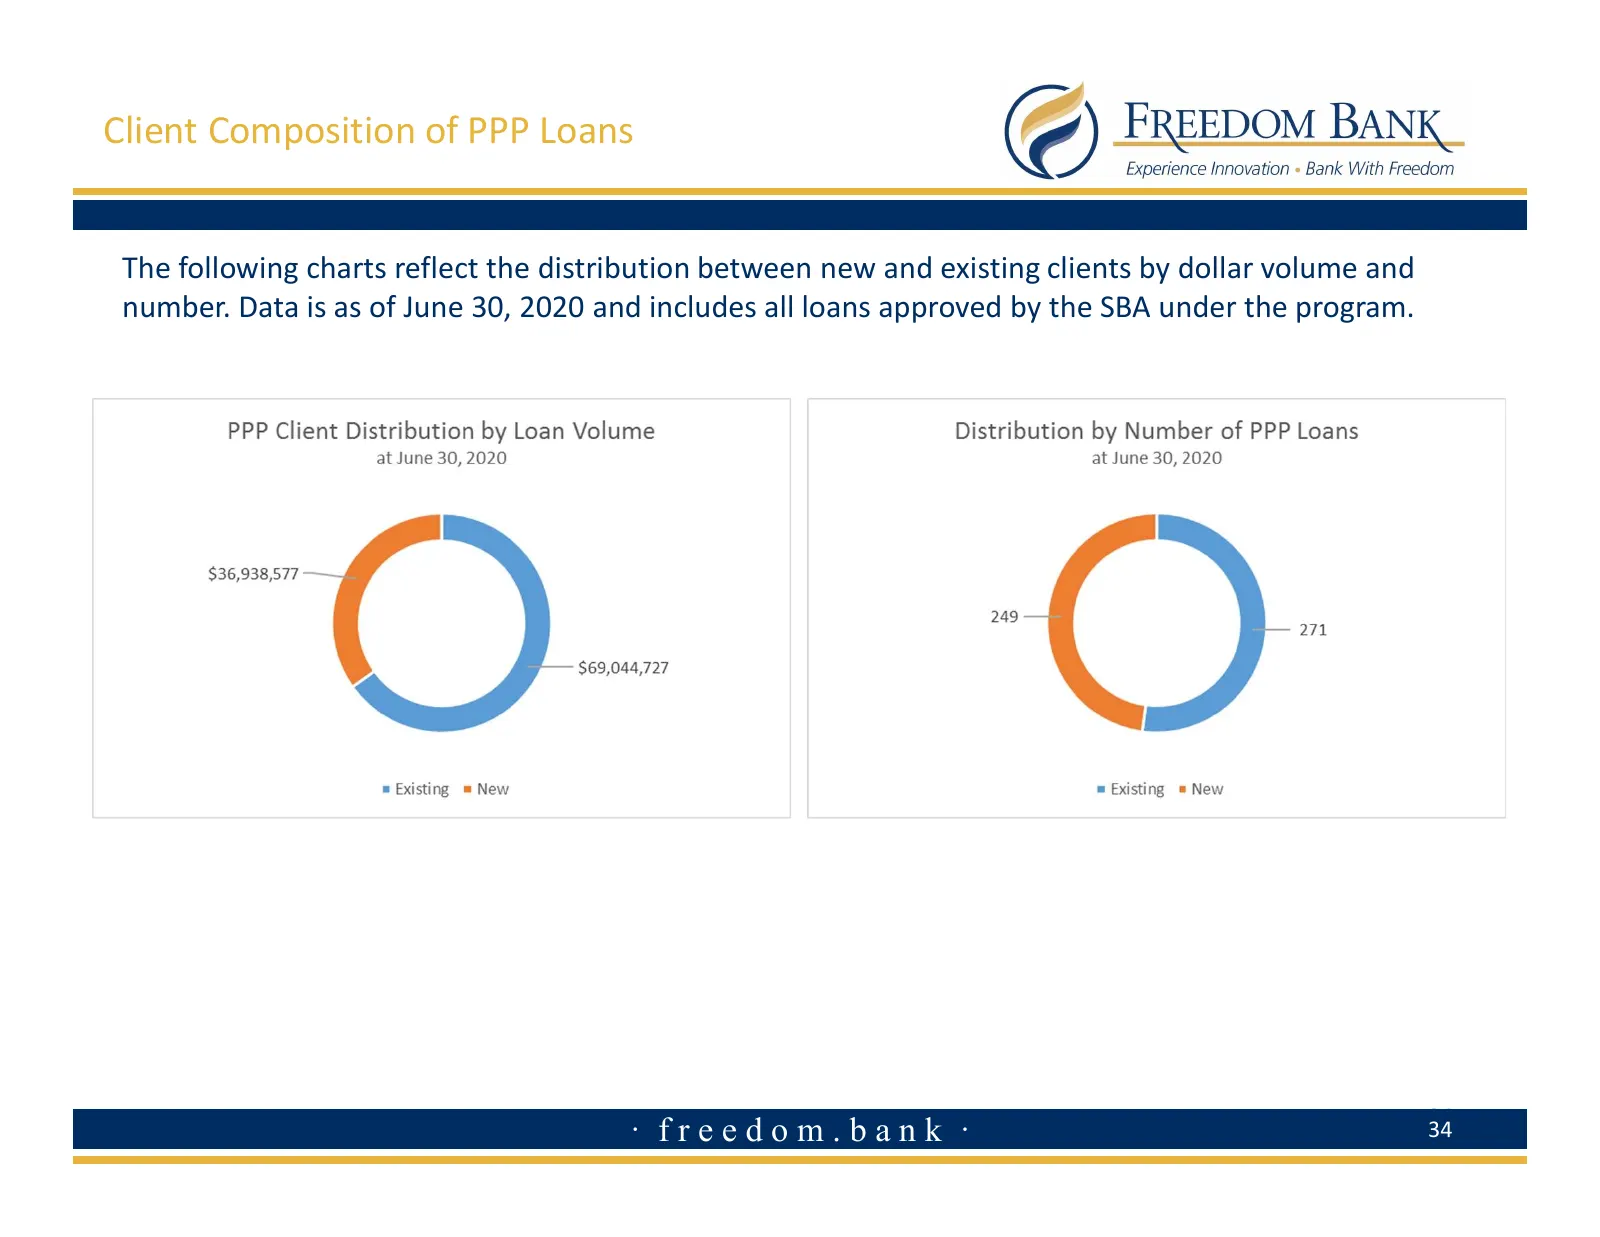
Paycheck Protection Program (PPP) • We successfully funded 510 PPP loan applications for SBA approval totaling $106 million, with over 249 of them representing new client relationships as of June 30 and continue to process application until funds run out. • We made every effort to process and fund a
Slide 33: Geographic Distribution of PPP Loans
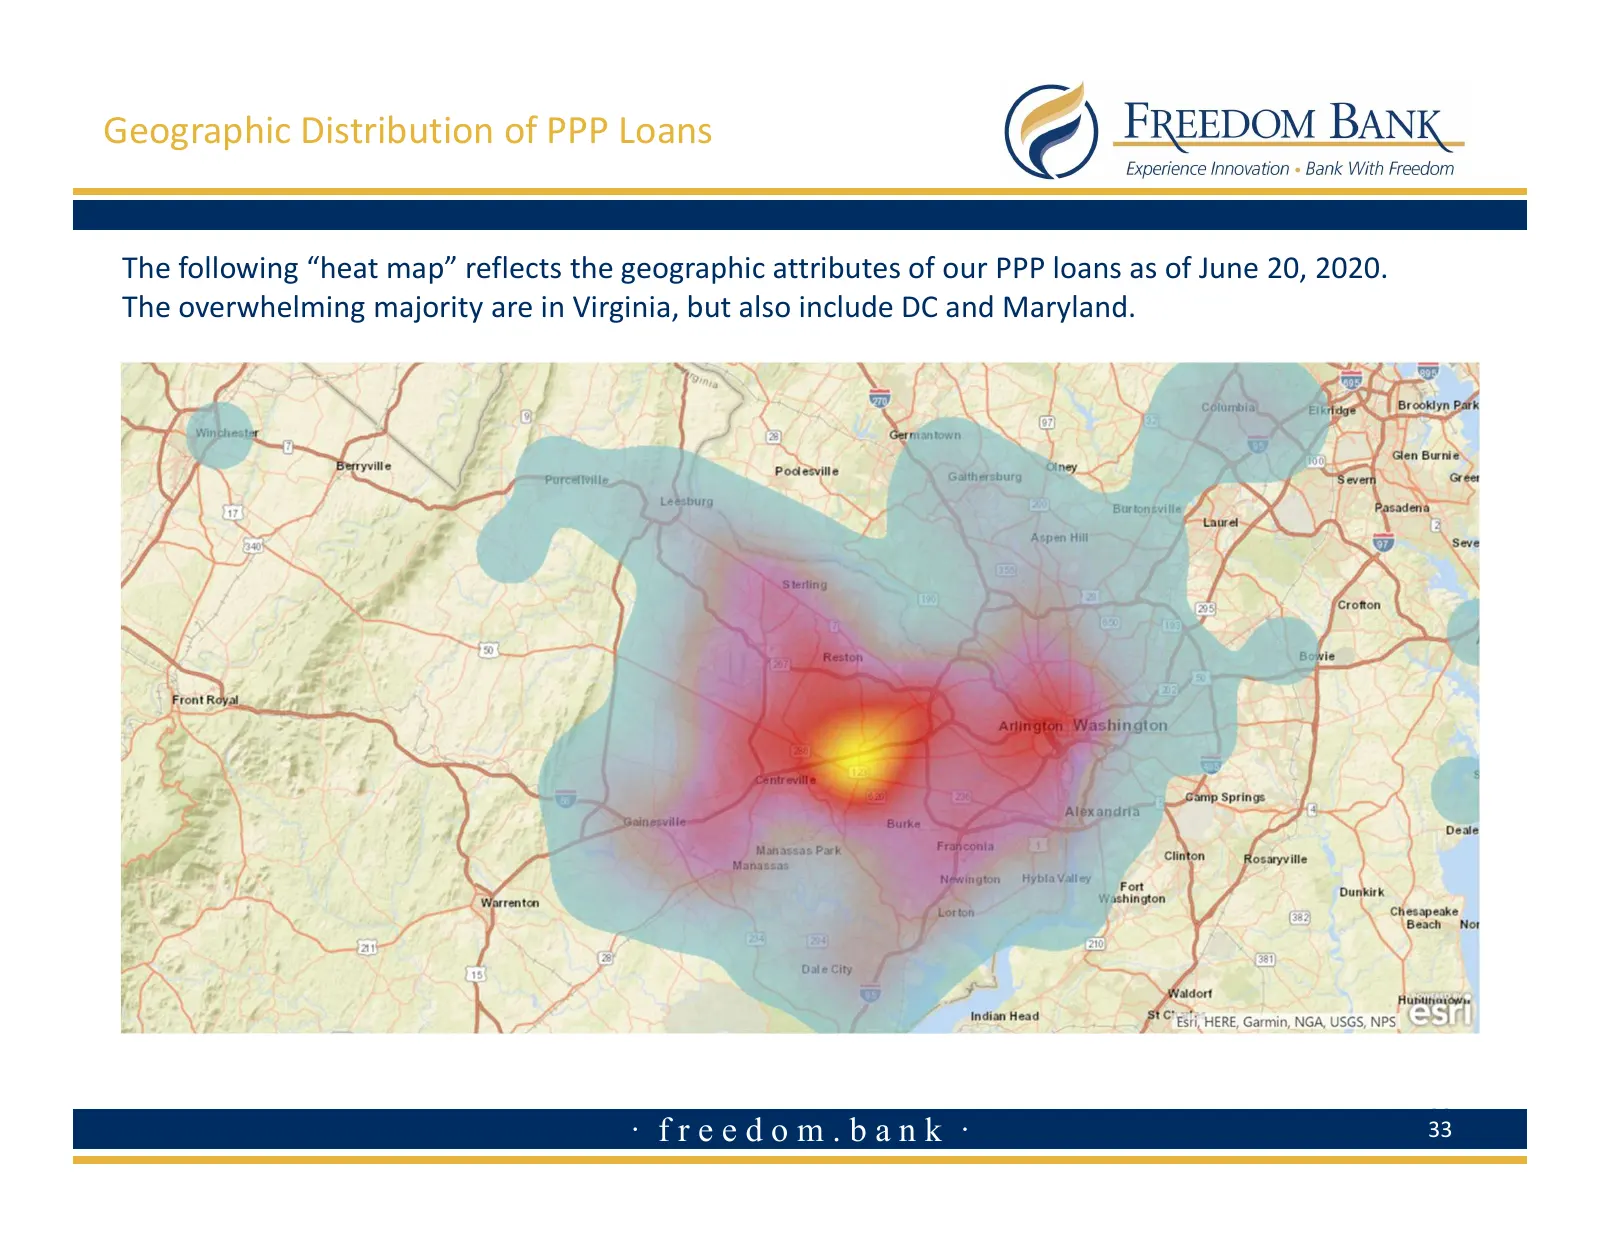
Geographic Distribution of PPP Loans The following “heat map” reflects the geographic attributes of our PPP loans as of June 20, 2020. The overwhelming majority are in Virginia, but also include DC and Maryland. 33 · freedom.bank · 33
Slide 34: Client Composition of PPP Loans
Client Composition of PPP Loans The following charts reflect the distribution between new and existing clients by dollar volume and number. Data is as of June 30, 2020 and includes all loans approved by the SBA under the program. 34 · freedom.bank · 34
Slide 35: Investment Summary
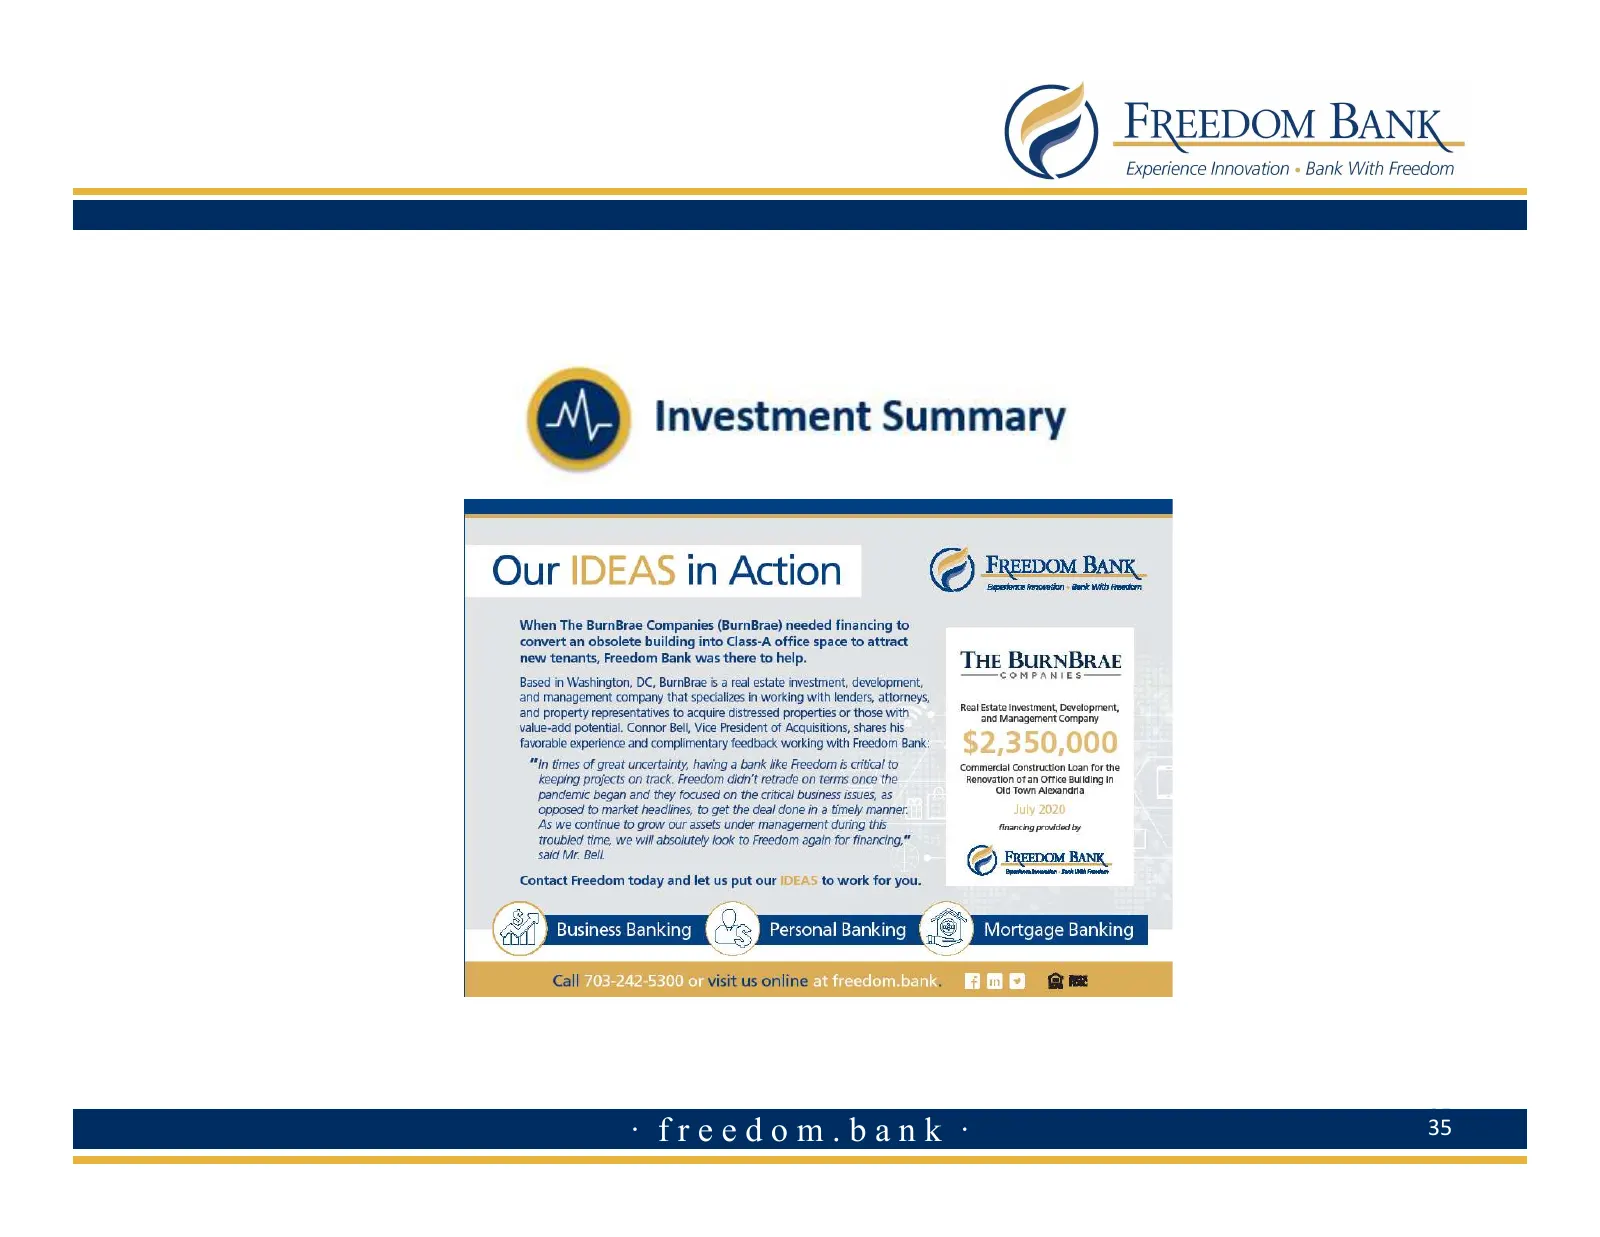
FREEDOM BANK Experience Innovation + Bank With Freedom Investment Summary Our !DEAS in Action FREEDOM BANK_ ‘Spiec roeeon ek Ms eta, When The BurnBrae Companies (BurnBrae) needed financing to convert an obsolete building into Class-A office space to attract new tenants, Freedom Bank was there to hel
Slide 36: Investment Attributes
Investment Attributes • Washington DC MSA and Northern Virginia market is one of the largest, affluent, diverse, and resilient economies in the United States and should fare better than most markets impacted by COVID-19. • The Company’s strategic repositioning over the course of 2018/19 puts Freedom
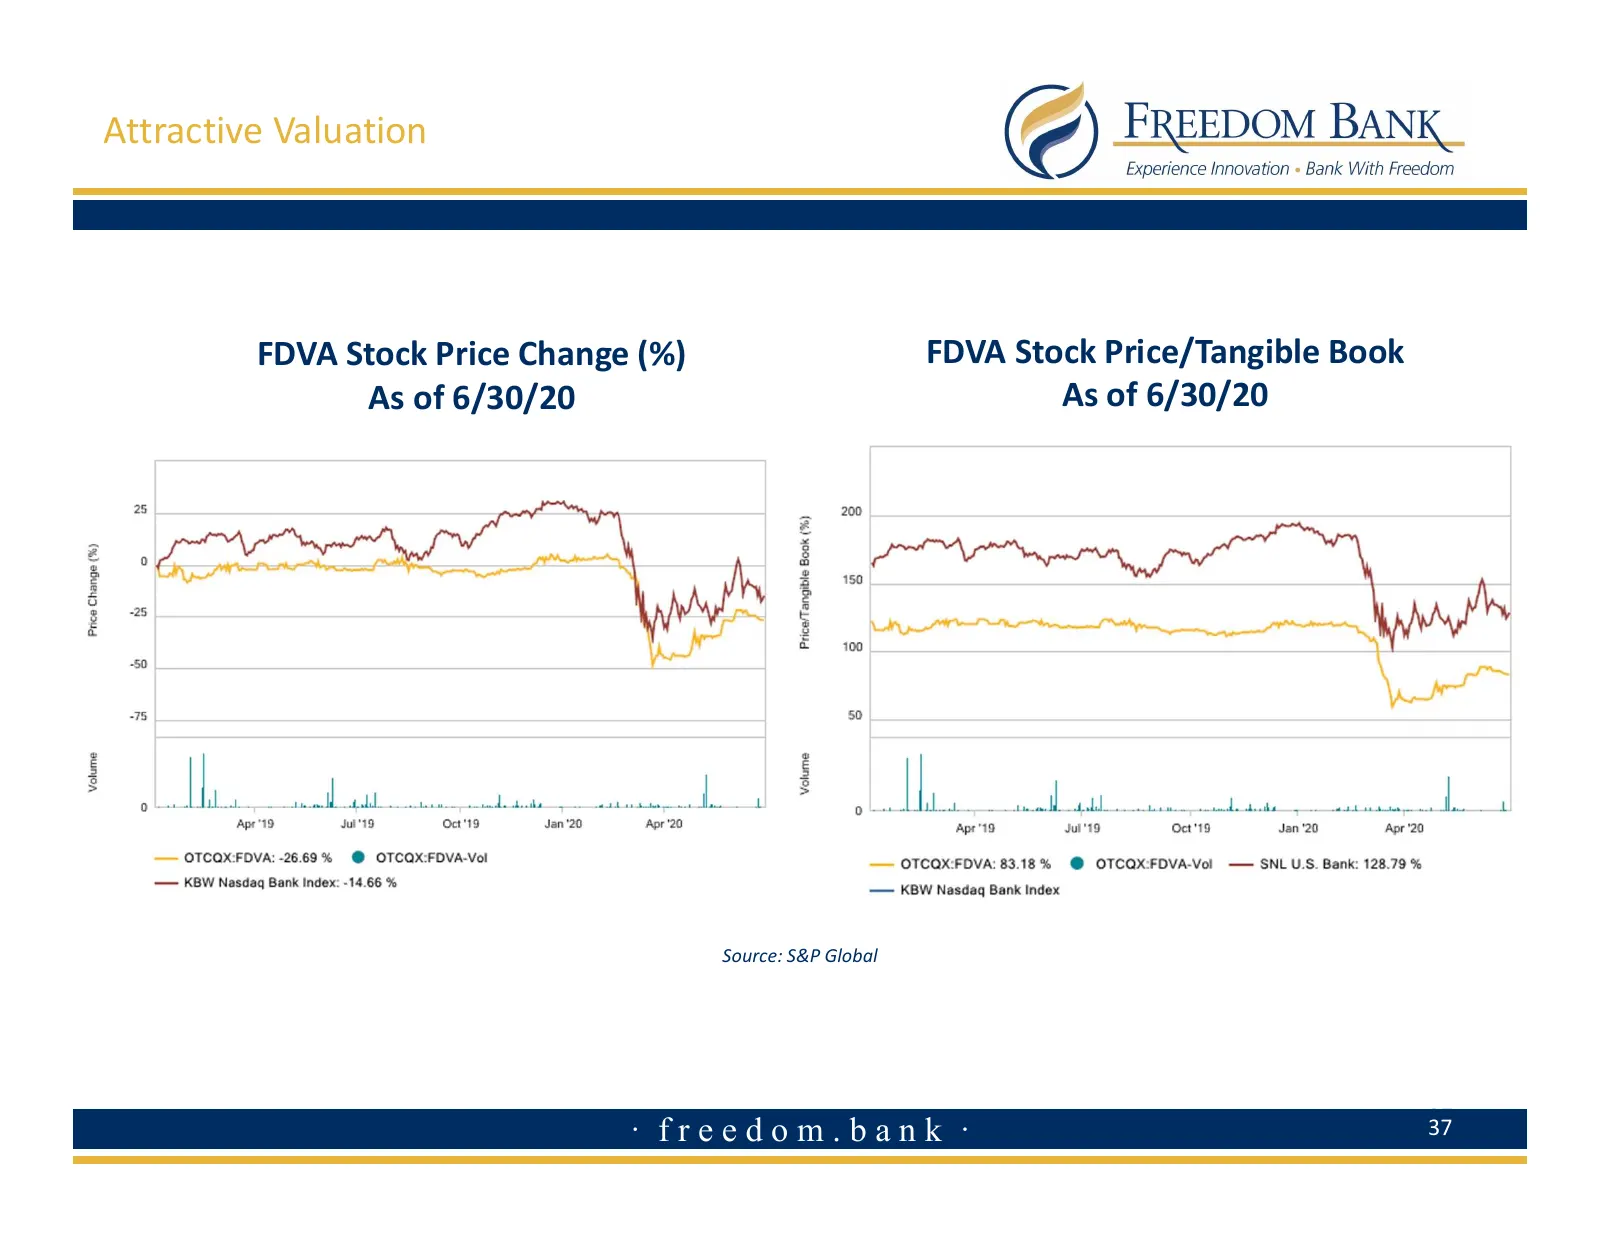
Slide 37: Attractive Valuation
Attractive Valuation FDVA Stock Price Change (%) FDVA Stock Price/Tangible Book As of 6/30/20 As of 6/30/20 Source: S&P Global 37 · freedom.bank · 37
Slide 38: Contact Information
Contact Information Joseph J. Thomas, CFA President and CEO [email protected] @Joseph_J_Thomas 703-667-4161 10555 Main Street Suite 600 Fairfax, Virginia 22038 · freedom.bank · 38
Source: company website
More decks from Freedom Financial Holdings Inc
 Q3 2026 Earnings Presentation32 slides · Nov 3, 2026
 Q2 2026 Earnings Presentation31 slides · Aug 3, 2026
 Shareholder Meeting (April 2026)41 slides · Apr 30, 2026
 Q4 2025 Earnings Presentation39 slides · Jan 30, 2026
 Q3 2025 Earnings Presentation39 slides · Oct 31, 2025
 Q2 2025 Earnings Presentation38 slides · Aug 4, 2025