Heartland Financial USA — IPO Roadshow (June 2020)
50 slides from Heartland Financial USA's IPO roadshow presentation, Jun 19, 2020

Slide 1: Heartland Financial USA, Inc. June 2020
PRESENTATION CAN BE UP TO THREE LINES CAN BE UP TO THREE LINES 1 Presentation Subtitle Heartland Financial USA, Inc.June 2020
Slide 2: Safe Harbor
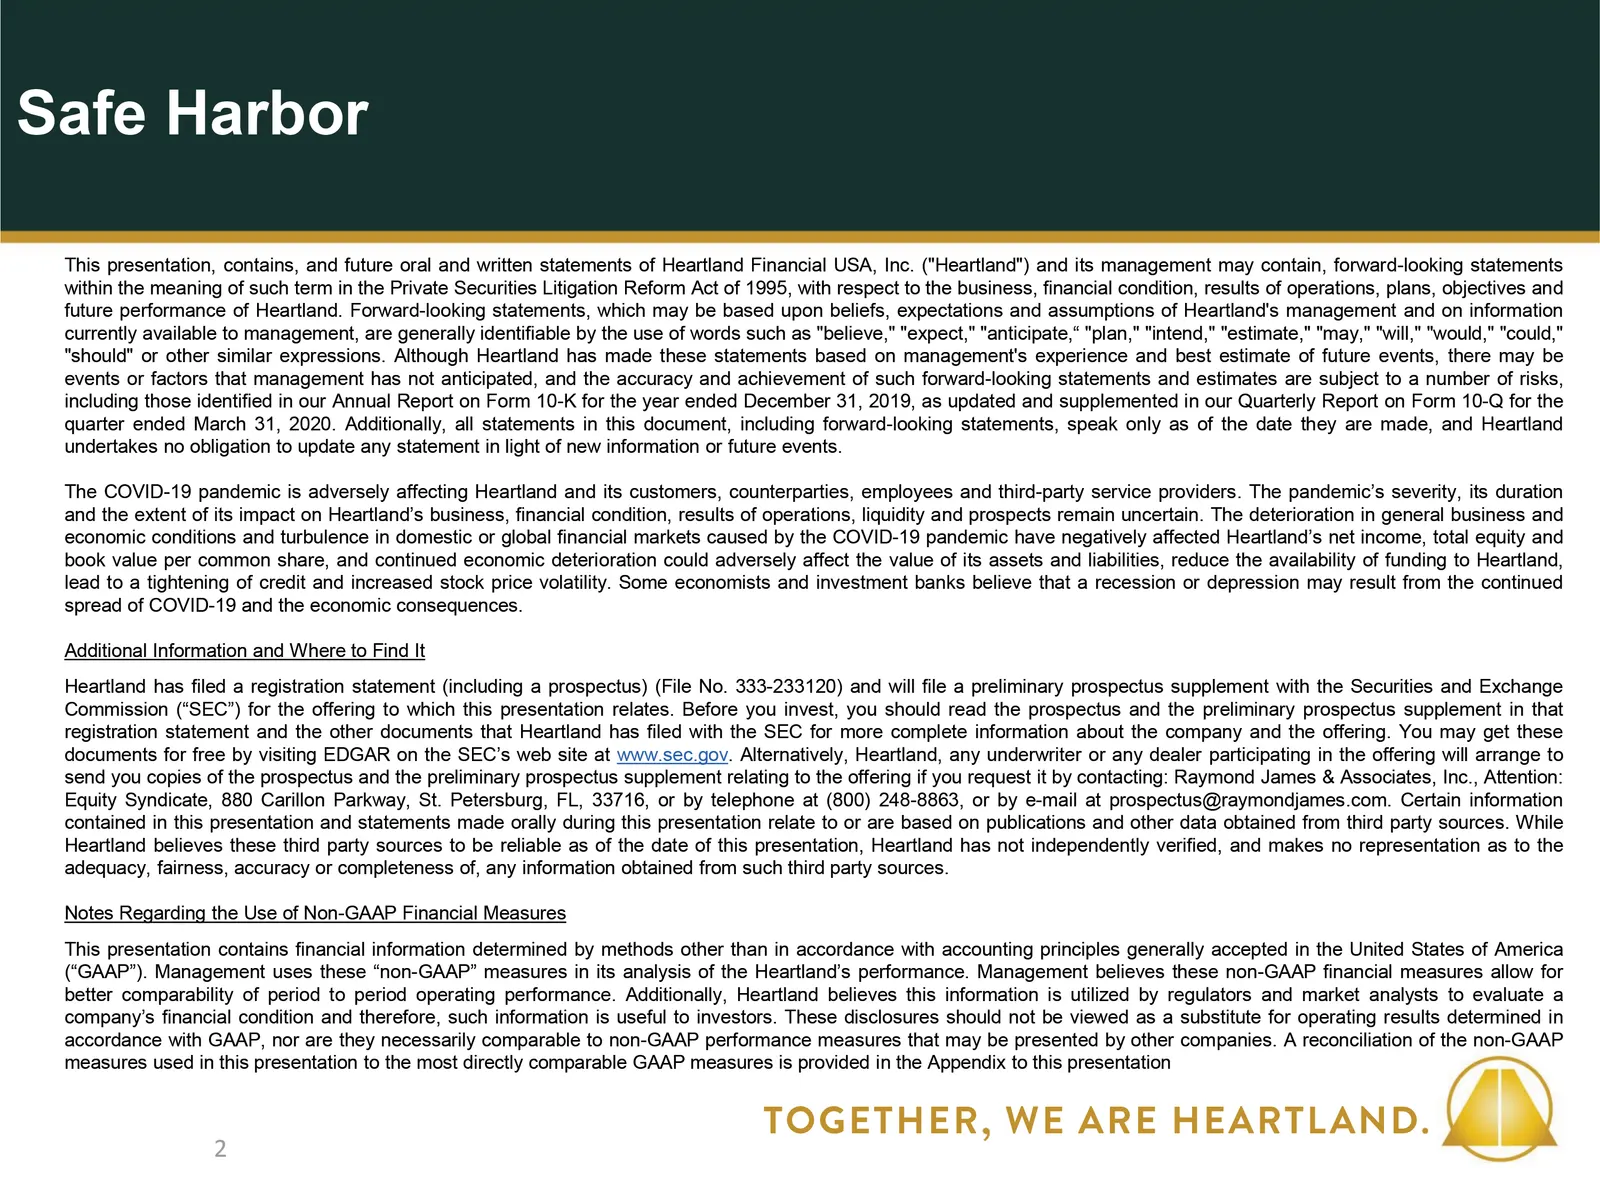
Safe Harbor 2 This presentation, contains, and future oral and written statements of Heartland Financial USA, Inc. ("Heartland") and its management may contain, forward-looking statements within the meaning of such term in the Private Securities Litigation Reform Act of 1995, with respect to the bus
Slide 3: Offering Summary: Series E Preferred Depositary Shares
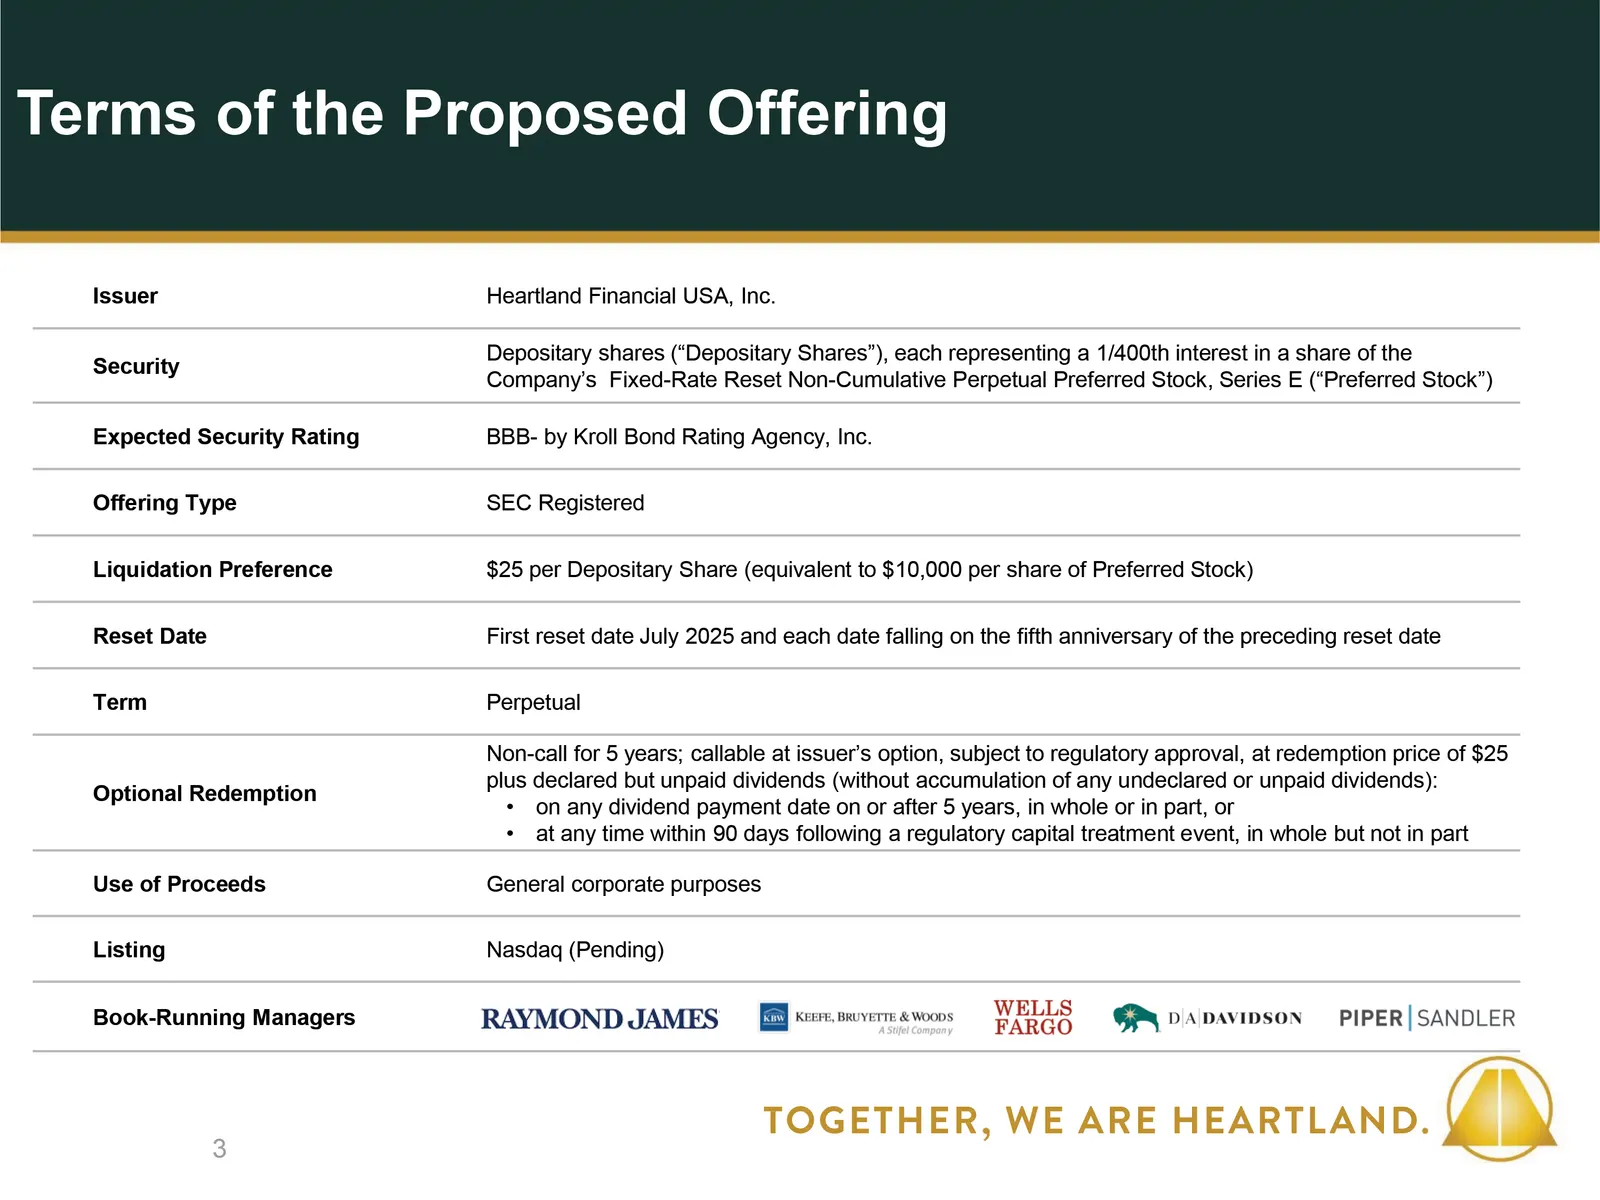
Issuer HeartlandFinancial USA, Inc. Security Depositary shares (“Depositary Shares”), each representing a 1/400th interest in a share of the Company’s Fixed-RateReset Non-Cumulative Perpetual Preferred Stock, Series E (“Preferred Stock”) Expected Security Rating BBB-by Kroll Bond Rating Agency, Inc.

Slide 4: About Heartland Financial USA, Inc.
PRESENTATION CAN BE UP TO THREE LINES CAN BE UP TO THREE LINES 4 Presentation Subtitle About Heartland Financial USA, Inc.
Slide 5: Company Overview – Fiscal Q1 2020 Financial Highlights
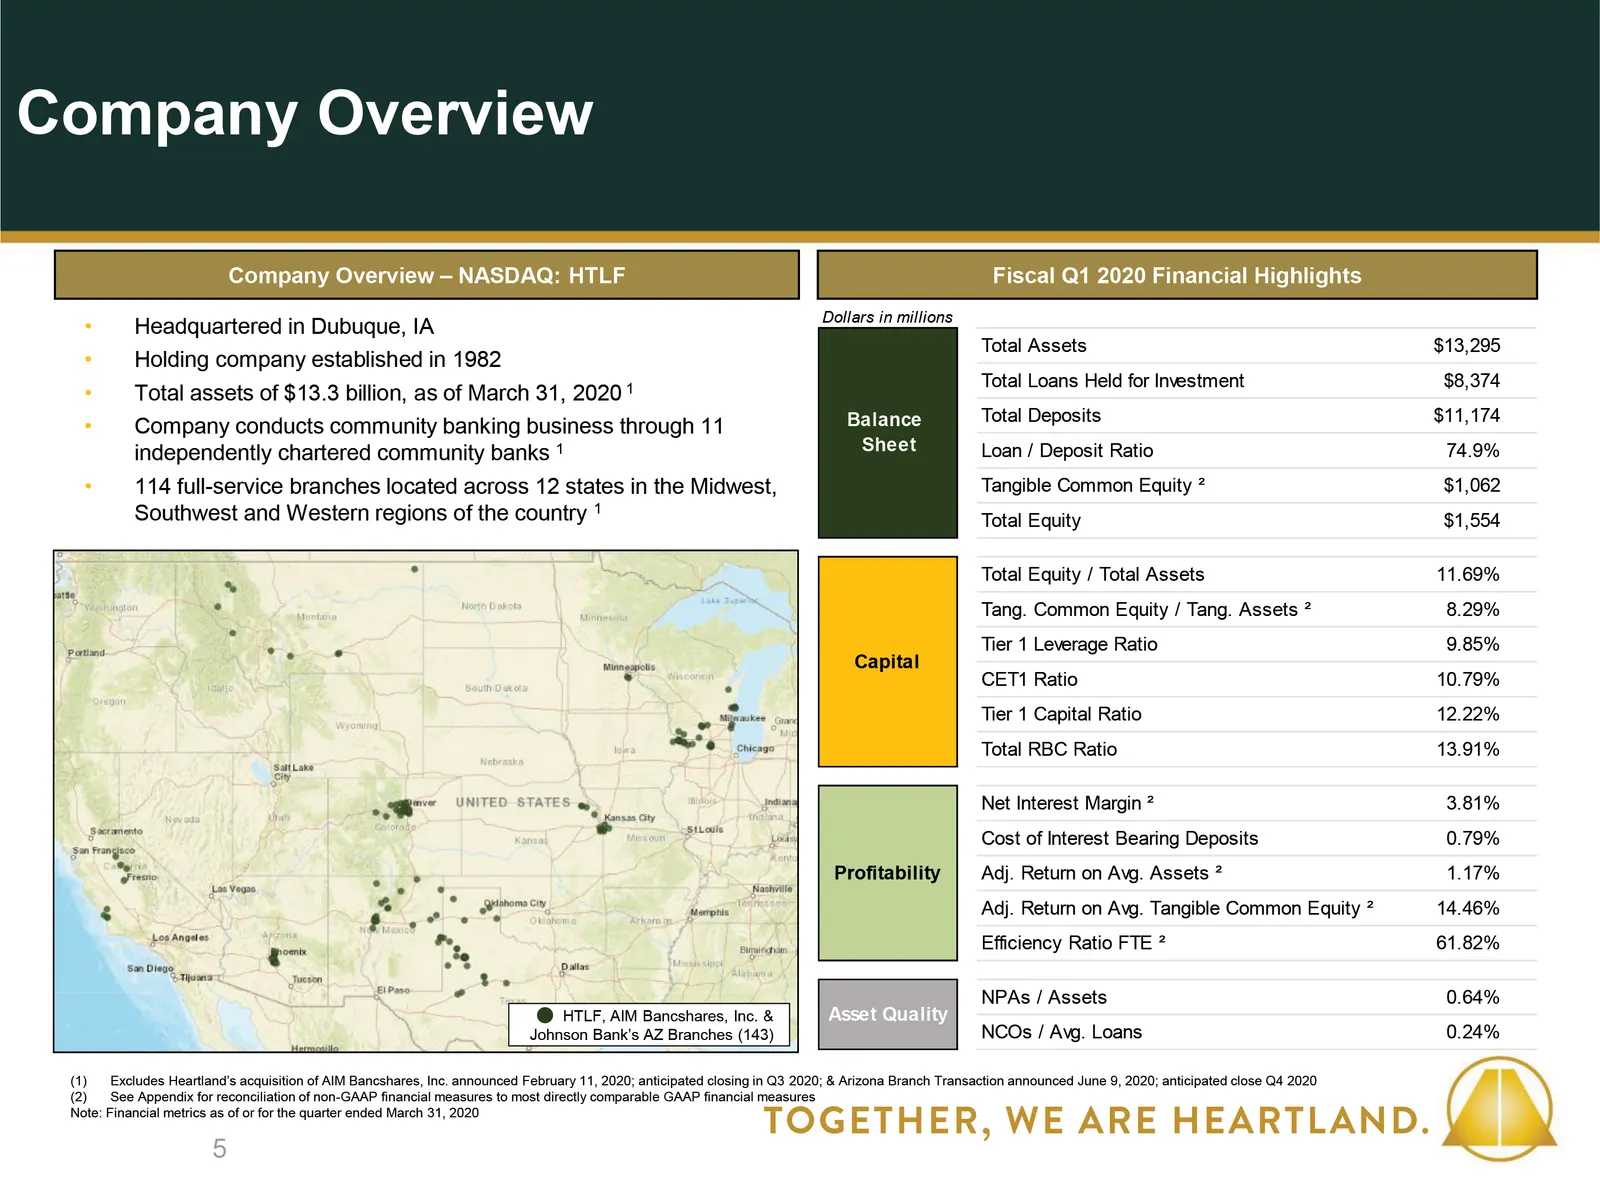
5 Company Overview – NASDAQ: HTLF Fiscal Q1 2020 Financial Highlights Headquartered in Dubuque, IAHolding company established in 1982Total assets of $13.3 billion, as of March 31, 2020 1Company conducts community banking business through 11 independently chartered community banks 1114 full-service b
Slide 6: Subsidiary Banks by Region
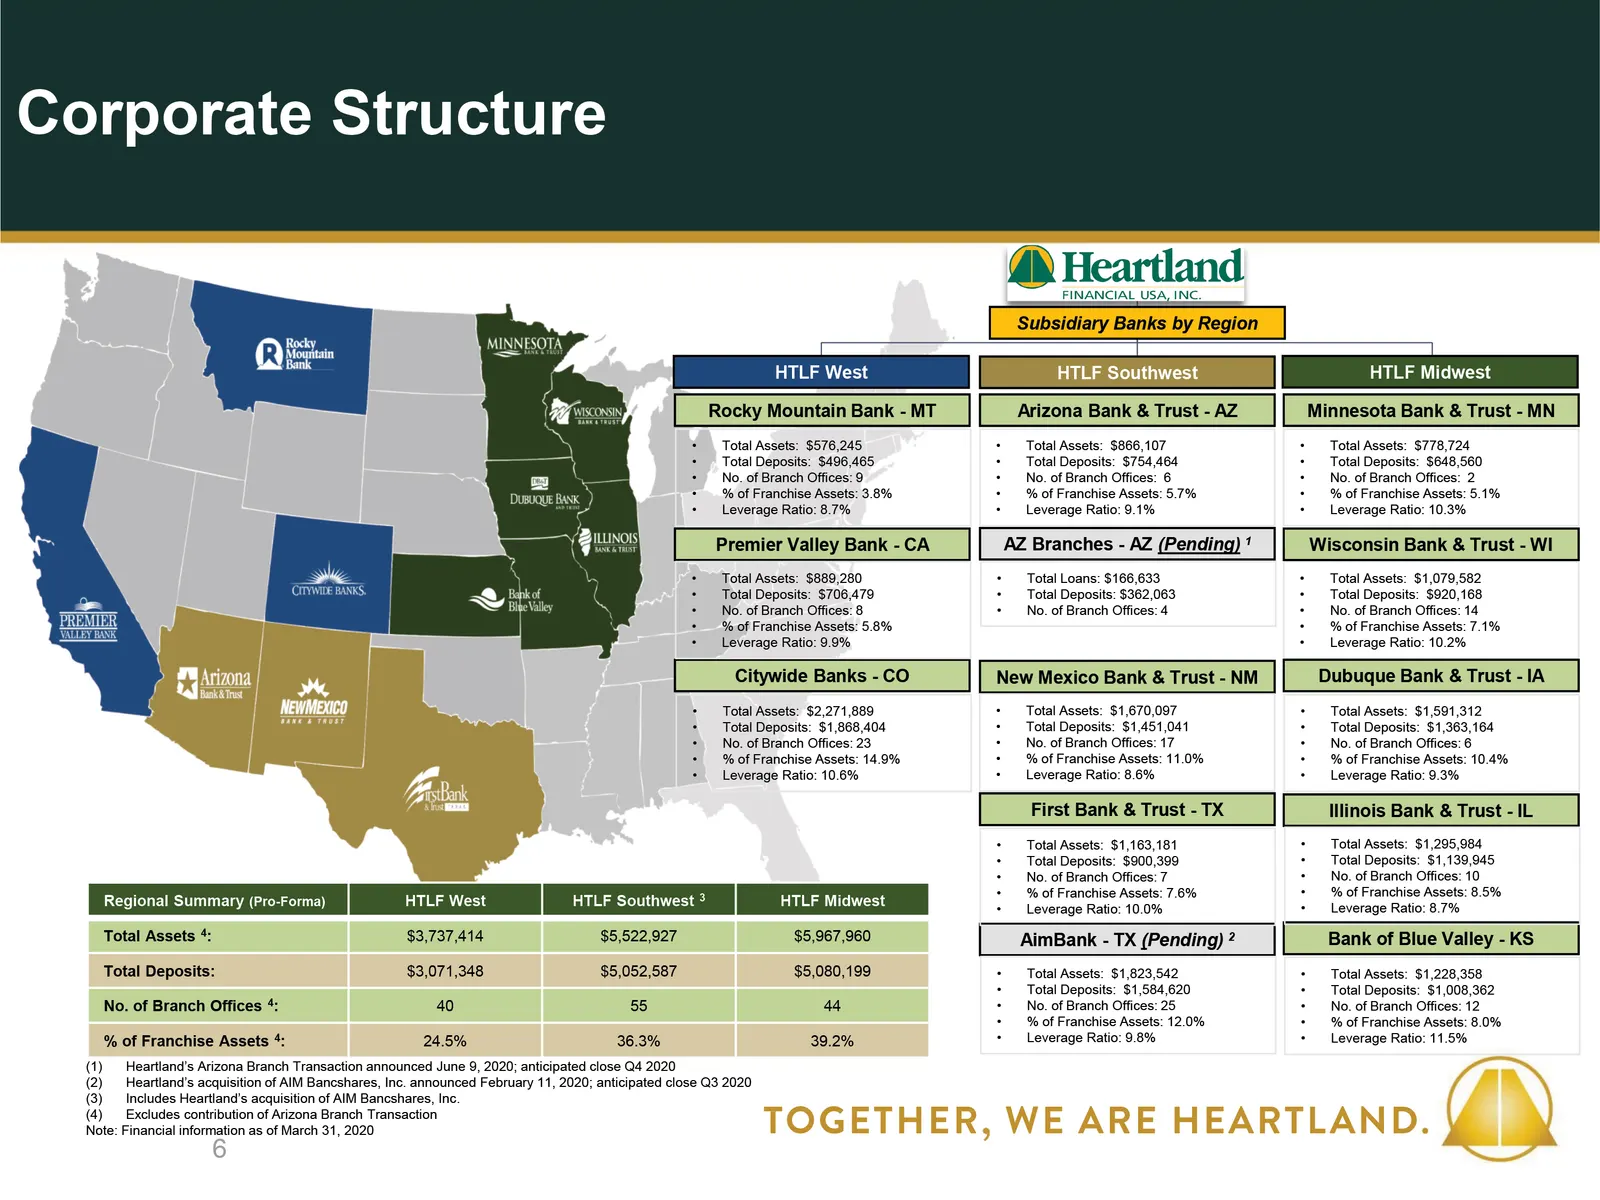
Total Assets: $1,079,582Total Deposits: $920,168No. of Branch Offices: 14% of Franchise Assets: 7.1%Leverage Ratio: 10.2% Total Assets: $778,724Total Deposits: $648,560No. of Branch Offices: 2% of Franchise Assets: 5.1%Leverage Ratio: 10.3% 6 Arizona Bank & Trust - AZ Bank of Blue Valley - KS Citywi
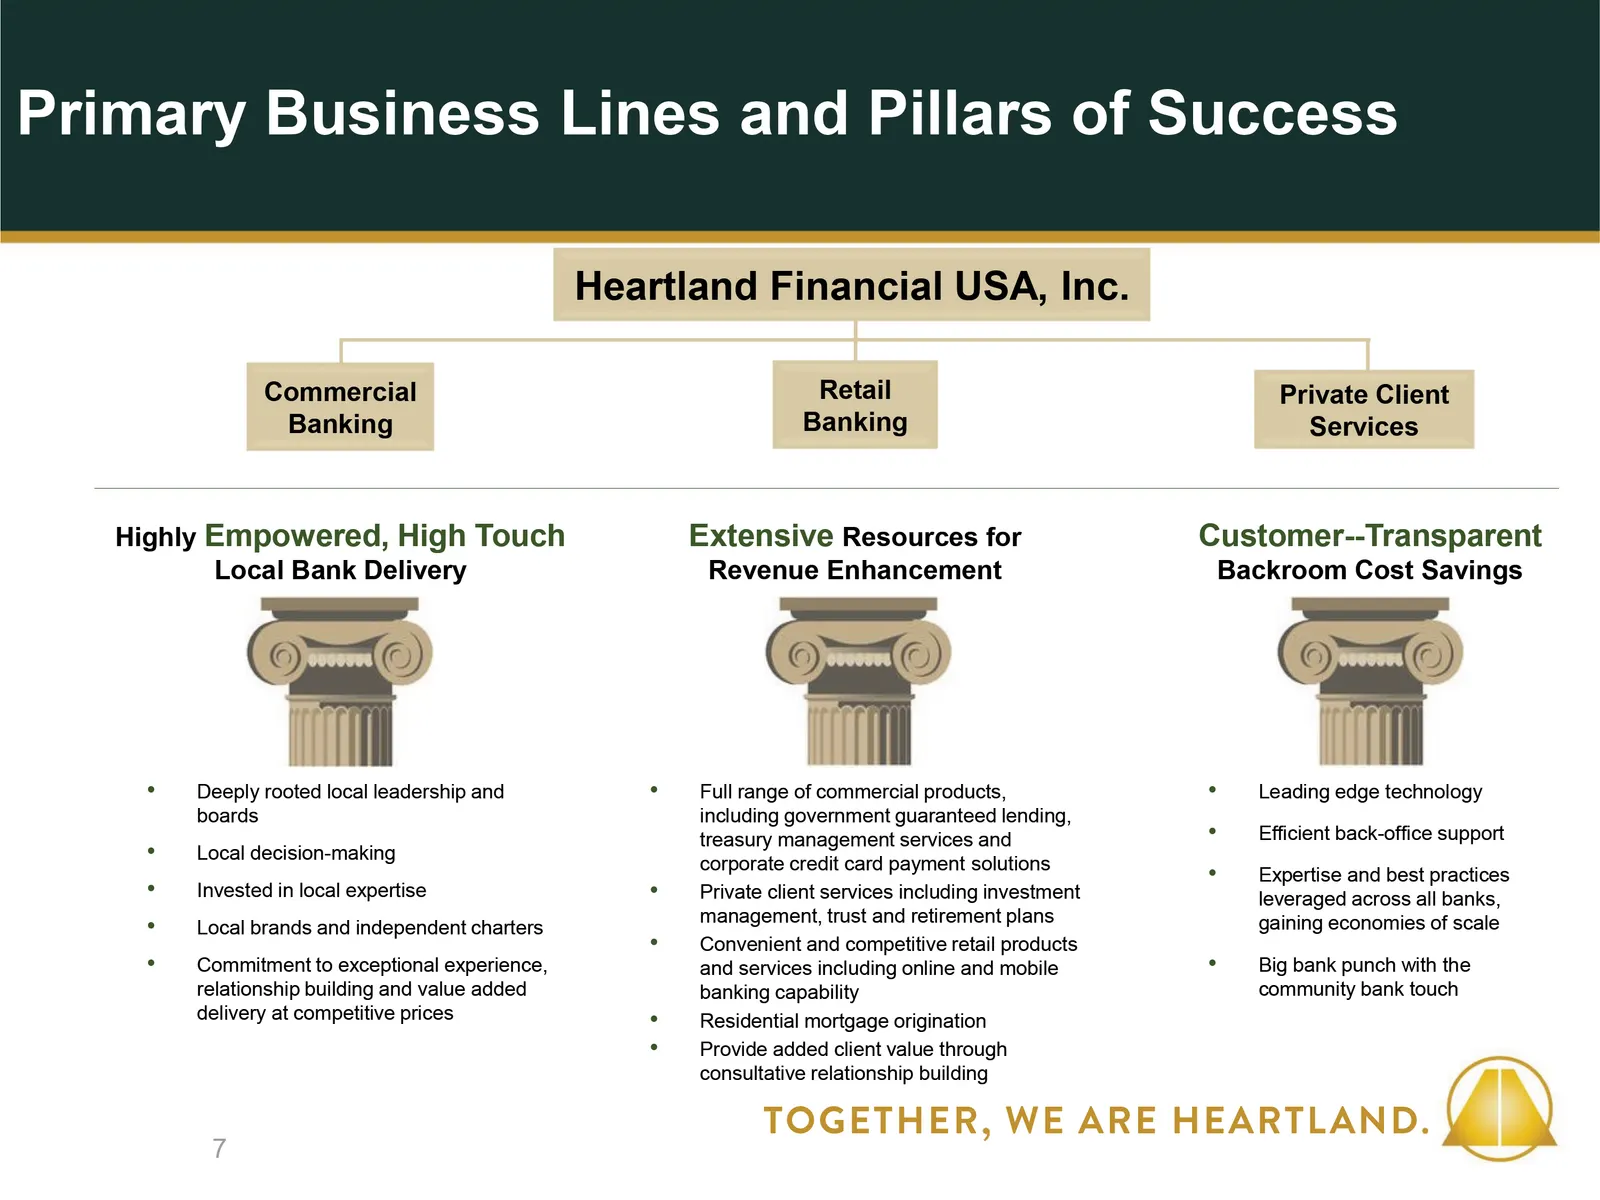
Slide 7: Local Bank Delivery with Extensive Resources
7 568735 2551920 192212152 16113769 3173125 175171171 216202164 Highly Empowered, High TouchLocal Bank Delivery Extensive Resources for Revenue Enhancement Customer--TransparentBackroom Cost Savings Heartland Financial USA, Inc. Commercial Banking Retail Banking Private Client Services Deeply rooted
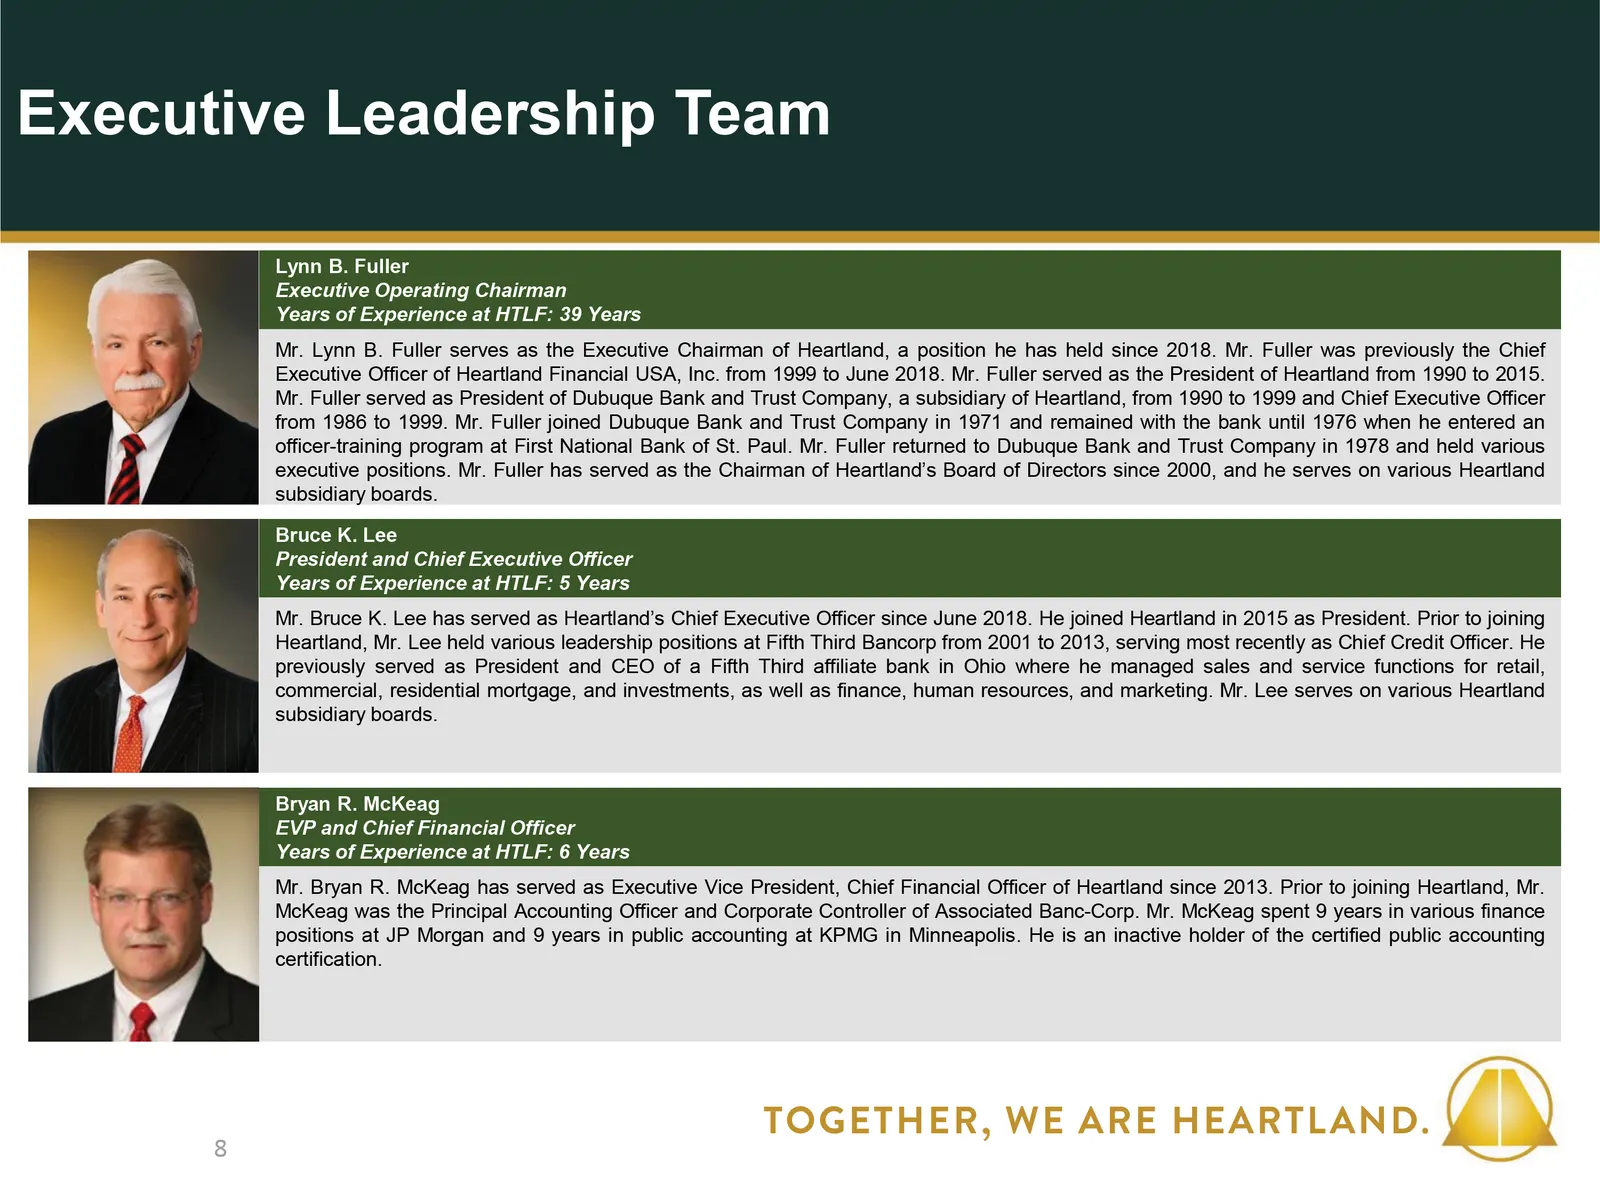
Slide 8: Lynn B. Fuller, Executive Operating Chairman
Mr. Lynn B. Fuller serves as the Executive Chairman of Heartland, a position he has held since 2018. Mr. Fuller was previously the Chief Executive Officer of Heartland Financial USA, Inc. from 1999 to June 2018. Mr. Fuller served as the President of Heartland from 1990 to 2015. Mr. Fuller served as
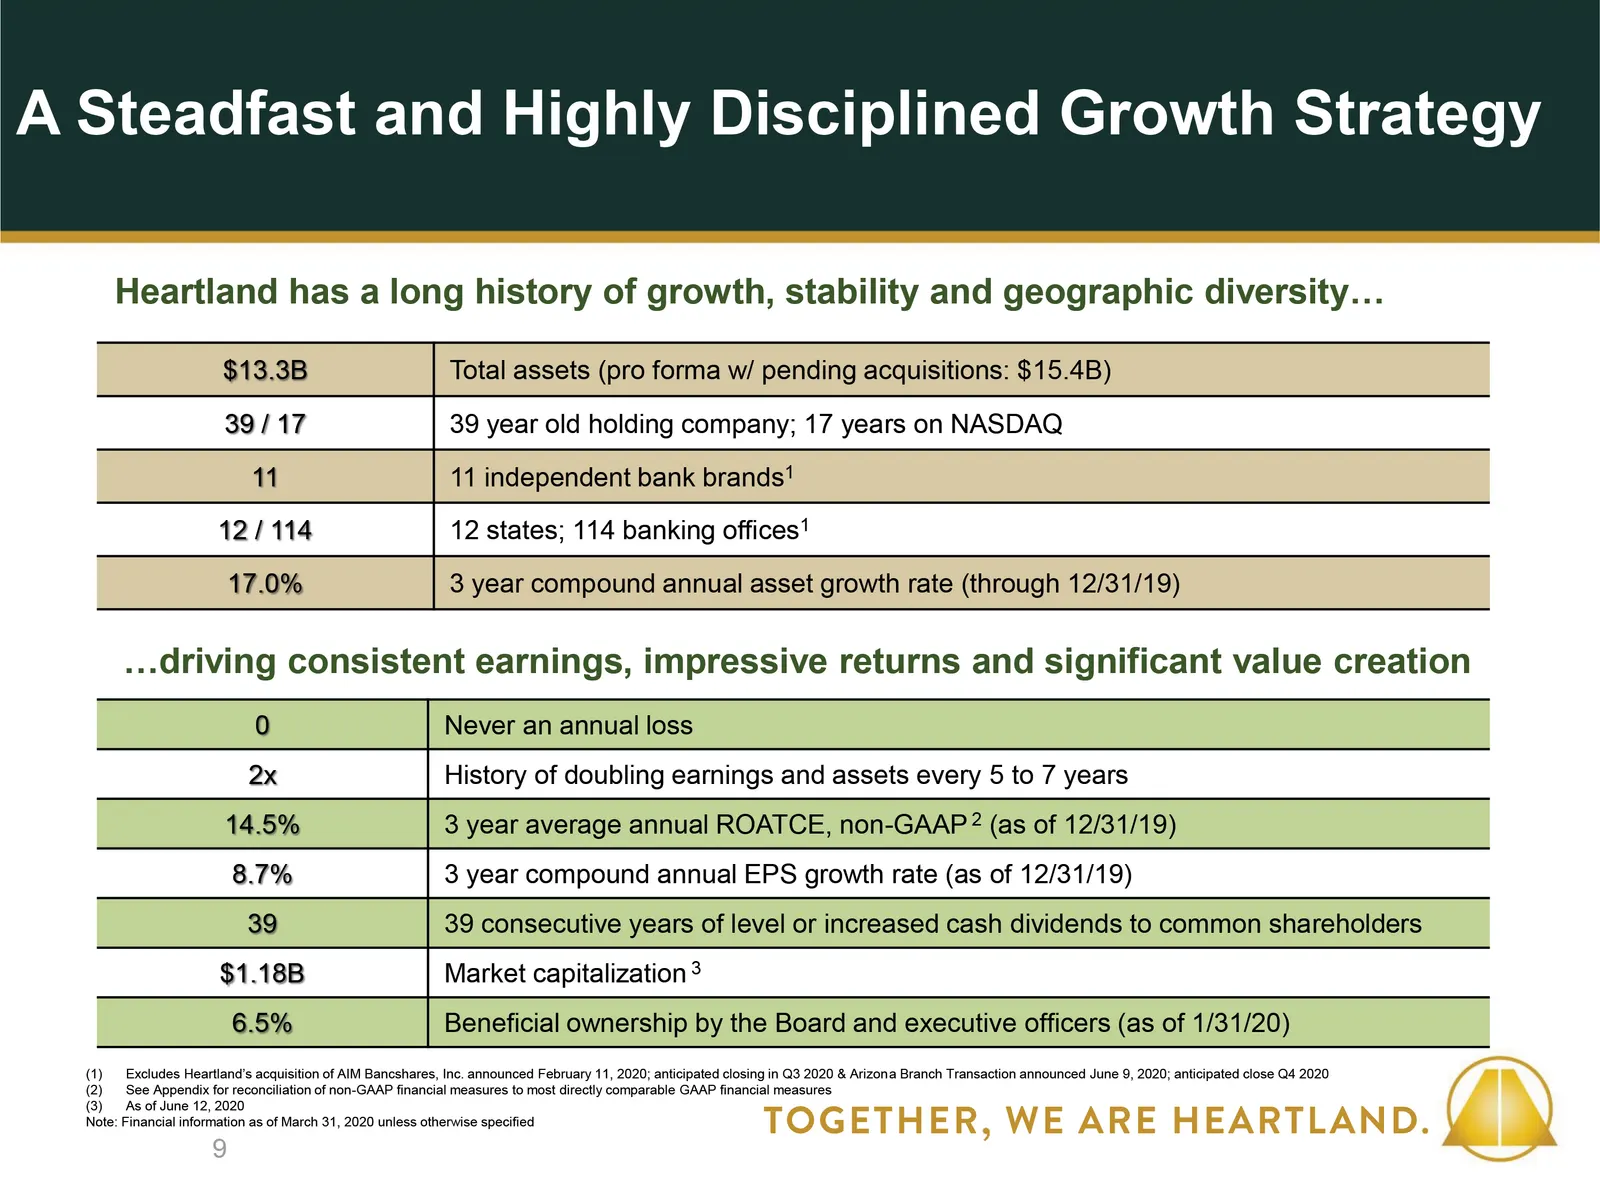
Slide 9: Key Franchise Statistics
$13.3B Total assets (pro forma w/ pending acquisitions: $15.4B) 39 / 17 39 year old holding company; 17 years on NASDAQ 11 11 independent bank brands1 12 / 114 12 states; 114 banking offices1 17.0% 3 year compound annual asset growth rate (through 12/31/19) 9 Excludes Heartland’s acquisition of AIM
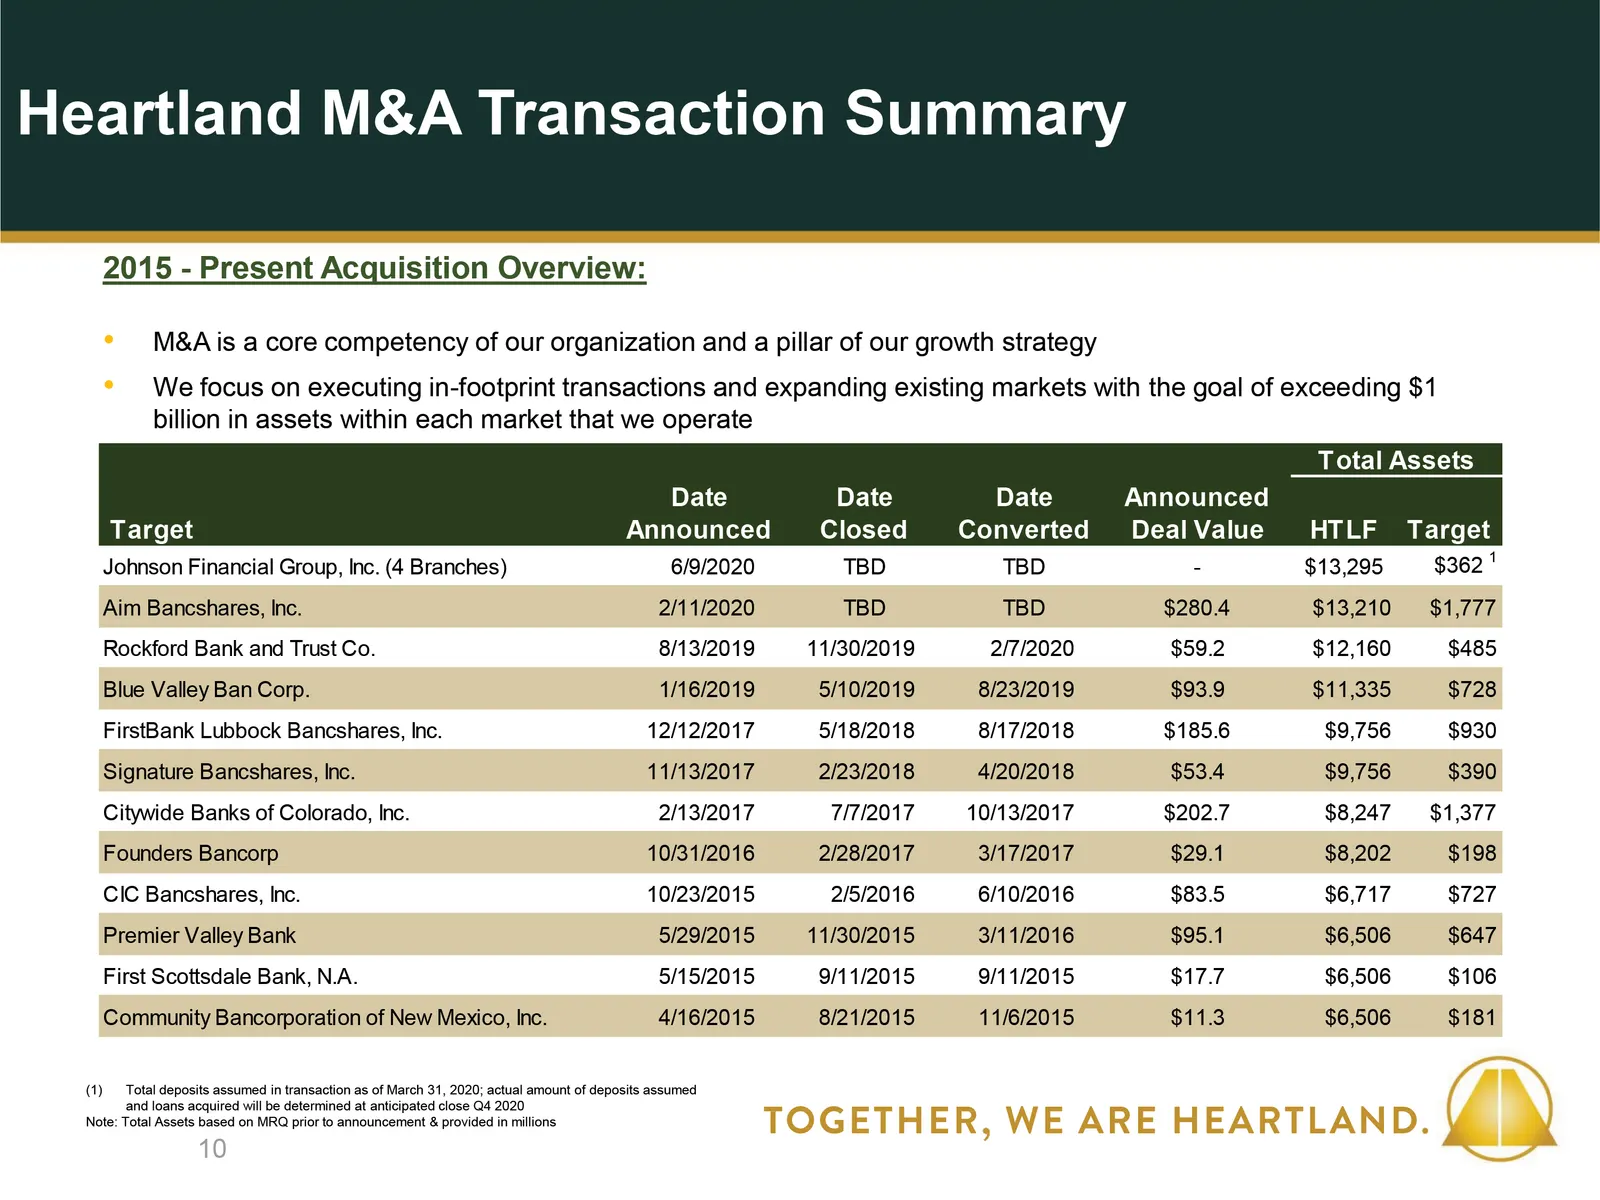
Slide 10: Heartland M&A Transaction Summary
10 Total deposits assumed in transaction as of March 31, 2020; actual amount of deposits assumed and loans acquired will be determined at anticipated close Q4 2020Note: Total Assets based on MRQ prior to announcement & provided in millions 2015 - Present Acquisition Overview: M&A is a core competenc
Slide 11: M&A as a Core Competency
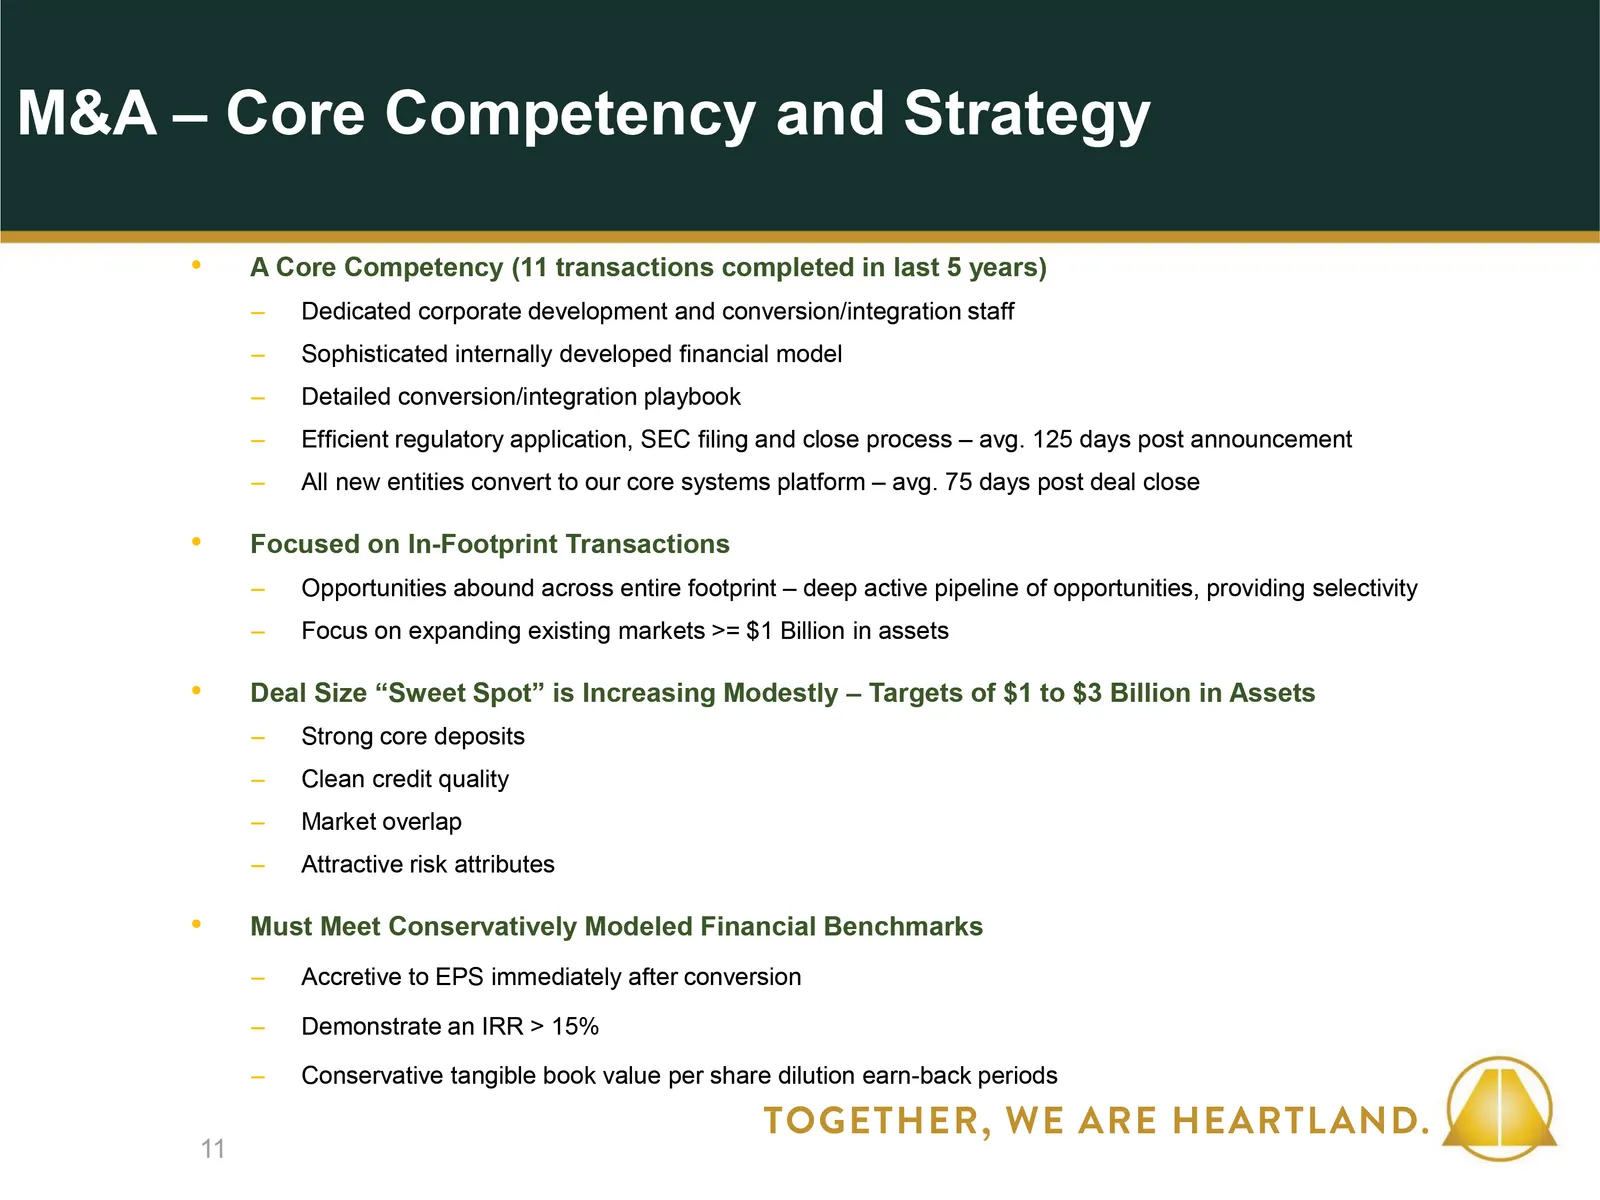
A Core Competency (11 transactions completed in last 5 years)Dedicated corporate development and conversion/integration staffSophisticated internally developed financial modelDetailed conversion/integration playbookEfficient regulatory application, SEC filing and close process – avg. 125 days post a
Slide 12: Broad Geographic Footprint
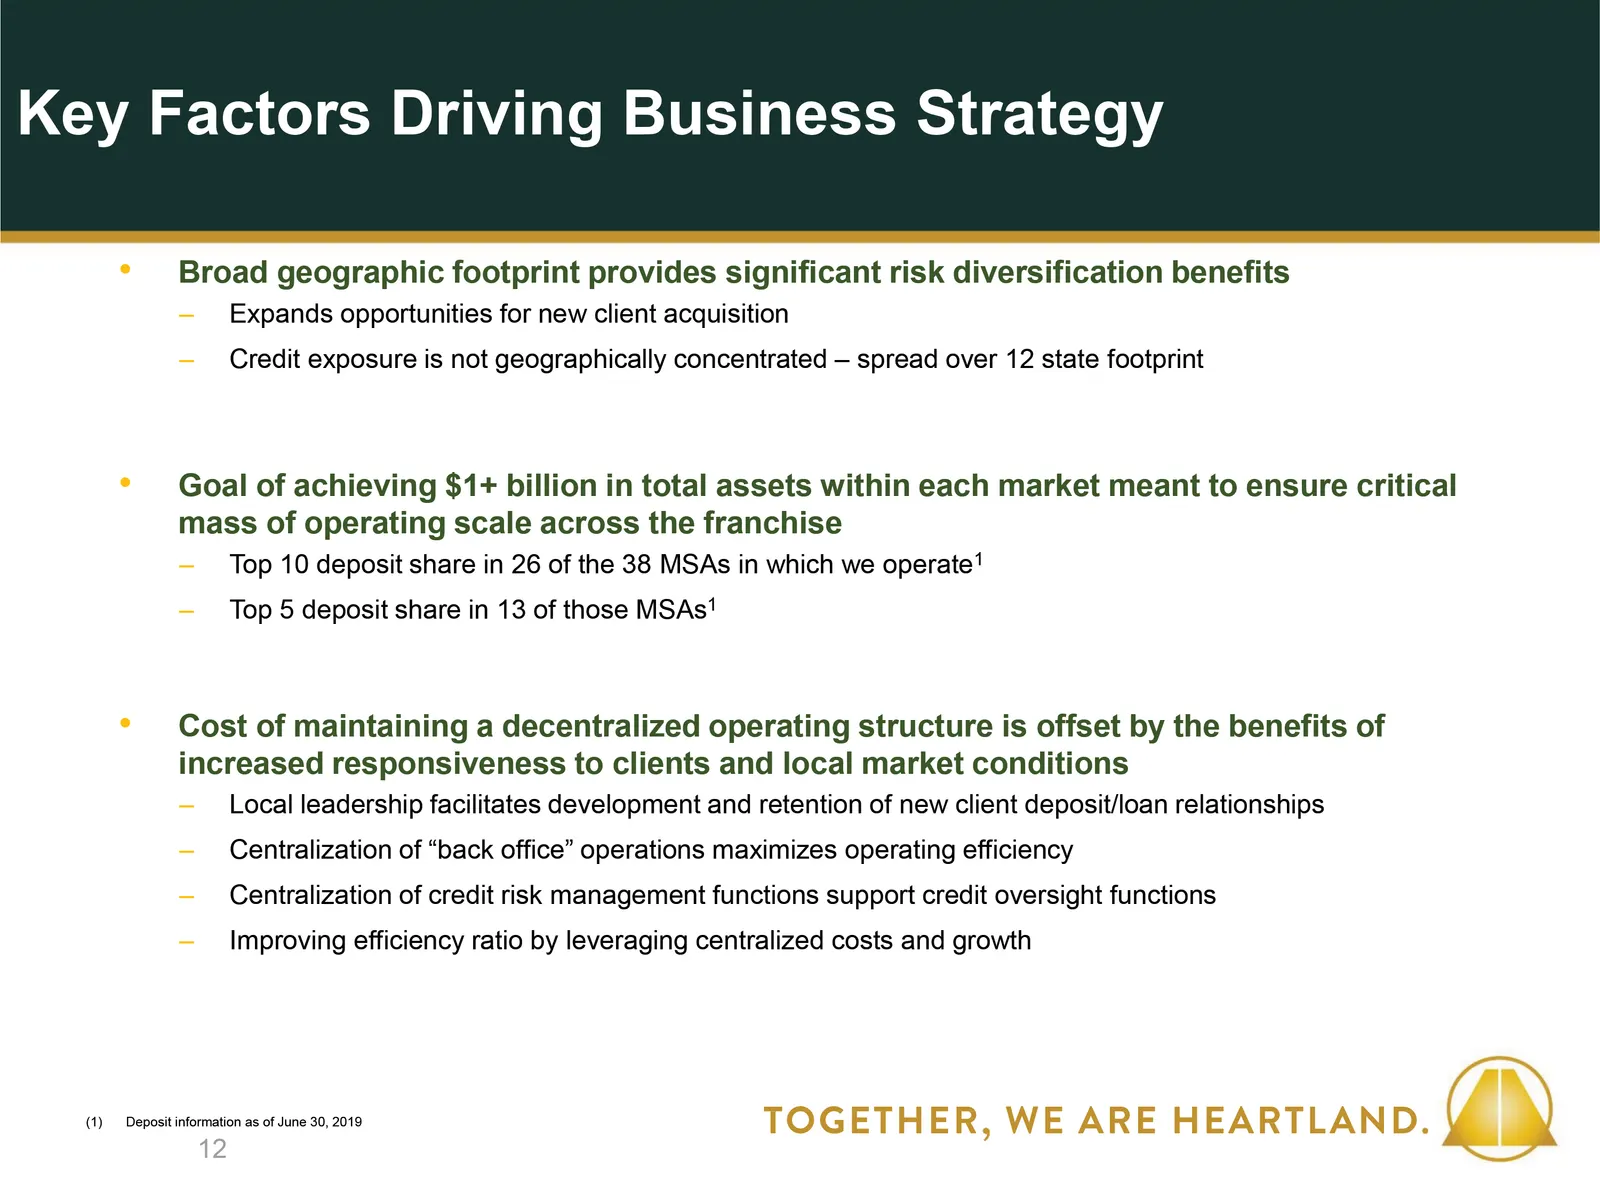
12 Deposit information as of June 30, 2019 Broad geographic footprint provides significant risk diversification benefitsExpands opportunities for new client acquisitionCredit exposure is not geographically concentrated – spread over 12 state footprintGoal of achieving $1+ billion in total assets wit
Slide 13: COVID-19 Response: Customers, Community, Employees
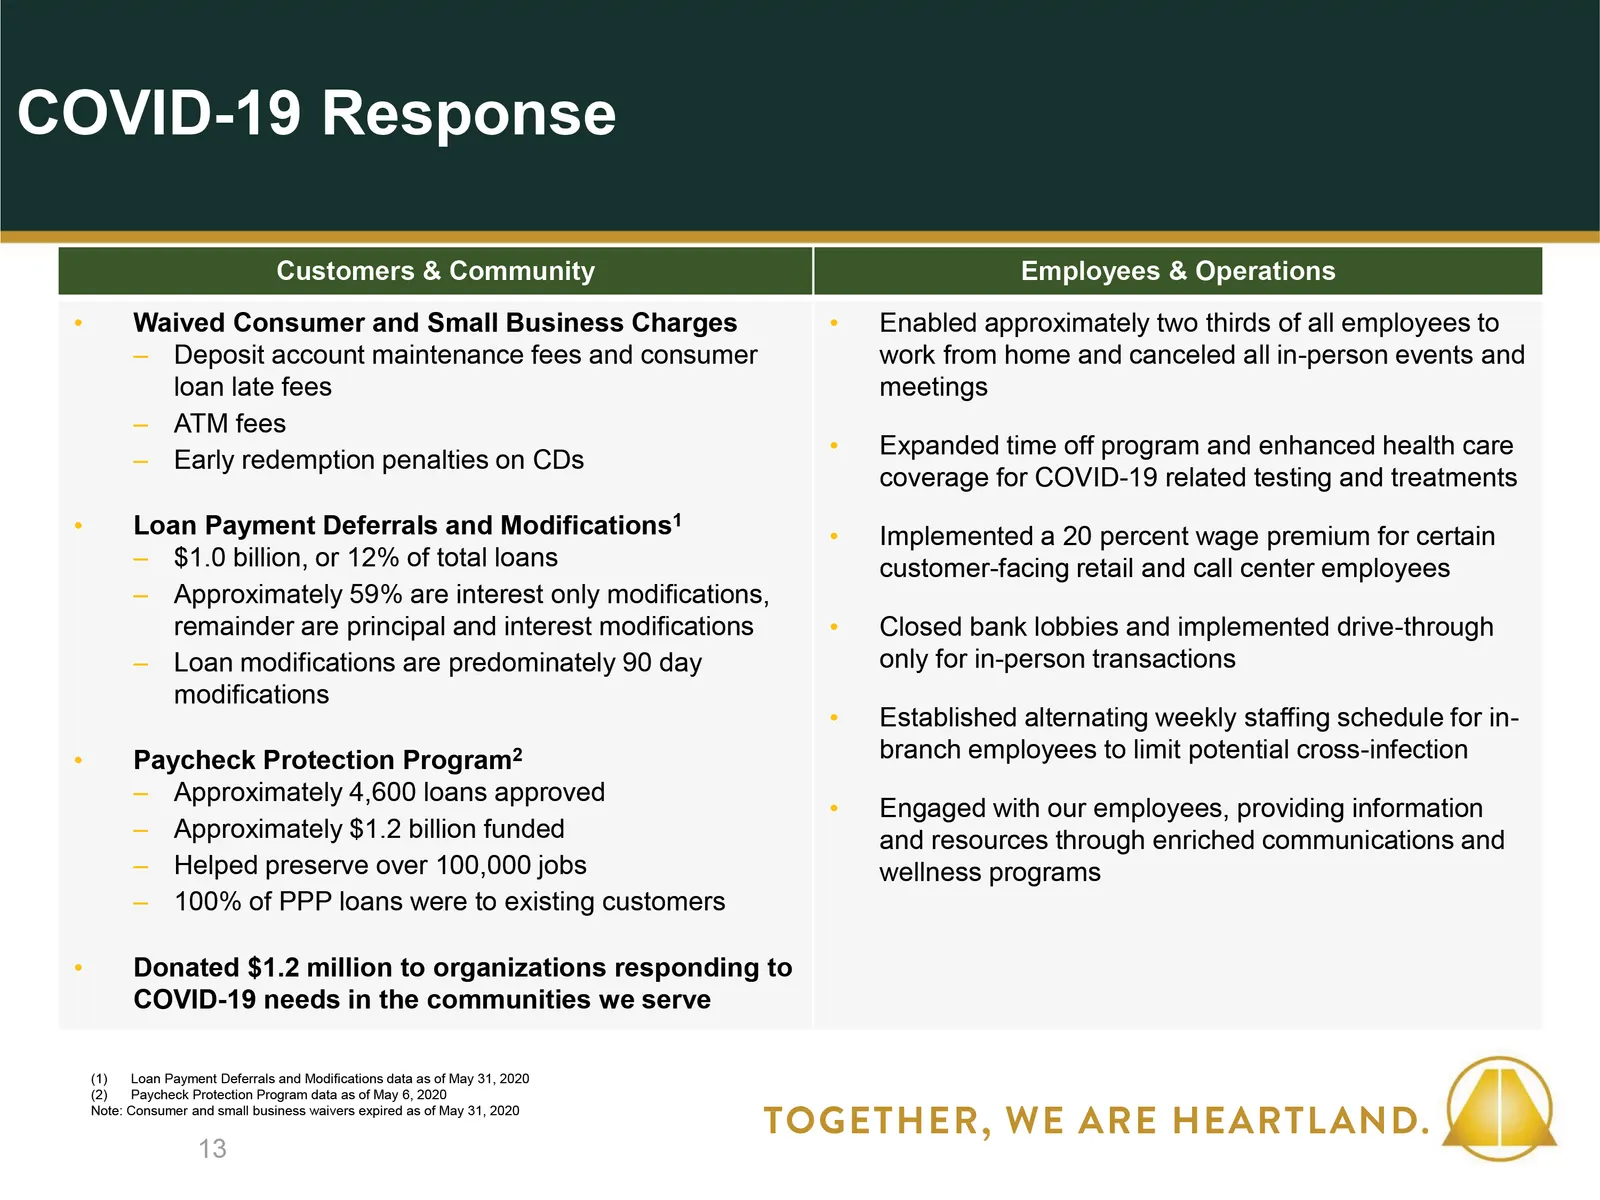
13 Customers & Community Employees & Operations Waived Consumer and Small Business ChargesDeposit account maintenance fees and consumer loan late feesATM feesEarly redemption penalties on CDsLoan Payment Deferrals and Modifications1$1.0 billion, or 12% of total loansApproximately 59% are interest on
Slide 14: Customer Segment Profiles Affected by COVID-19
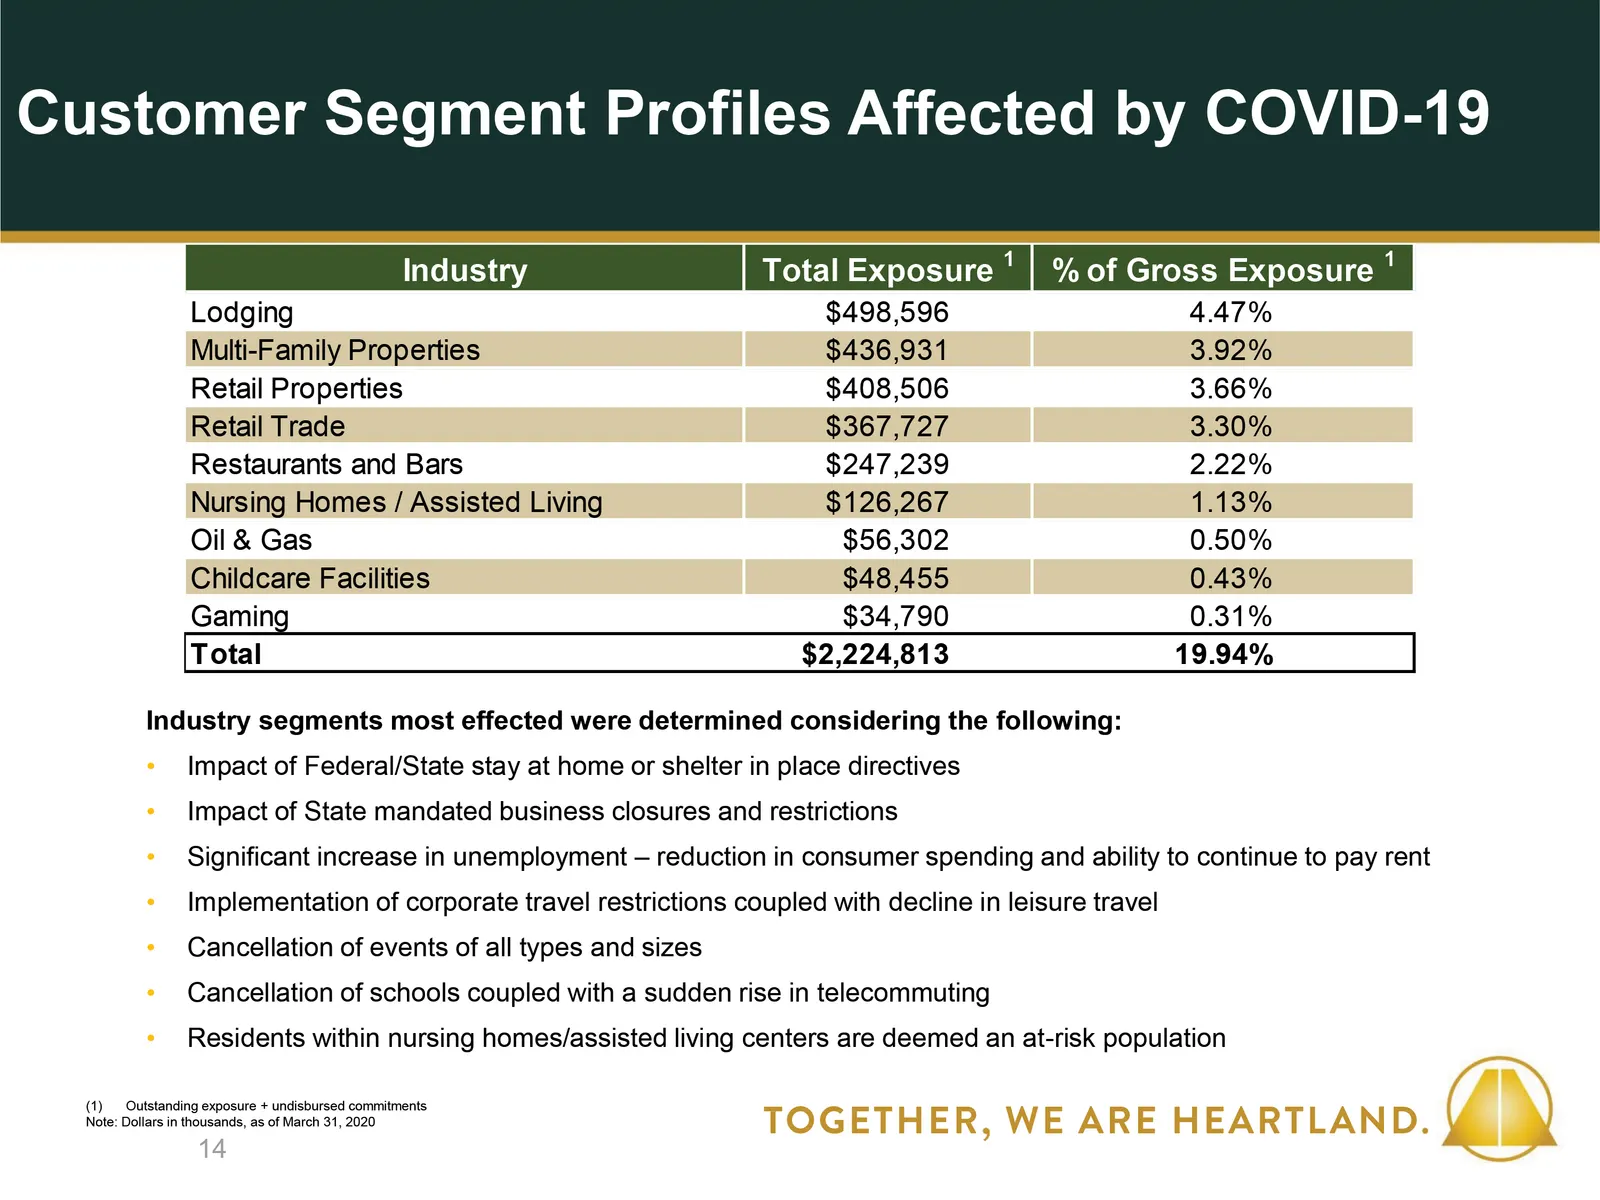
Industry segments most effected were determined considering the following:Impact of Federal/State stay at home or shelter in place directives Impact of State mandated business closures and restrictionsSignificant increase in unemployment – reduction in consumer spending and ability to continue to pa
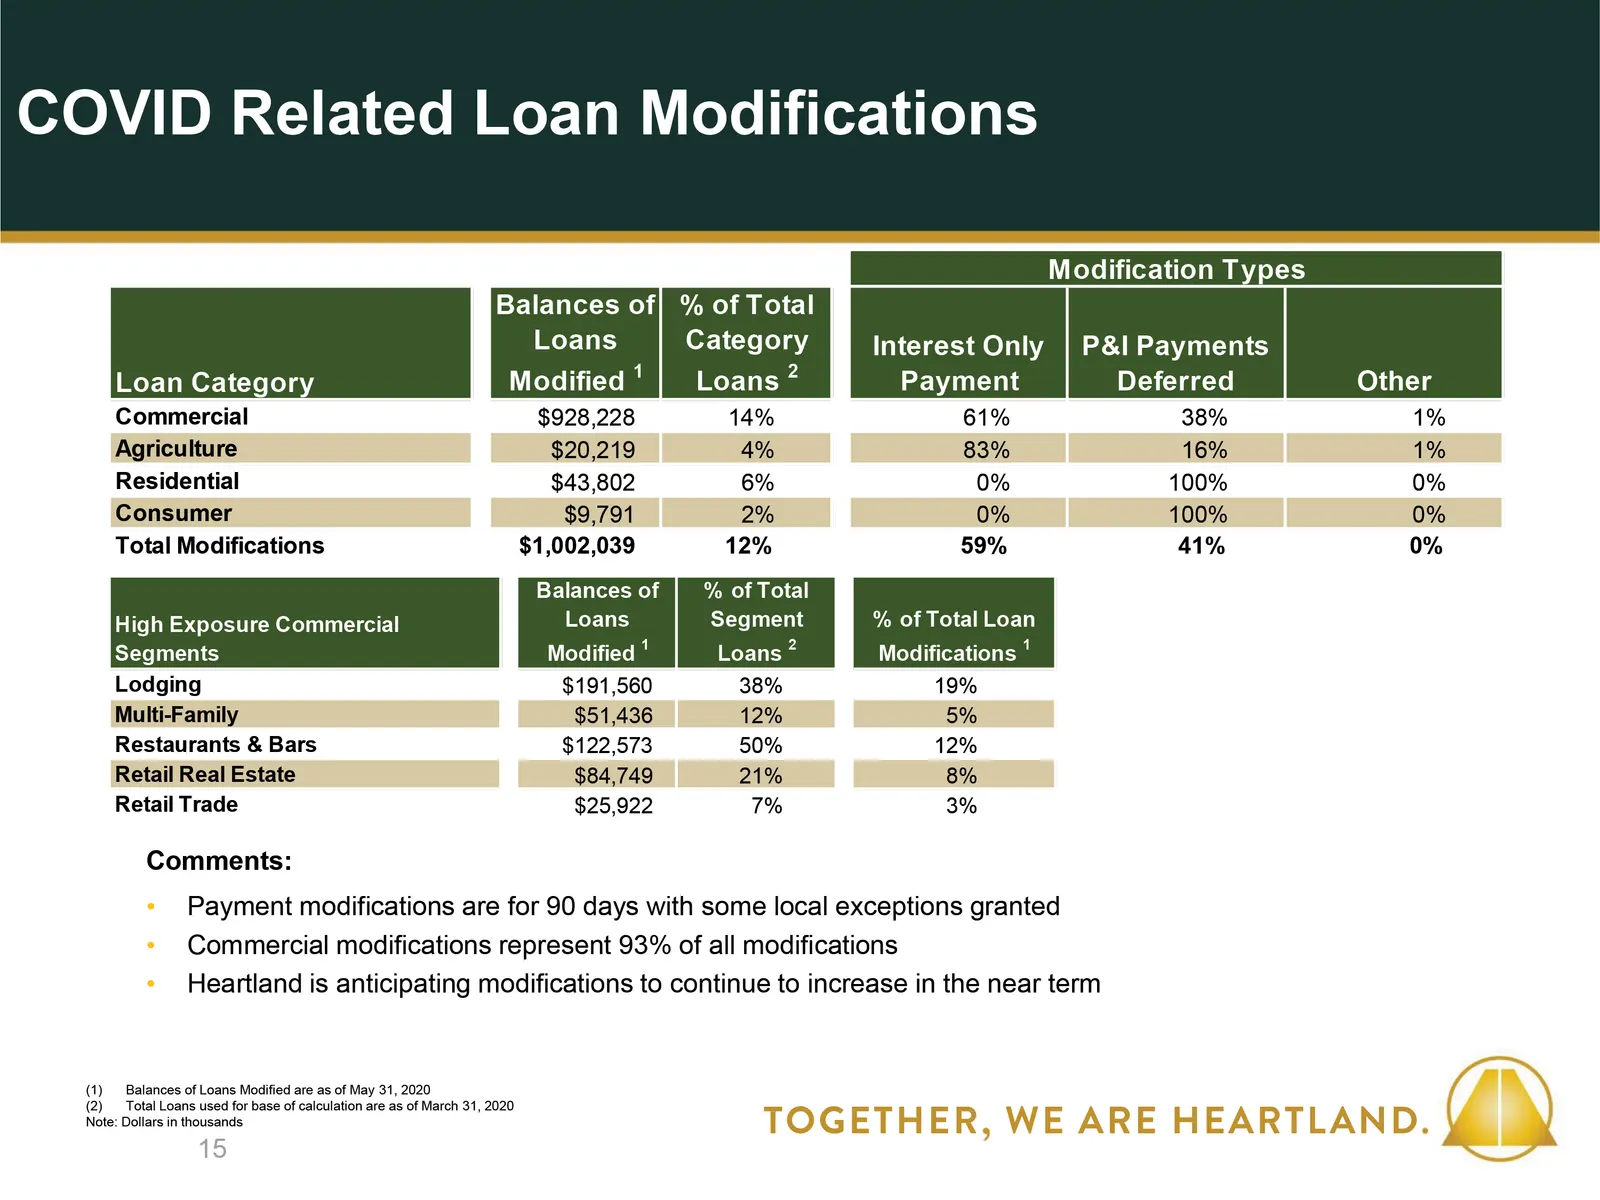
Slide 15: COVID Related Loan Modifications
Comments:Payment modifications are for 90 days with some local exceptions grantedCommercial modifications represent 93% of all modificationsHeartland is anticipating modifications to continue to increase in the near term 15 Balances of Loans Modified are as of May 31, 2020Total Loans used for base o
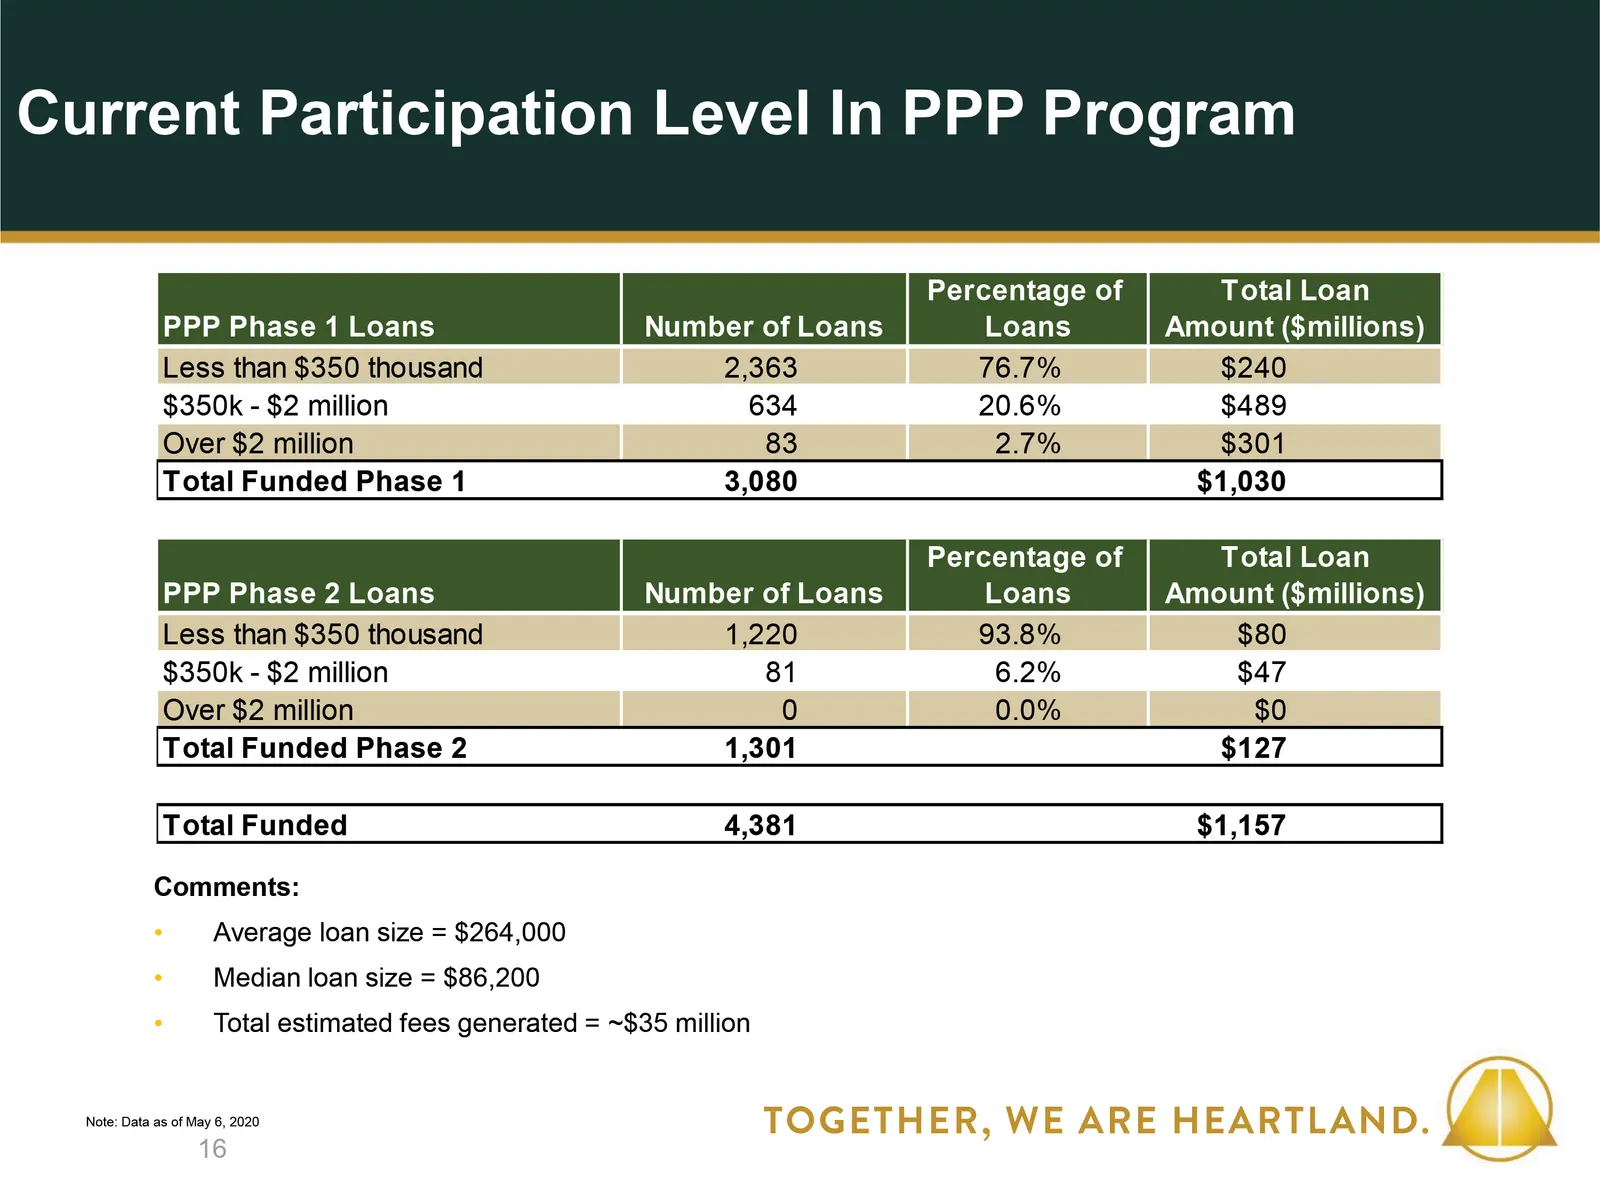
Slide 16: Current Participation Level in PPP Program
16 Comments:Average loan size = $264,000Median loan size = $86,200Total estimated fees generated = ~$35 million Note: Data as of May 6, 2020 568735 2551920 192212152 16113769 3173125 175171171 216202164 Current Participation Level In PPP Program
Slide 17: Financial Summary
PRESENTATION CAN BE UP TO THREE LINES CAN BE UP TO THREE LINES 17 Presentation Subtitle Financial Summary
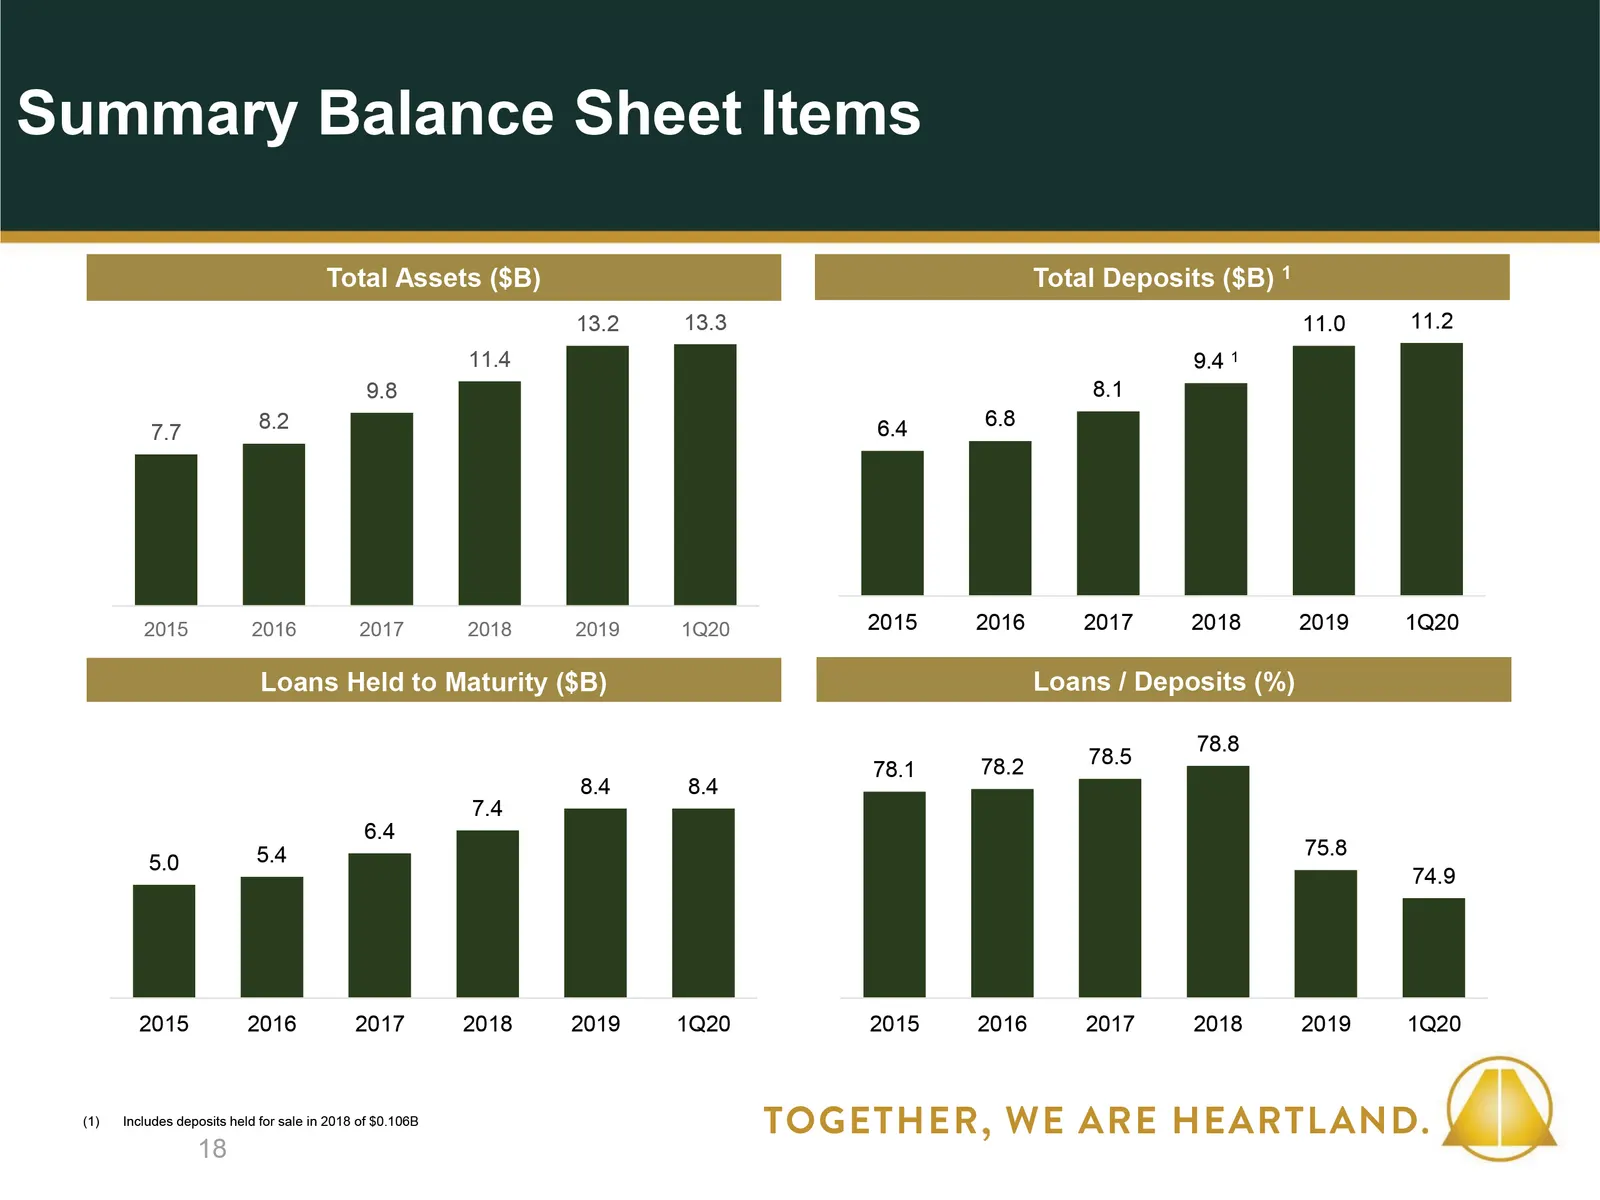
Slide 18: Summary Balance Sheet Items
18 Total Assets ($B) Total Deposits ($B) 1 Loans Held to Maturity ($B) Loans / Deposits (%) 568735 2551920 192212152 16113769 3173125 175171171 216202164 Includes deposits held for sale in 2018 of $0.106B Summary Balance Sheet Items
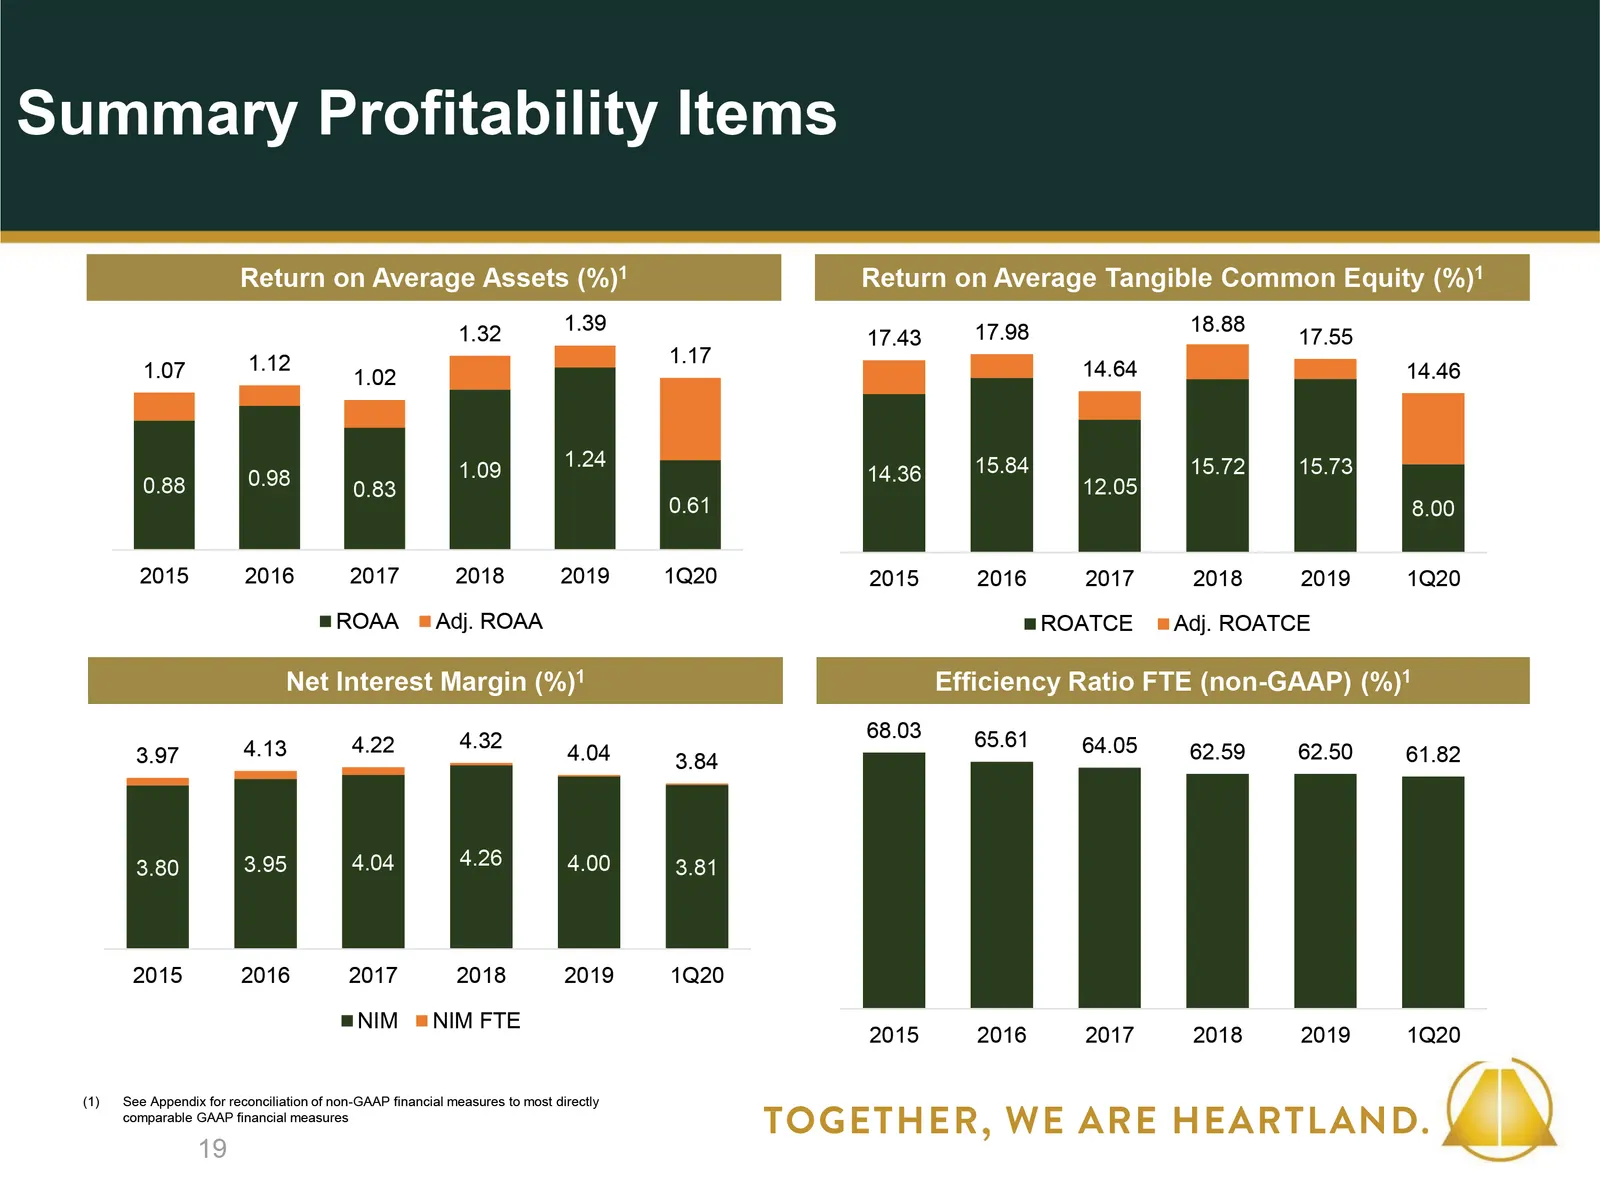
Slide 19: Summary Profitability Items
19 Return on Average Assets (%)1 Return on Average Tangible Common Equity (%)1 Net Interest Margin (%)1 Efficiency Ratio FTE (non-GAAP) (%)1 568735 2551920 192212152 16113769 3173125 175171171 216202164 See Appendix for reconciliation of non-GAAP financial measures to most directly comparable GAAP f
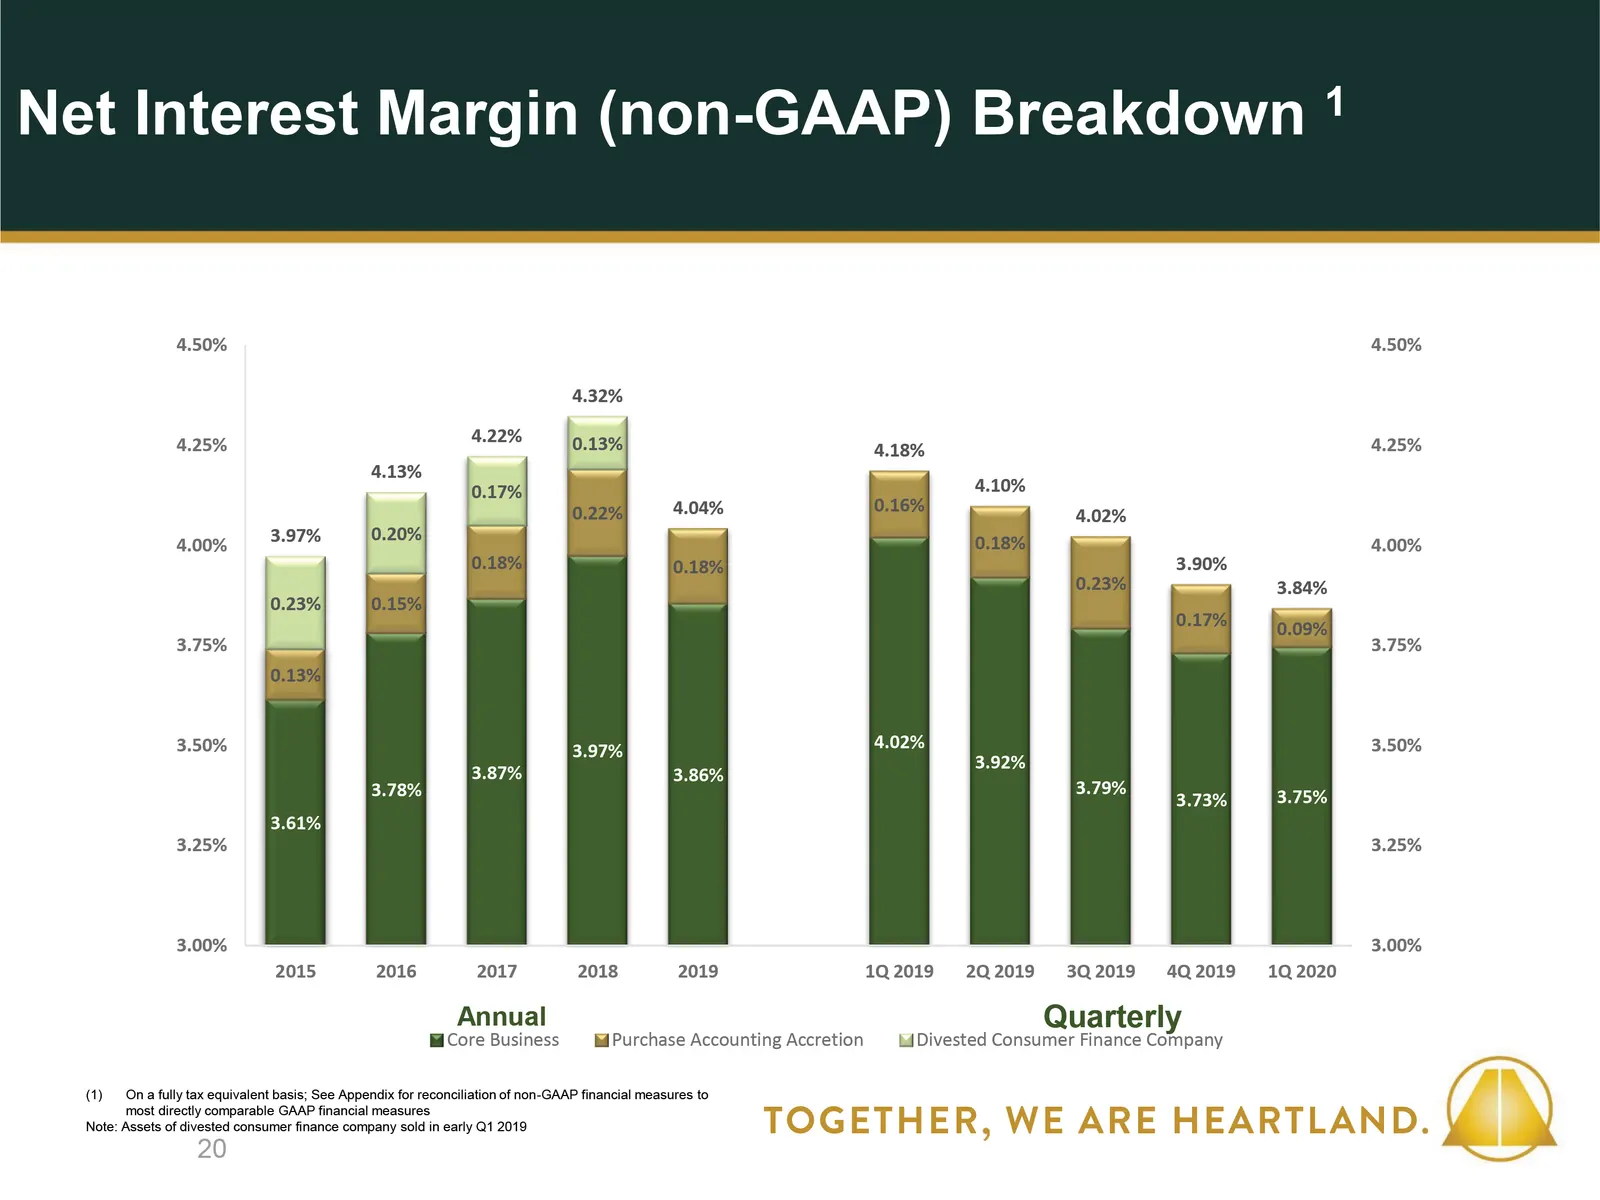
Slide 20: Net Interest Margin Breakdown
Quarterly Annual 568735 2551920 192212152 16113769 3173125 175171171 216202164 On a fully tax equivalent basis; See Appendix for reconciliation of non-GAAP financial measures to most directly comparable GAAP financial measuresNote: Assets of divested consumer finance company sold in early Q1 2019 20
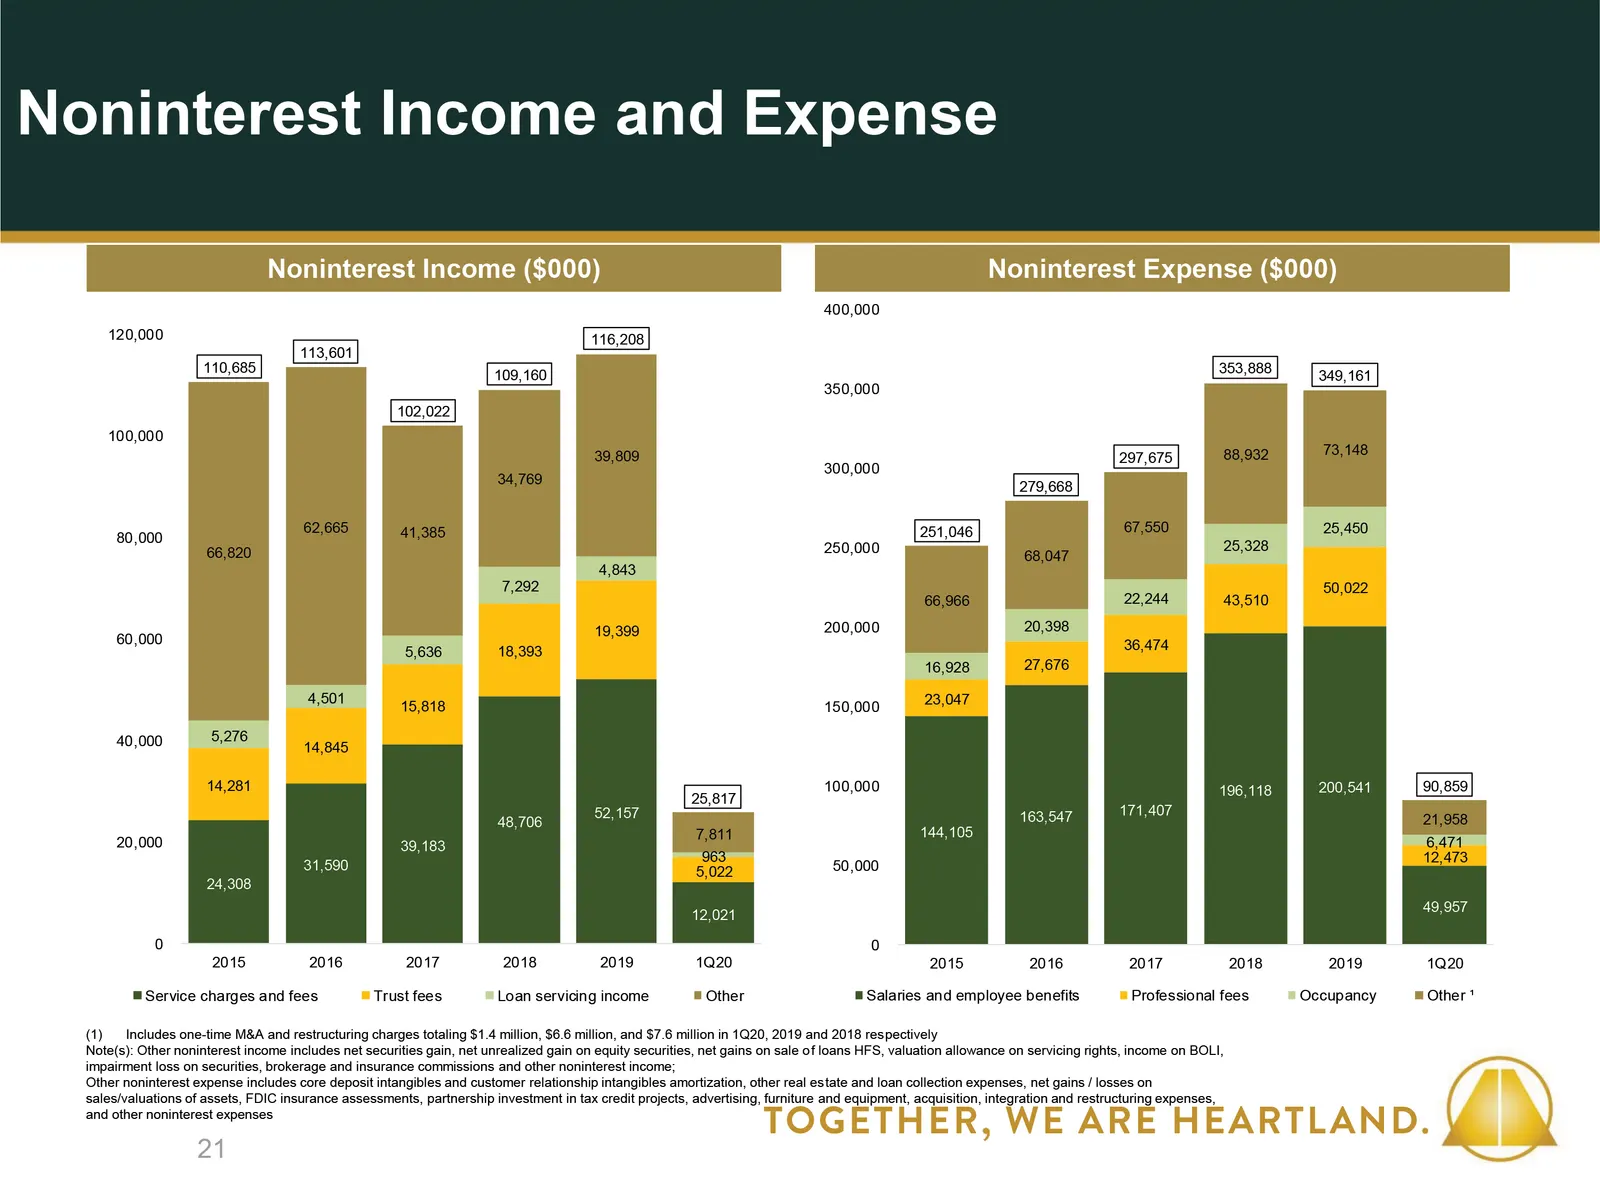
Slide 21: Noninterest Income and Noninterest Expense
21 Noninterest Income ($000) Noninterest Expense ($000) 568735 2551920 192212152 16113769 3173125 175171171 216202164 Includes one-time M&A and restructuring charges totaling $1.4 million, $6.6 million, and $7.6 million in 1Q20, 2019 and 2018 respectivelyNote(s): Other noninterest income includes ne
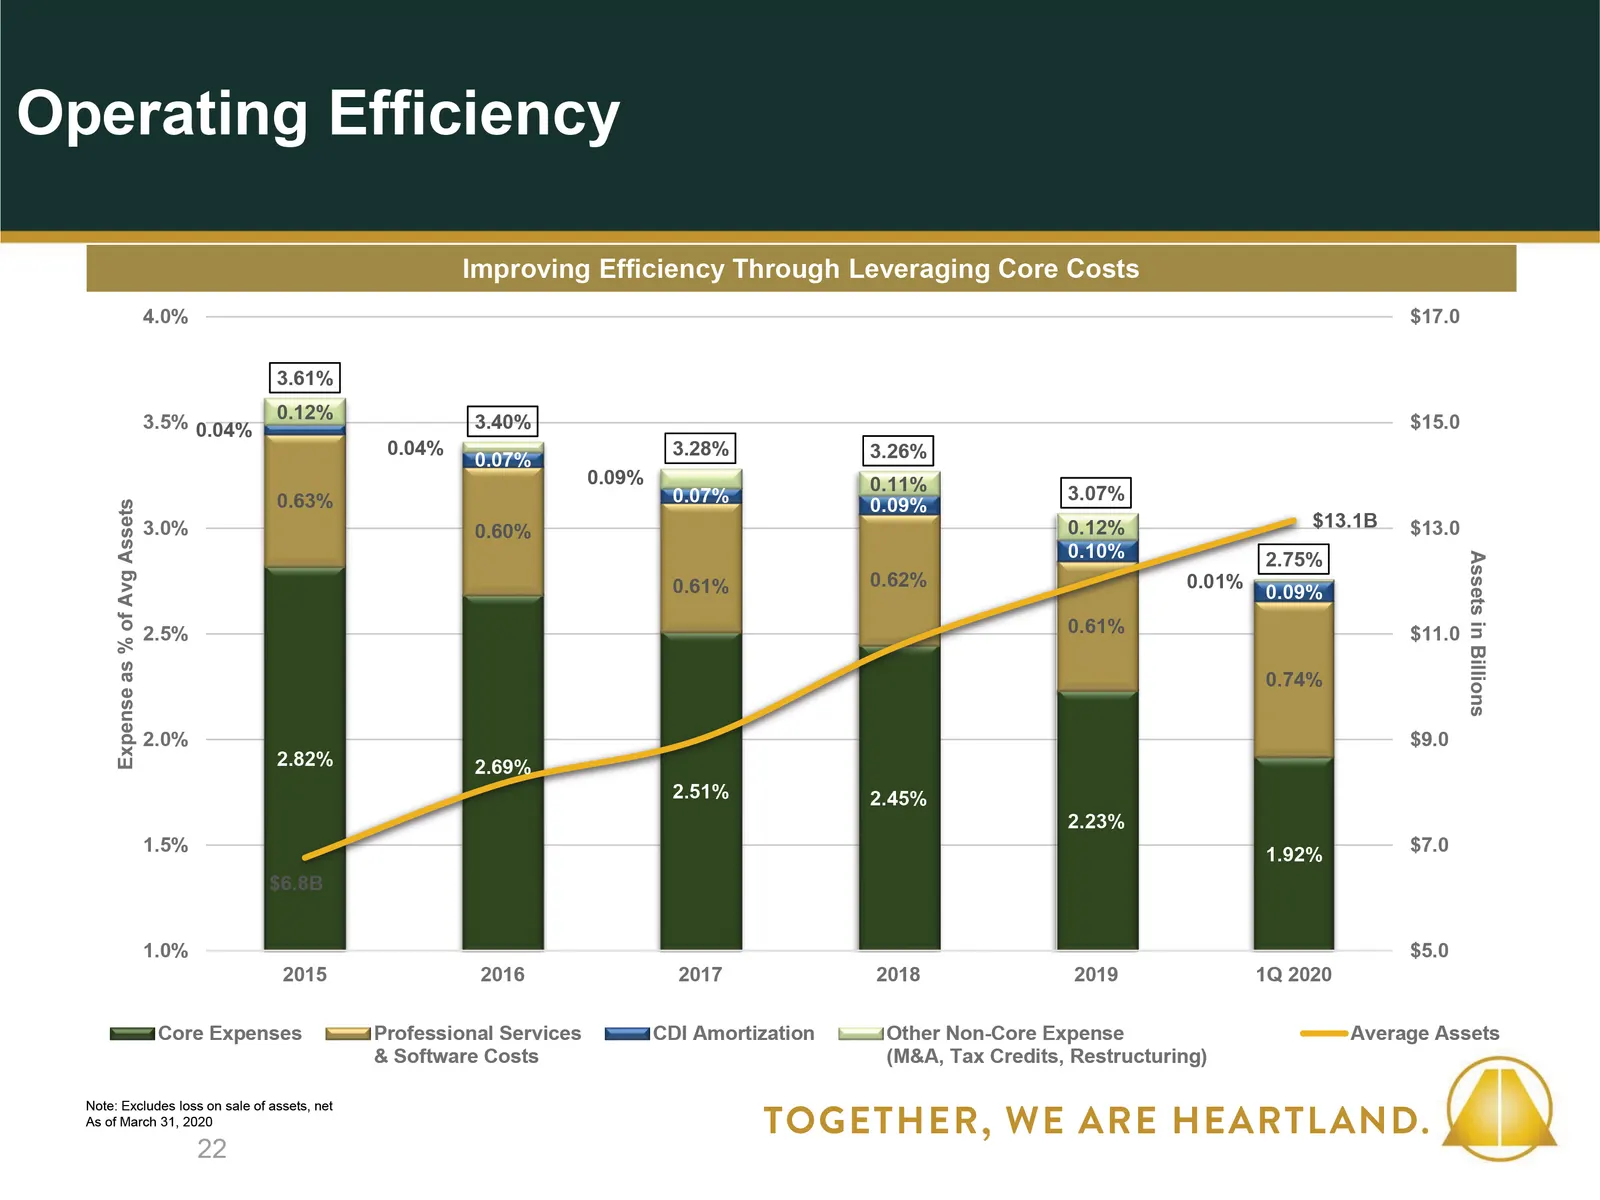
Slide 22: Operating Efficiency
568735 2551920 192212152 16113769 3173125 175171171 216202164 Note: Excludes loss on sale of assets, netAs of March 31, 2020 Improving Efficiency Through Leveraging Core Costs 22 Operating Efficiency
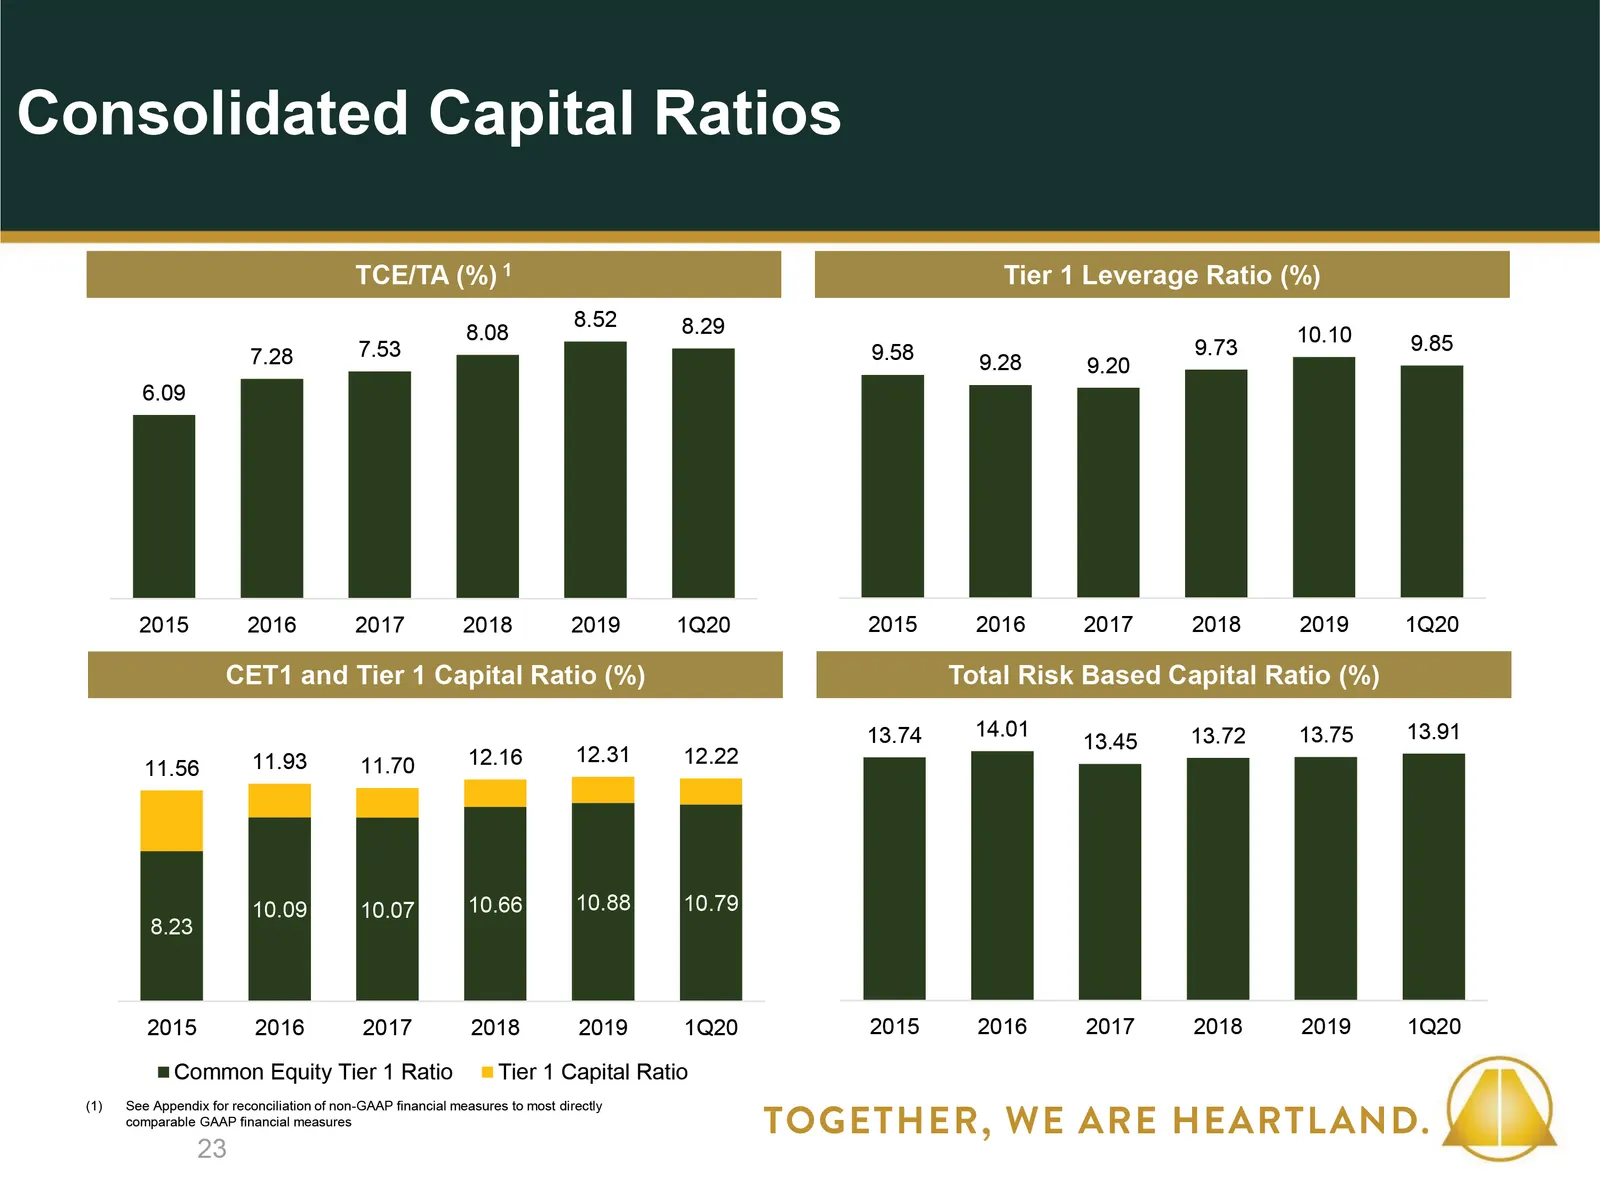
Slide 23: Consolidated Capital Ratios
23 406325 2551920 192212152 16113769 3173125 175171171 TCE/TA (%) 1 Tier 1 Leverage Ratio (%) CET1 and Tier 1 Capital Ratio (%) Total Risk Based Capital Ratio (%) See Appendix for reconciliation of non-GAAP financial measures to most directly comparable GAAP financial measures Consolidated Capital R
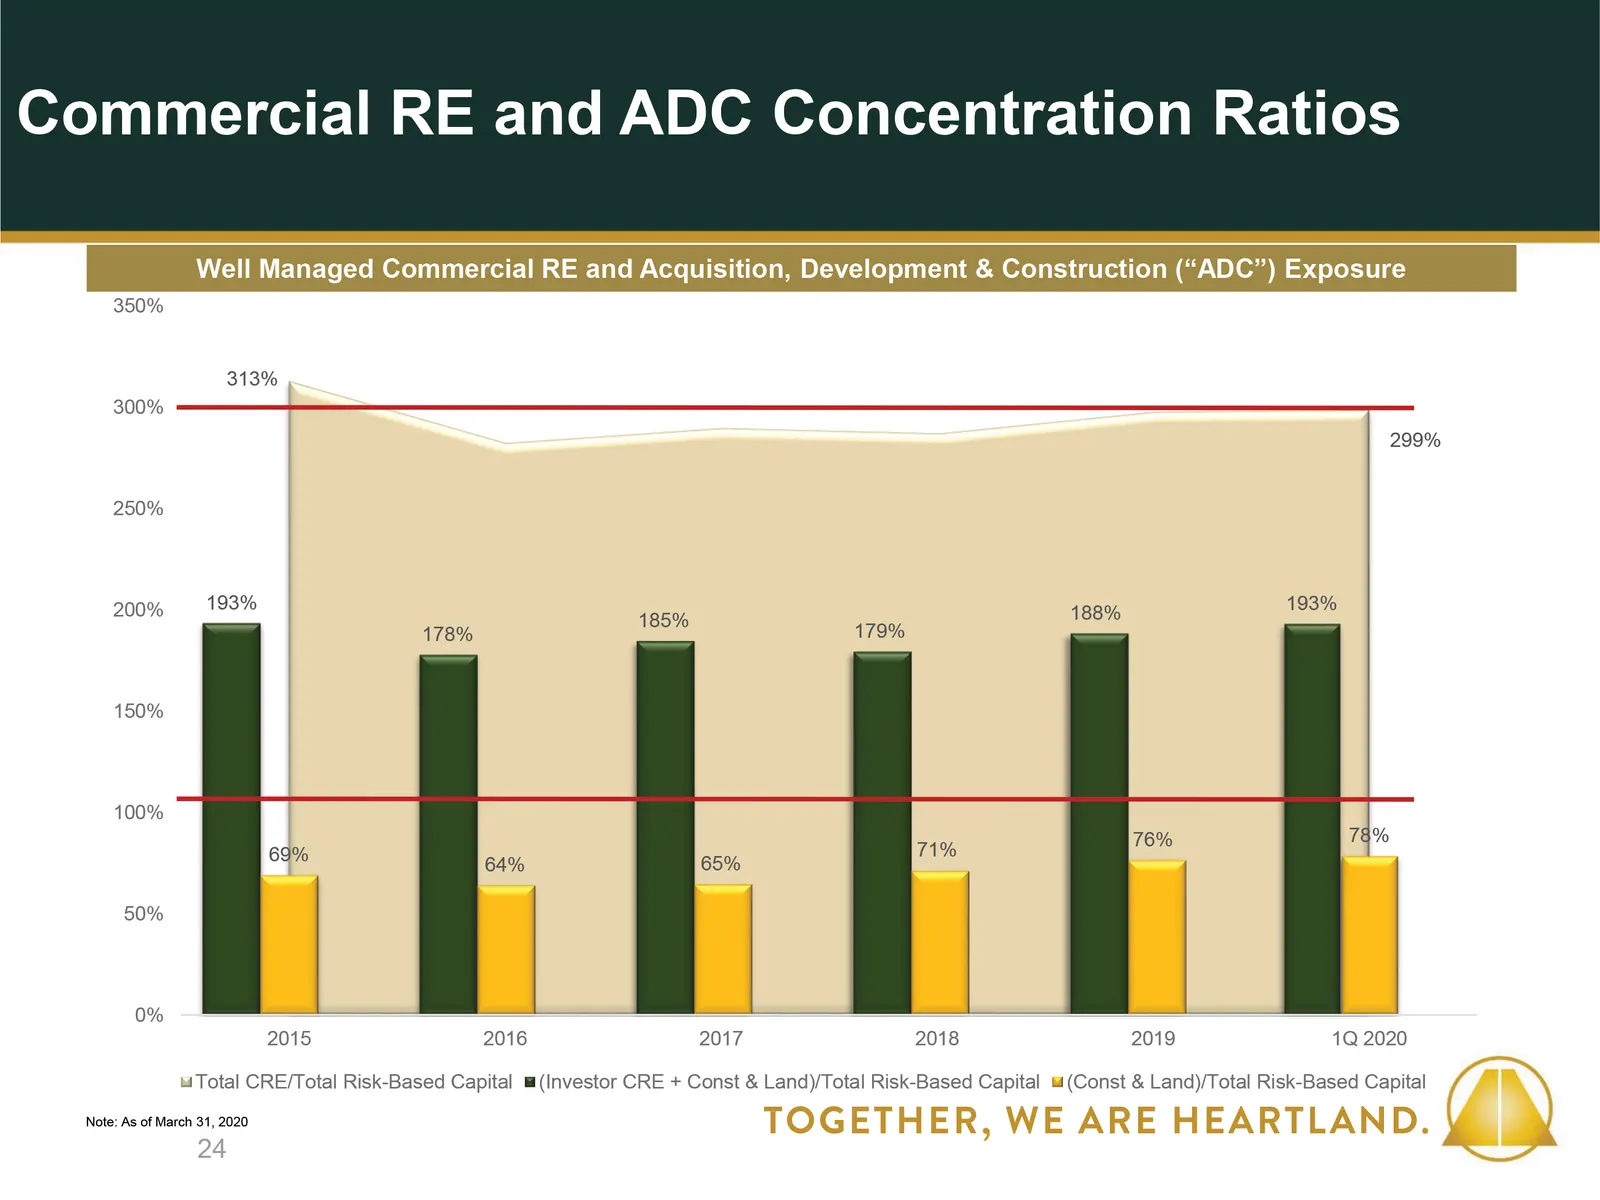
Slide 24: Commercial RE and ADC Concentration Ratios
24 Note: As of March 31, 2020 568735 2551920 192212152 16113769 3173125 175171171 216202164 Well Managed Commercial RE and Acquisition, Development & Construction (“ADC”) Exposure Commercial RE and ADC Concentration Ratios

Slide 25: Loan Portfolio and Asset Quality
PRESENTATION CAN BE UP TO THREE LINES CAN BE UP TO THREE LINES 25 Presentation Subtitle Loan Portfolio and Asset Quality
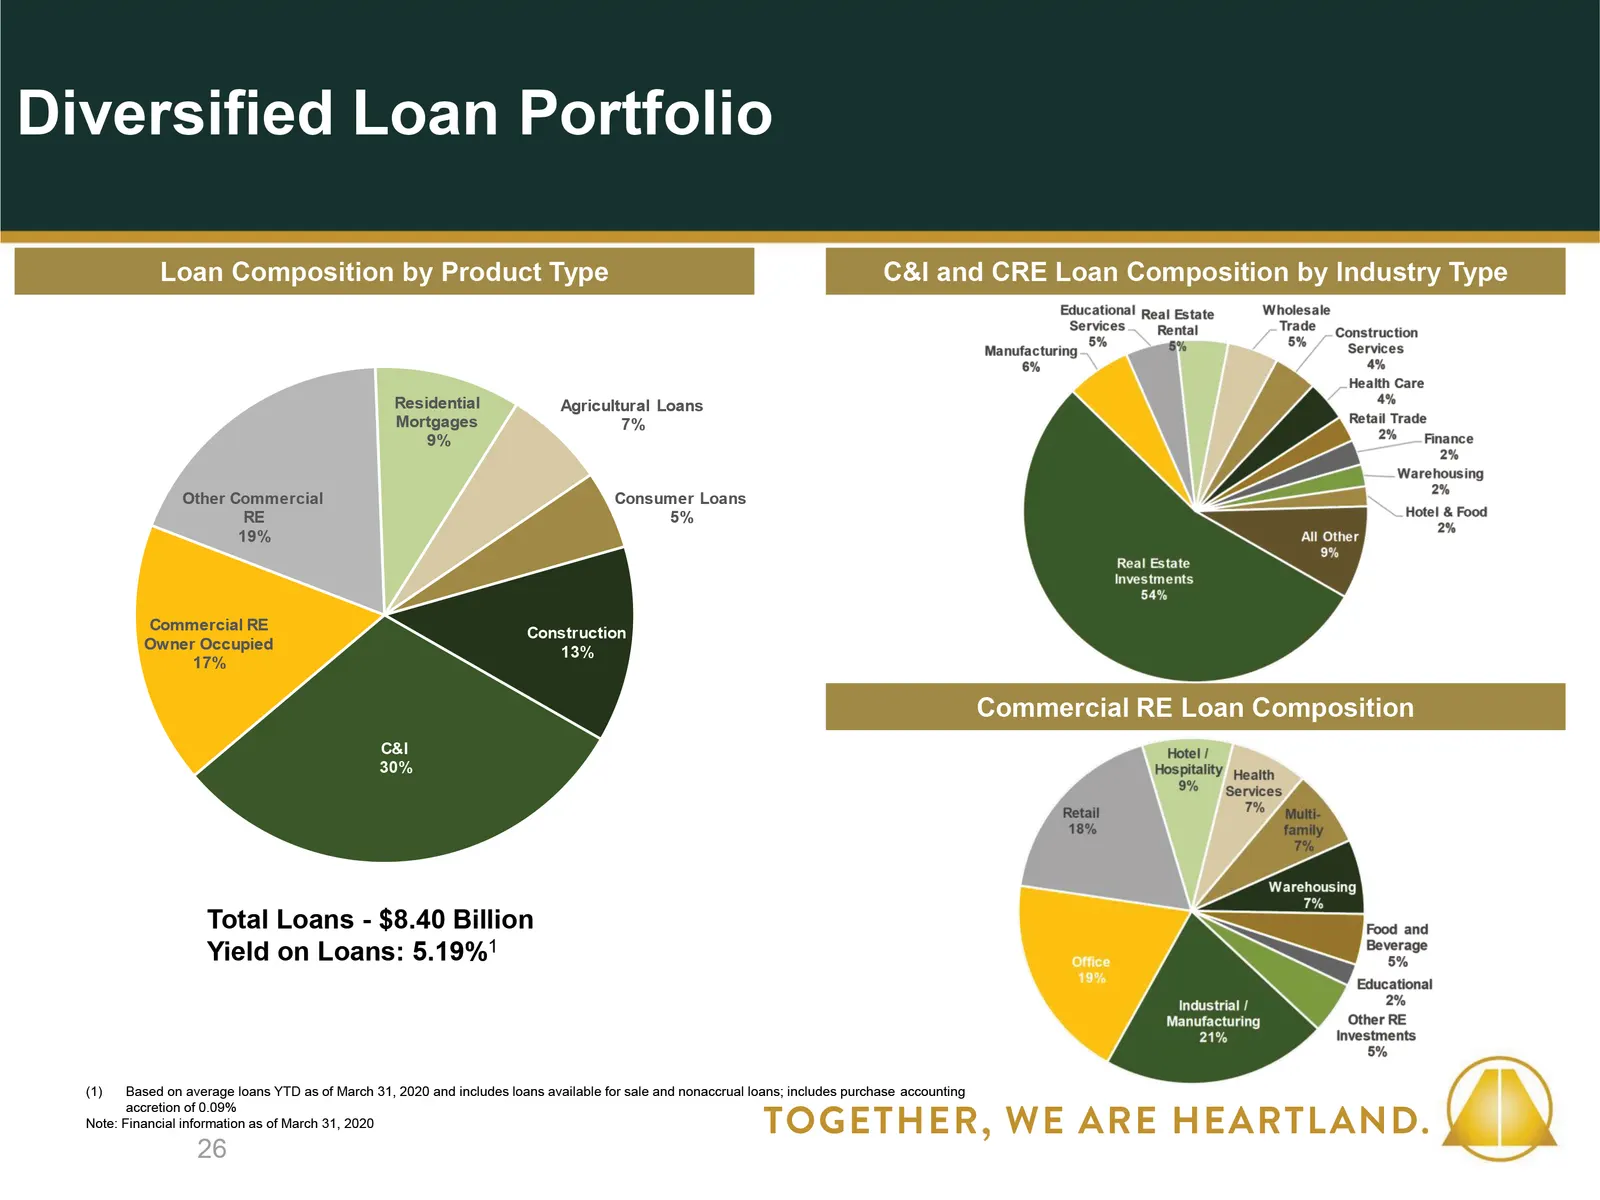
Slide 26: Diversified Loan Portfolio
26 Total Loans - $8.40 BillionYield on Loans: 5.19%1 568735 2551920 192212152 16113769 3173125 175171171 216202164 Loan Composition by Product Type C&I and CRE Loan Composition by Industry Type Based on average loans YTD as of March 31, 2020 and includes loans available for sale and nonaccrual loans
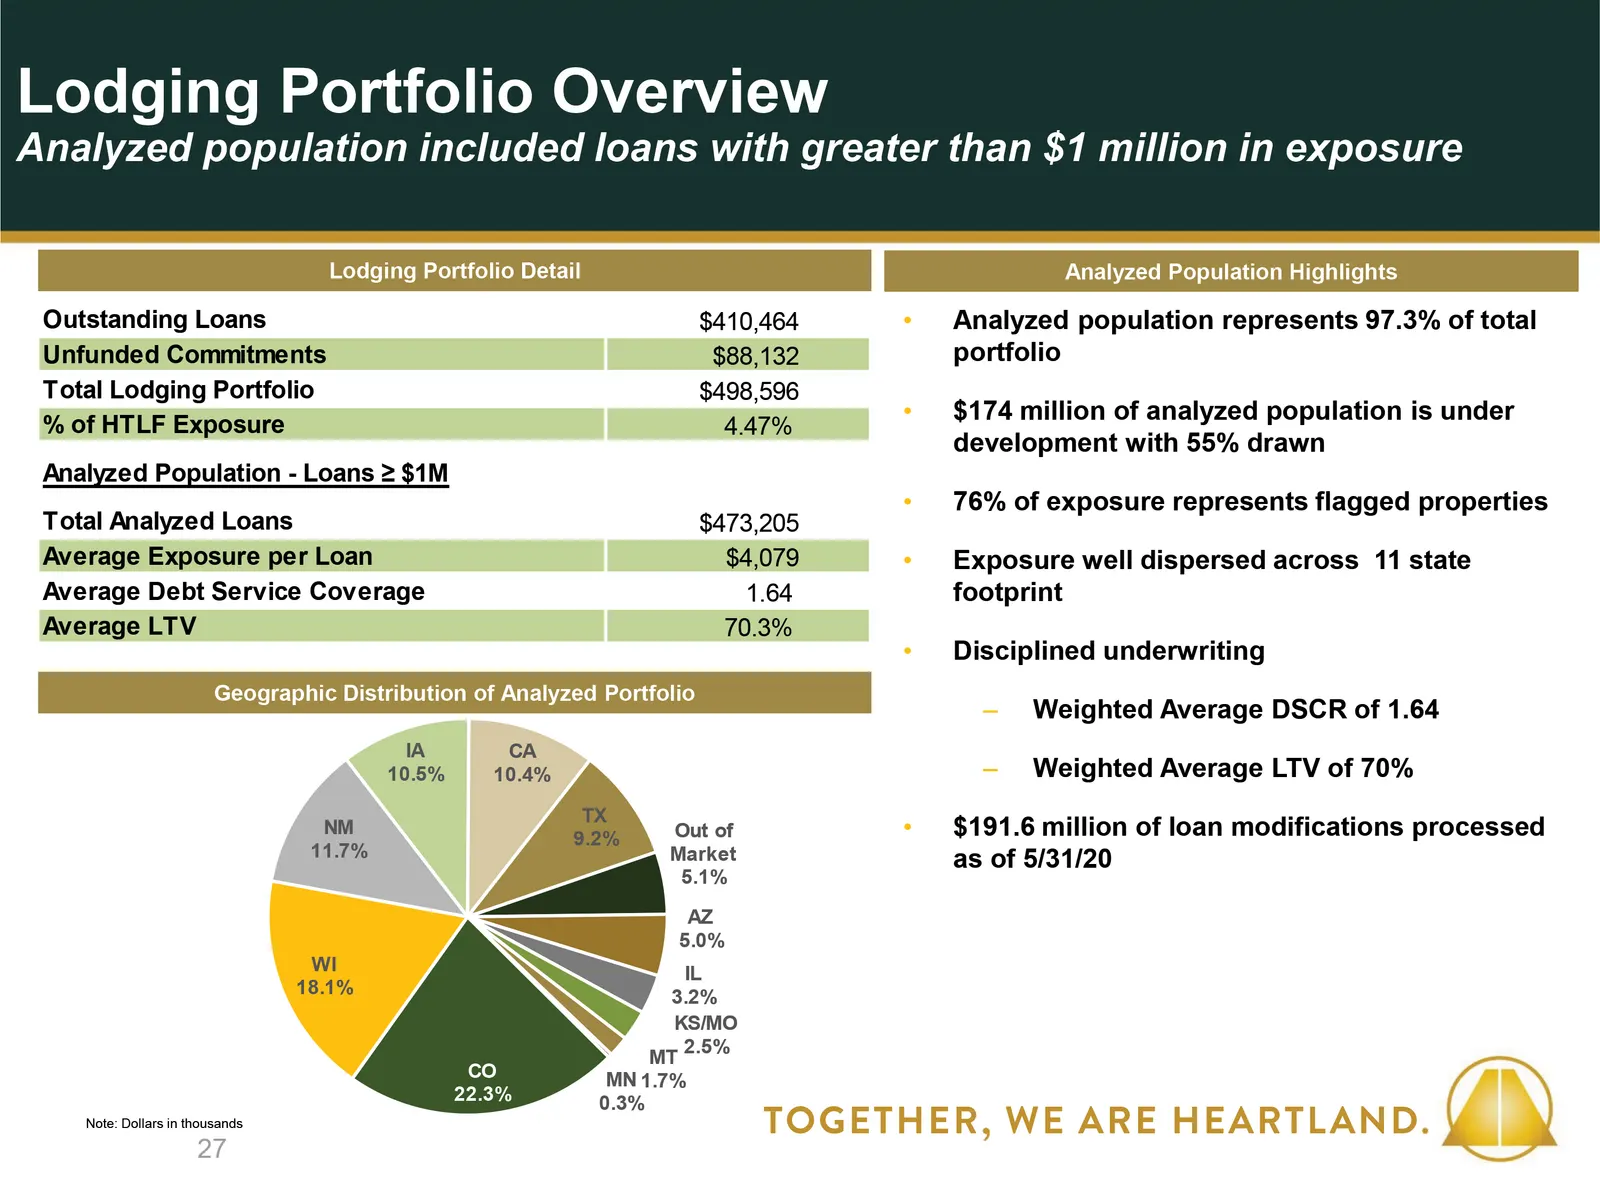
Slide 27: Lodging Portfolio Overview
Analyzed population represents 97.3% of total portfolio$174 million of analyzed population is under development with 55% drawn76% of exposure represents flagged propertiesExposure well dispersed across 11 state footprintDisciplined underwritingWeighted Average DSCR of 1.64Weighted Average LTV of 70%
Slide 28: Multi-Family Portfolio Overview
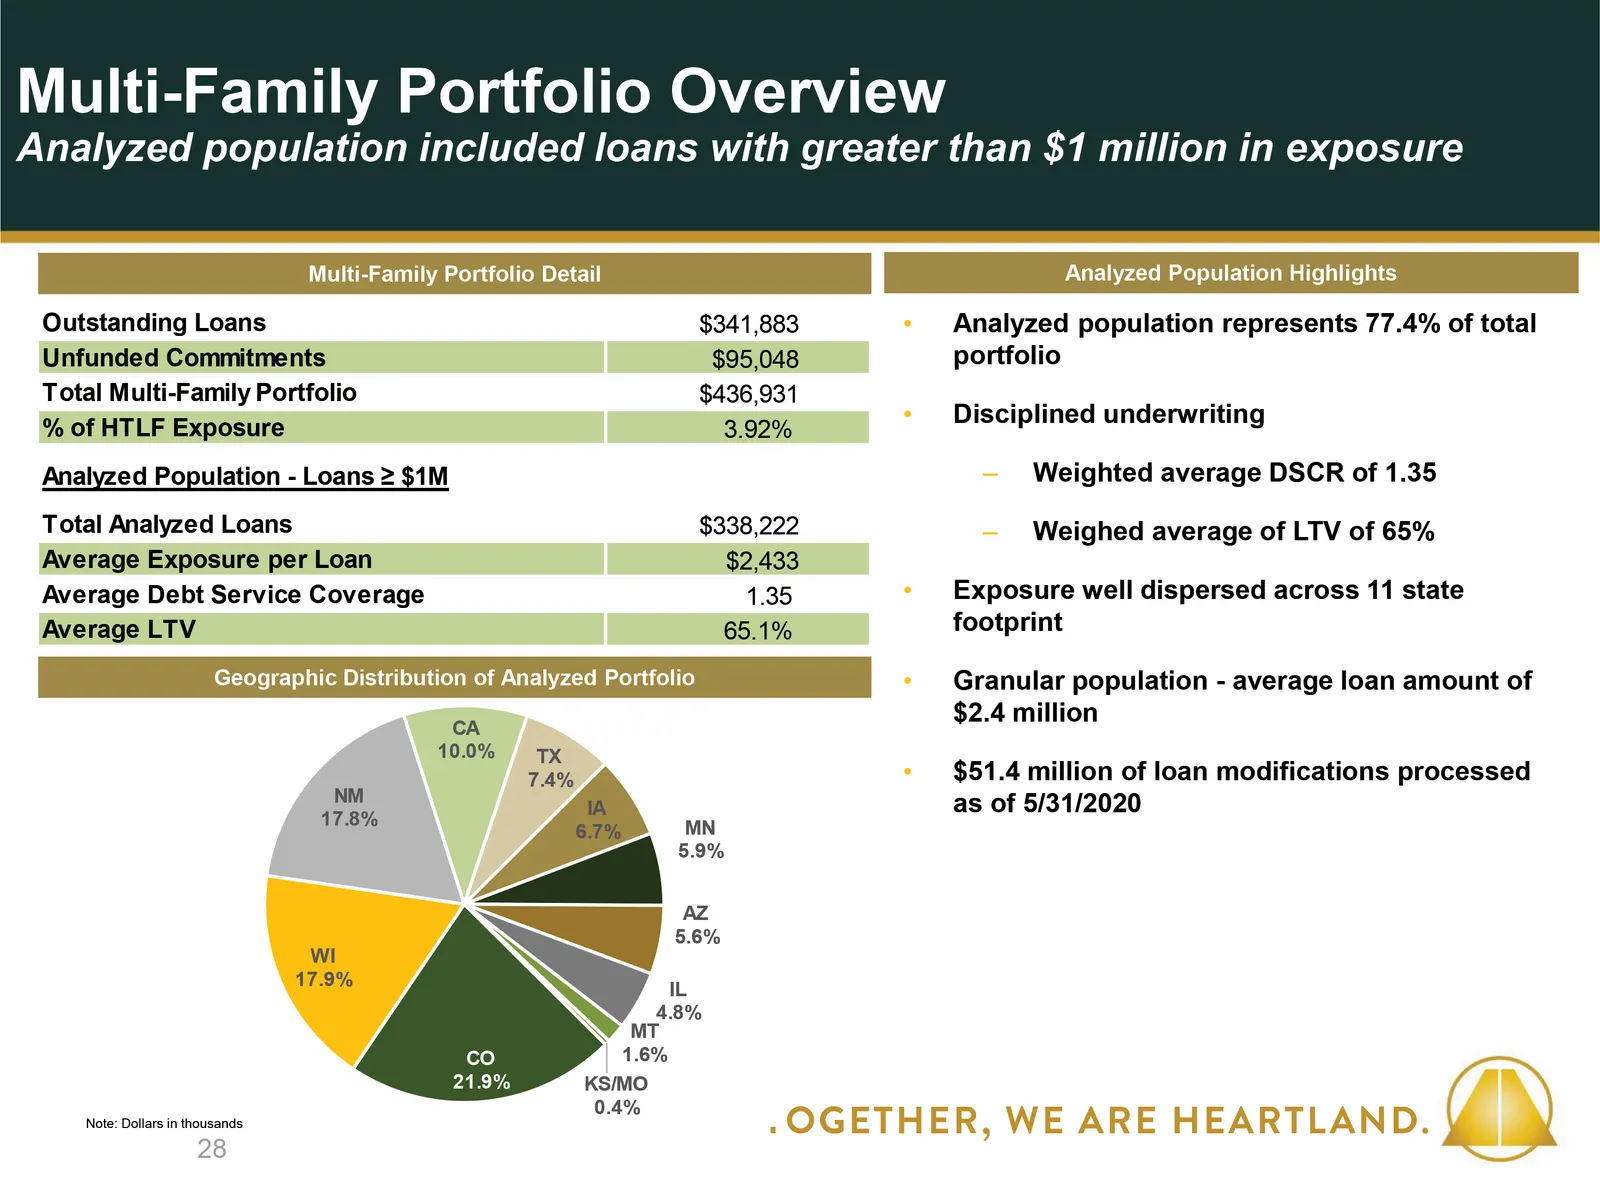
Analyzed population represents 77.4% of total portfolioDisciplined underwritingWeighted average DSCR of 1.35Weighed average of LTV of 65%Exposure well dispersed across 11 state footprintGranular population - average loan amount of $2.4 million$51.4 million of loan modifications processed as of 5/31/
Slide 29: Restaurants & Bars Portfolio Overview
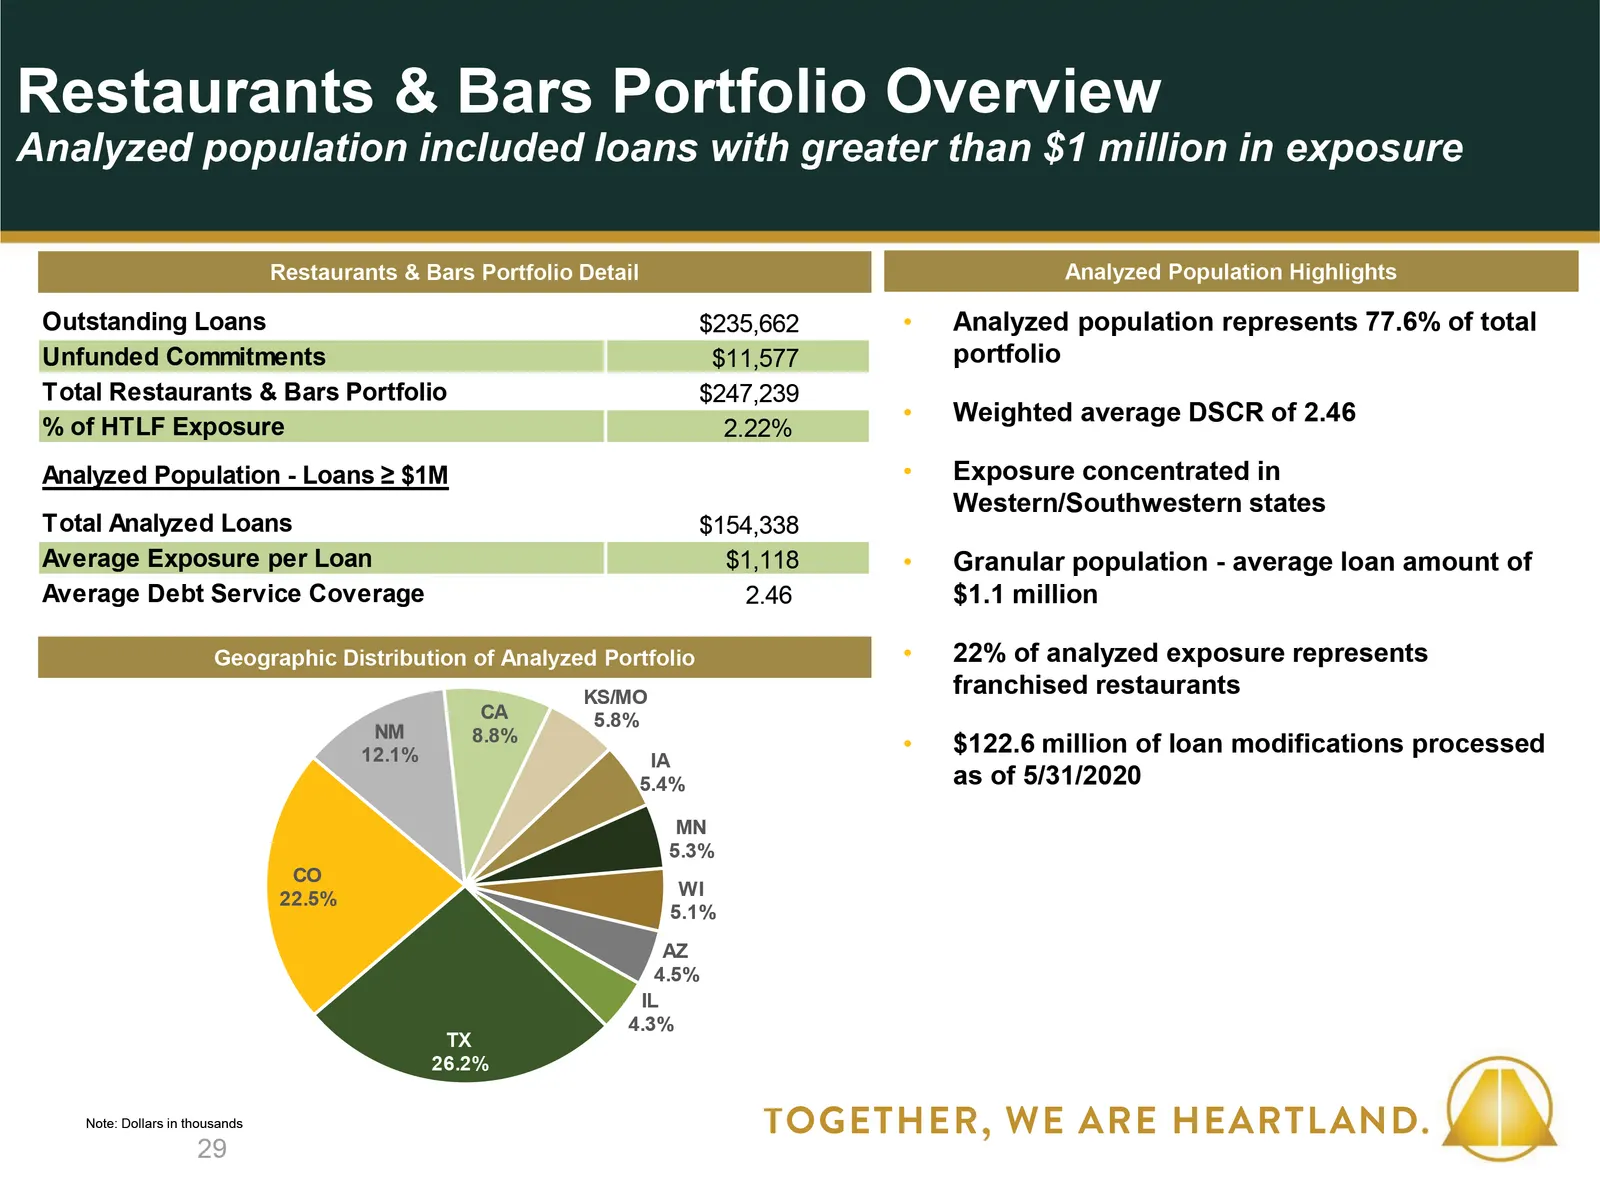
568735 2551920 192212152 16113769 3173125 175171171 216202164 Analyzed Population Highlights Geographic Distribution of Analyzed Portfolio Restaurants & Bars Portfolio Detail Analyzed population represents 77.6% of total portfolioWeighted average DSCR of 2.46Exposure concentrated in Western/Southwes
Slide 30: Retail Real Estate Portfolio Overview
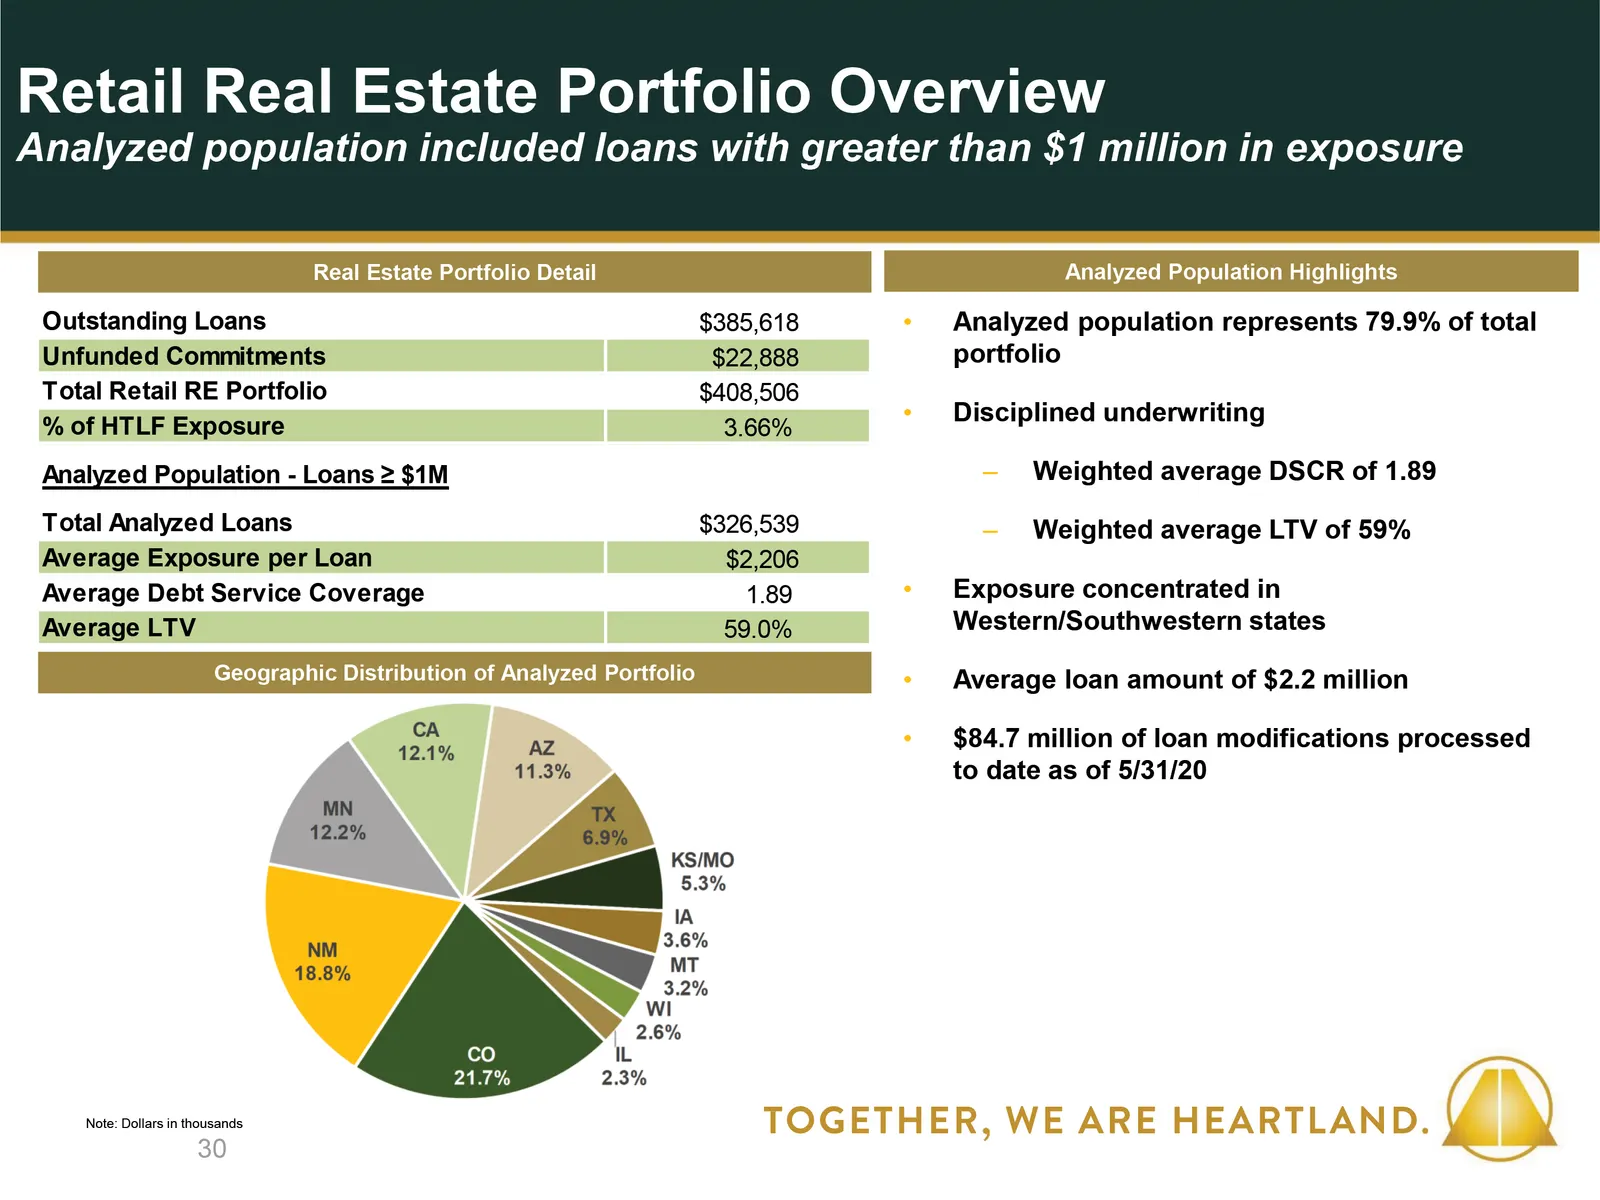
568735 2551920 192212152 16113769 3173125 175171171 216202164 Analyzed Population Highlights Geographic Distribution of Analyzed Portfolio Real Estate Portfolio Detail Analyzed population represents 79.9% of total portfolioDisciplined underwritingWeighted average DSCR of 1.89Weighted average LTV of
Slide 31: Retail Trade Portfolio Overview
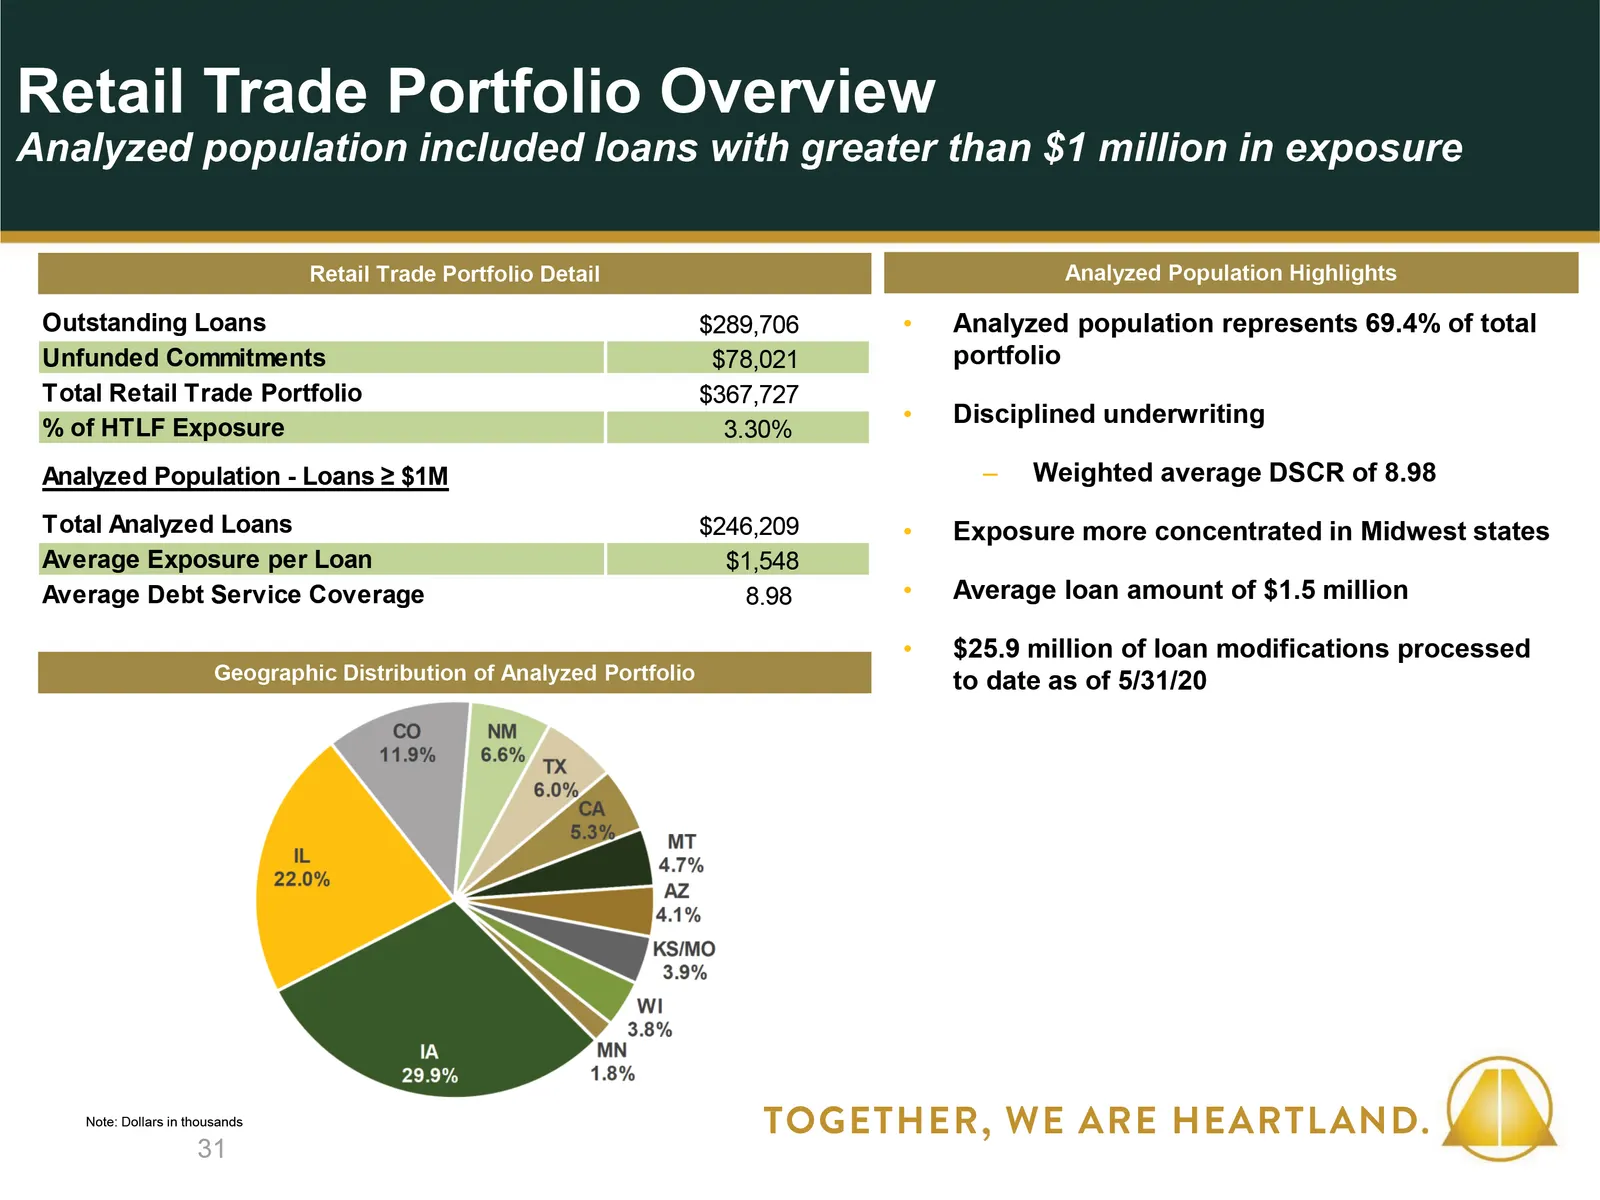
568735 2551920 192212152 16113769 3173125 175171171 216202164 Note: Dollars in thousands Analyzed Population Highlights Geographic Distribution of Analyzed Portfolio Retail Trade Portfolio Detail Analyzed population represents 69.4% of total portfolioDisciplined underwritingWeighted average DSCR of
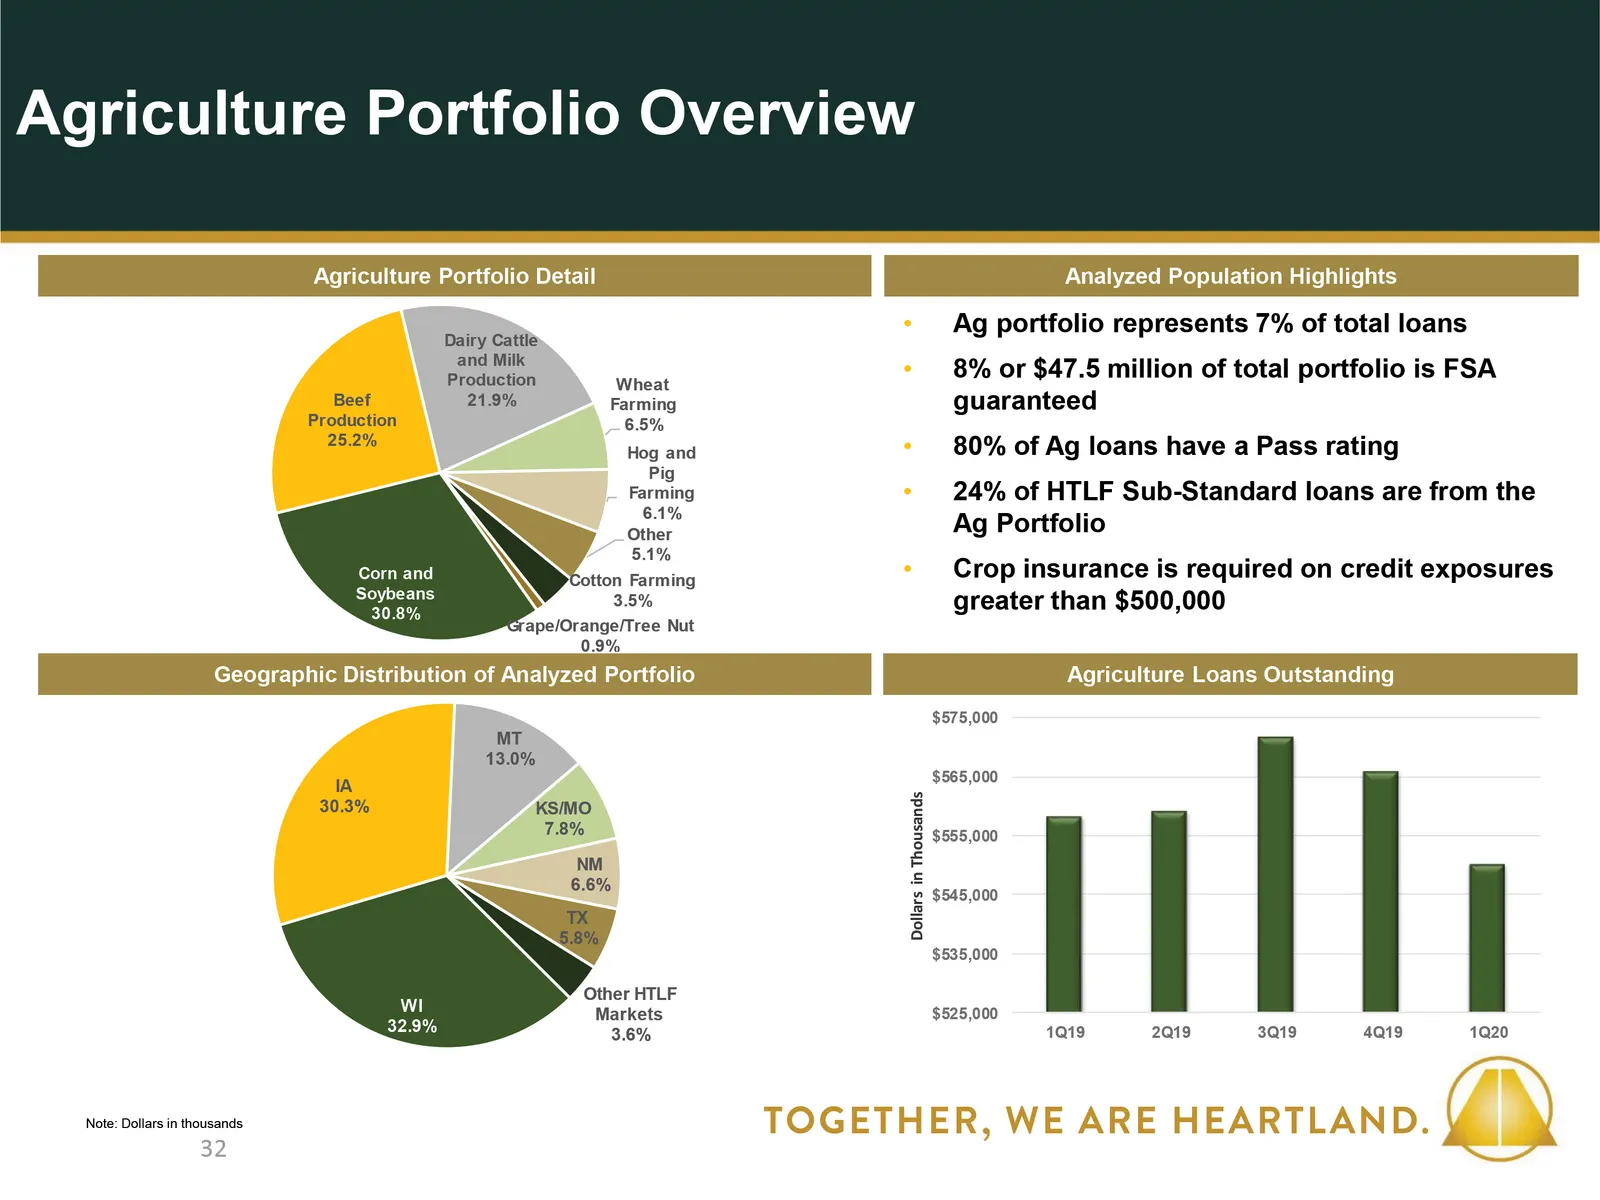
Slide 32: Agriculture Portfolio Overview
Analyzed Population Highlights Agriculture Portfolio Detail Ag portfolio represents 7% of total loans8% or $47.5 million of total portfolio is FSA guaranteed80% of Ag loans have a Pass rating24% of HTLF Sub-Standard loans are from the Ag PortfolioCrop insurance is required on credit exposures greate
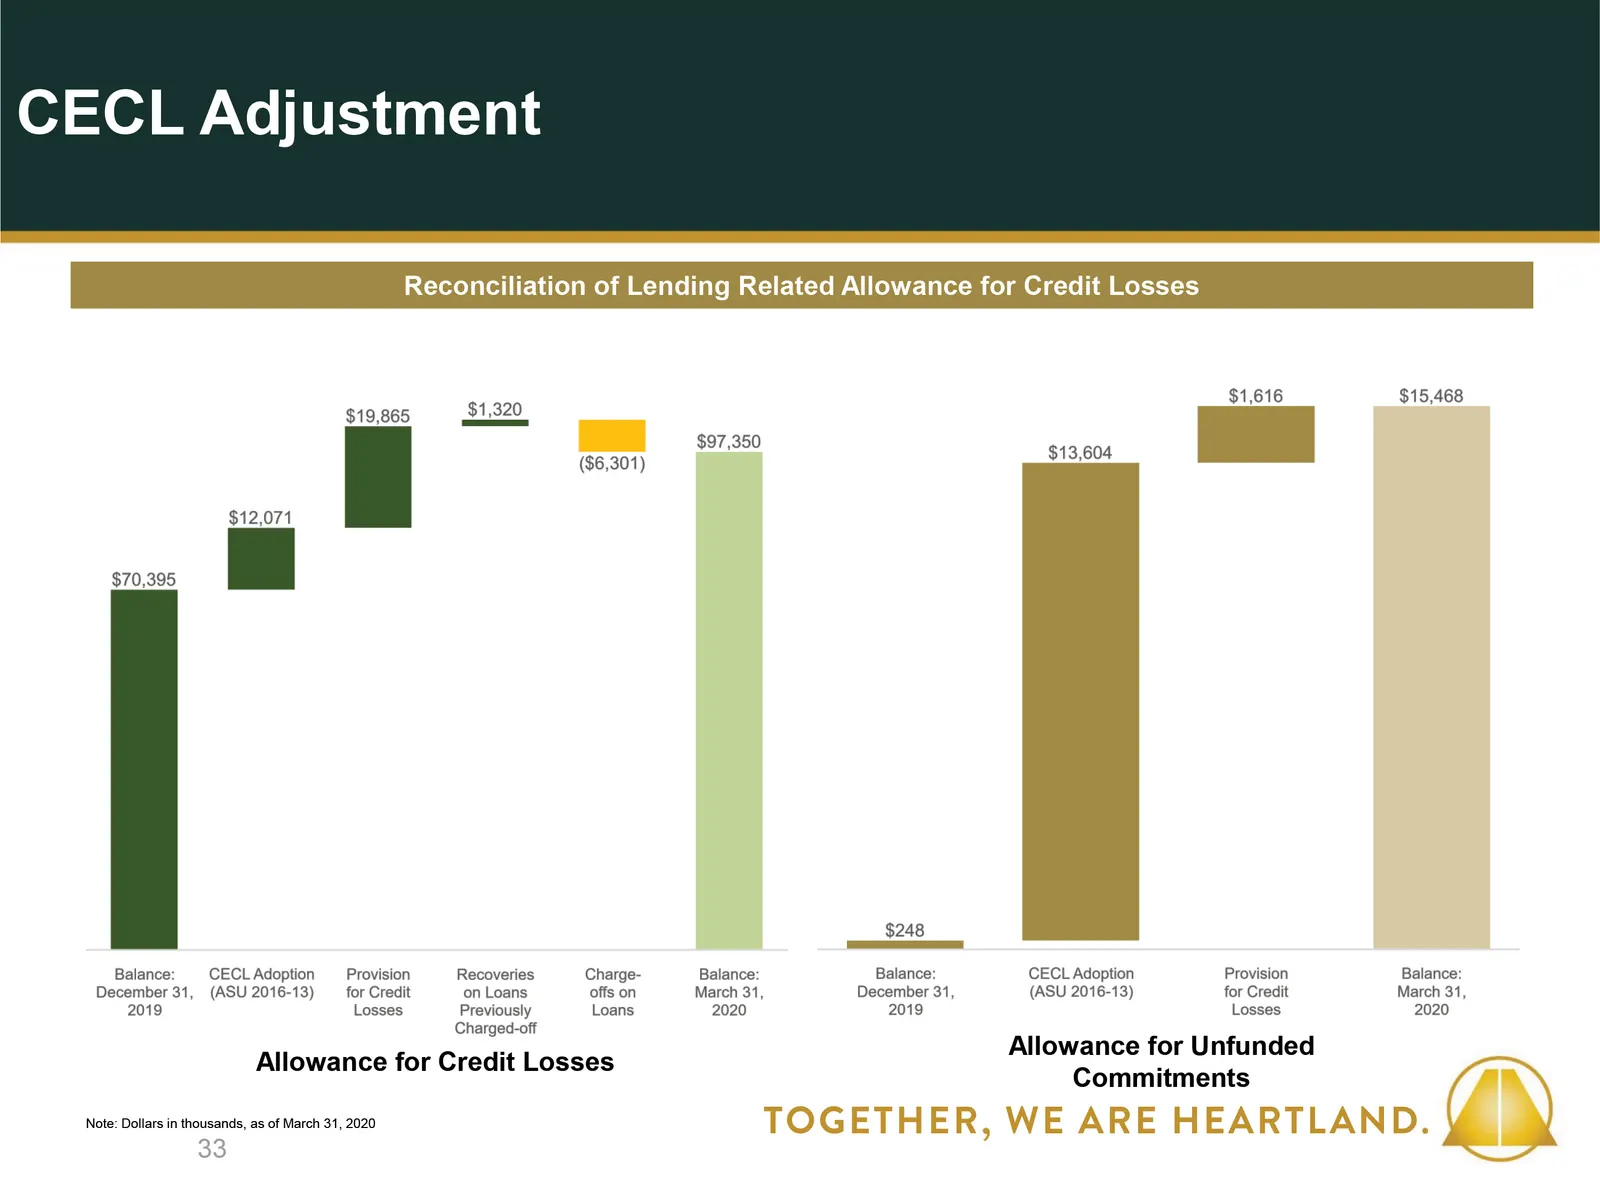
Slide 33: Reconciliation of Lending Related Allowance for Credit Losses
33 Note: Dollars in thousands, as of March 31, 2020 568735 2551920 192212152 16113769 3173125 175171171 216202164 Reconciliation of Lending Related Allowance for Credit Losses Allowance for Credit Losses Allowance for Unfunded Commitments CECL Adjustment
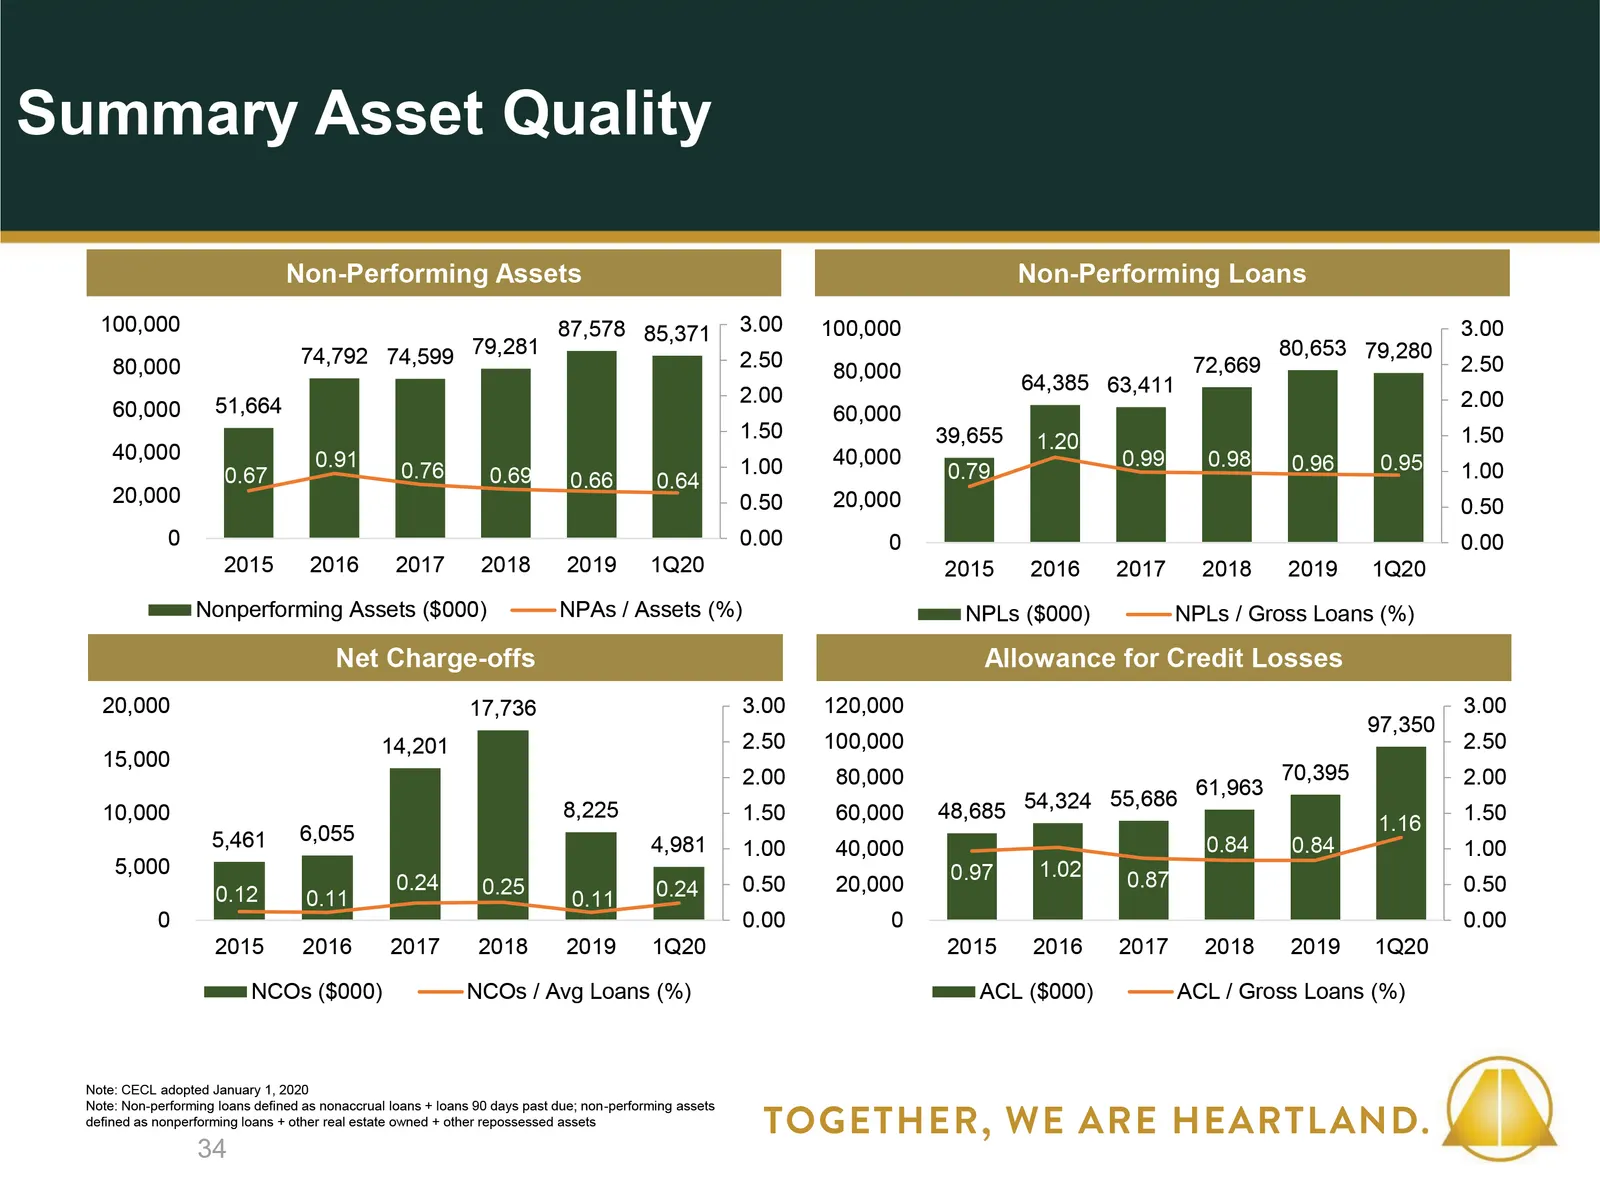
Slide 34: Summary Asset Quality
Non-Performing Assets Non-Performing Loans 34 Net Charge-offs Allowance for Credit Losses 568735 2551920 192212152 16113769 3173125 175171171 216202164 Note: CECL adopted January 1, 2020Note: Non-performing loans defined as nonaccrual loans + loans 90 days past due; non-performing assets defined as

Slide 35: Investments, Liquidity, Funding and Capital
PRESENTATION CAN BE UP TO THREE LINES CAN BE UP TO THREE LINES 35 Presentation Subtitle Investments, Liquidity, Funding and Capital
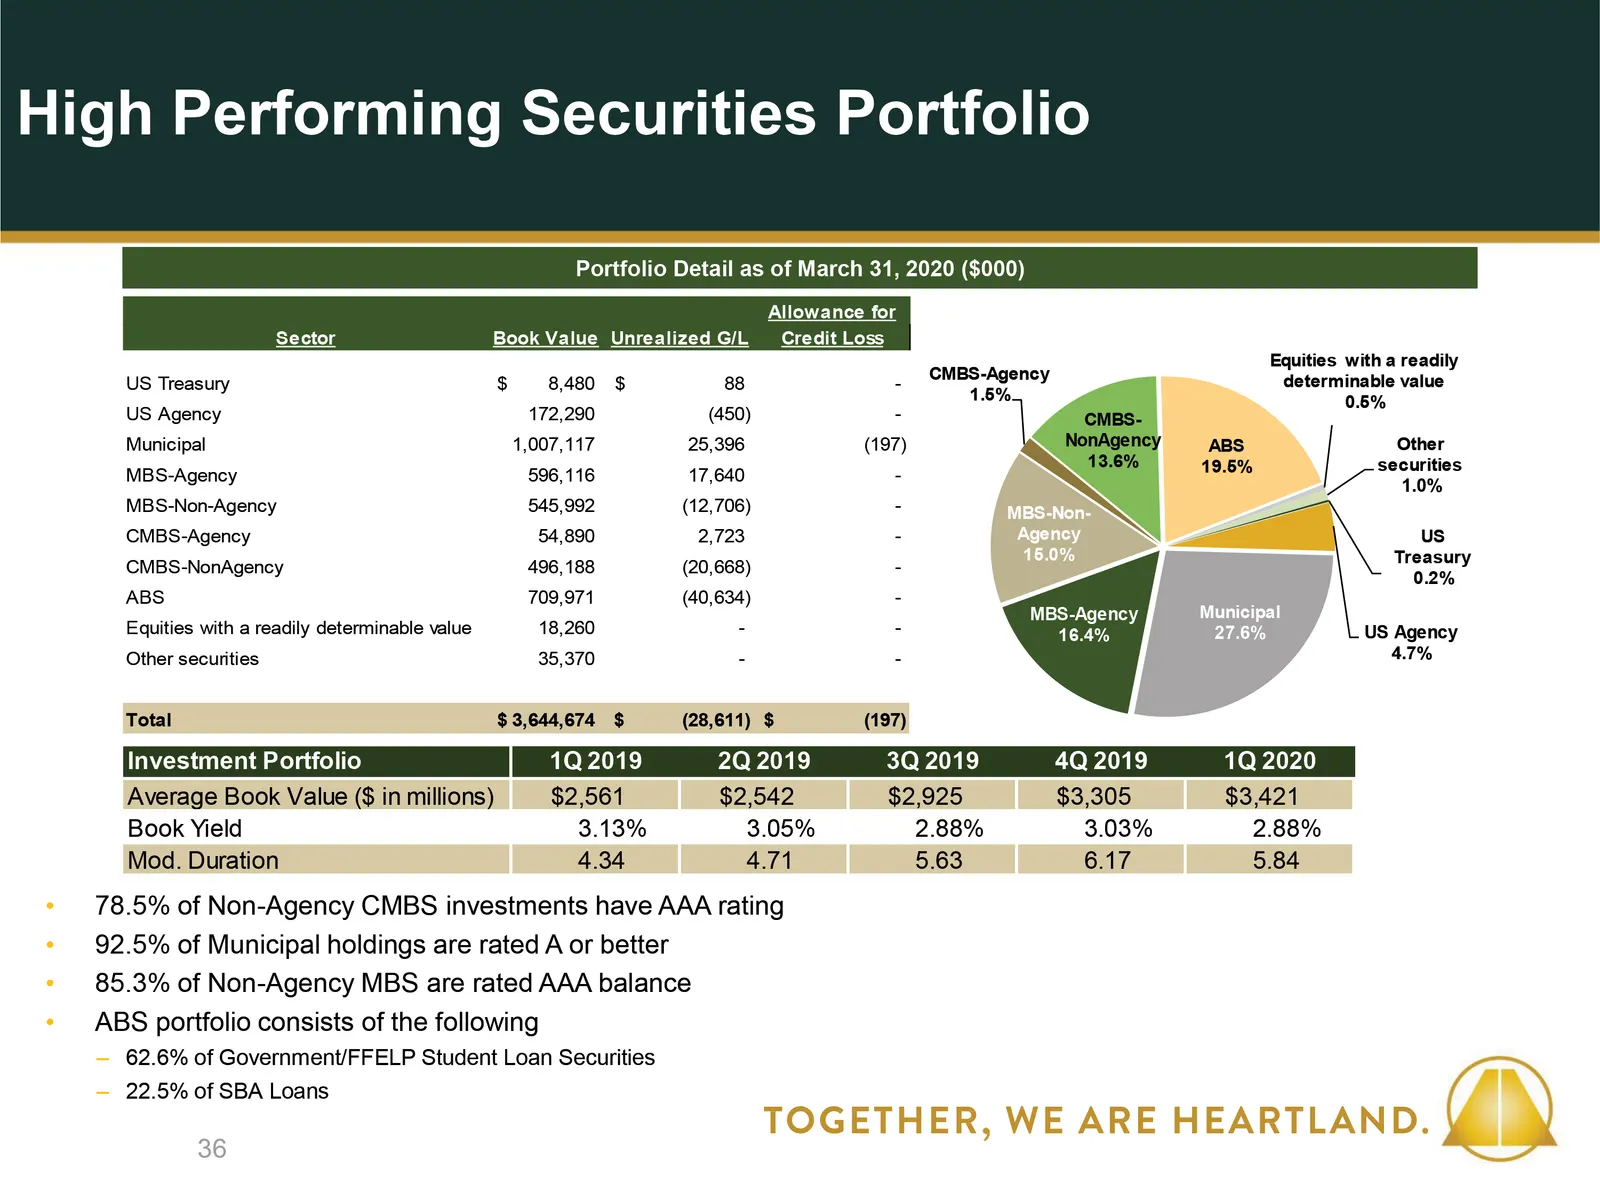
Slide 36: High Performing Securities Portfolio
78.5% of Non-Agency CMBS investments have AAA rating92.5% of Municipal holdings are rated A or better85.3% of Non-Agency MBS are rated AAA balanceABS portfolio consists of the following62.6% of Government/FFELP Student Loan Securities22.5% of SBA Loans 36 568735 2551920 192212152 16113769 3173125 17
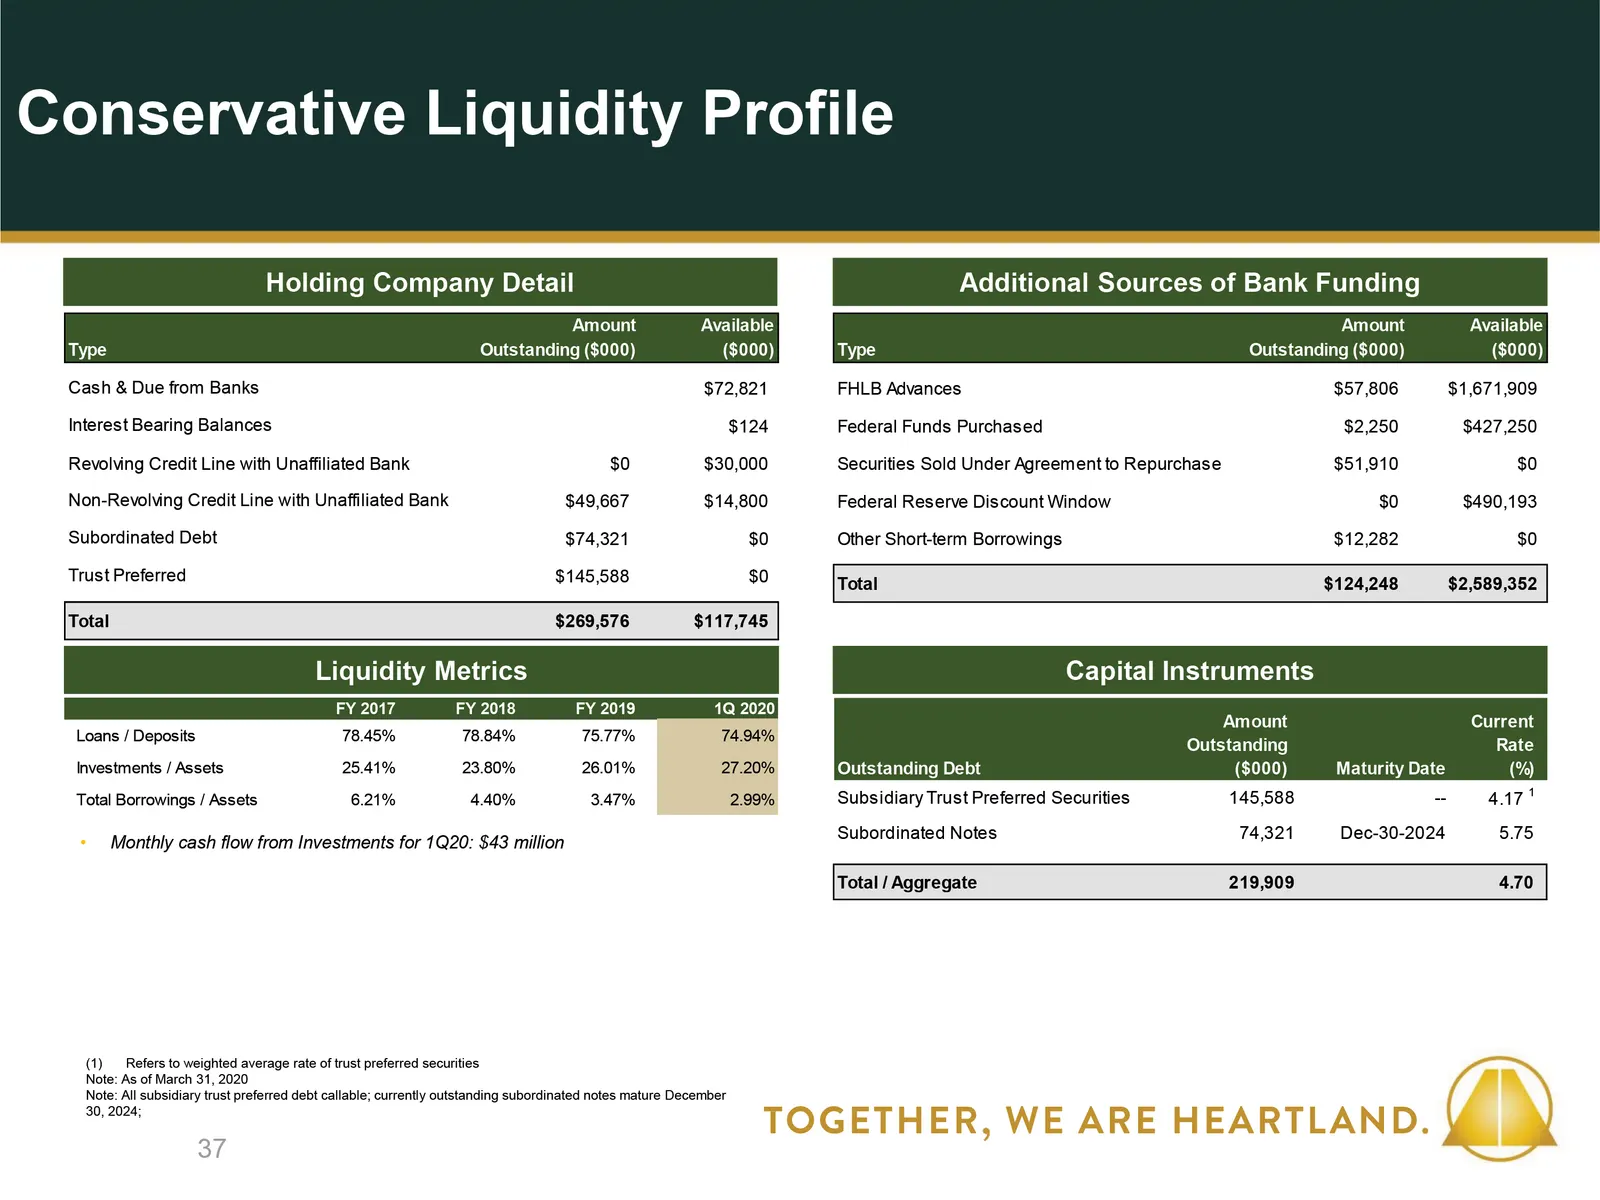
Slide 37: Conservative Liquidity Profile
37 Monthly cash flow from Investments for 1Q20: $43 million 568735 2551920 192212152 16113769 3173125 175171171 216202164 Refers to weighted average rate of trust preferred securitiesNote: As of March 31, 2020Note: All subsidiary trust preferred debt callable; currently outstanding subordinated note
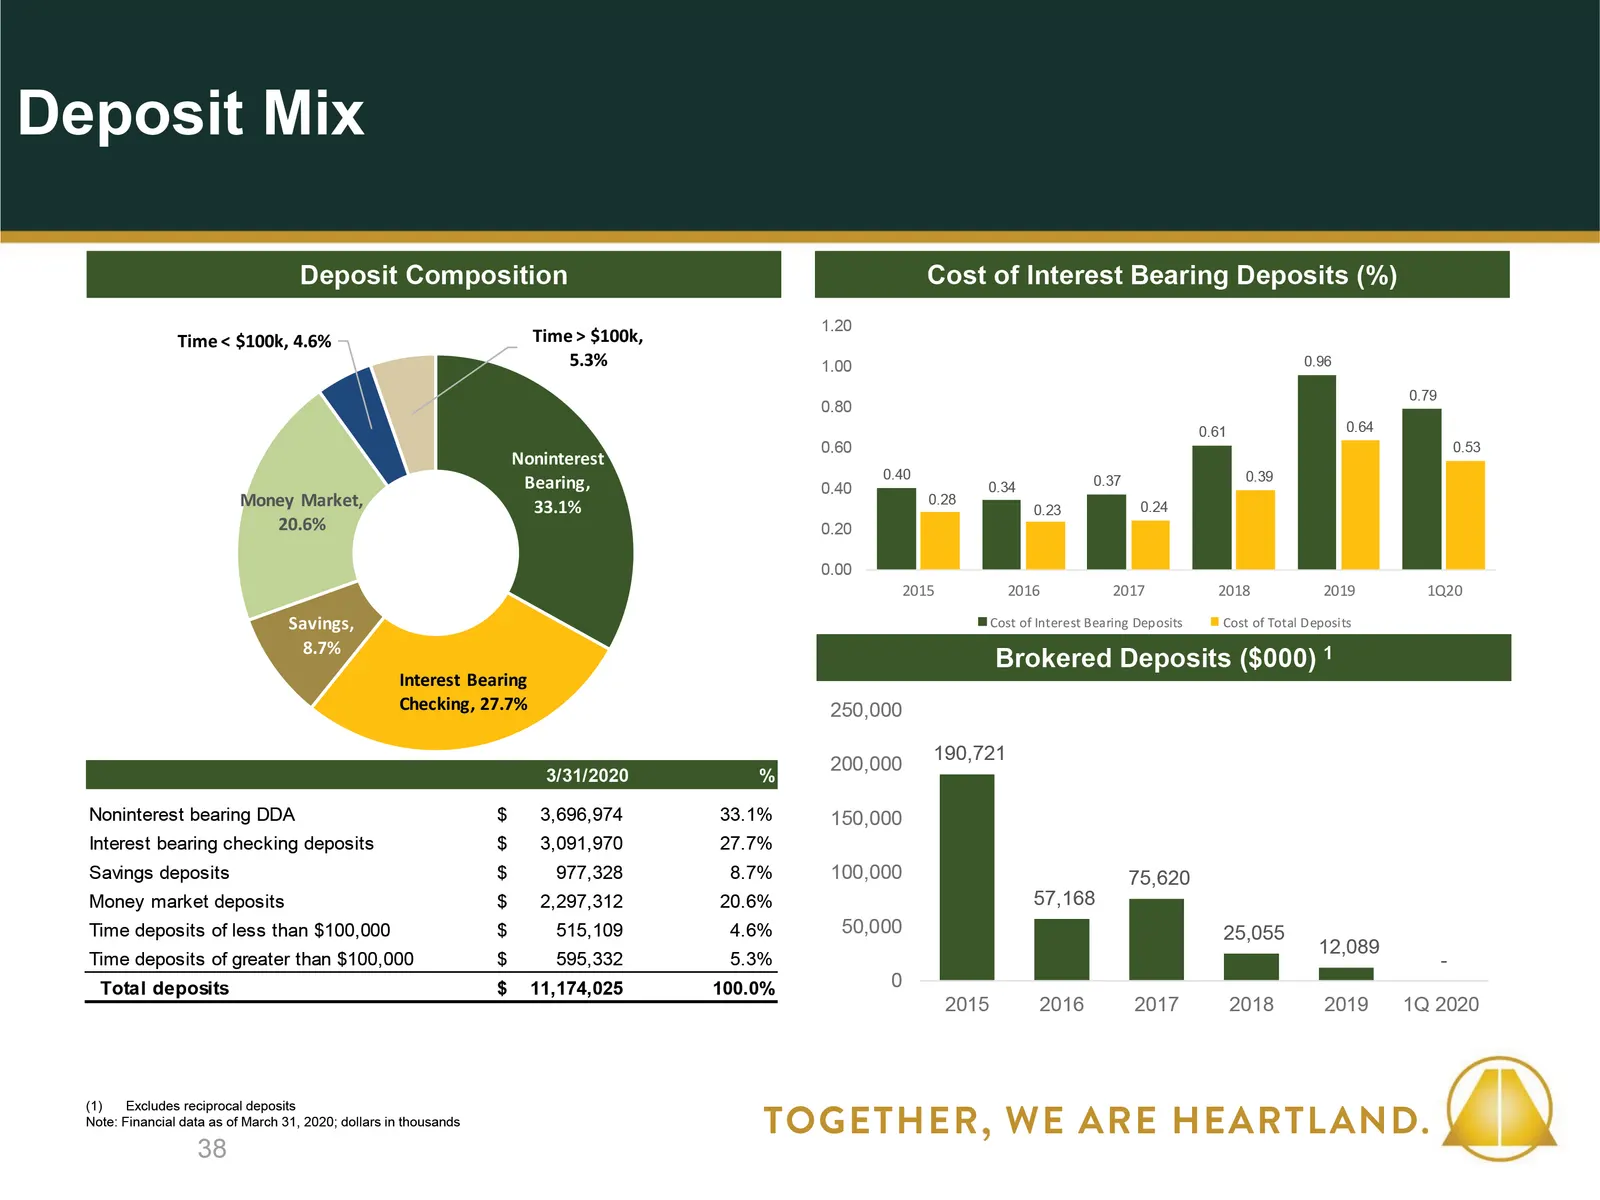
Slide 38: Deposit Mix
Deposit Composition Cost of Interest Bearing Deposits (%) Brokered Deposits ($000) 1 Excludes reciprocal depositsNote: Financial data as of March 31, 2020; dollars in thousands 568735 2551920 192212152 16113769 3173125 175171171 216202164 38 Deposit Mix
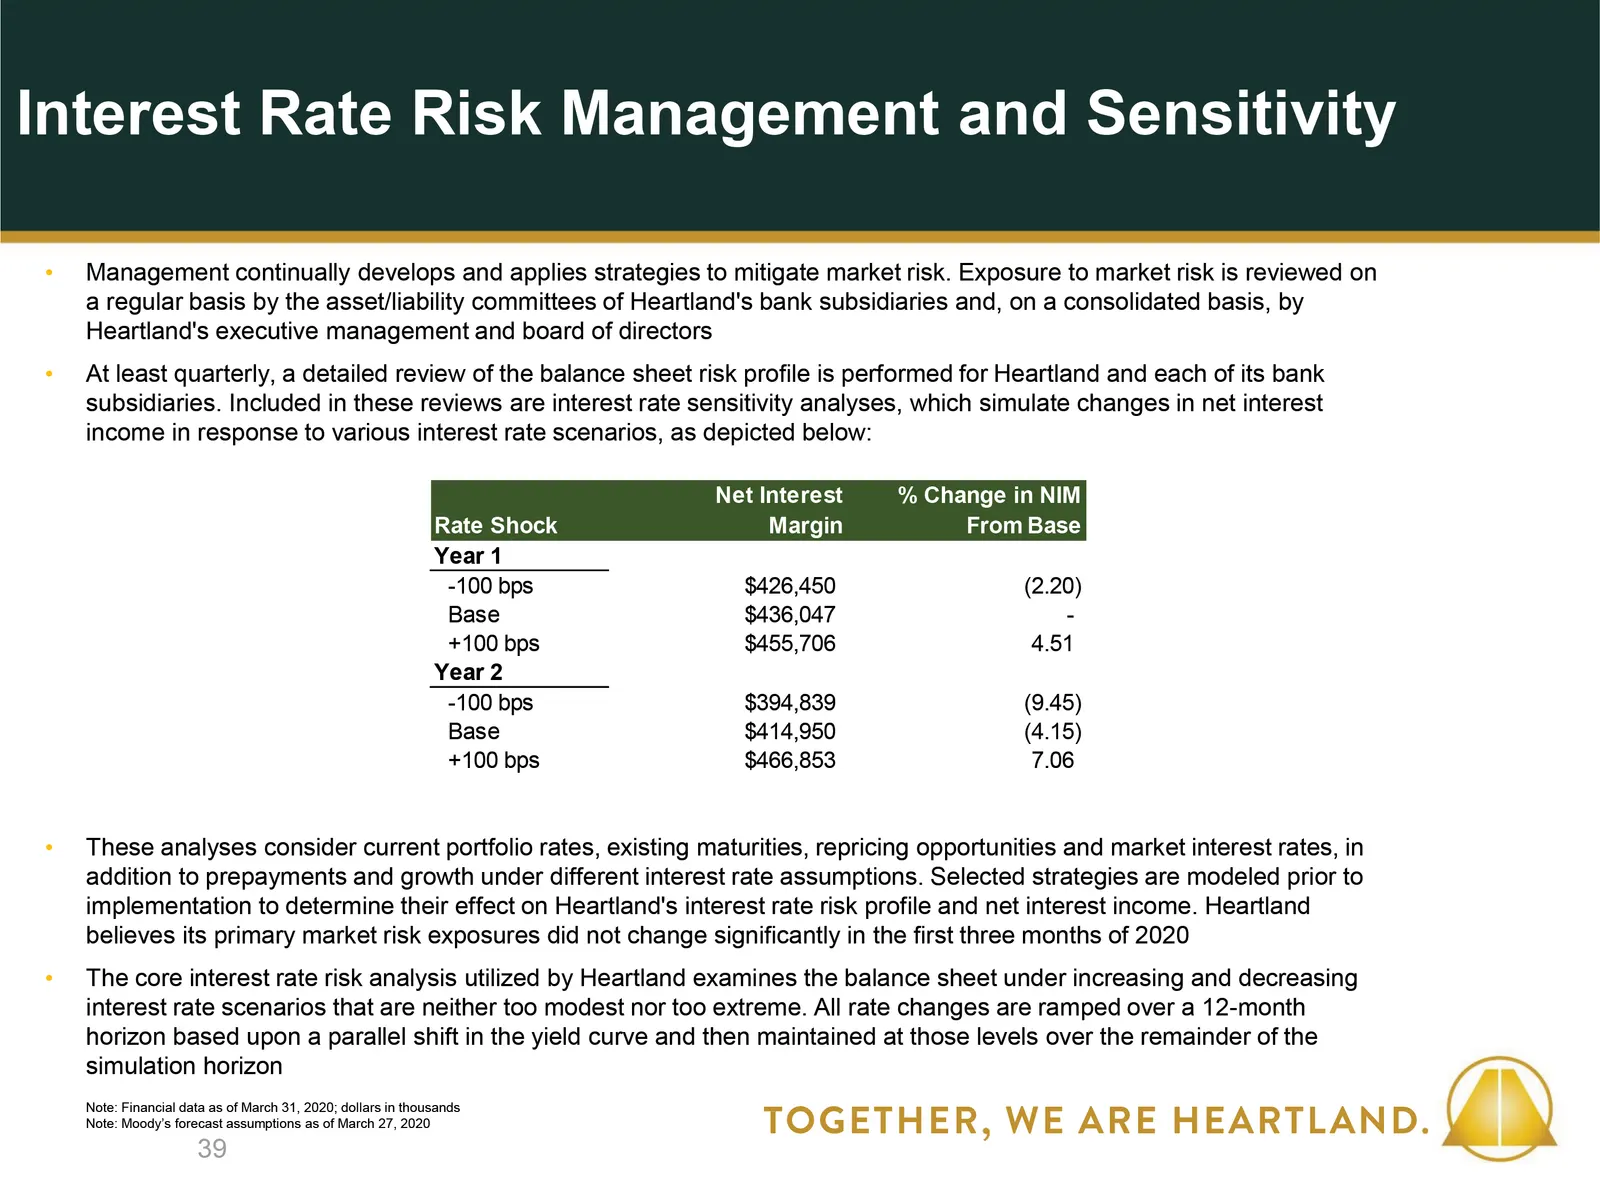
Slide 39: Interest Rate Risk Management
Management continually develops and applies strategies to mitigate market risk. Exposure to market risk is reviewed on a regular basis by the asset/liability committees of Heartland's bank subsidiaries and, on a consolidated basis, by Heartland's executive management and board of directorsAt least q
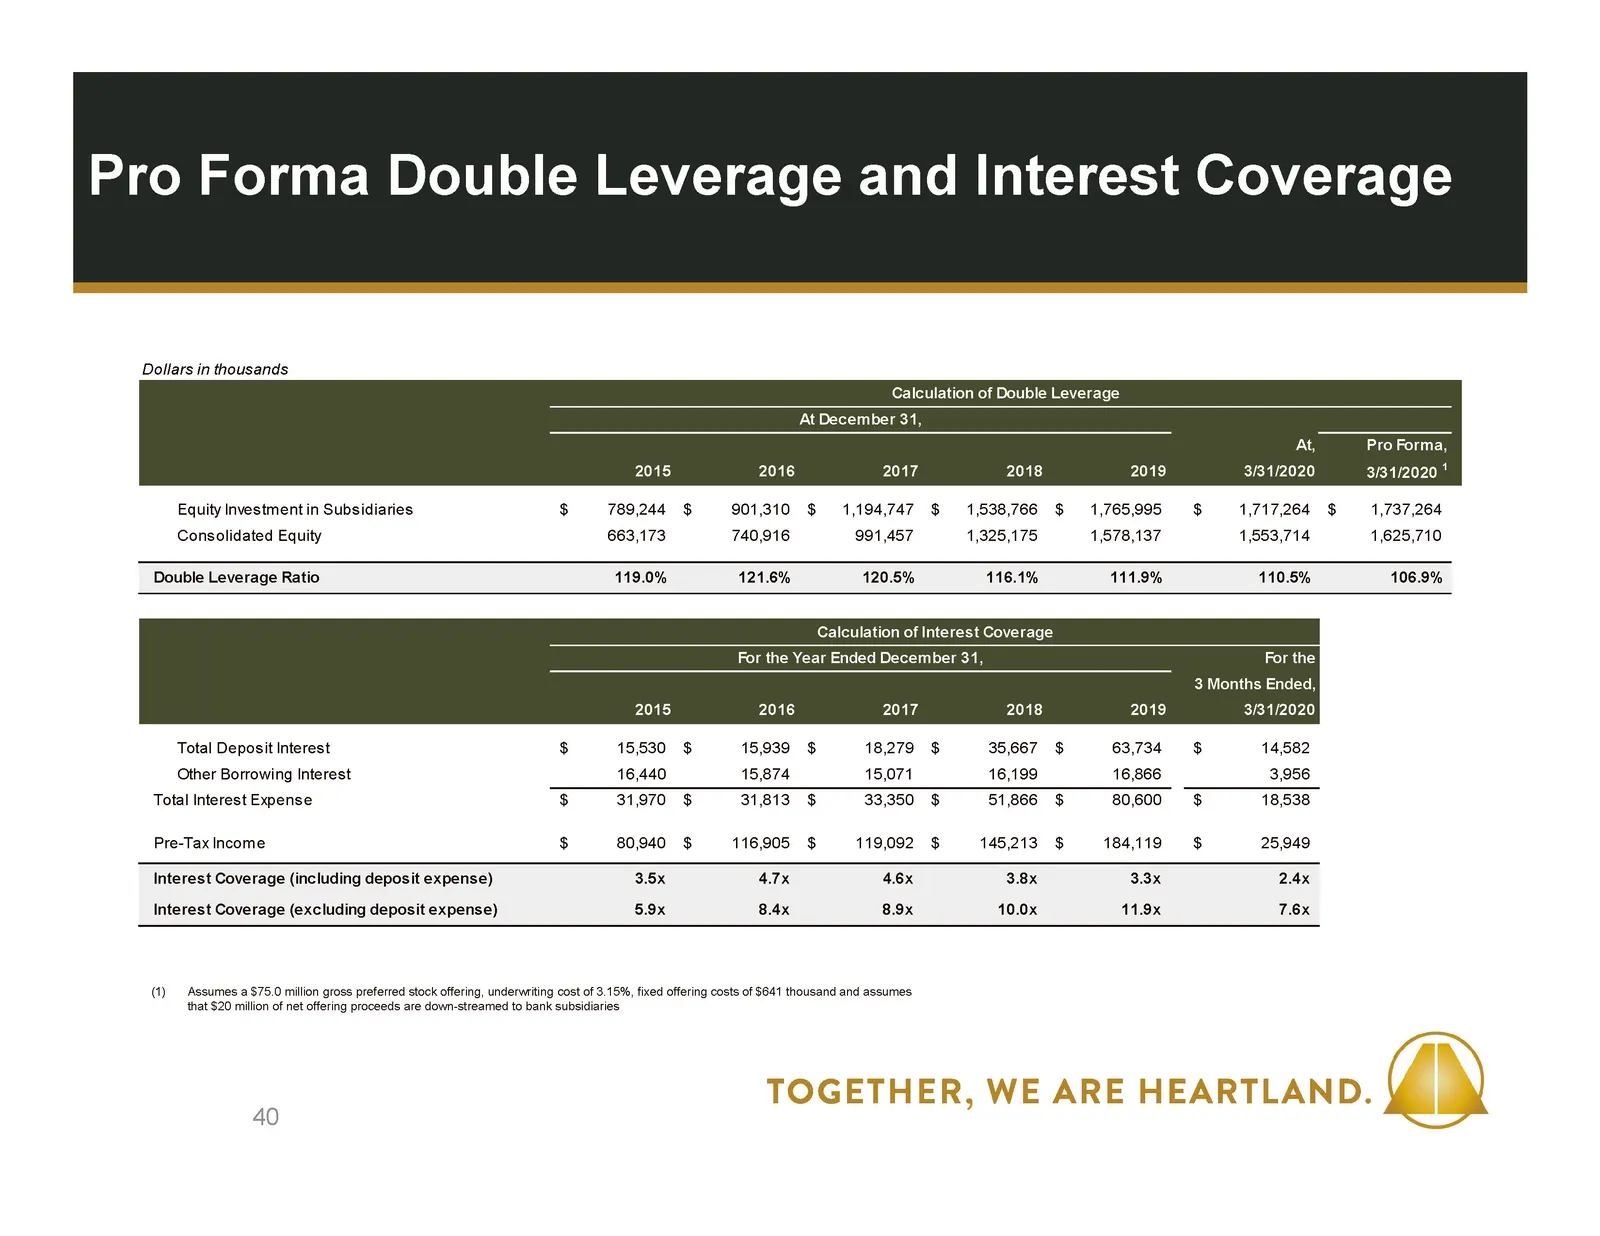
Slide 40: Pro Forma Double Leverage and Interest Coverage
568735 2551920 192212152 16113769 3173125 175171171 216202164 40 Pro Forma Double Leverage and Interest Coverage Assumes a $100.0 million gross preferred stock offering, underwriting cost of 3.15%, fixed offering costs of $641 thousand and assumes that $20 million of net offering proceeds are down-s
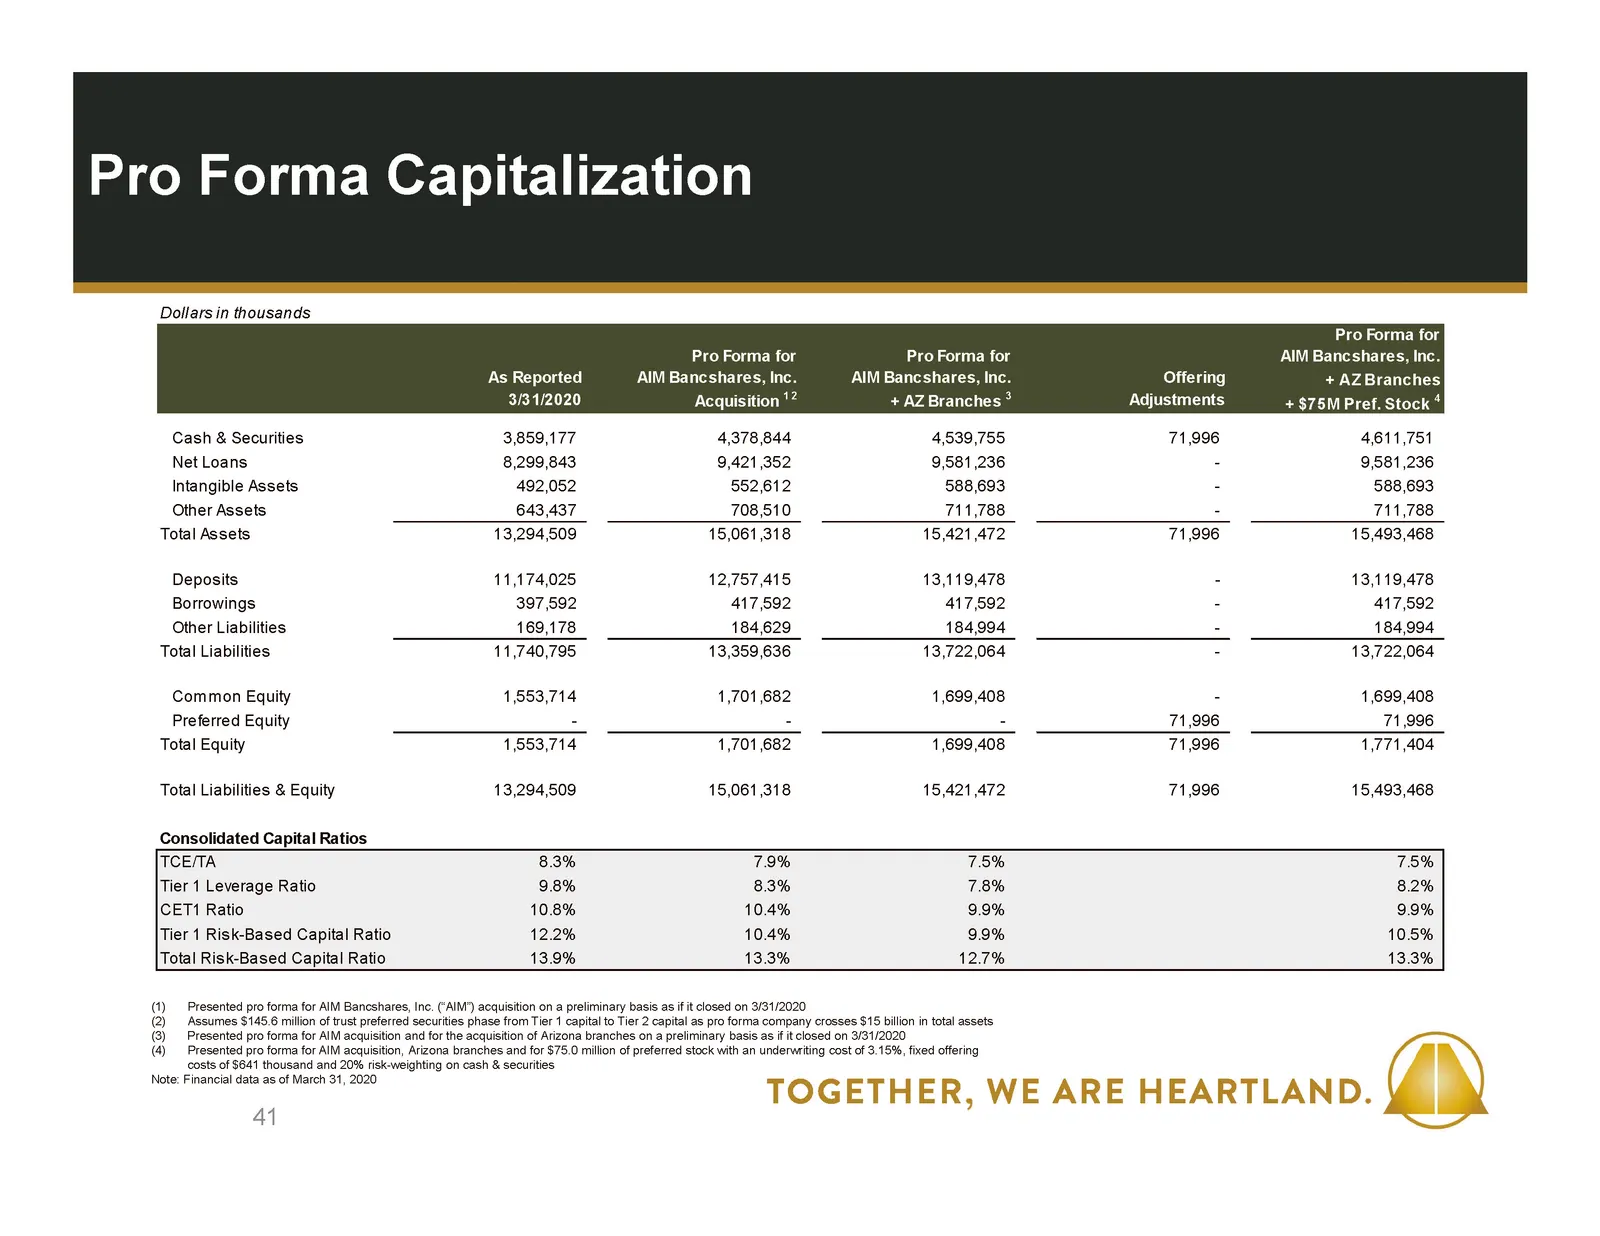
Slide 41: Pro Forma Capitalization
568735 2551920 192212152 16113769 3173125 175171171 216202164 41 Pro Forma Capitalization Presented pro forma for AIM Bancshares, Inc. (“AIM”) acquisition on a preliminary basis as if it closed on 3/31/2020Assumes $145.6 million of trust preferred securities phase from Tier 1 capital to Tier 2 capit
Slide 42: Investment Summary
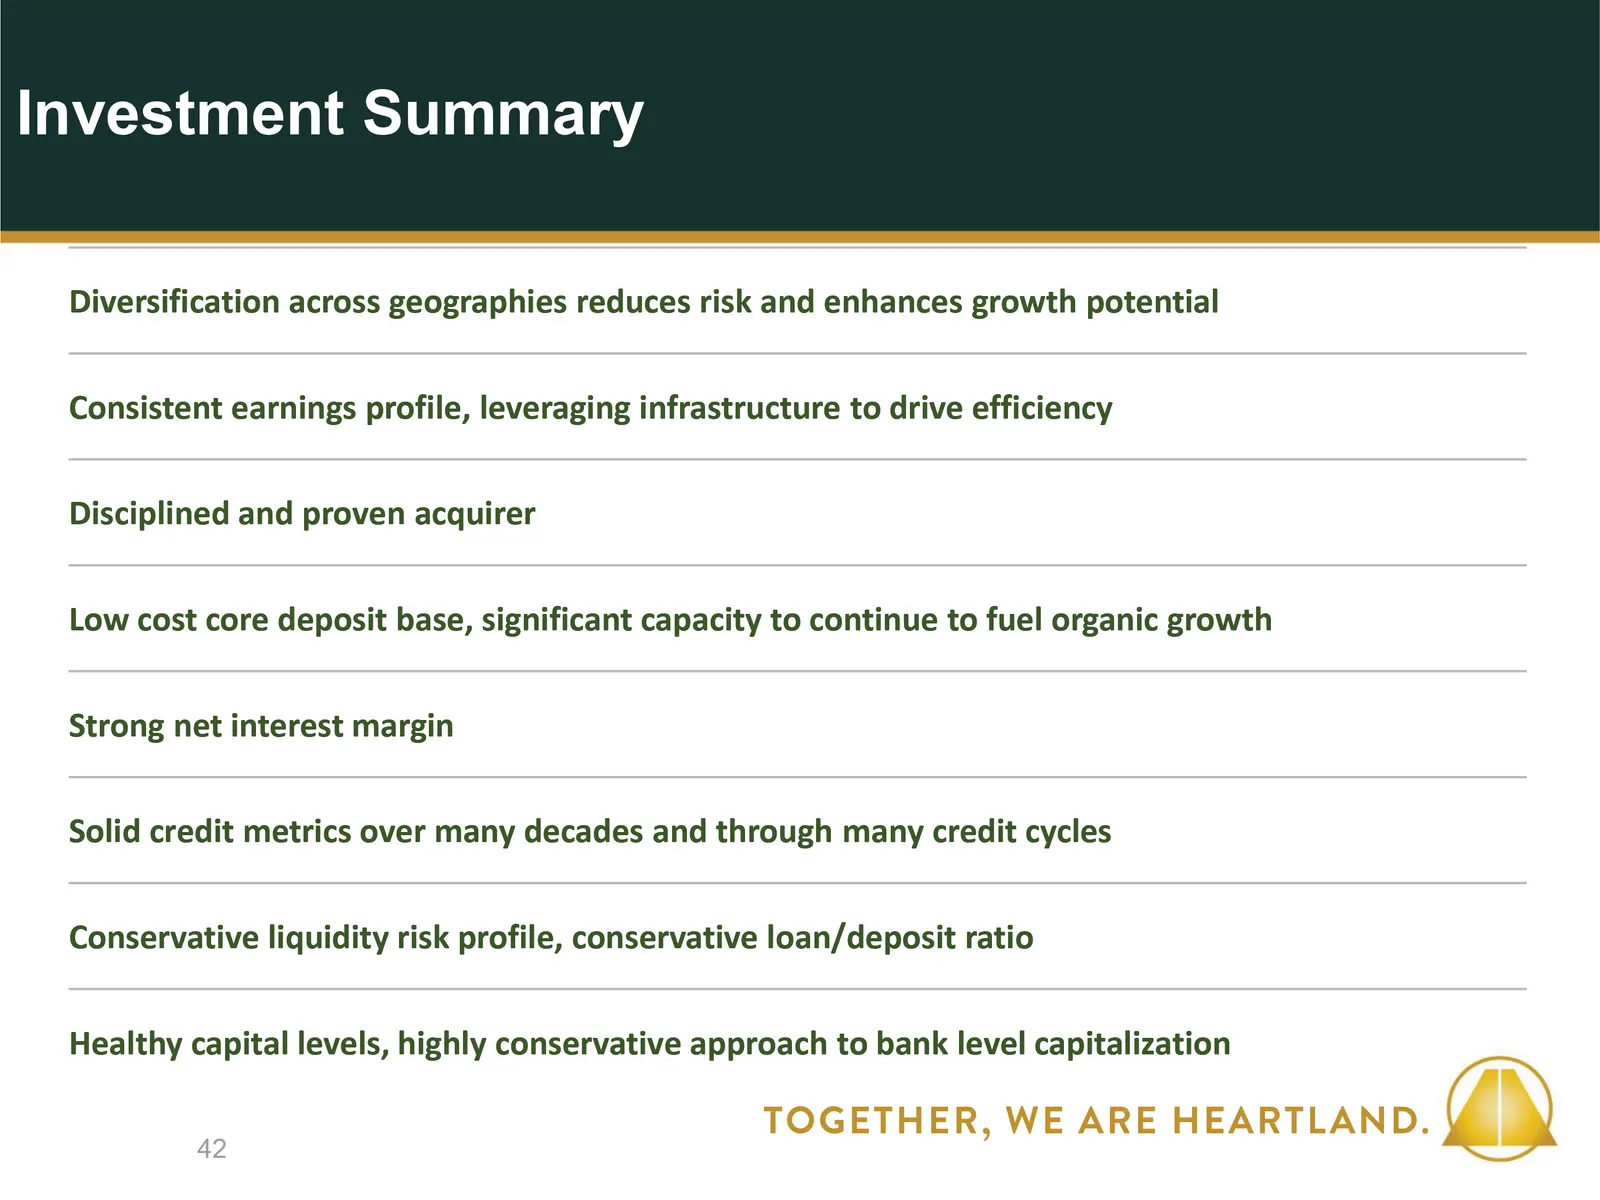
568735 2551920 192212152 16113769 3173125 175171171 216202164 Diversification across geographies reduces risk and enhances growth potential Consistent earnings profile, leveraging infrastructure to drive efficiency Disciplined and proven acquirer Low cost core deposit base, significant capacity to c
Slide 43: Appendix
PRESENTATION CAN BE UP TO THREE LINES CAN BE UP TO THREE LINES 43 Presentation Subtitle Appendix
Slide 44: Non-GAAP Measure Definitions
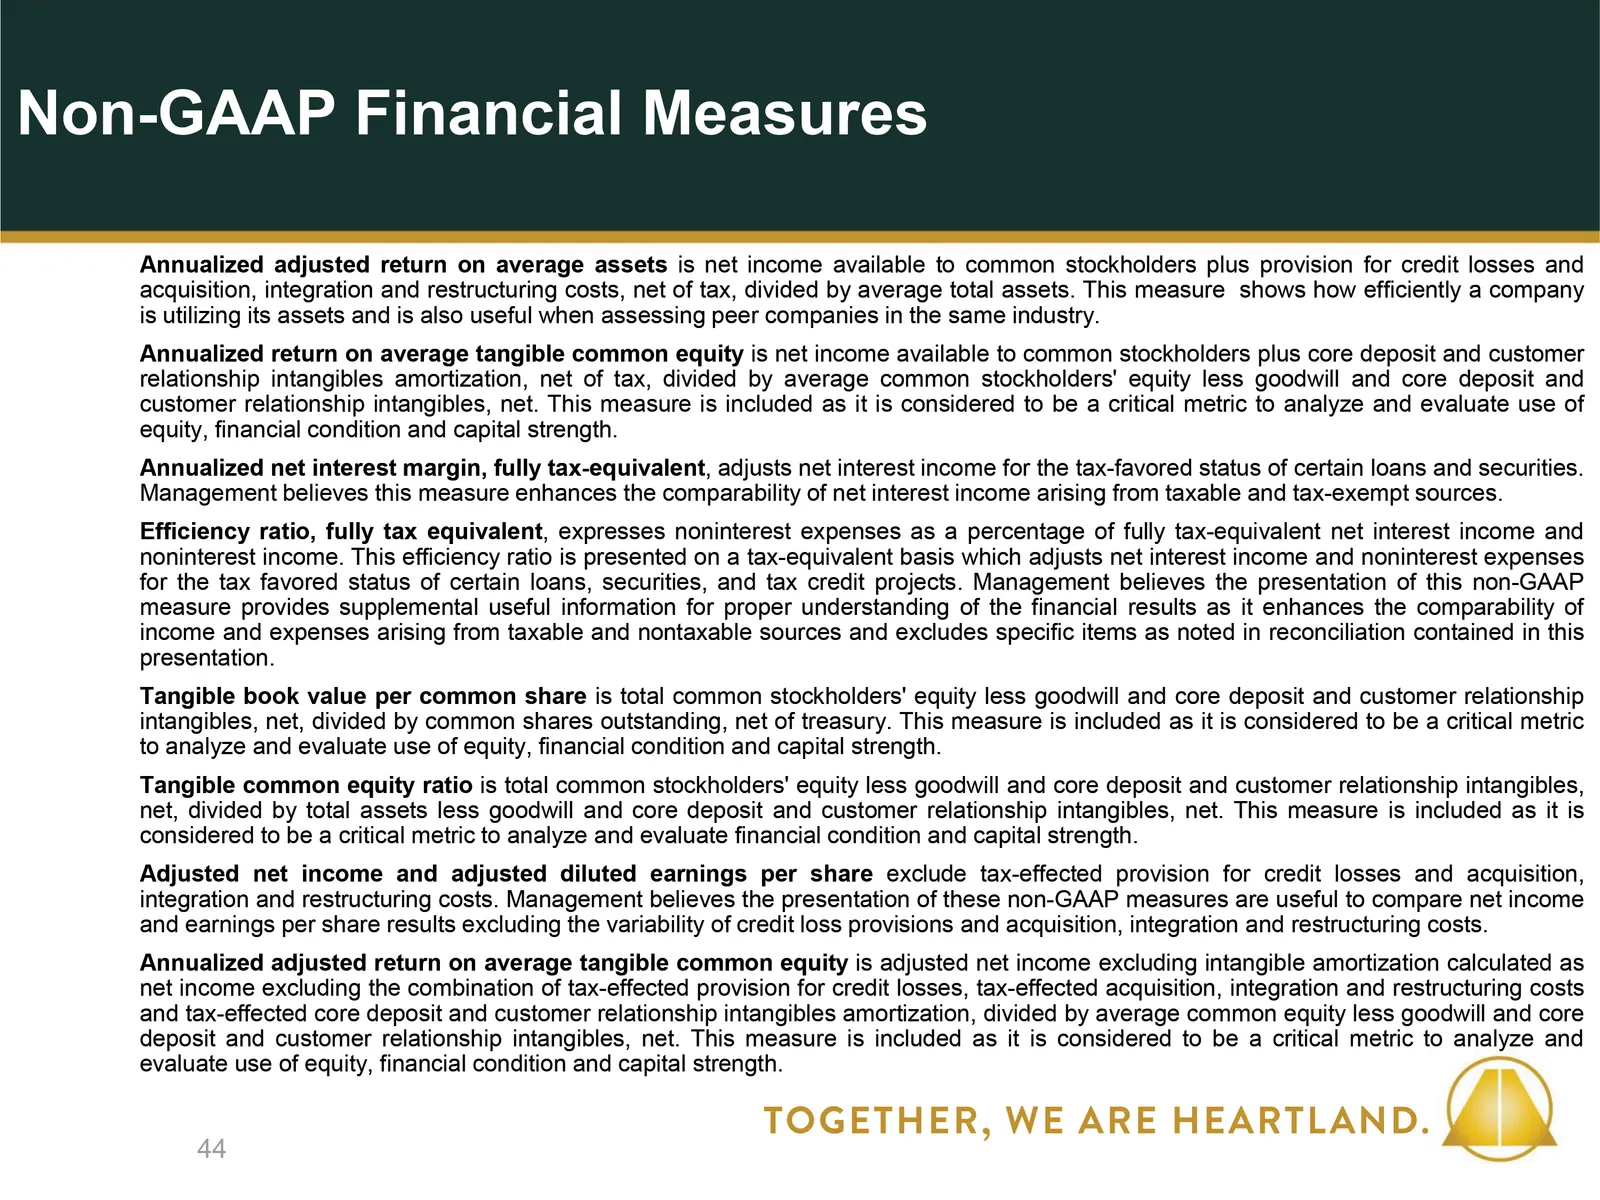
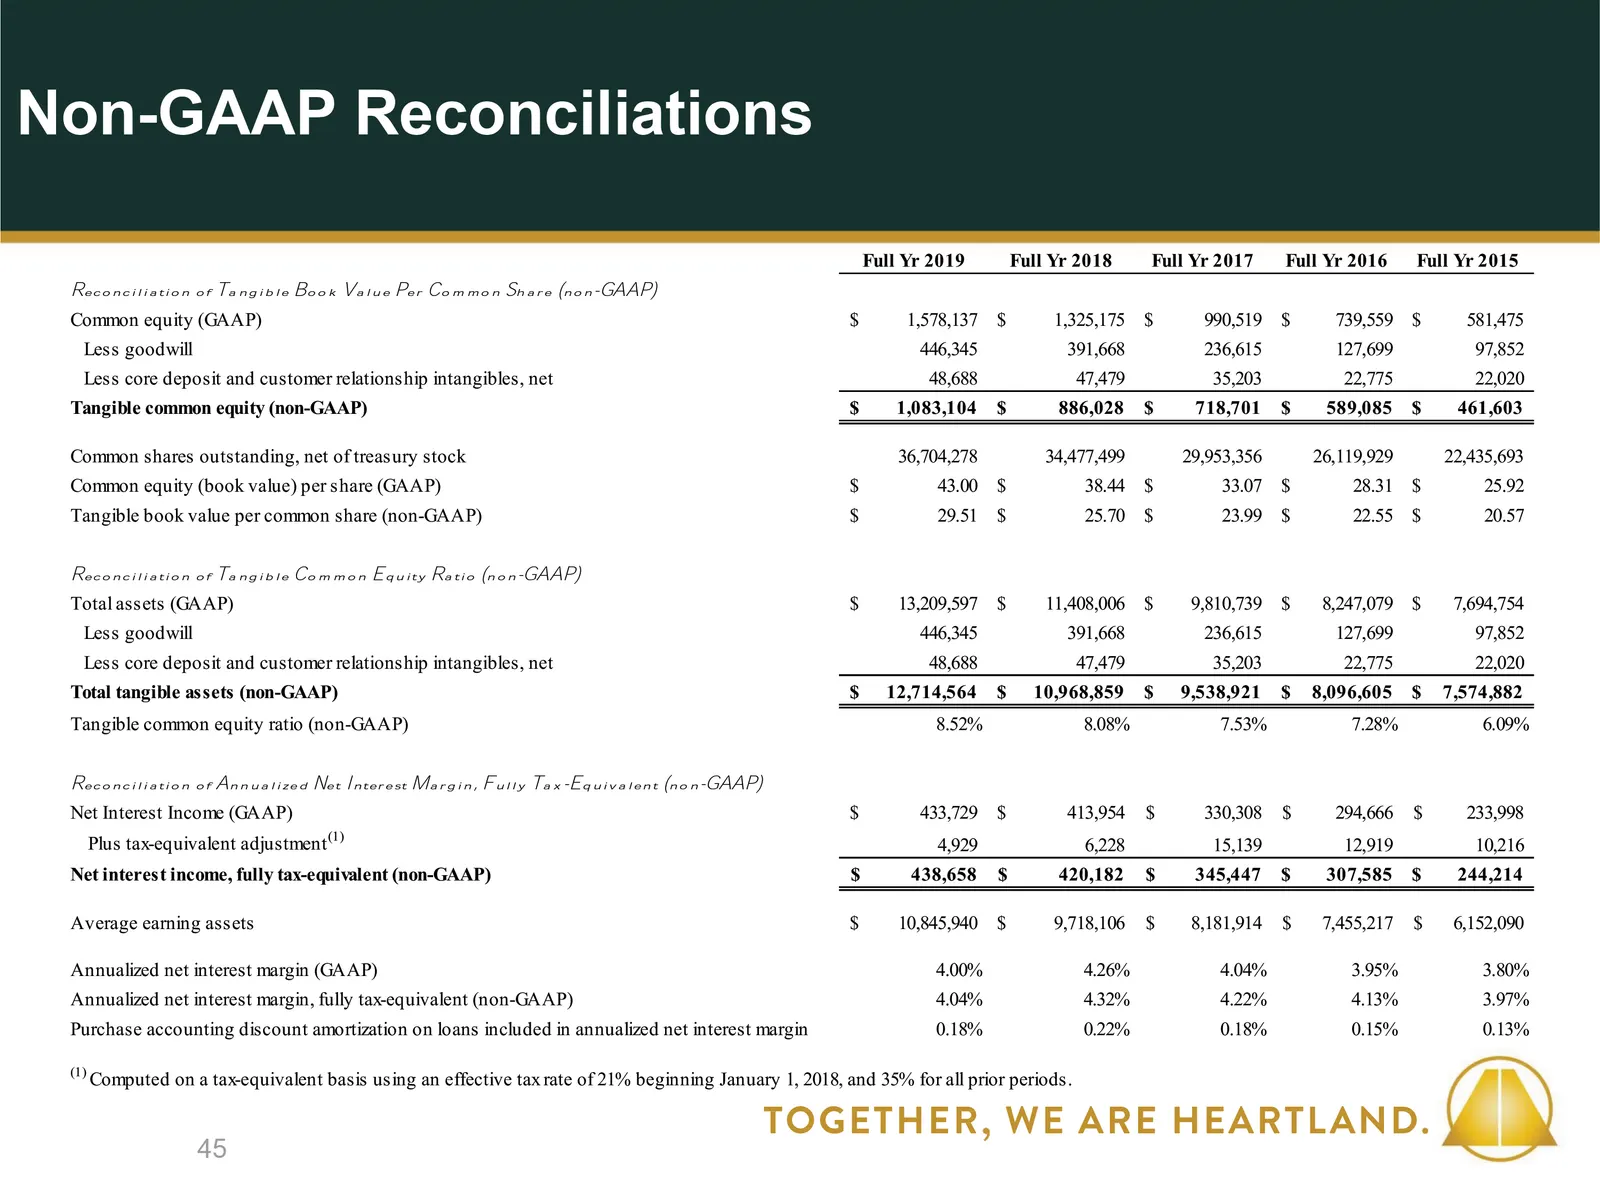
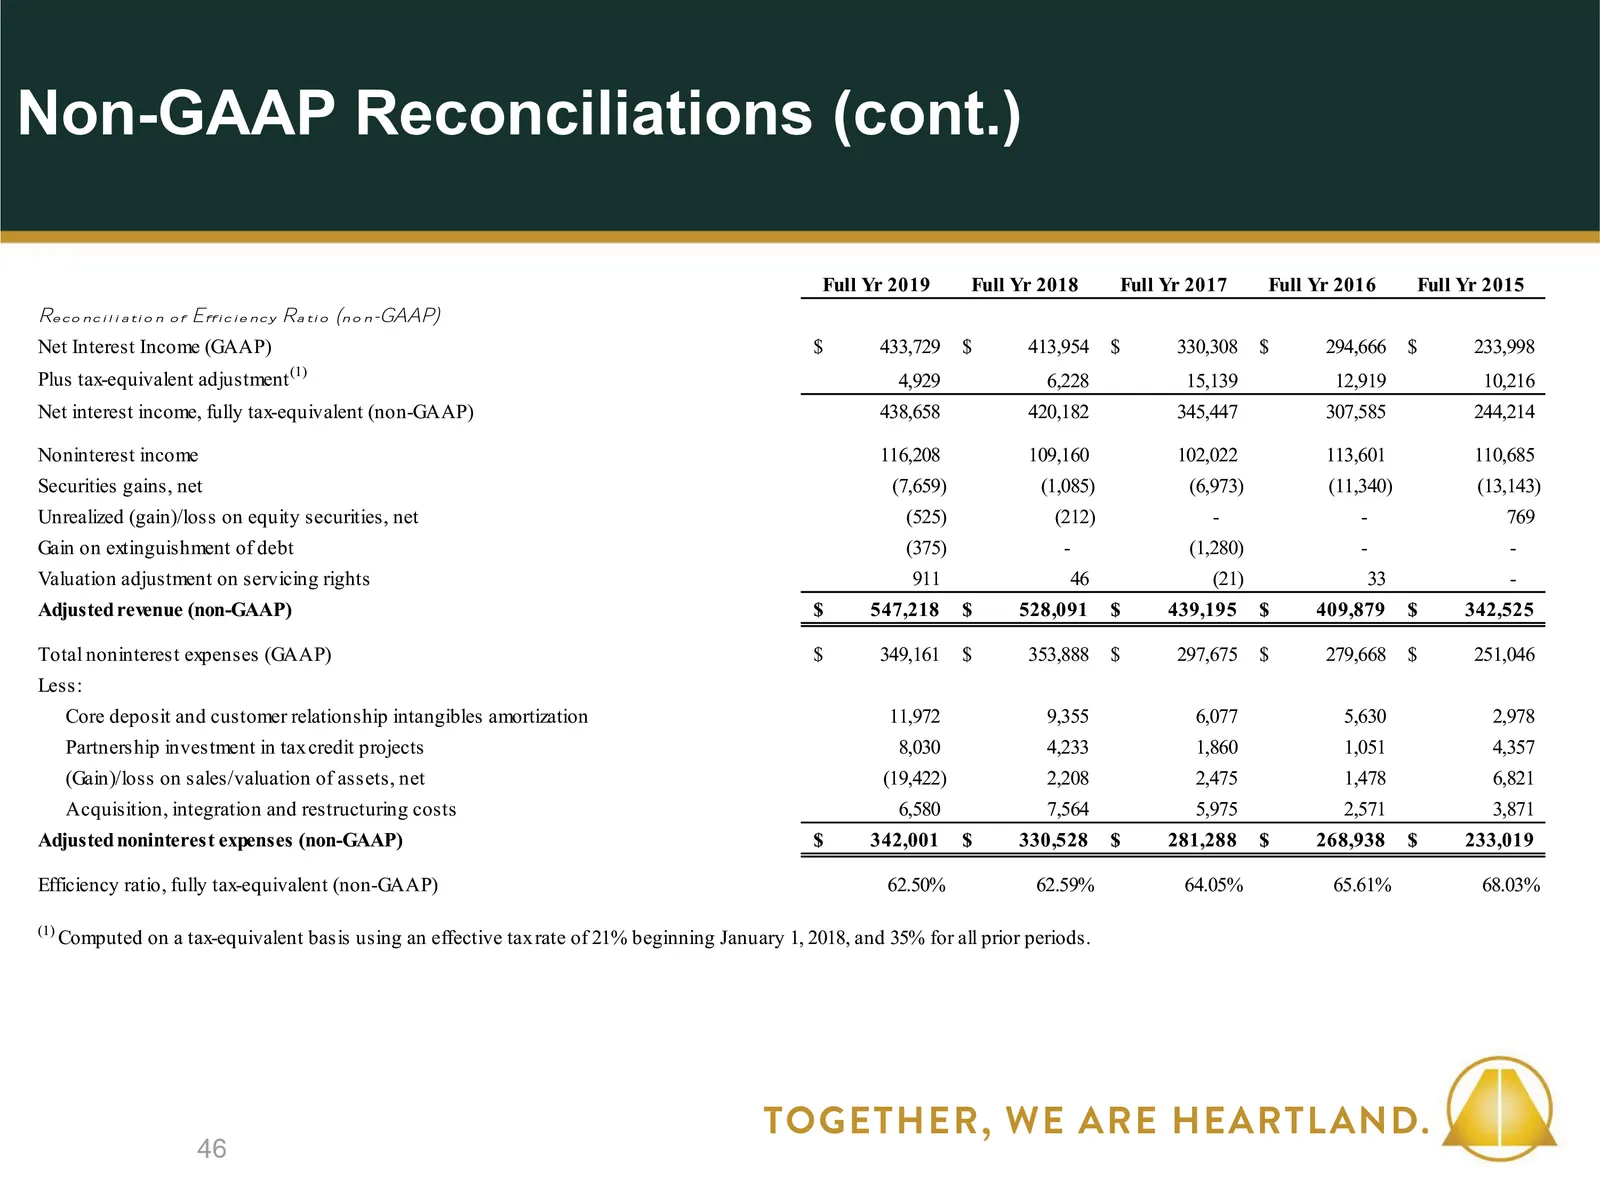
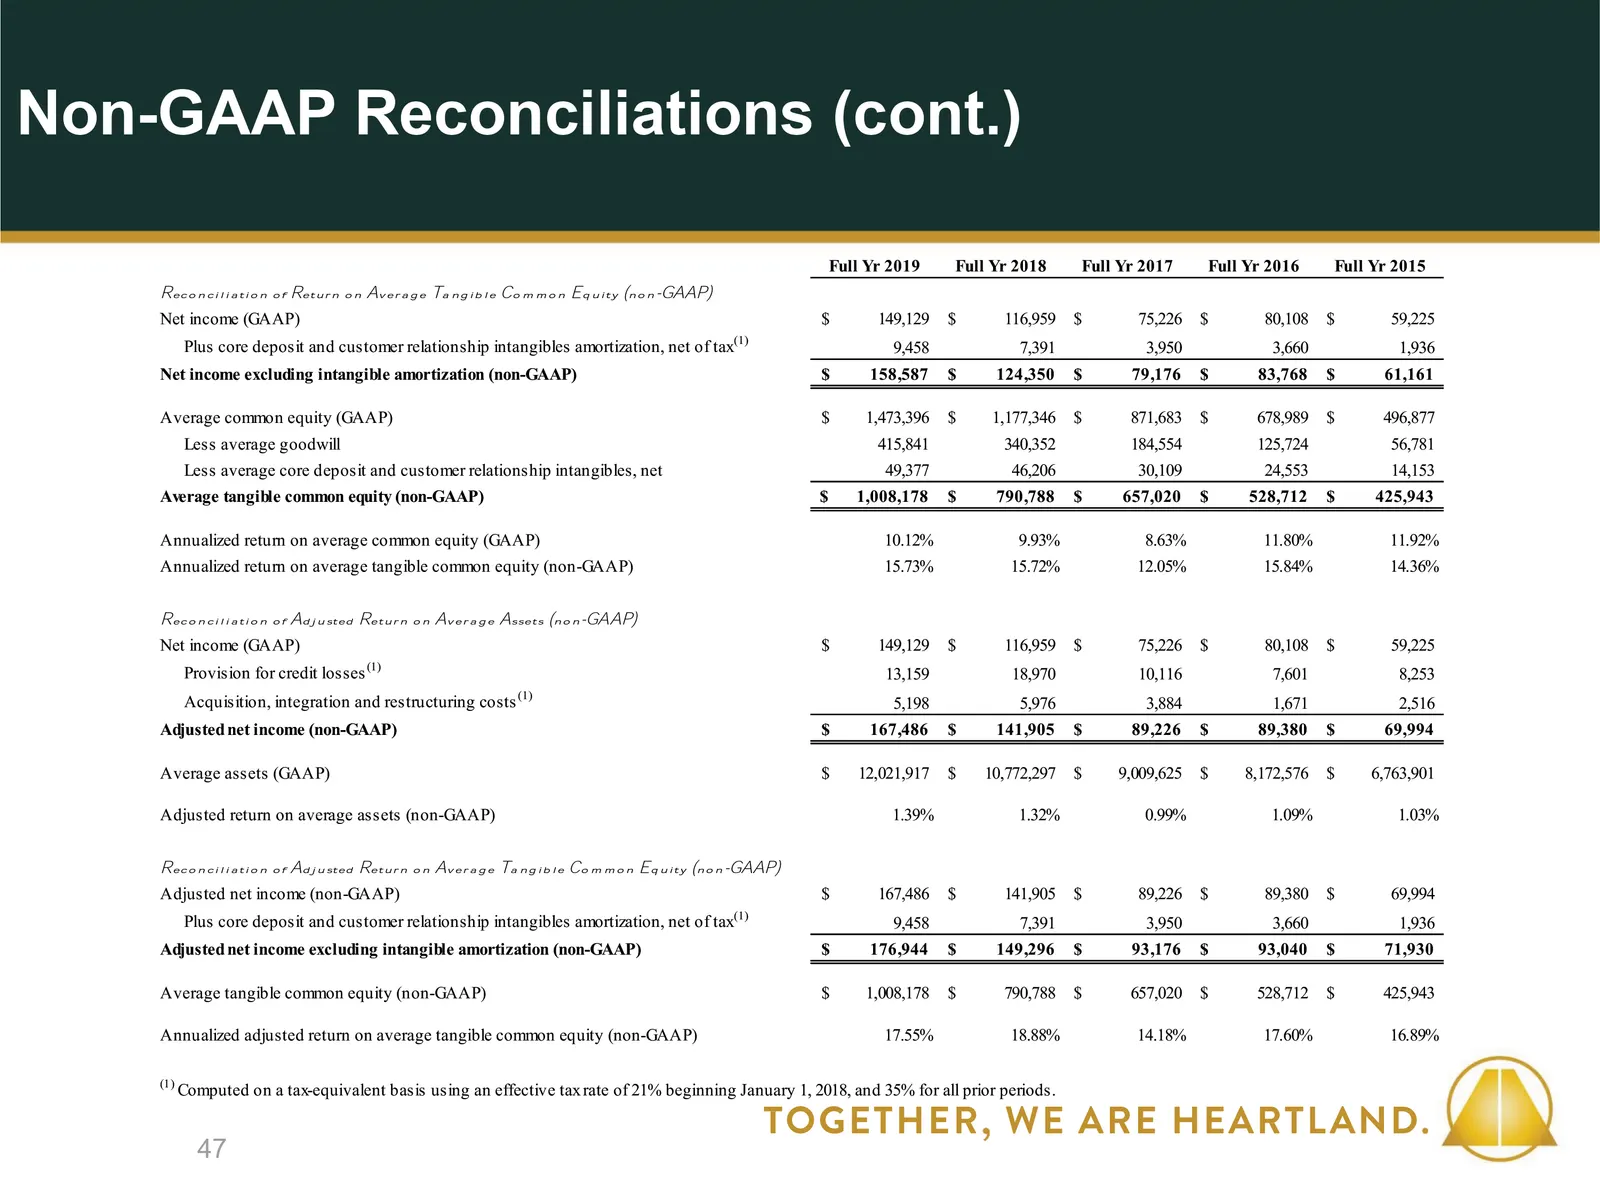
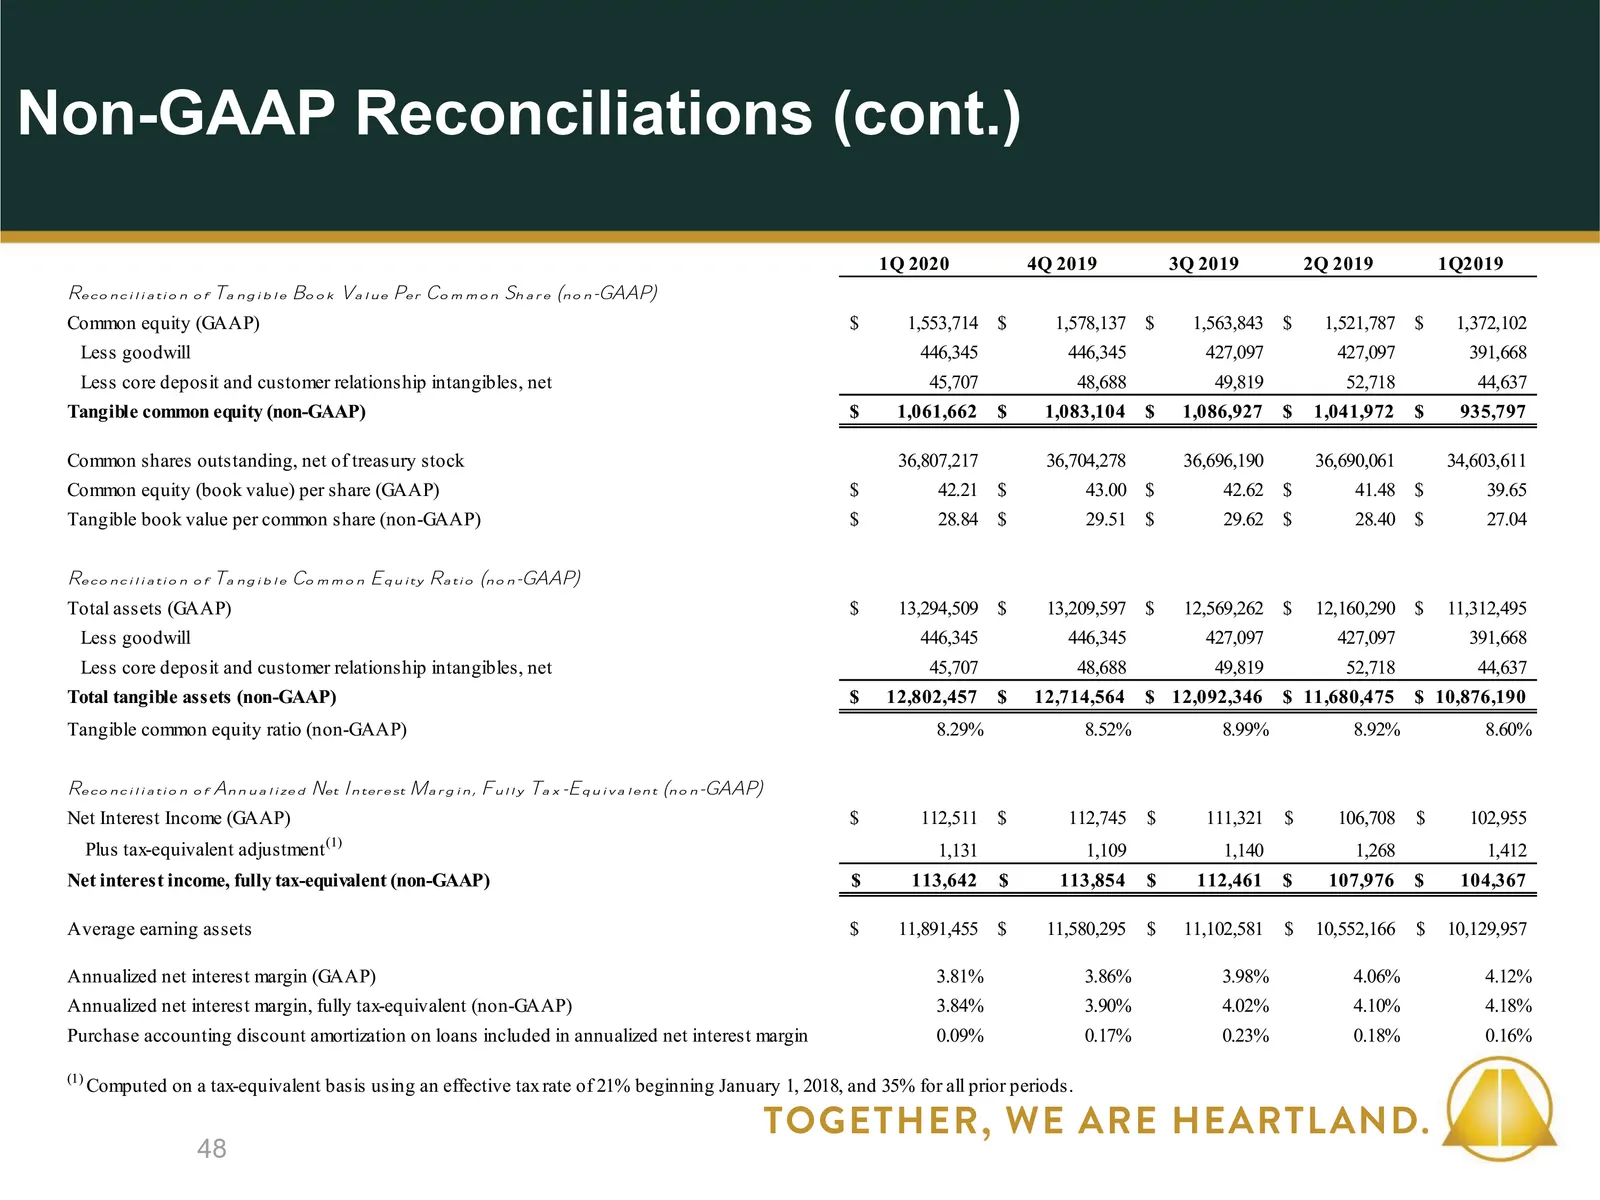
Annualized adjusted return on average assets is net income available to common stockholders plus provision for credit losses and acquisition, integration and restructuring costs, net of tax, divided by average total assets. This measure shows how efficiently a company is utilizing its assets and is
Slide 45: Non-GAAP Reconciliations
45 Non-GAAP Reconciliations
Slide 46: Non-GAAP Reconciliations (cont.)
46 Non-GAAP Reconciliations (cont.)
Slide 47: Non-GAAP Reconciliations (cont.)
47 Non-GAAP Reconciliations (cont.)
Slide 48: Non-GAAP Reconciliations (cont.)
48 Non-GAAP Reconciliations (cont.)
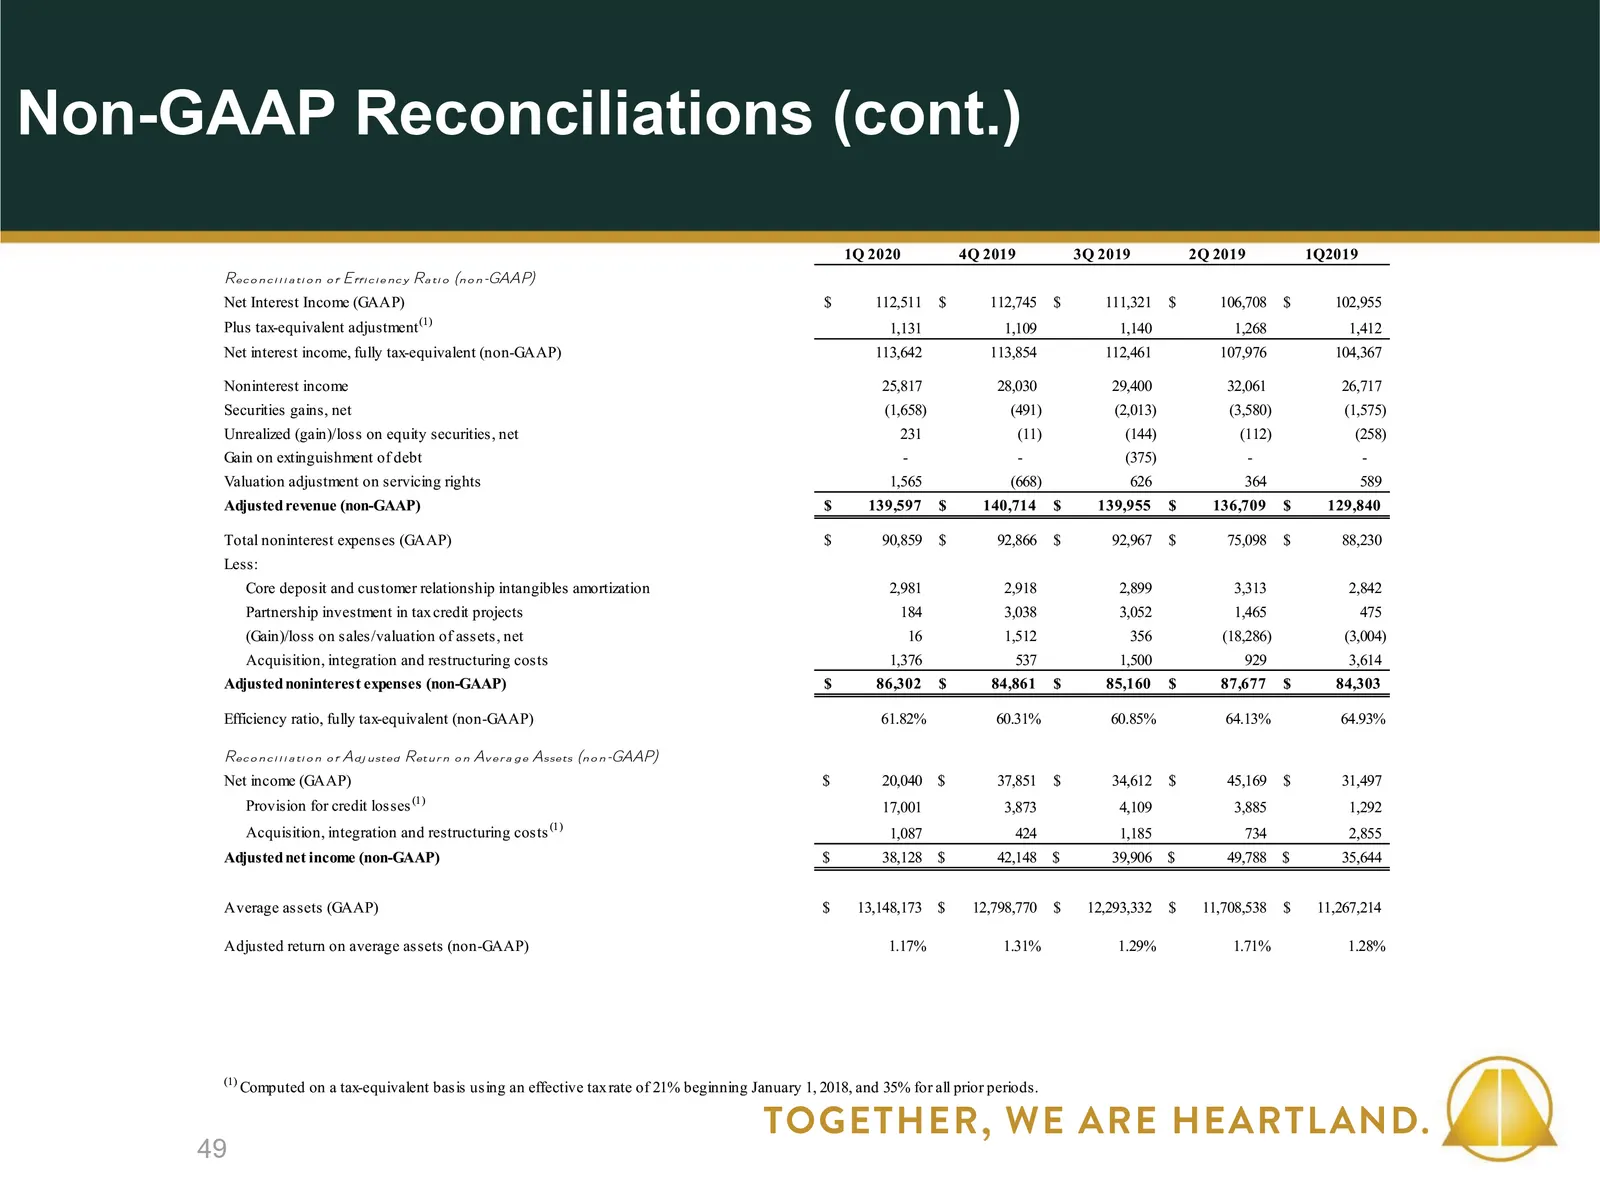
Slide 49: Non-GAAP Reconciliations (cont.)
49 Non-GAAP Reconciliations (cont.)
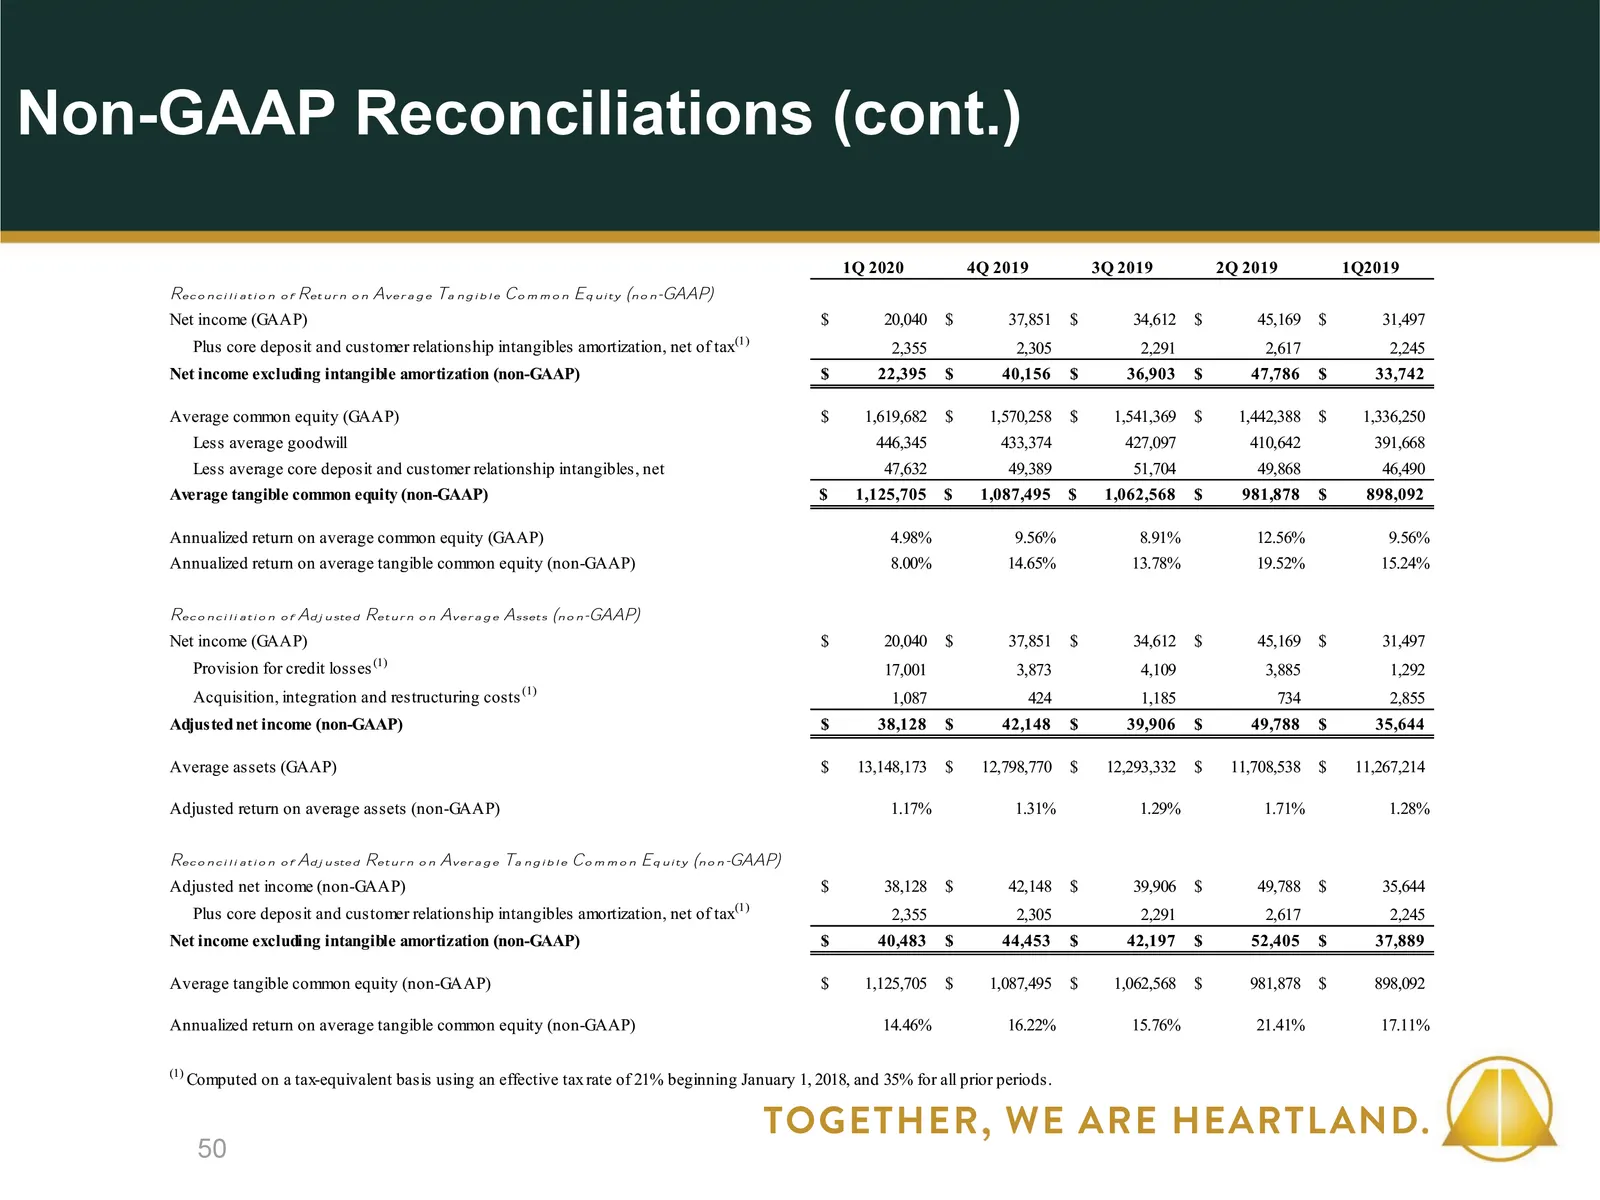
Slide 50: Non-GAAP Reconciliations (cont.)
50 Non-GAAP Reconciliations (cont.)
Source: SEC EDGAR · FWP filed Jun 19, 2020
More decks from Heartland Financial USA Inc
 Merger or Acquisition (July 2024)6 slides · Jul 31, 2024
 Merger or Acquisition (May 2024)6 slides · May 2, 2024
 Merger or Acquisition (May 2024)27 slides · May 2, 2024
 Q4 2023 Earnings Presentation54 slides · Feb 13, 2024
 Q4 2023 Earnings Presentation35 slides · Jan 29, 2024
 Q3 2023 Earnings Presentation55 slides · Nov 15, 2023