PowerSecure International — Investor Presentation (September 2009)
20 slides from PowerSecure International's investor presentation, Sep 9, 2009
Slide 1: September 10, 2009
September 10, 2009
Slide 2: Forward Looking Statements Safe Harbor
Forward Looking Statements Safe Harbor All forward-looking statements made in this presentation are made under the safe harbor provisions of the Private Securities Litigation Reform Act of 1995. Forward-looking statements, which are all statements other than statements of historical facts and includ
Slide 3: Our Business and the Customers We Serve
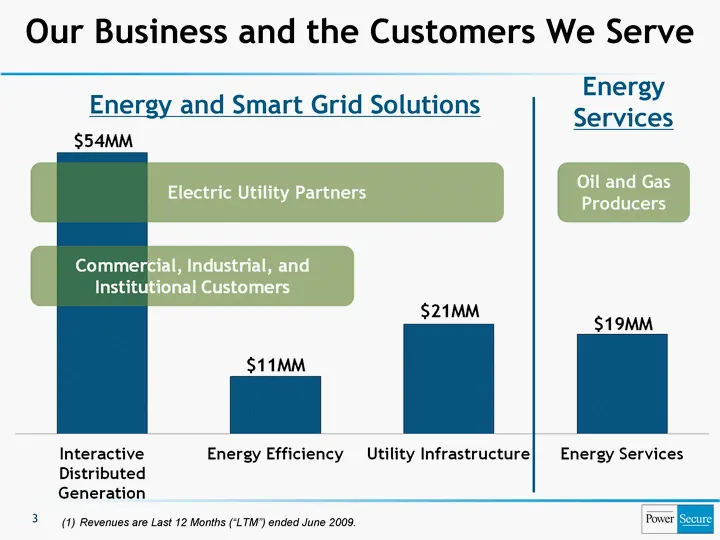
3 Our Business and the Customers We Serve Revenues are Last 12 Months ("LTM") ended June 2009. Oil and Gas Producers Electric Utility Partners Energy and Smart Grid Solutions Energy Services
Slide 4: Our Track Record of Profitable Growth and Strong Execution
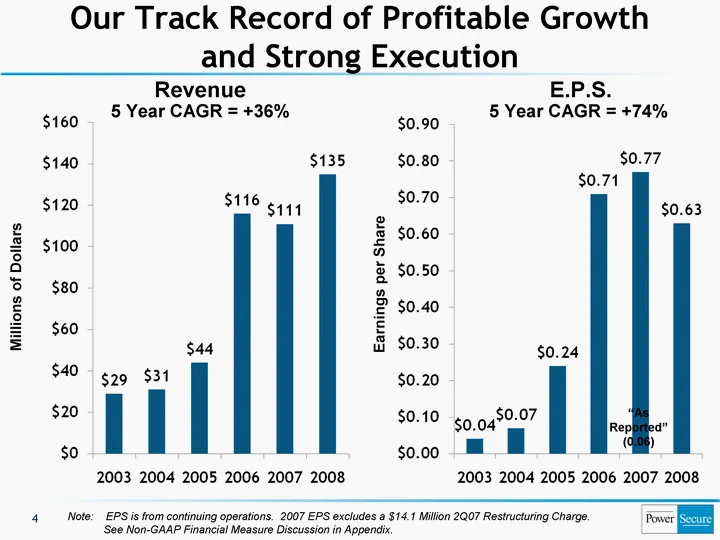
Note: EPS is from continuing operations. 2007 EPS excludes a $14.1 Million 2Q07 Restructuring Charge. See Non-GAAP Financial Measure Discussion in Appendix. 4 Revenue E.P.S. Millions of Dollars Earnings per Share 5 Year CAGR = +36% 5 Year CAGR = +74% Our Track Record of Profitable Growth and Strong
Slide 5: Our Strong Balance Sheet Positions Us Well for the Future
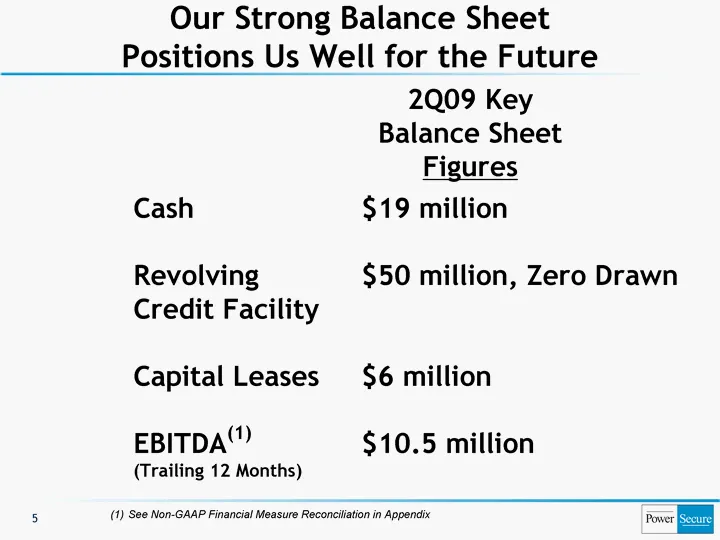
5 Our Strong Balance Sheet Positions Us Well for the Future Cash Revolving Credit Facility Capital Leases EBITDA(1) (Trailing 12 Months) $19 million $50 million, Zero Drawn $6 million $10.5 million See Non-GAAP Financial Measure Reconciliation in Appendix 2Q09 Key Balance Sheet Figures
Slide 6: Interactive Distributed Generation: Smart Grid Efficiencies + Standby Power = ROI
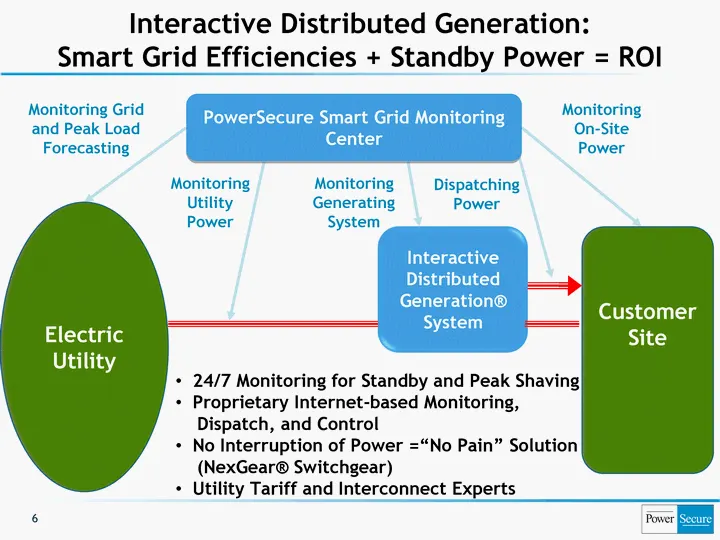
6 Interactive Distributed Generation: Smart Grid Efficiencies + Standby Power = ROI Electric Utility Customer Site PowerSecure Smart Grid Monitoring Center Interactive Distributed Generation(r) System Monitoring Grid and Peak Load Forecasting Monitoring Utility Power Monitoring Generating System Dis
Slide 7: Our Systems Ran 4,000 Times in 1H09 to Deliver Peak Shaving Benefits
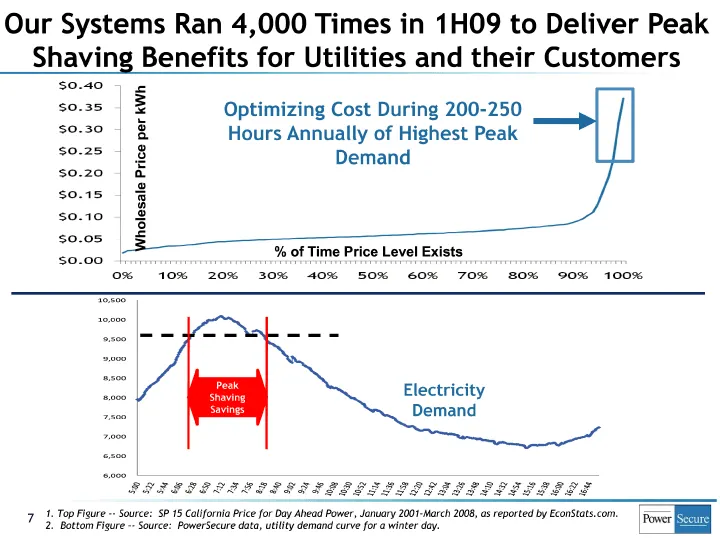
7 Wholesale Price per kWh % of Time Price Level Exists 1. Top Figure -- Source: SP 15 California Price for Day Ahead Power, January 2001-March 2008, as reported by EconStats.com. 2. Bottom Figure -- Source: PowerSecure data, utility demand curve for a winter day. Our Systems Ran 4,000 Times in 1H09
Slide 8: The Lack of Backup Power Costs the U.S. $80 Billion Annually
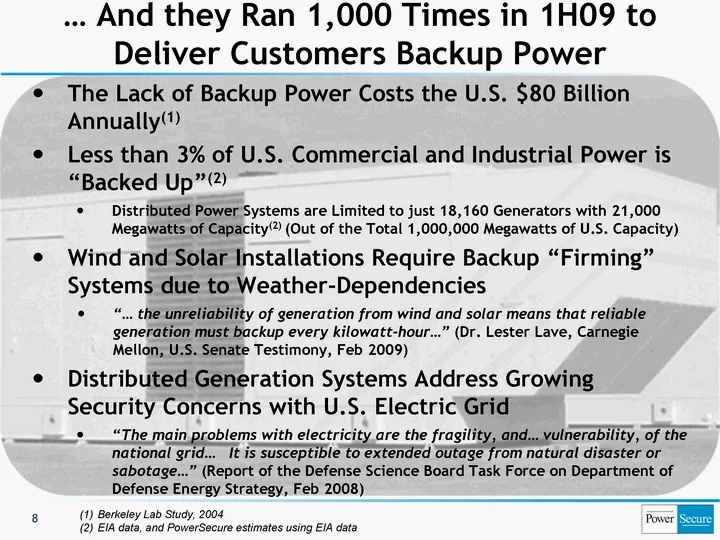
The Lack of Backup Power Costs the U.S. $80 Billion Annually(1) Less than 3% of U.S. Commercial and Industrial Power is "Backed Up"(2) Distributed Power Systems are Limited to just 18,160 Generators with 21,000 Megawatts of Capacity(2) (Out of the Total 1,000,000 Megawatts of U.S. Capacity) Wind and
Slide 9: Recurring Revenue Model
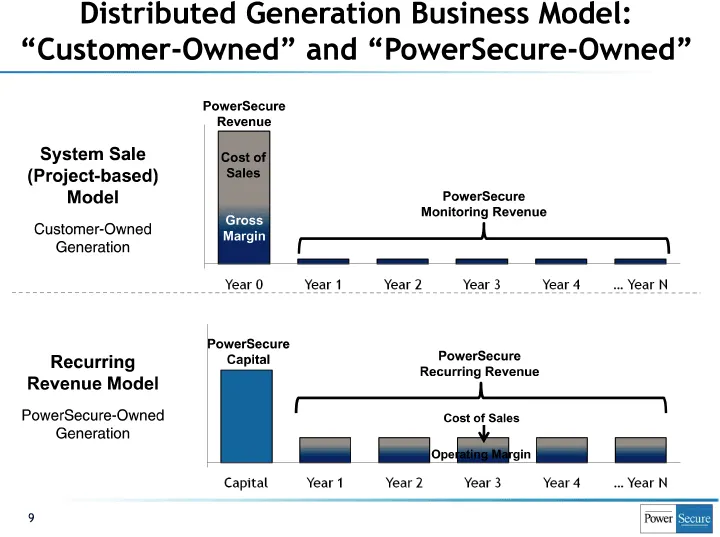
9 Recurring Revenue Model PowerSecure-Owned Generation PowerSecure Monitoring Revenue Distributed Generation Business Model: "Customer-Owned" and "PowerSecure- Owned" System Sale (Project-based) Model Customer-Owned Generation PowerSecure Recurring Revenue PowerSecure Revenue Cost of Sales Gross Mar
Slide 10: Utility Infrastructure: An Extension of our Core Competencies and Utility Relationships
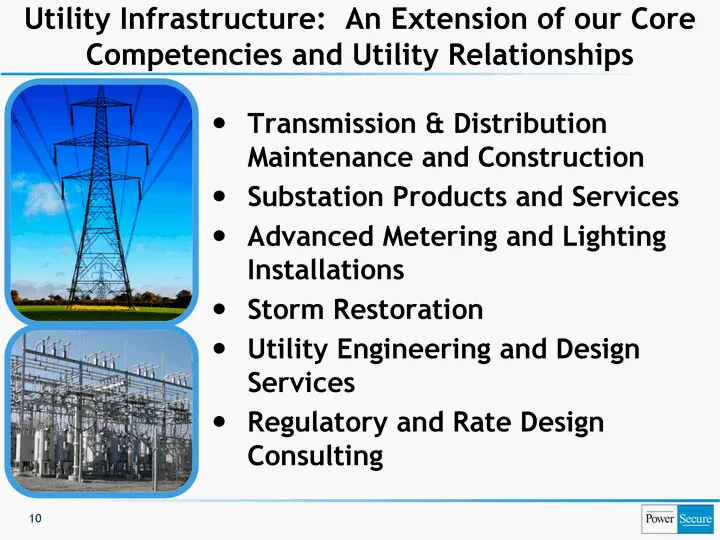
Utility Infrastructure: An Extension of our Core Competencies and Utility Relationships 10 10 Transmission & Distribution Maintenance and Construction Substation Products and Services Advanced Metering and Lighting Installations Storm Restoration Utility Engineering and Design Services Regulatory an
Slide 11: Utility Infrastructure: Business Progression and Growth
Utility Infrastructure: Business Progression and Growth 11 Our Utility Infrastructure Investment and Progression 2005 - Launched Utility Engineering Business (Hired Leading Utility Engineering Executive to Lead Engineering Team) 2006 - Initiated Larger Scale Infrastructure Projects for Utility Partn
Slide 12: Energy Efficiency: EfficientLights Extends our National Account Relationships
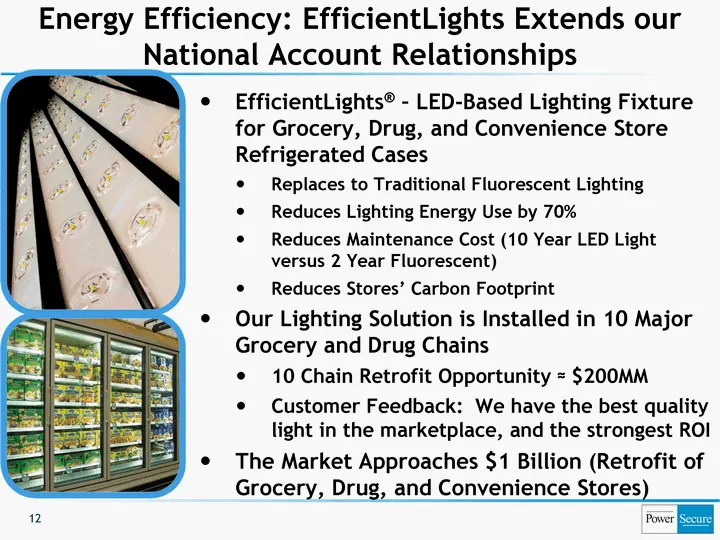
Energy Efficiency: EfficientLights Extends our National Account Relationships 12 EfficientLights(r) - LED-Based Lighting Fixture for Grocery, Drug, and Convenience Store Refrigerated Cases Replaces to Traditional Fluorescent Lighting Reduces Lighting Energy Use by 70% Reduces Maintenance Cost (10 Ye
Slide 13: EfficientLights: Business Progression and Growth
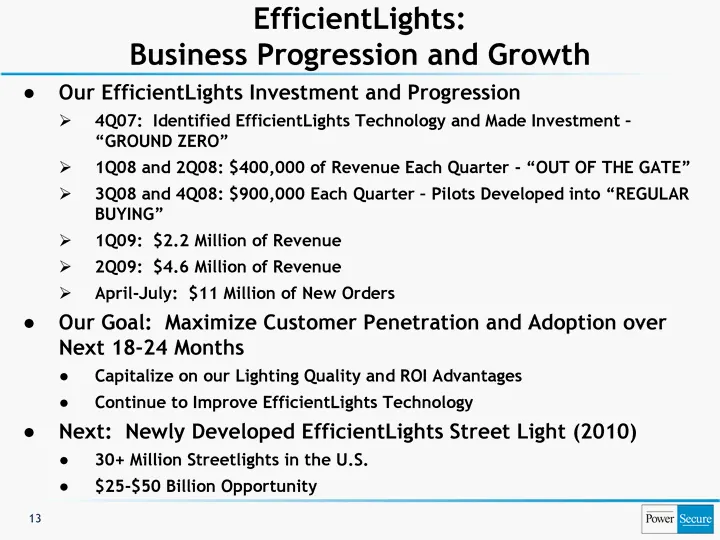
EfficientLights: Business Progression and Growth 13 Our EfficientLights Investment and Progression 4Q07: Identified EfficientLights Technology and Made Investment - "GROUND ZERO" 1Q08 and 2Q08: $400,000 of Revenue Each Quarter - "OUT OF THE GATE" 3Q08 and 4Q08: $900,000 Each Quarter - Pilots Develop
Slide 14: Our Growth and Diversification Strategies are Succeeding
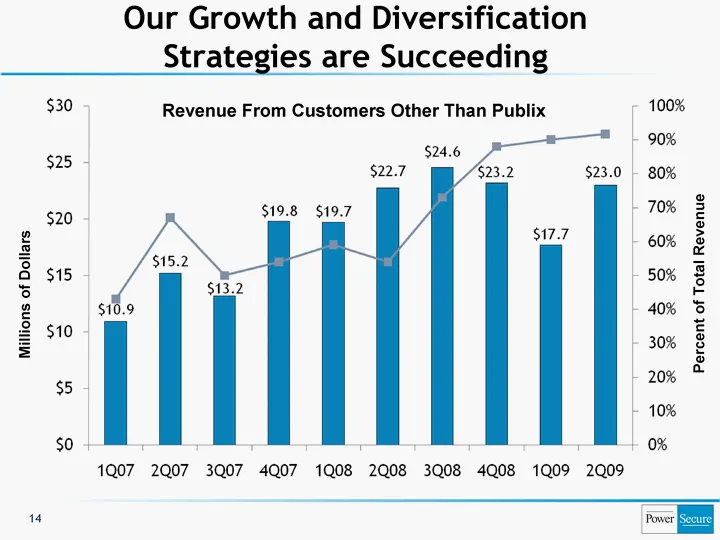
14 Revenue From Customers Other Than Publix Millions of Dollars Our Growth and Diversification Strategies are Succeeding Percent of Total Revenue
Slide 15: As Our Energy Solutions Deliver Value to a Growing List of Utility Partners and Customers
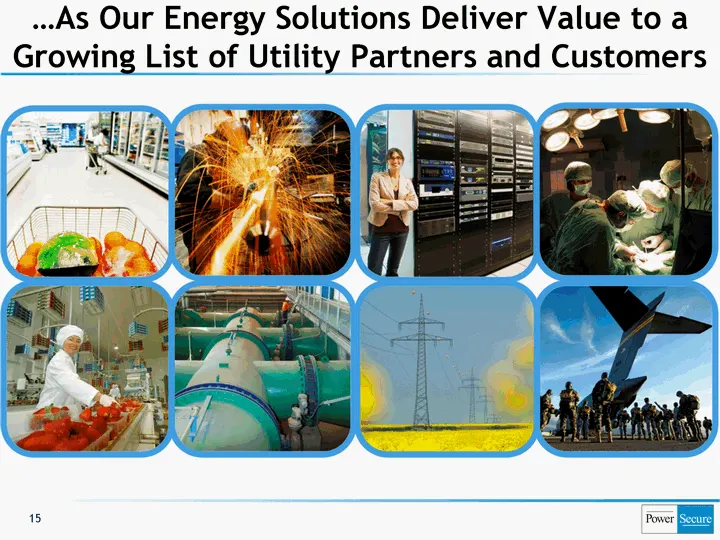
15 ....As Our Energy Solutions Deliver Value to a Growing List of Utility Partners and Customers
Slide 16: Questions?
NSADAQ: POWR (919) 556 3056 www.PowerSecure.com 16 Questions?
Slide 17: Appendix (Non-GAAP Measures)
Appendix (Non-GAAP Measures) 17
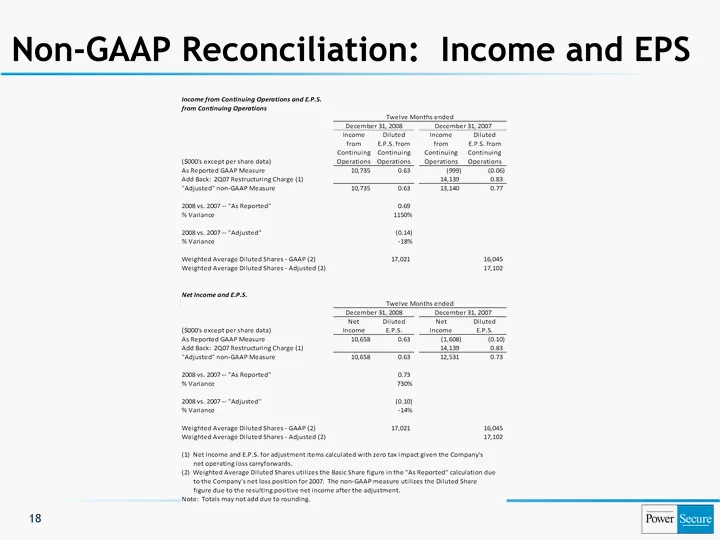
Slide 18: Non-GAAP Reconciliation: Income and EPS
Non-GAAP Reconciliation: Income and EPS 18
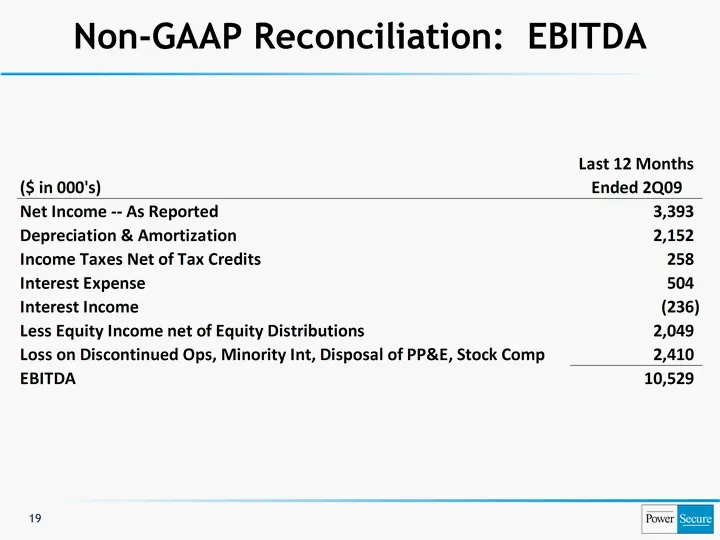
Slide 19: Non-GAAP Reconciliation: EBITDA
Non-GAAP Reconciliation: EBITDA 19
Slide 20: Non-GAAP Financial Measures Discussion
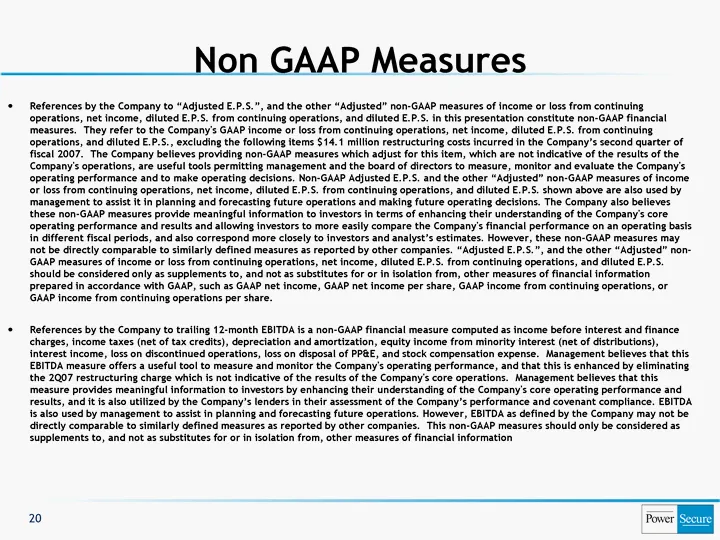
References by the Company to "Adjusted E.P.S.", and the other "Adjusted" non-GAAP measures of income or loss from continuing operations, net income, diluted E.P.S. from continuing operations, and diluted E.P.S. in this presentation constitute non-GAAP financial measures. They refer to the Company's
Source: SEC EDGAR · 8-K filed Sep 9, 2009
More decks from PowerSecure International Inc
 Investor Presentation (January 2016)19 slides · Jan 13, 2016
 Q3 2015 Earnings Presentation19 slides · Nov 9, 2015
 Investor Presentation (September 2015)19 slides · Sep 2, 2015
 Investor Presentation (August 2015)16 slides · Aug 10, 2015
 Investor Presentation (May 2015)21 slides · May 26, 2015
 Investor Presentation (May 2015)18 slides · May 6, 2015