Consumers Energy Company · NYSE:CMS/PB
Consumers Energy — Credit Suisse Energy Summit 2013
20 slides from Consumers Energy's conference presentation, Feb 4, 2013
Slide 1: Credit Suisse Energy Summit February 5, 2013
2013 Credit Suisse Energy Summit February 5, 2013 Cross Winds_ Energy Park Smart Energy Program Gas Combined Cycle Plant
Slide 2: Forward-looking statements
This presentation is made as of the date hereof and contains “forward-looking statements” as defined in Rule 3b-6 of the Securities Exchange Act of 1934, as amended, Rule 175 of the Securities Act of 1933, as amended, and relevant legal decisions. The forward-looking statements are subject to risks
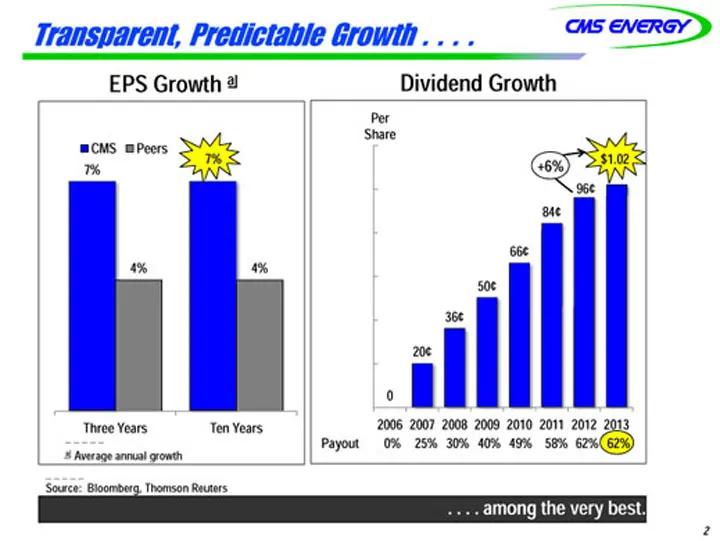
Slide 3: Transparent, Predictable Growth
Transparent, Predictable Growth . . . . Di id G th a d G th Per Share EPS Growth Dividend Growth % CMS Peers 84¢ 96¢ 7% +6% $ 1.02 7% 50¢ 66¢ 4% 4% 20¢ 36¢ 0 2006 2007 2008 2009 2010 2011 2012 2013 a Average annual growth Payout 0% 25% 30% 40% 49% 58% 62% 62% Three Years Ten Years . . . . among the
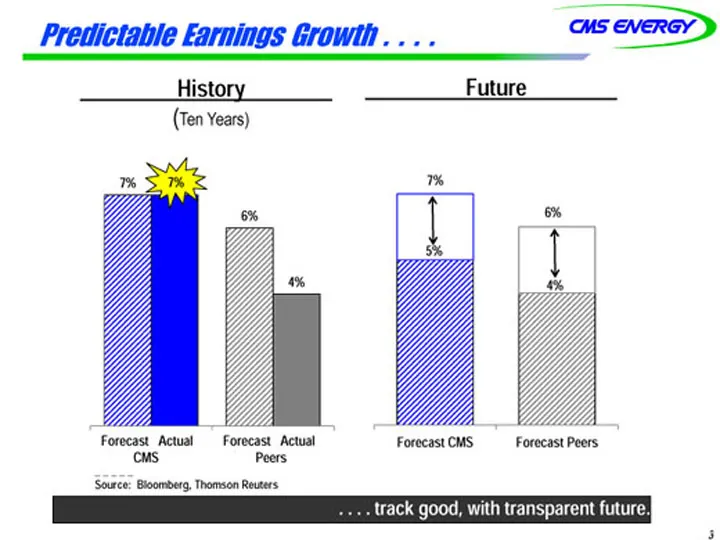
Slide 4: Predictable Earnings Growth
Predictable Earnings Growth . . . . History (Ten Years) Future 7% 6% 7% 6% 7% 4% 5% 4% ForecFaosrte c Aascttual Actual Forecast CMS Forecast Peers CMS Forecast Actual Peers . . . . track good, with transparent future. 3 Source: Bloomberg, Thomson Reuters
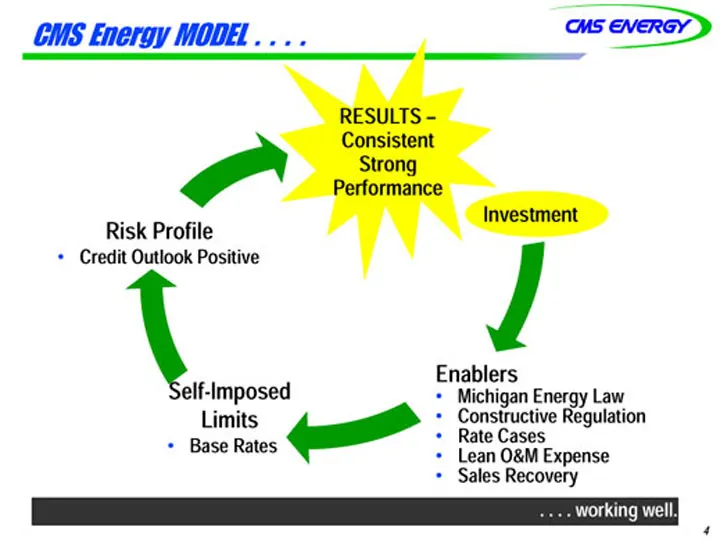
Slide 5: CMS Energy Model Results
CMS Energy MODEL . . . . RESULTS – Consistent Investment Risk Profile Strong Performance • Credit Outlook Positive Enablers S lfI d • Michigan Energy Law • Constructive Regulation • Rate Cases • Lean O&M Expense Self-Imposed Limits • Base Rates • Sales Recovery . . . . working well. 4
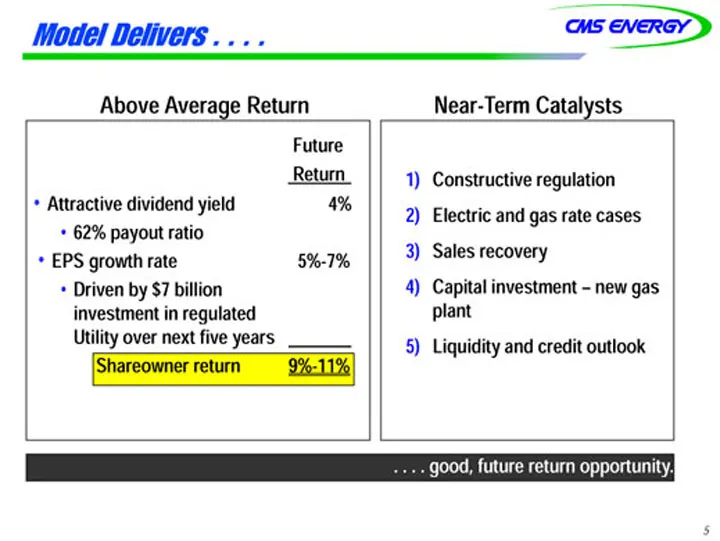
Slide 6: Model Delivers Above Average Return
Model Delivers . . . . Above Average Return Near-Term Catalysts Future 1) Constructive regulation 2) Electric and gas rate cases Return • Attractive dividend yield 4% • 62% payout ratio 3) Sales recovery 4) Capital investment – new gas plant • EPS growth rate 5%-7% • Driven by $7 billion i t t i ltd
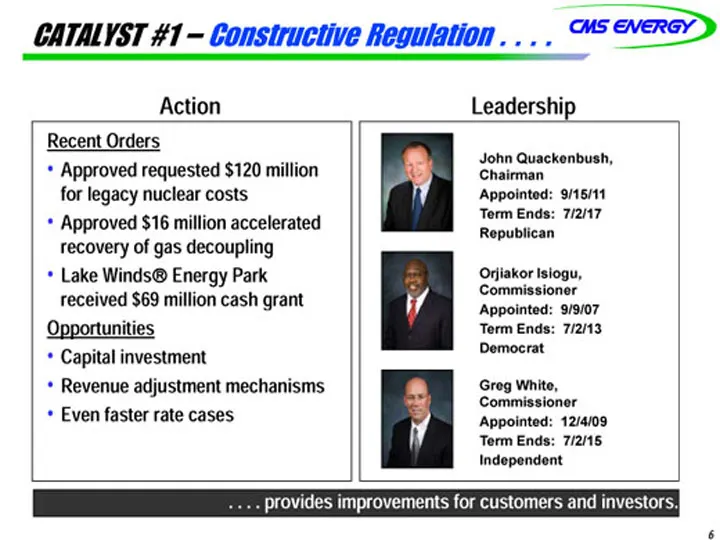
Slide 7: Catalyst #1 – Constructive Regulation
CATALYST #1 – Constructive Regulation . . . . Recent Orders Leadership J h Q k b h Action • Approved requested $120 million for legacy nuclear costs • Approved $16 million accelerated John Quackenbush, Chairman Appointed: 9/15/11 Term Ends: 7/2/17 Republican pp recovery of gas decoupling • Lake Wind
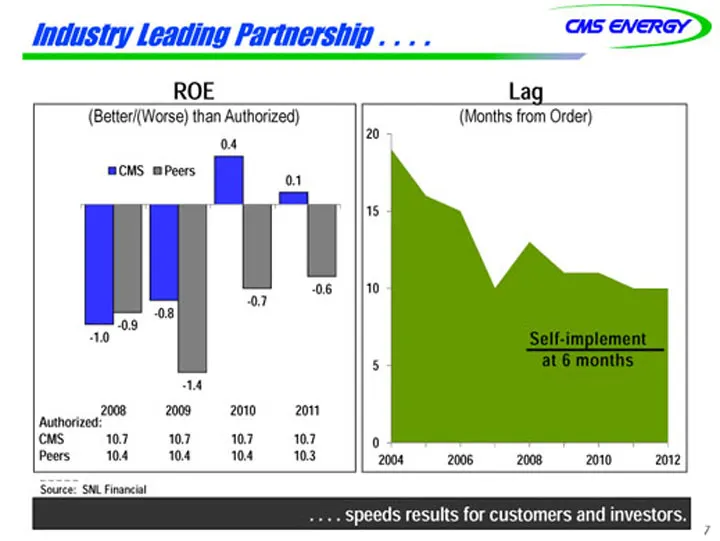
Slide 8: Leading Partnership
Industry Leading Partnership . . . . 0.4 ROE (Better/(Worse) than Authorized) Lag (Months from Order) 20 CMS Peers 0.1 15 -0.7 -0.6 10 -1.0 -0.8 -0.9 1 4 5 Self-implement at 6 months -1.4 2008 2009 2010 2011 Authorized: CMS 10.7 10.7 10.7 10.7 Peers 10.4 10.4 10.4 10.3 0 2004 2006 2008 2010 2012 . .
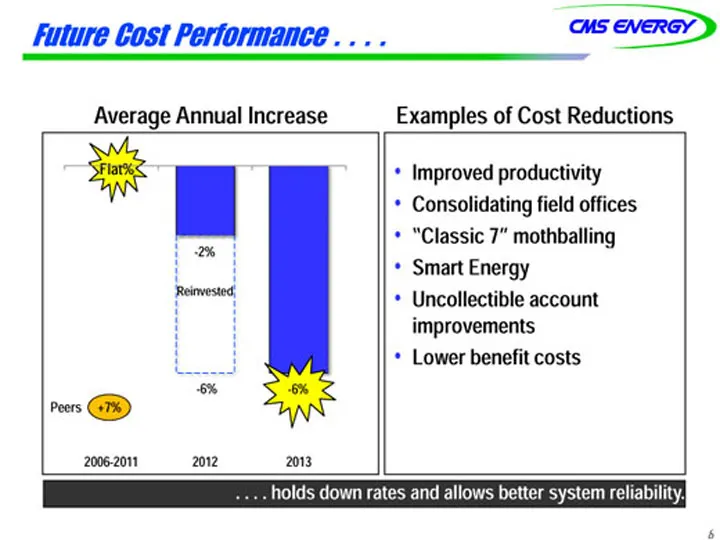
Slide 9: Cost Performance
Future Cost Performance . . . . Average Annual Increase Examples of Cost Reductions • Improved productivity • Consolidating field offices • “Classic 7” mothballing Flat% • Smart Energy • Uncollectible account -2% Reinvested improvements • Lower benefit costs -6% -66%% 2006-2011 2012 2013 -6% Peers +
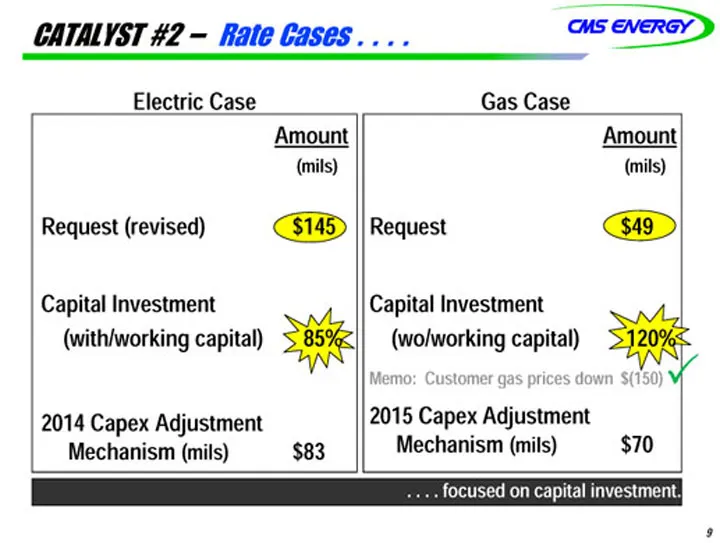
Slide 10: Catalyst #2 – Rate Cases
CATALYST #2 – Rate Cases . . . . Electric Case Amount Gas Case Amount (mils) Request (revised) $145 (mils) Request $49 Capital Investment Capital Investment (with/working capital) 85% 0 (wo/working capital) 120% Memo: Customer gas prices down $( 150)? 2014 Capex Adjustment Mechanism ( mils) $ 83 e o
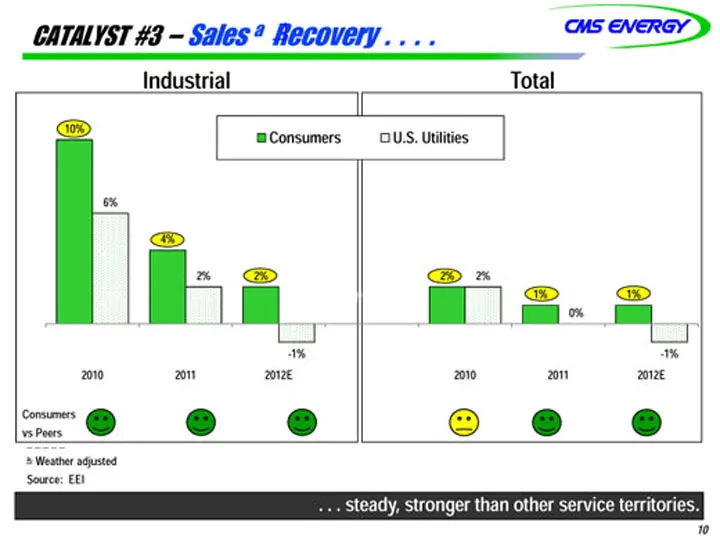
Slide 11: Catalyst #3 – Sales Recovery
CATALYST #3 – Sales a Recovery . . . . Industrial Total 10% Consumers U.S. Utilities 6% 4% 2% 2% 1% 1% 2% 2% -1% 0% -1% 2010 2011 2012E 2010 2011 2012E a Weather adj sted Consumers vs Peers . . . steady, stronger than other service territories. adjusted Source: EEI 10
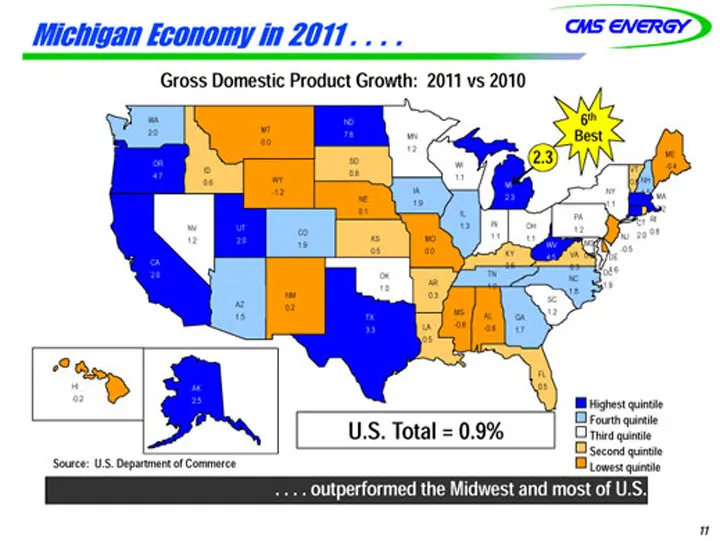
Slide 12: Michigan Economy in 2011
Michigan Economy in 2011 . . . . Gross Domestic Product Growth: 2011 vs 2010 2 3 WA 2.0 MT 0.0 ND 7.6 MN 1.2 ME 6th Best 2.3 OR 4.7 NV ID 0.6 WY -1.2 UT CO SD 0.8 NE 0.1 IA 1.9 WI 1.1 IL 1.3 MI 2.3 IN OH PA 1 2 NY 1.1 CT RI 0 8 NH 1.5 VT 0.5 MA 2.2 -0.4 CA 2.0 1.2 2.0 AZ NM 0 2 1.9 KS 0.5 OK 1.0 MO
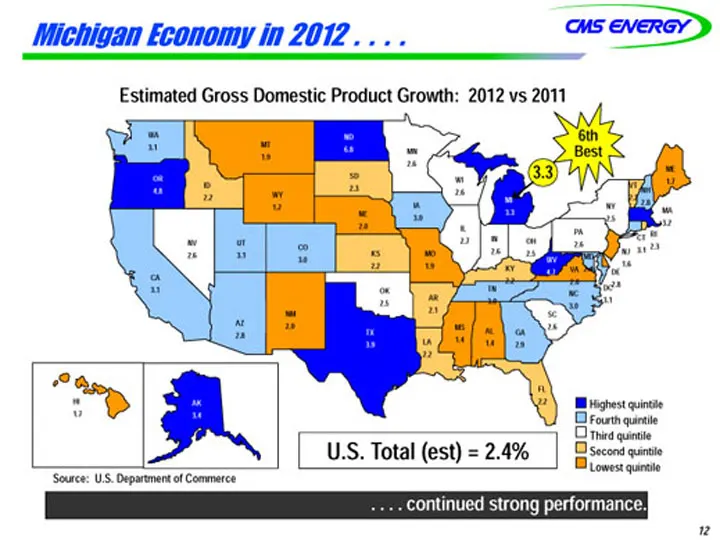
Slide 13: Michigan Economy in 2012
Michigan Economy in 2012 . . . . Estimated Gross Domestic Product Growth: 2012 vs 2011 WA 3.1 MT ND 6.8 MN 6th Best 3.3 OR 4.8 1.9 ID 2.2 WY 1.2 SD 2.3 NE 2.0 2.6 IA 3.0 WI 2.6 IL MI 3.3 PA NY 2.5 NH 2.8 MA 3.2 ME VT 1.7 2.2 CA 3.1 NV 2.6 UT 3.1 CO 3.0 KS 2.2 OK 2.5 MO 1.9 AR 2.7 TN 3.0 IN 2.6 OH 2.
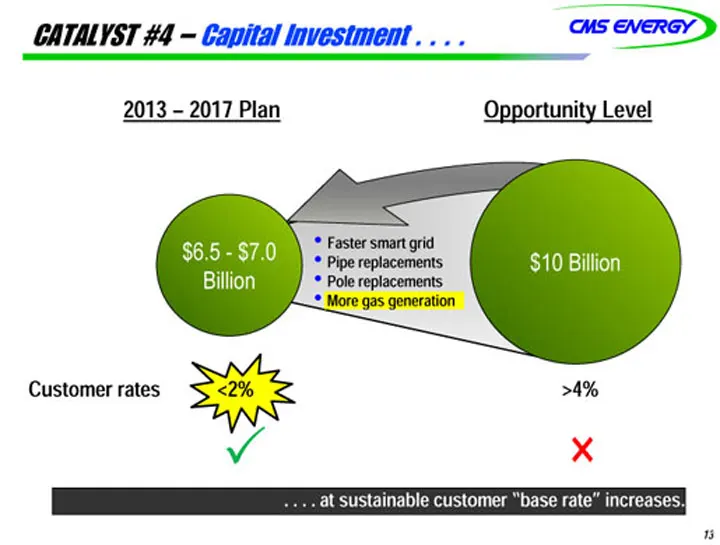
Slide 14: Catalyst #4 – Capital Investment
CATALYST #4 – Capital Investment . . . . 2013 – 2017 Plan Opportunity Level $6.5—$7.0 Billion $10 Billion • Faster smart grid • Pipe replacements • Pole replacements • More gas generation Customer rates <2% >4% g g ? × . . . . at sustainable customer “base rate” increases. 13
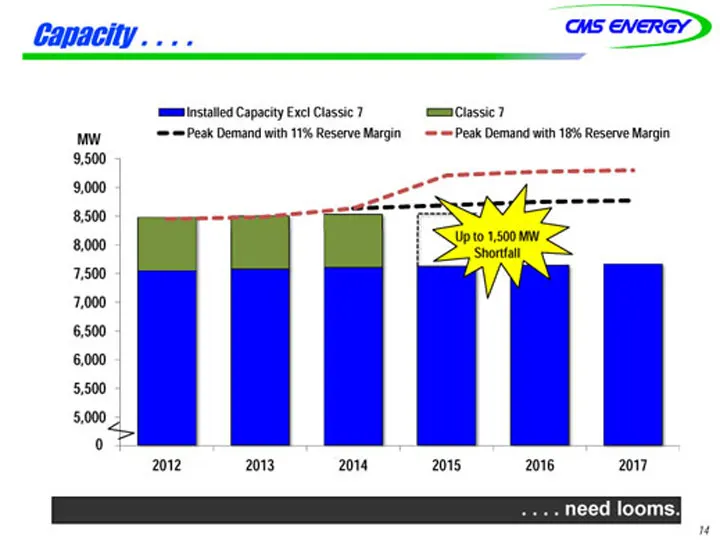
Slide 15: Capacity
Capacity . .. . . 9 500 Installed Capacity Excl Classic 7 Classic 7 Peak Demand with 11% Reserve Margin MW Peak Demand with 18% Reserve Margin 8,500 9,000 9,500 7,000 7,500 8,000 Up to 1,500 MW Shortfall 5 500 6,000 6,500 4,500 5,000 5,500 2012 2013 2014 2015 2016 2017 0 . . . . need looms. 14
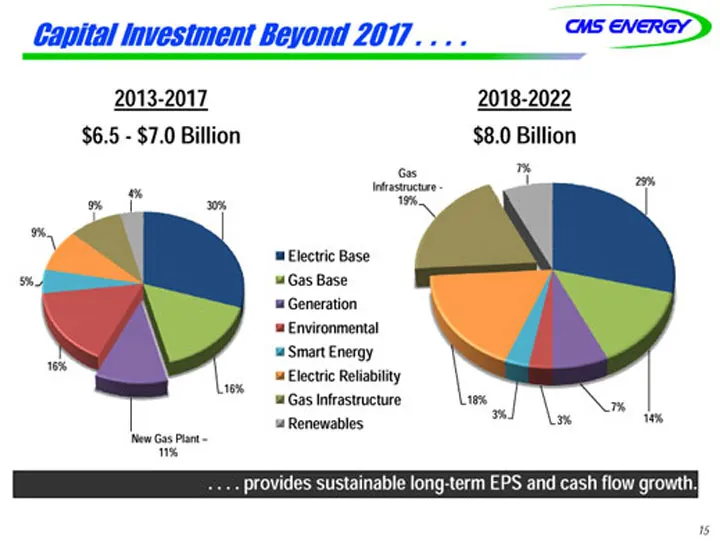
Slide 16: Capital Investment Beyond 2017
Capital Investment Beyond 2017 . . . . 2013-2017 $6.5—$7.0 Billion 2018-2022 $8.0 Billion 30% 9% 9% 4% Gas 29% Infrastructure—19% 7% 5% Electric Base Gas Base Generation 16% Environmental Smart Energy Electric Reliability 16% New Gas Plant – 11% y Gas Infrastructure Renewables 14% 7% 3% 3% 18% . . .
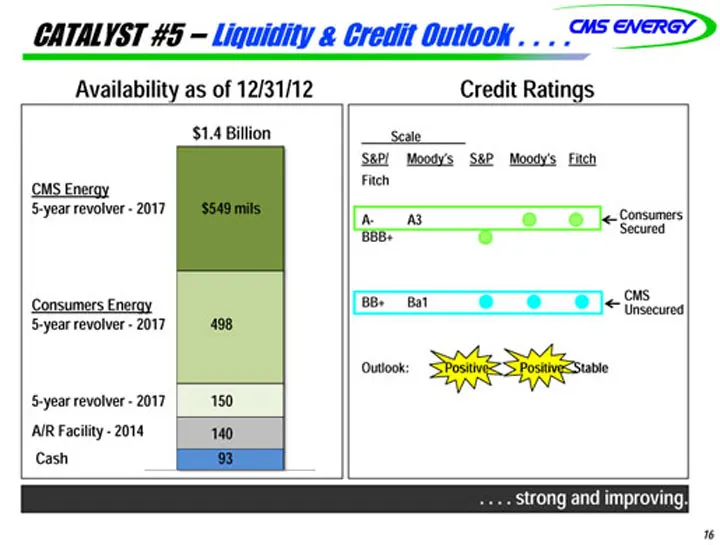
Slide 17: Catalyst #5 – Liquidity & Credit Outlook
CATALYST #5 – Liquidity & Credit Outlook . . . . Credit Ratings $1.4 Billion Scale S&P/ M d ‘ S&P M d ‘ Fit h Availability as of 12/31/12 CMS Energy 5-year revolver—2017 $549 mils Consumers Secured Moody’s Moody’s Fitch Fitch A- A3A3 BBB Consumers Energy CMS Unsecured BBB+ BB+ Ba1 5-year revolver—20
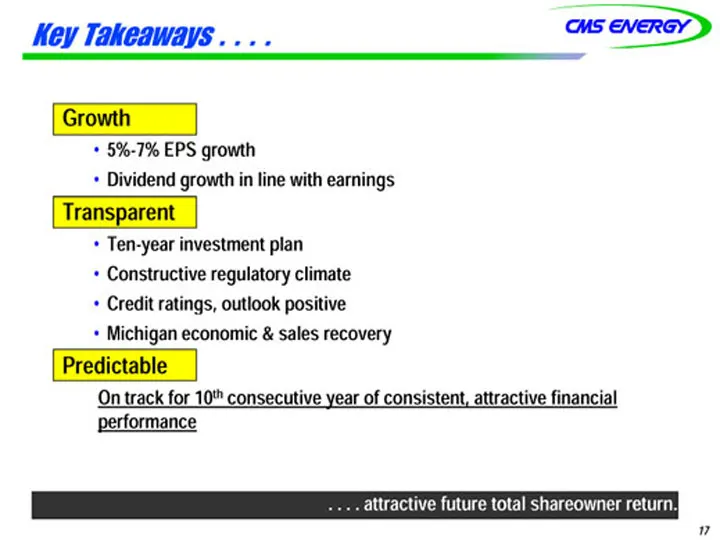
Slide 18: Key Takeaways
Key Takeaways . . . . Growth • 5%-7% EPS growth • Dividend growth in line with earnings Transparent • Ten-year investment plan • Constructive regulatory climate • Credit ratings, outlook positive • Michigan economic & sales recovery Predictable On track for 10th consecutive year of consistent, attra
Slide 19: Appendix
APPENDIX 1%
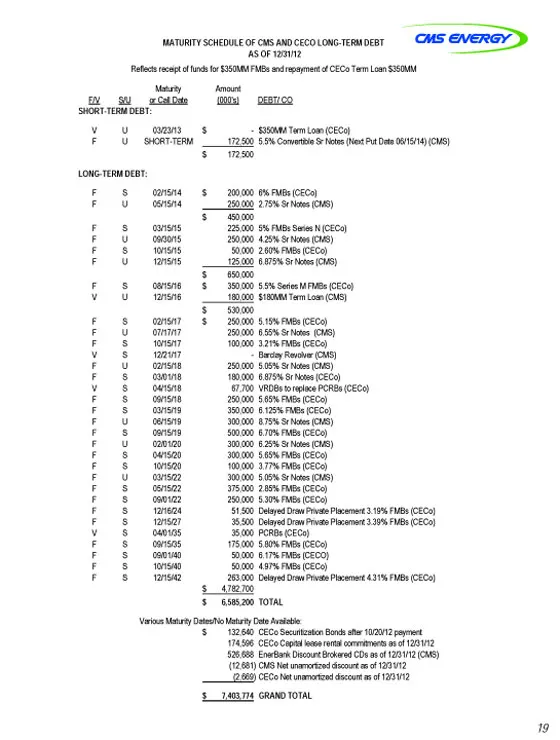
Slide 20: Debt maturity schedule
S L M F/V S/U or C SHORT-TERM DEBT: V U 03 F U SHO LONG-TERM DEBT: F S 02 F U 05 F S 03 F U 09 F S 10 F U 12 F S 08 V U 12 F S 02 F U 07 F S 10 V S 12 F U 02 F S 03 V S 04 F S 09 F S 03 F U 06 F S 09 F U 02 F S 04 F S 10 F U 03 F S 05 F S 09 F S 12 F S 12 V S 04 F S 09 F S 09 F S 10 F S 12 Variou Re
Source: SEC EDGAR · 8-K filed Feb 4, 2013
More decks from Consumers Energy Company
 FY2024 Earnings Presentation33 slides · Feb 6, 2025
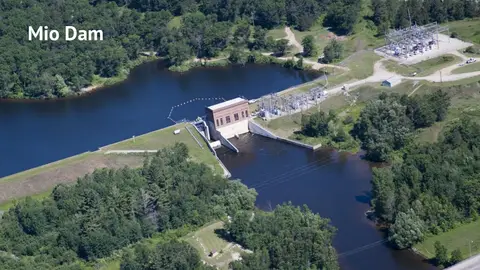 Technical Presentation (August 2024)8 slides · August 2024
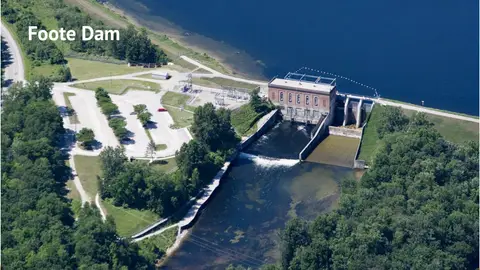 Technical Presentation (August 2024)8 slides · August 2024
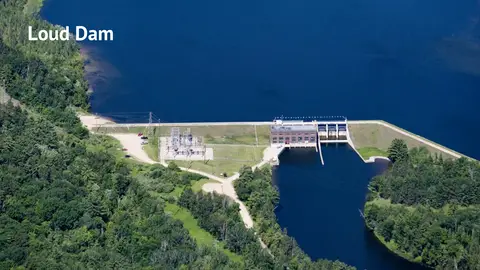 Corporate Update (August 2024)8 slides · August 2024
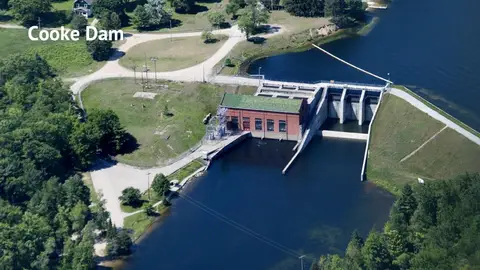 Corporate Update (August 2024)8 slides · August 2024
 Corporate Update (September 2023)22 slides · Sep 28, 2023