Massey Energy — Howard Weil Energy Conference 2008
51 slides from Massey Energy's conference presentation, Apr 7, 2008
Slide 1: Howard Weil Energy Conference
Howard Weil Energy Conference April 7, 2008

Slide 2: Don Blankenship, Chairman, President and CEO
Don Blankenship Chairman, President and CEO
Slide 3: Safe Harbor Statement
Safe Harbor Statement FORWARD-LOOKING STATEMENTS: certain statements in this presentation are forward-looking as defined by the Private Securities Litigation Reform Act of 1995. Due to known and unknown risks, the company’s actual results may differ materially from its expectations or projections. F
Slide 4: 2007 - A Record Year
alps Massey Energy. 2007 - A Record Year
Slide 5: 2007 Highlights
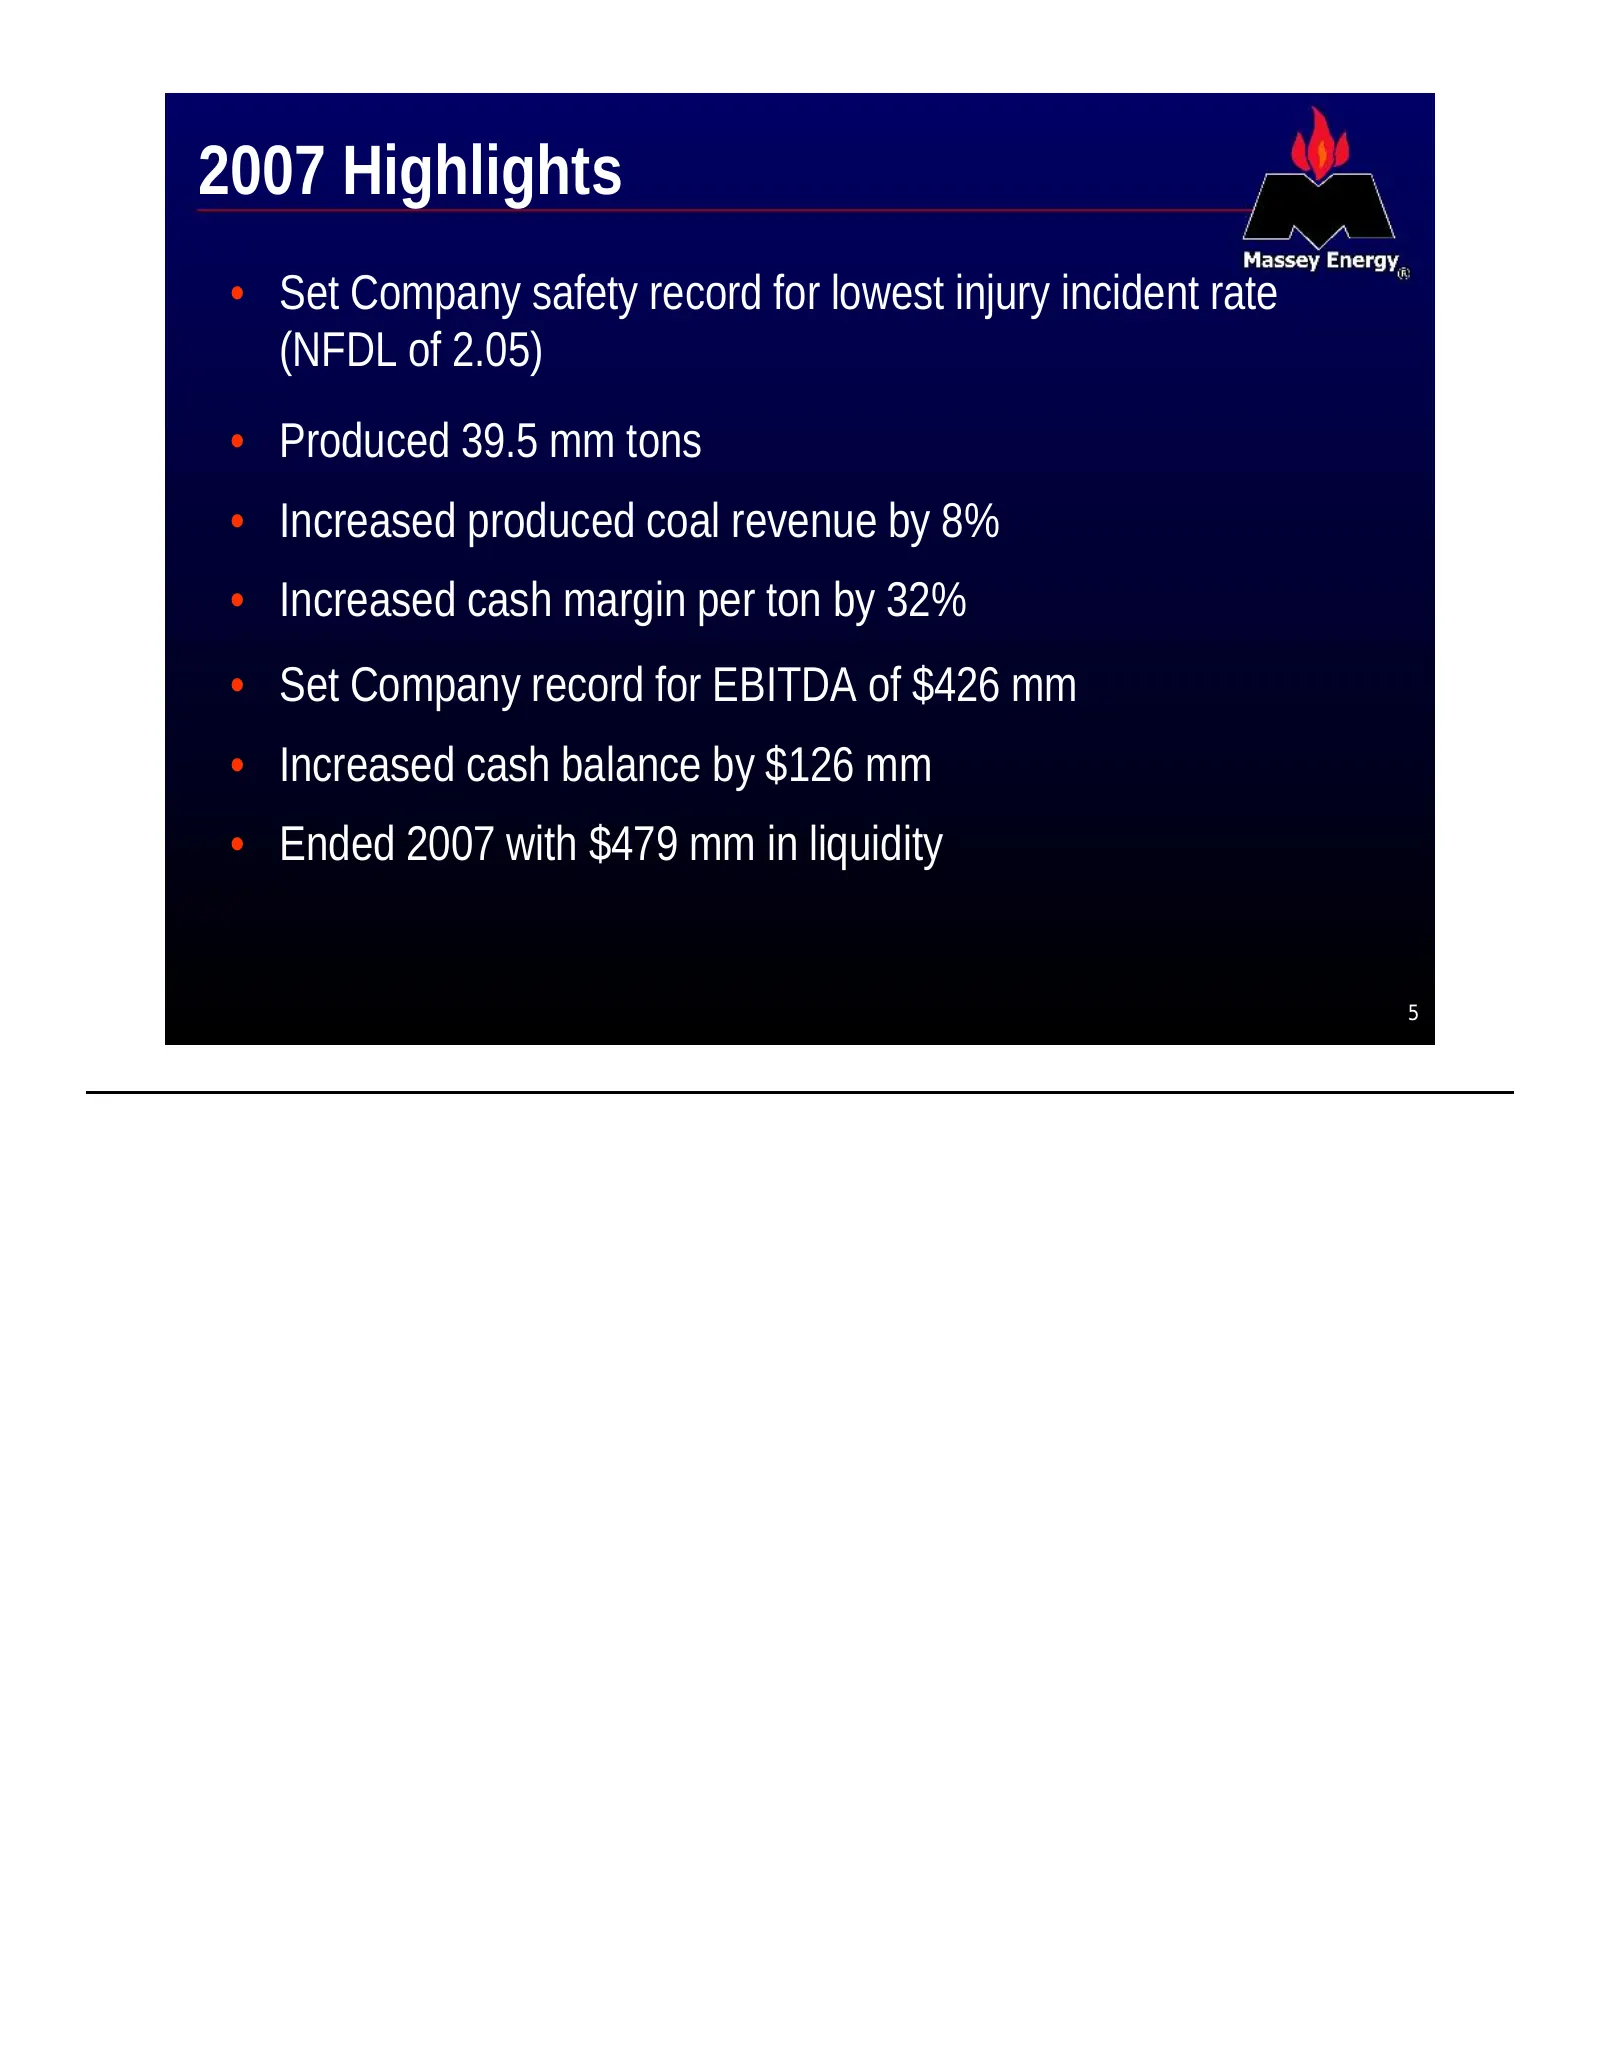
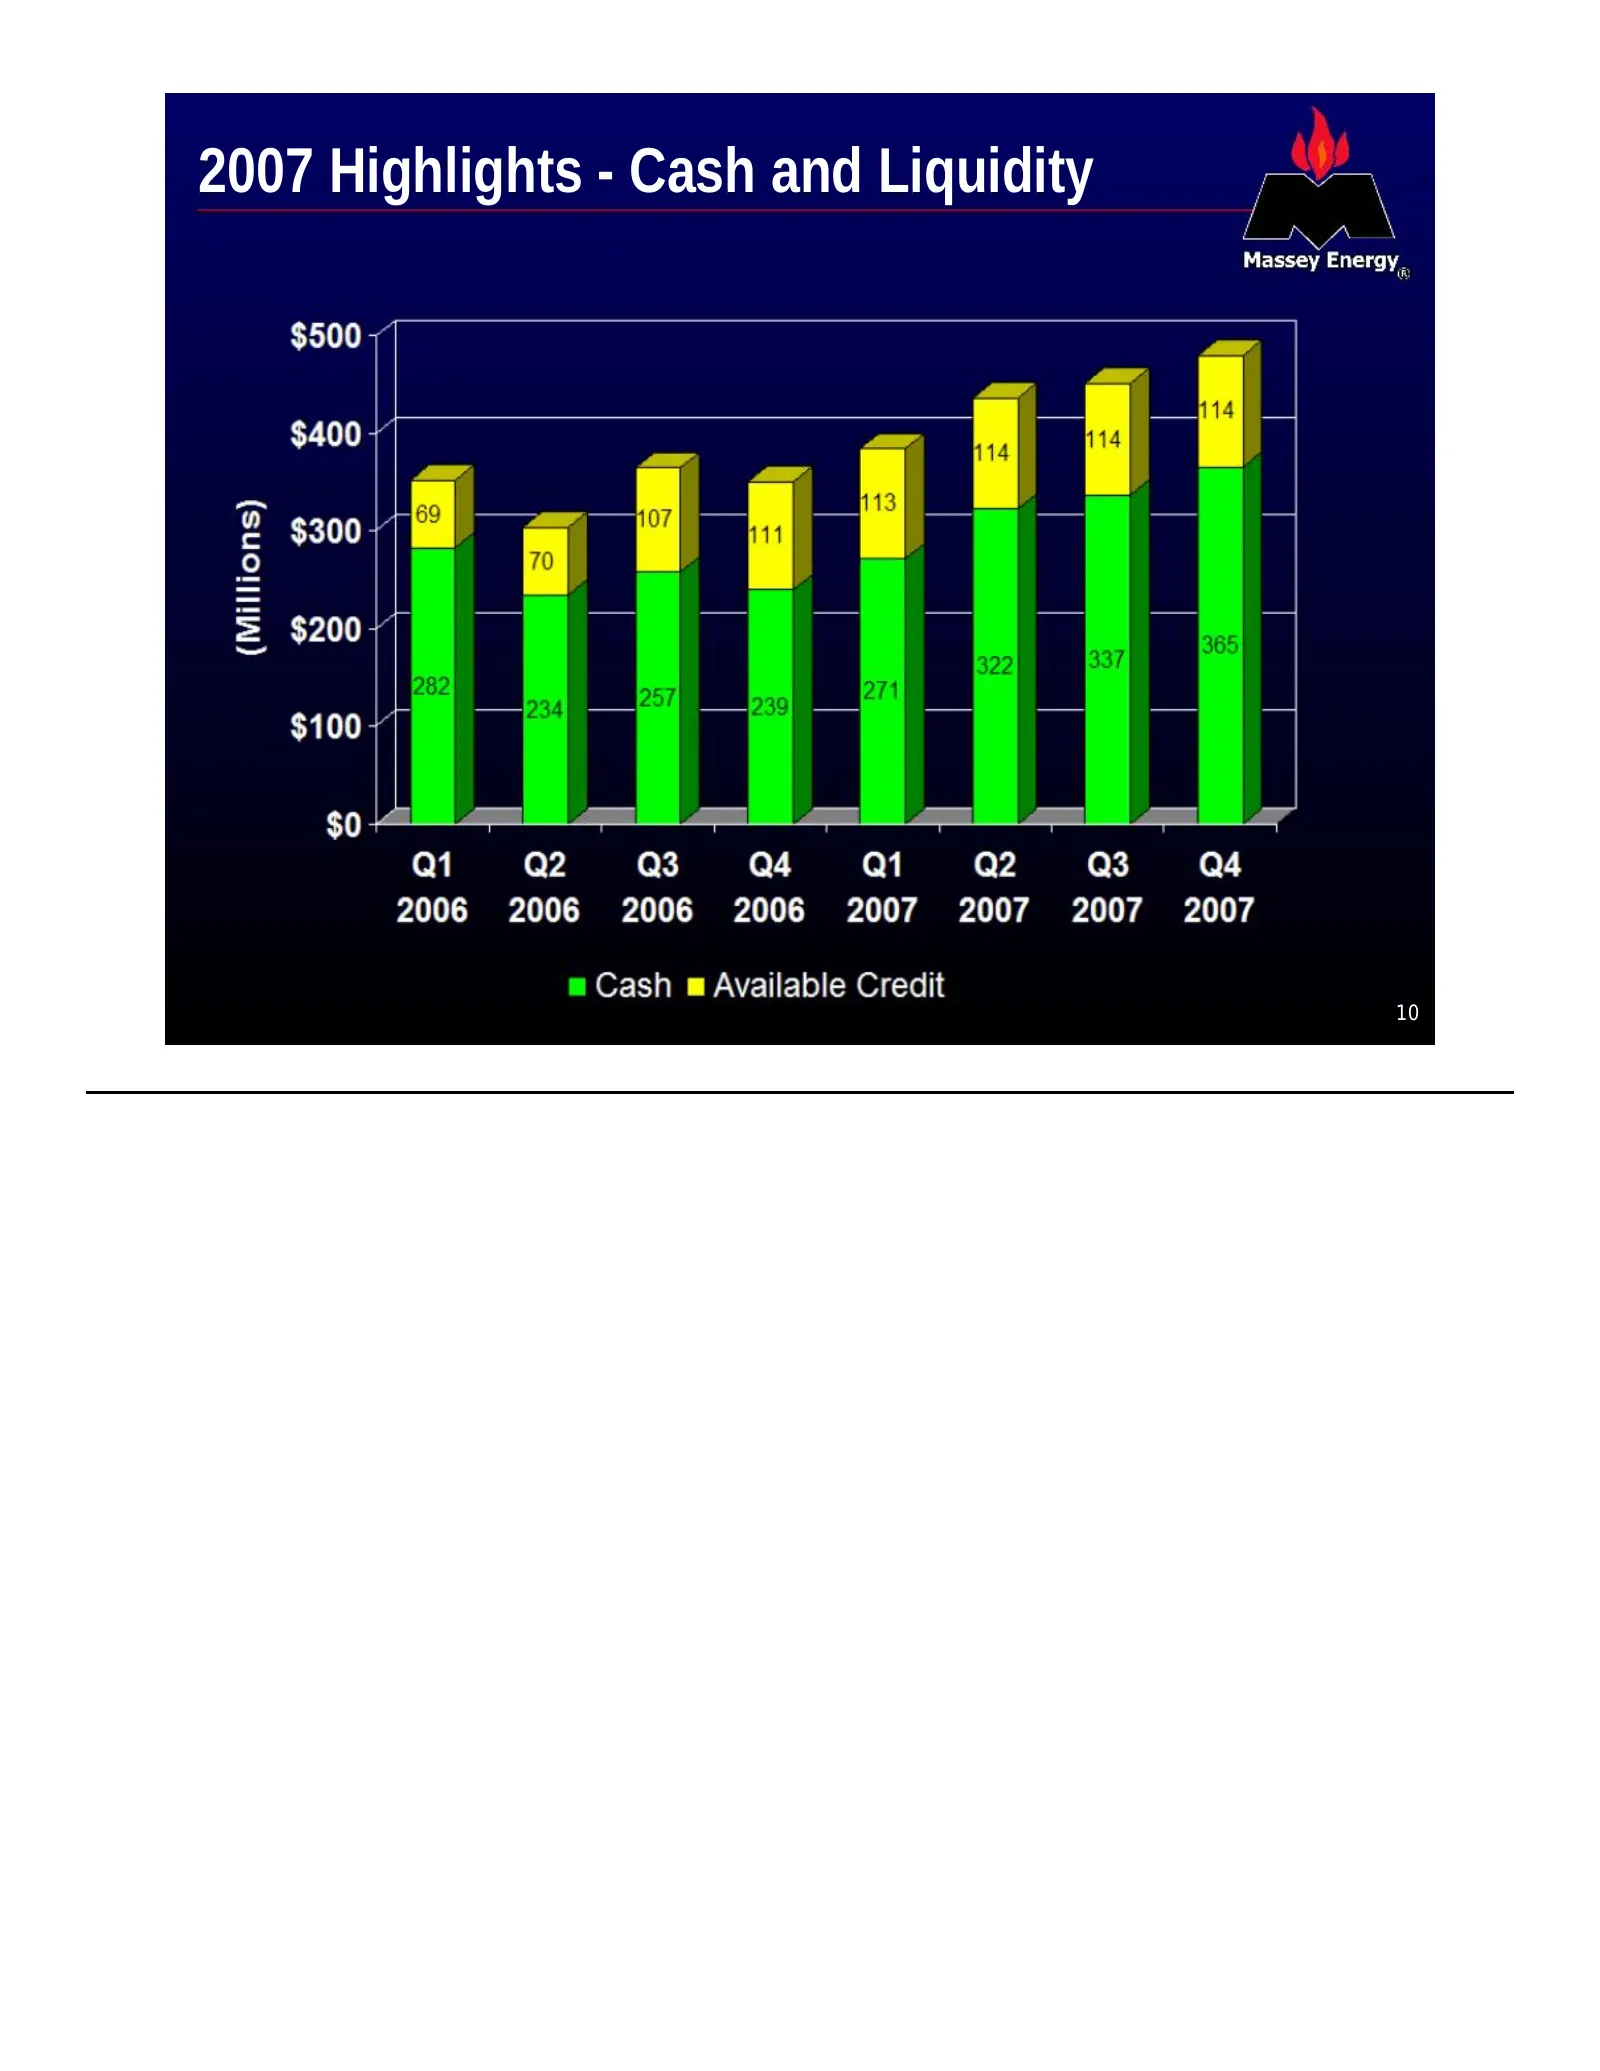
2007 Highlights • Set Company safety record for lowest injury incident rate (NFDL of 2.05) • Produced 39.5 mm tons • Increased produced coal revenue by 8% • Increased cash margin per ton by 32% • Set Company record for EBITDA of $426 mm • Increased cash balance by $126 mm • Ended 2007 with $479 mm i
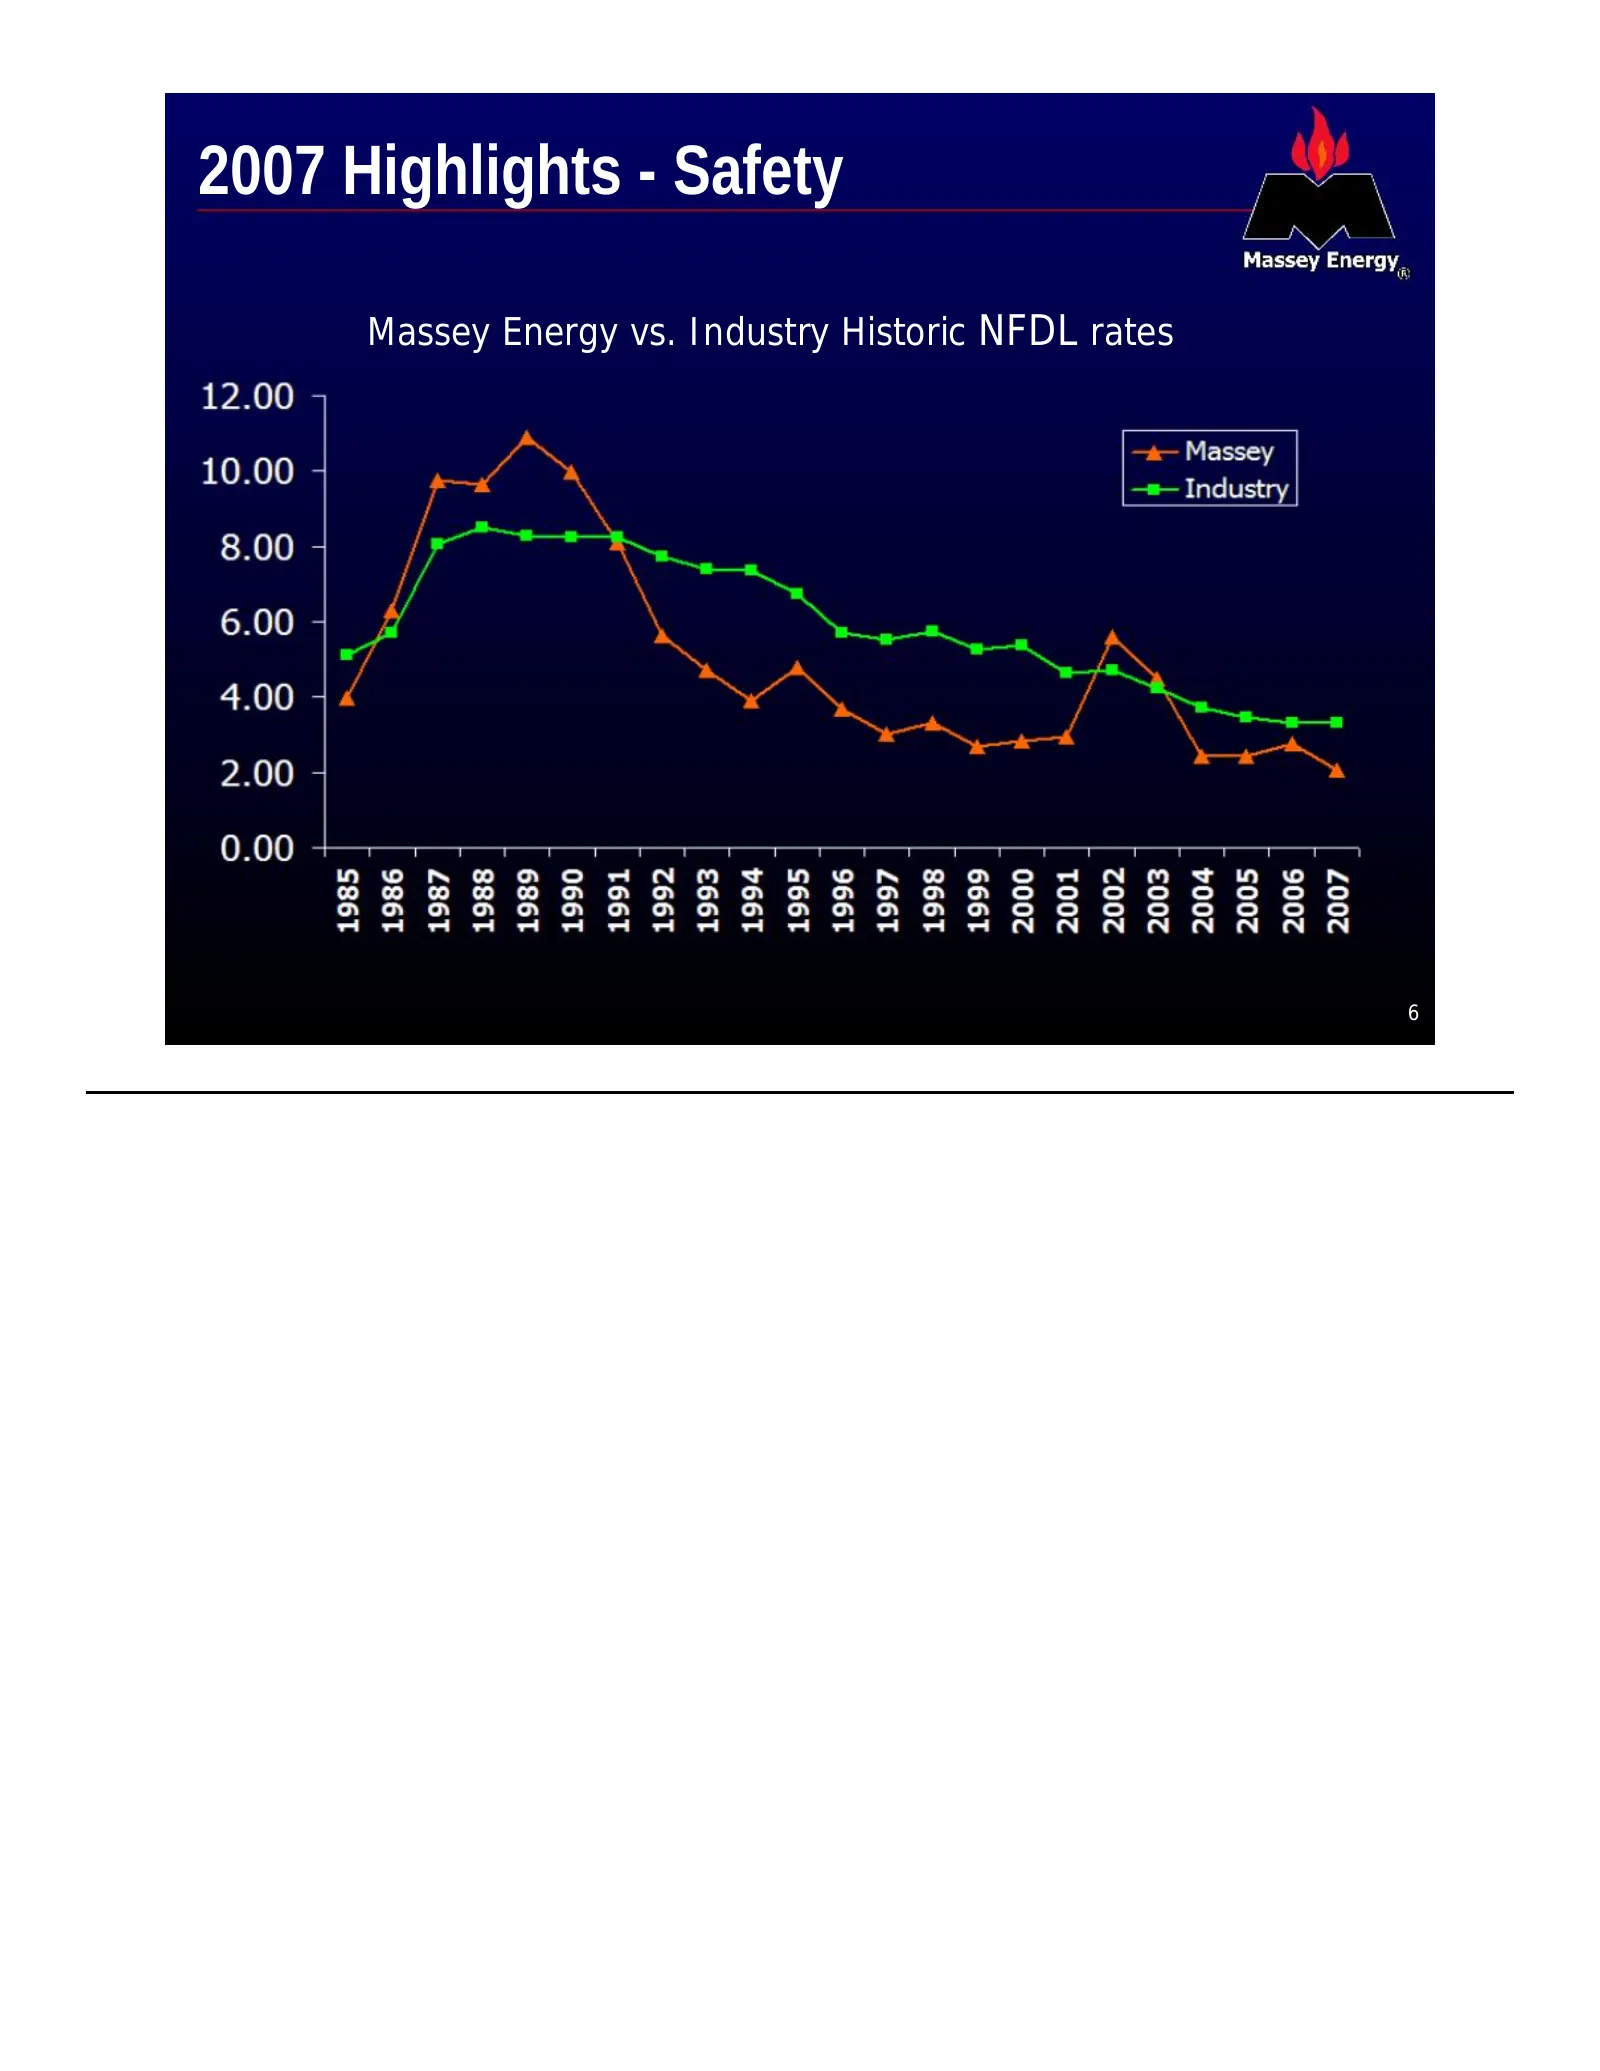
Slide 6: 2007 Highlights - Safety
2007 Highlights - Safety Massey Energy vs. Industry Historic NFDL rates 6
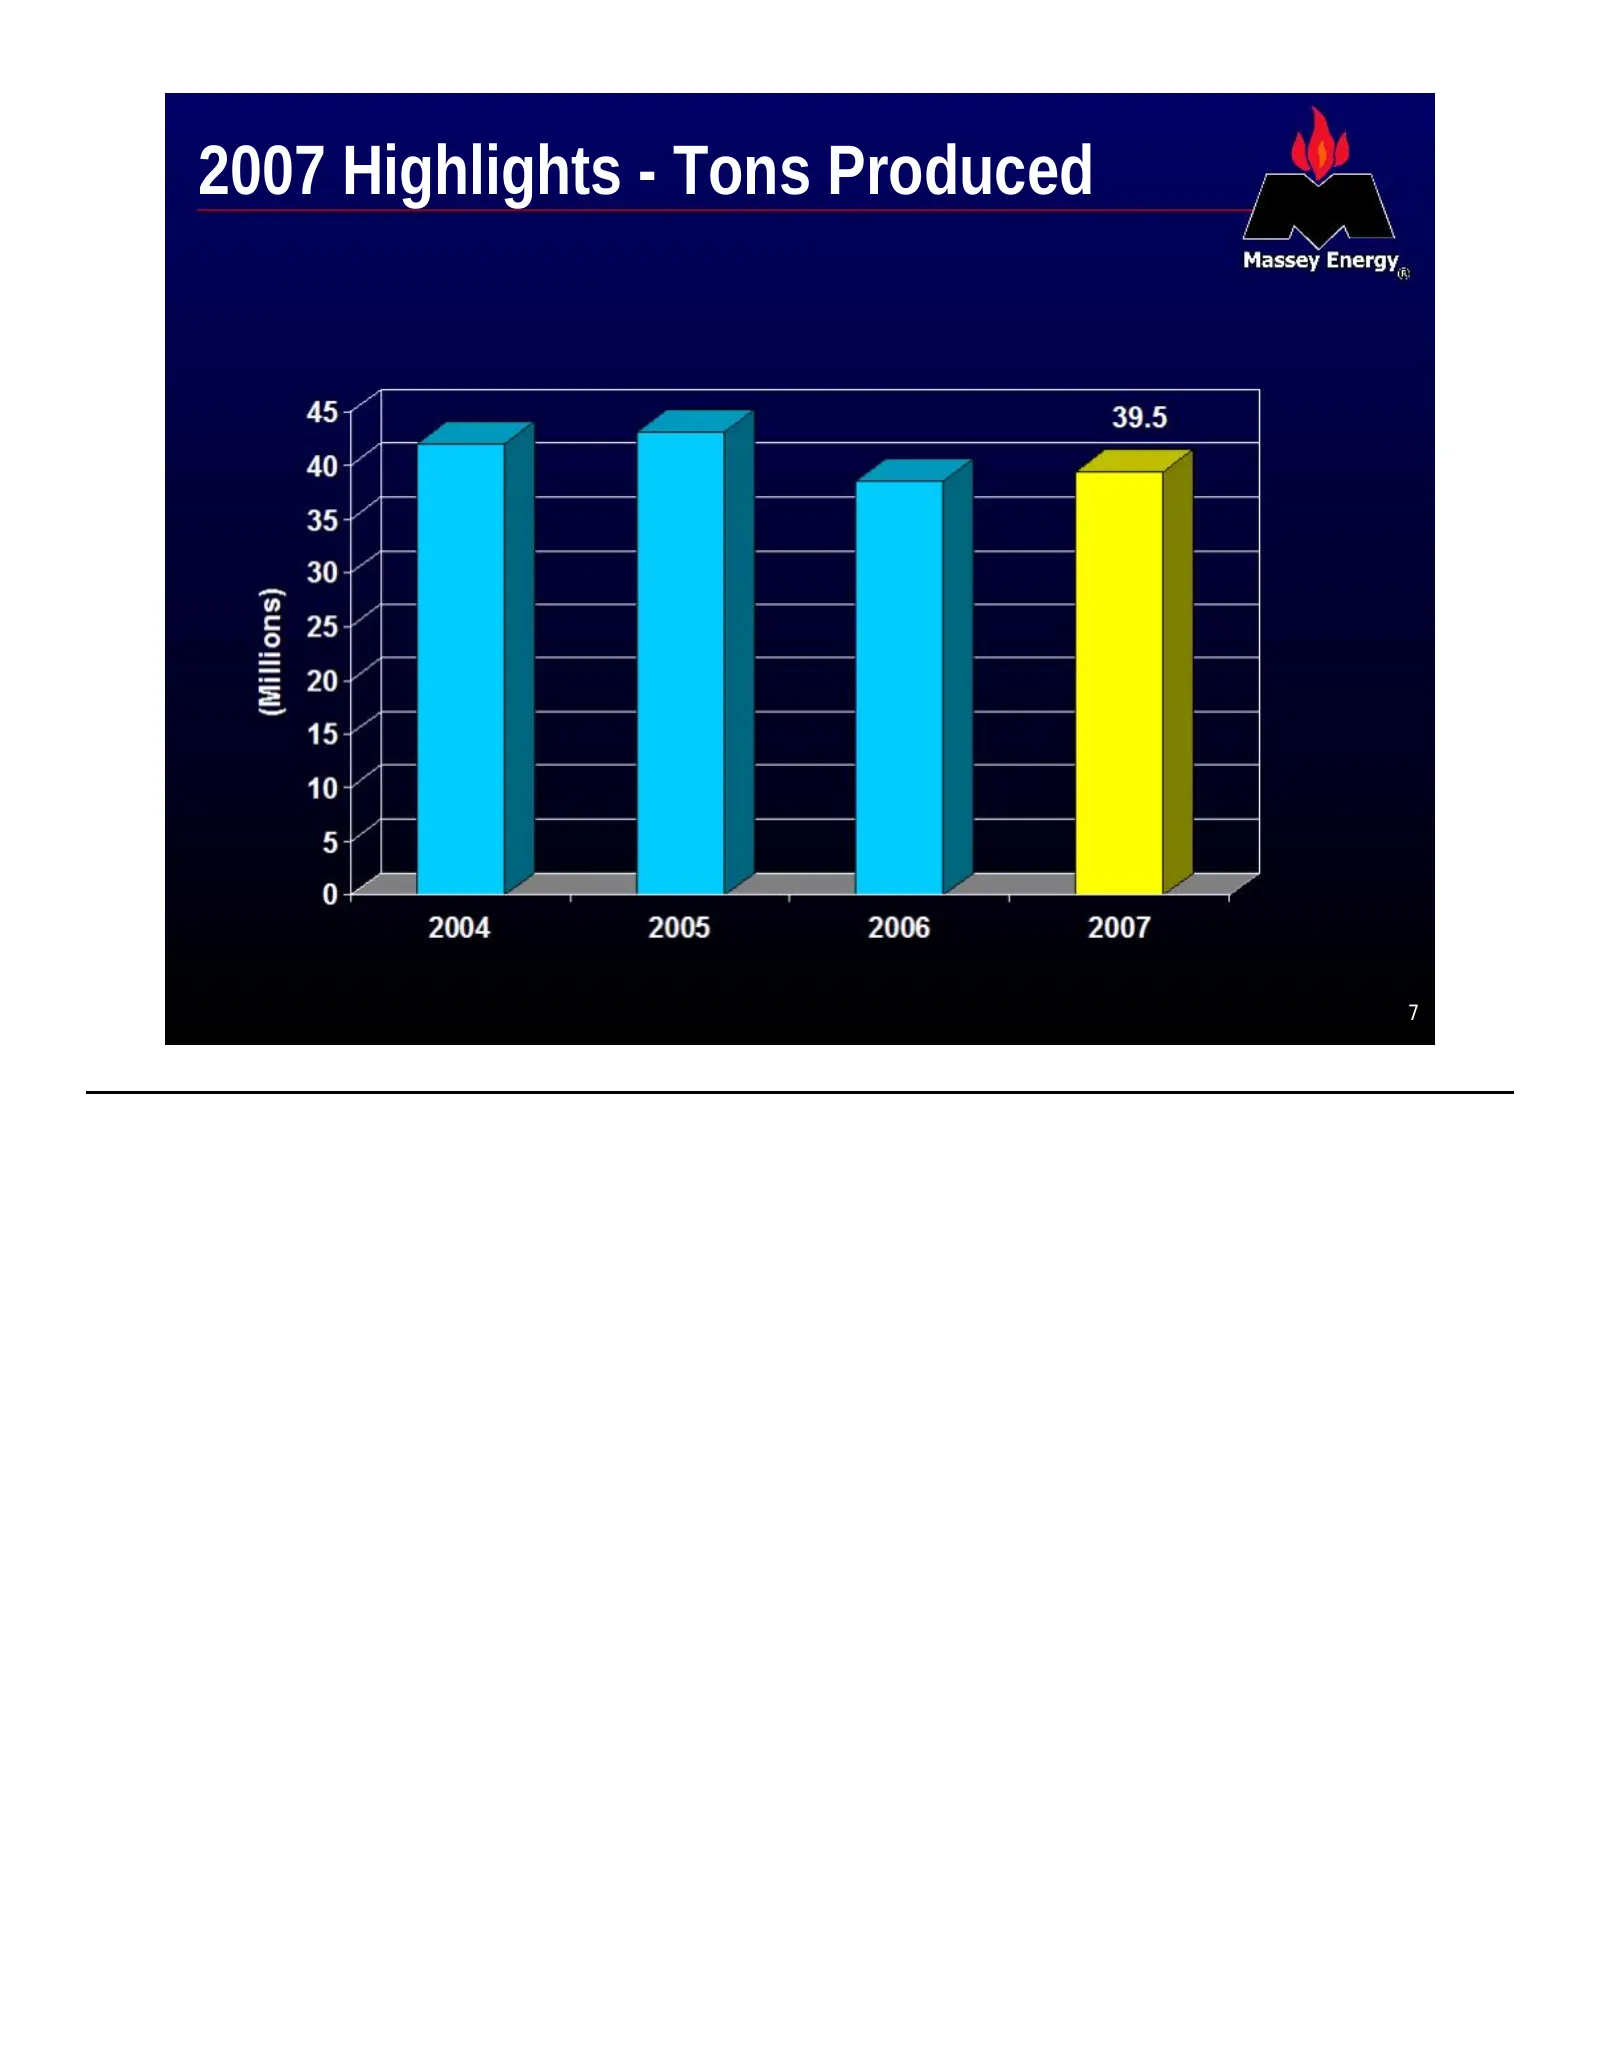
Slide 7: 2007 Highlights - Tons Produced
2007 Highlights - Tons Produced 7
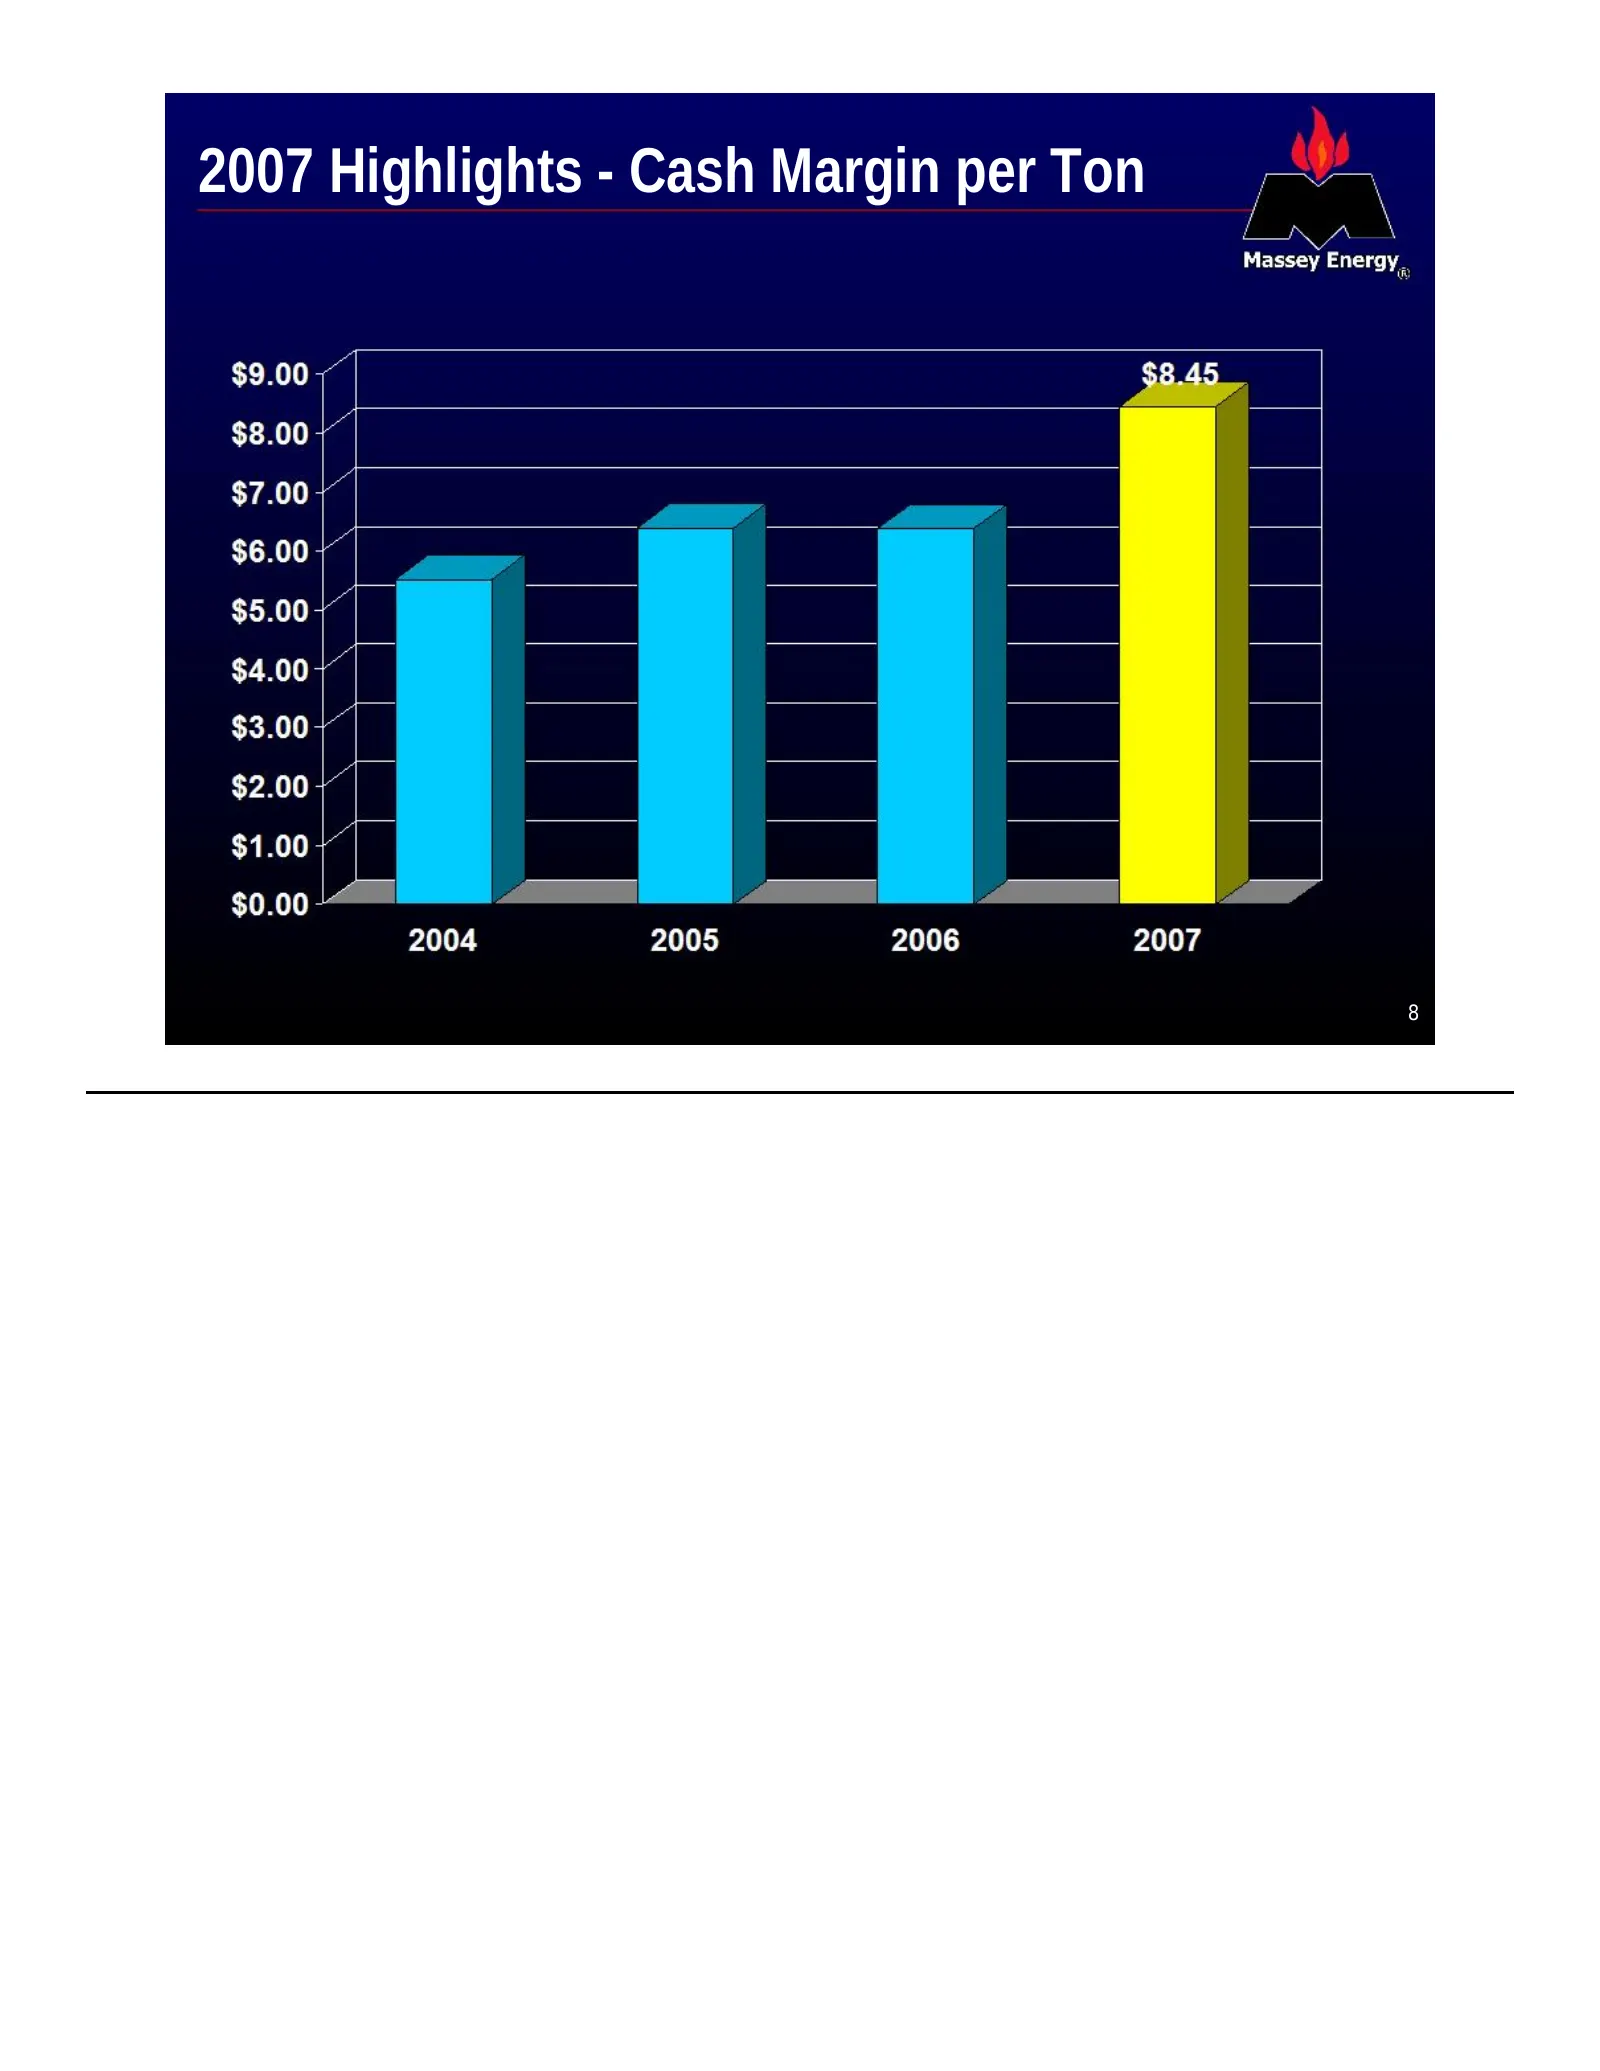
Slide 8: 2007 Highlights - Cash Margin per Ton
2007 Highlights - Cash Margin per Ton 8
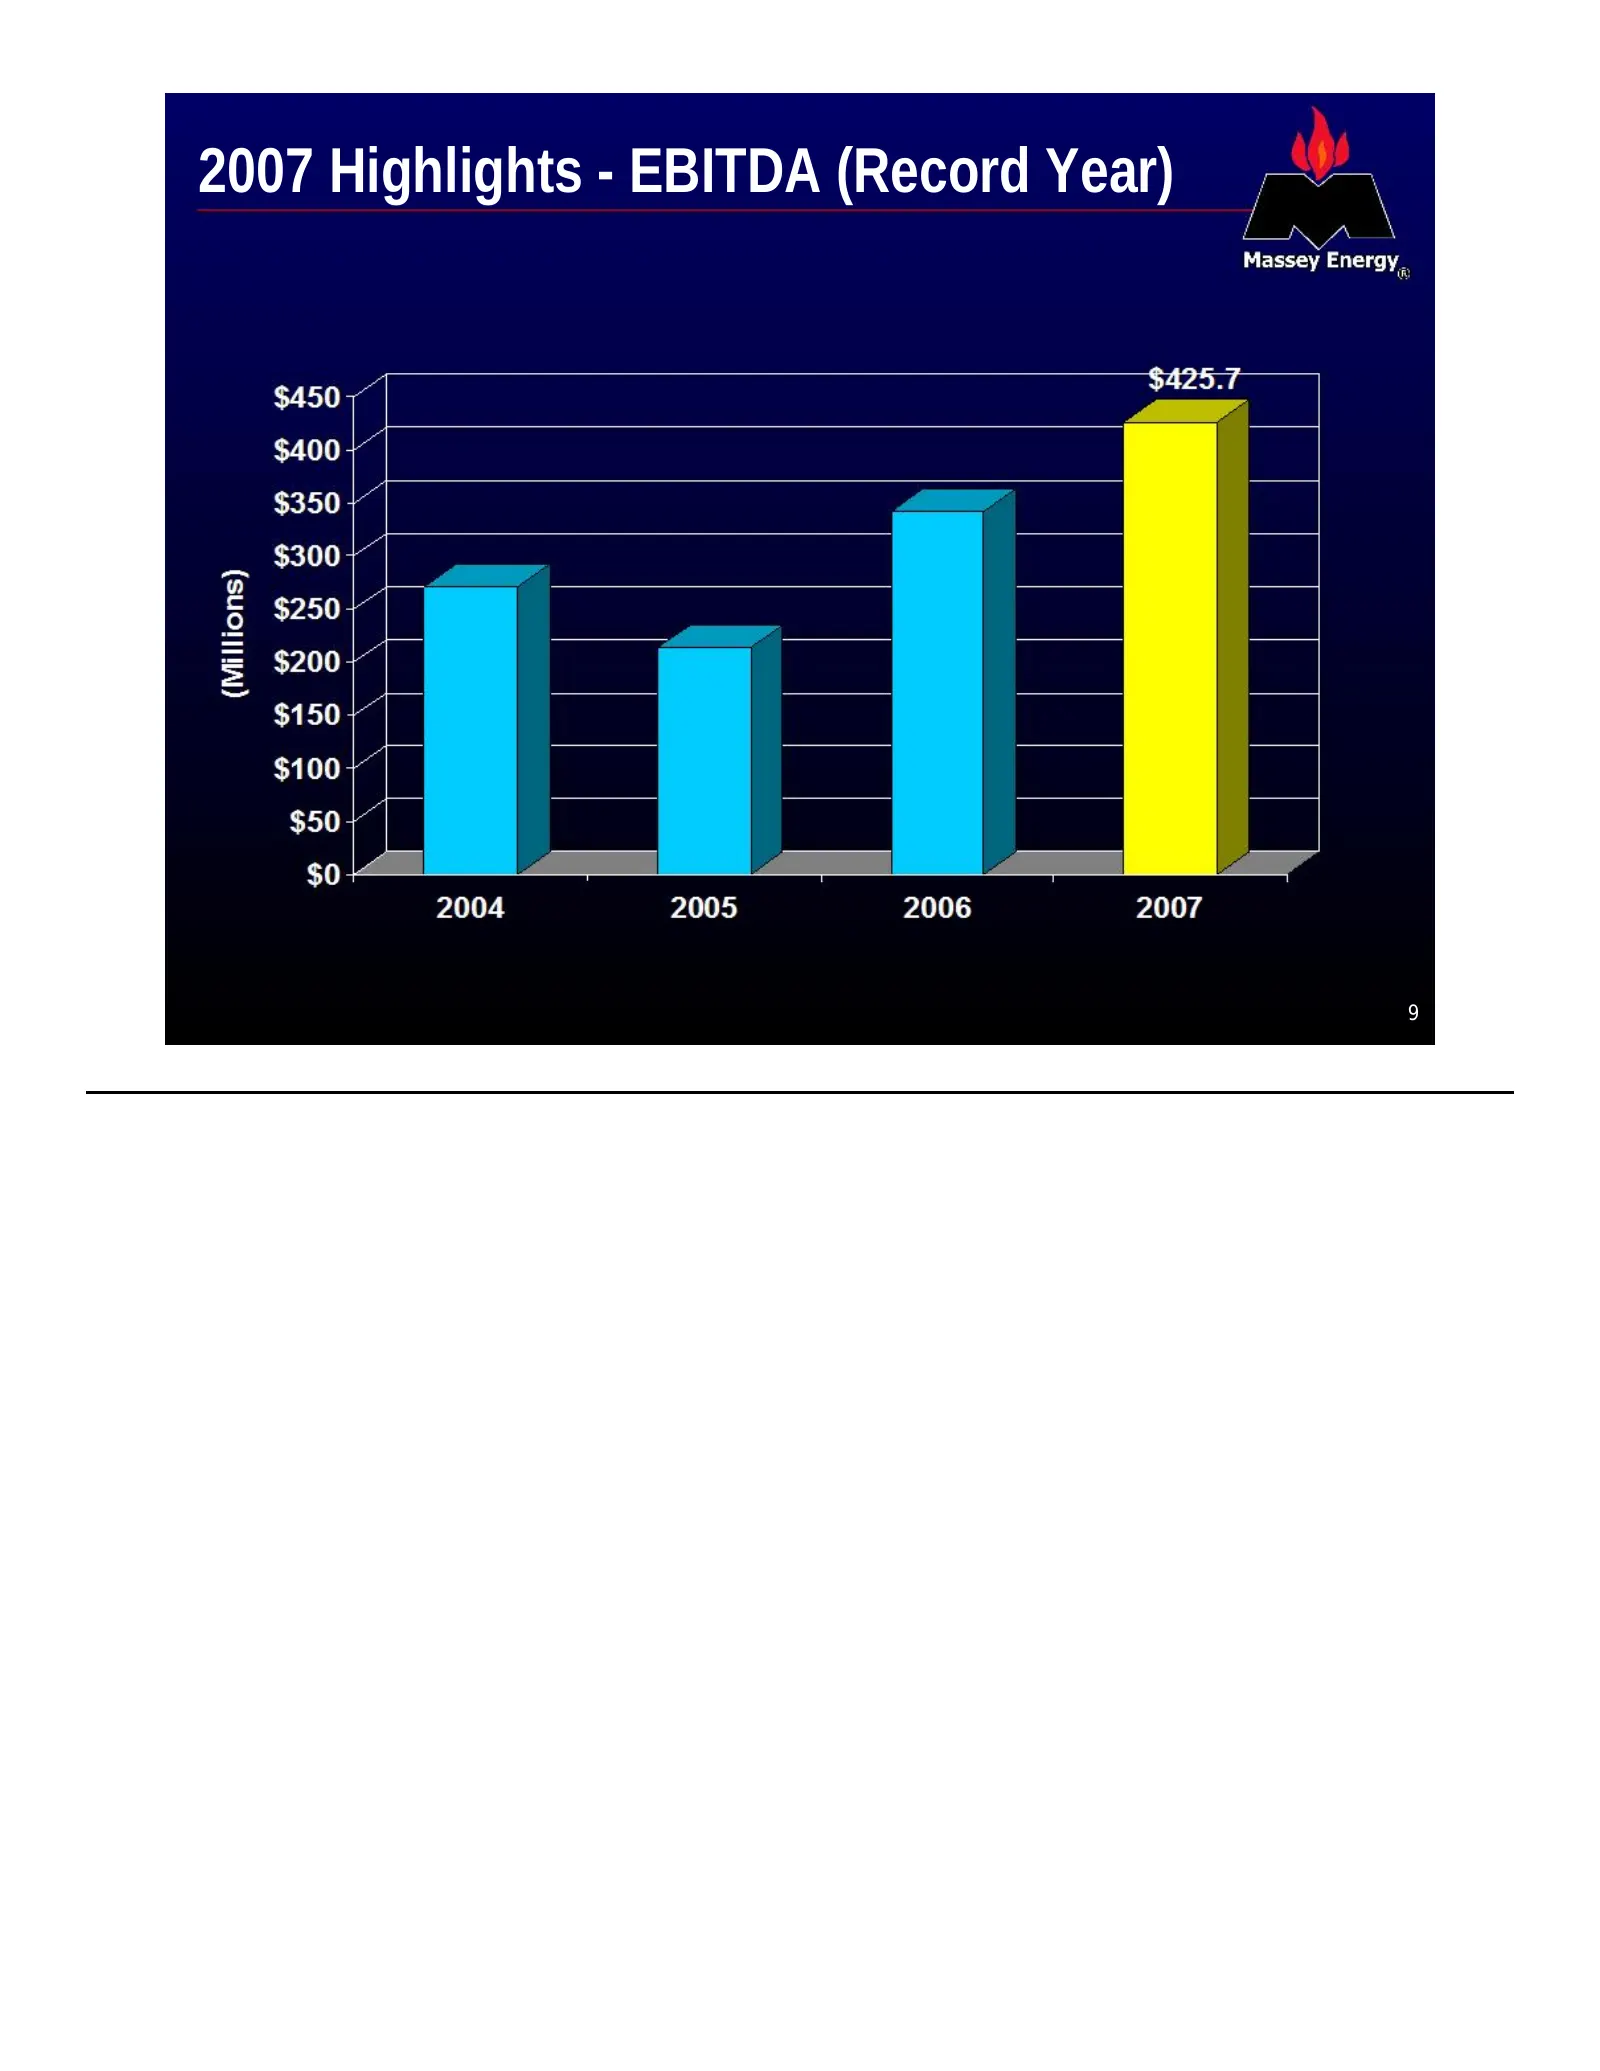
Slide 9: 2007 Highlights - EBITDA (Record Year)
2007 Highlights - EBITDA (Record Year) 9
Slide 10: 2007 Highlights - Cash and Liquidity
2007 Highlights - Cash and Liquidity 10

Slide 11: 2008 will be even better
als Massey Energy . 2008 will be even better
Slide 12: Current Coal Market
als Massey Energy . Current Coal Market
Slide 13: Coal Marketplace
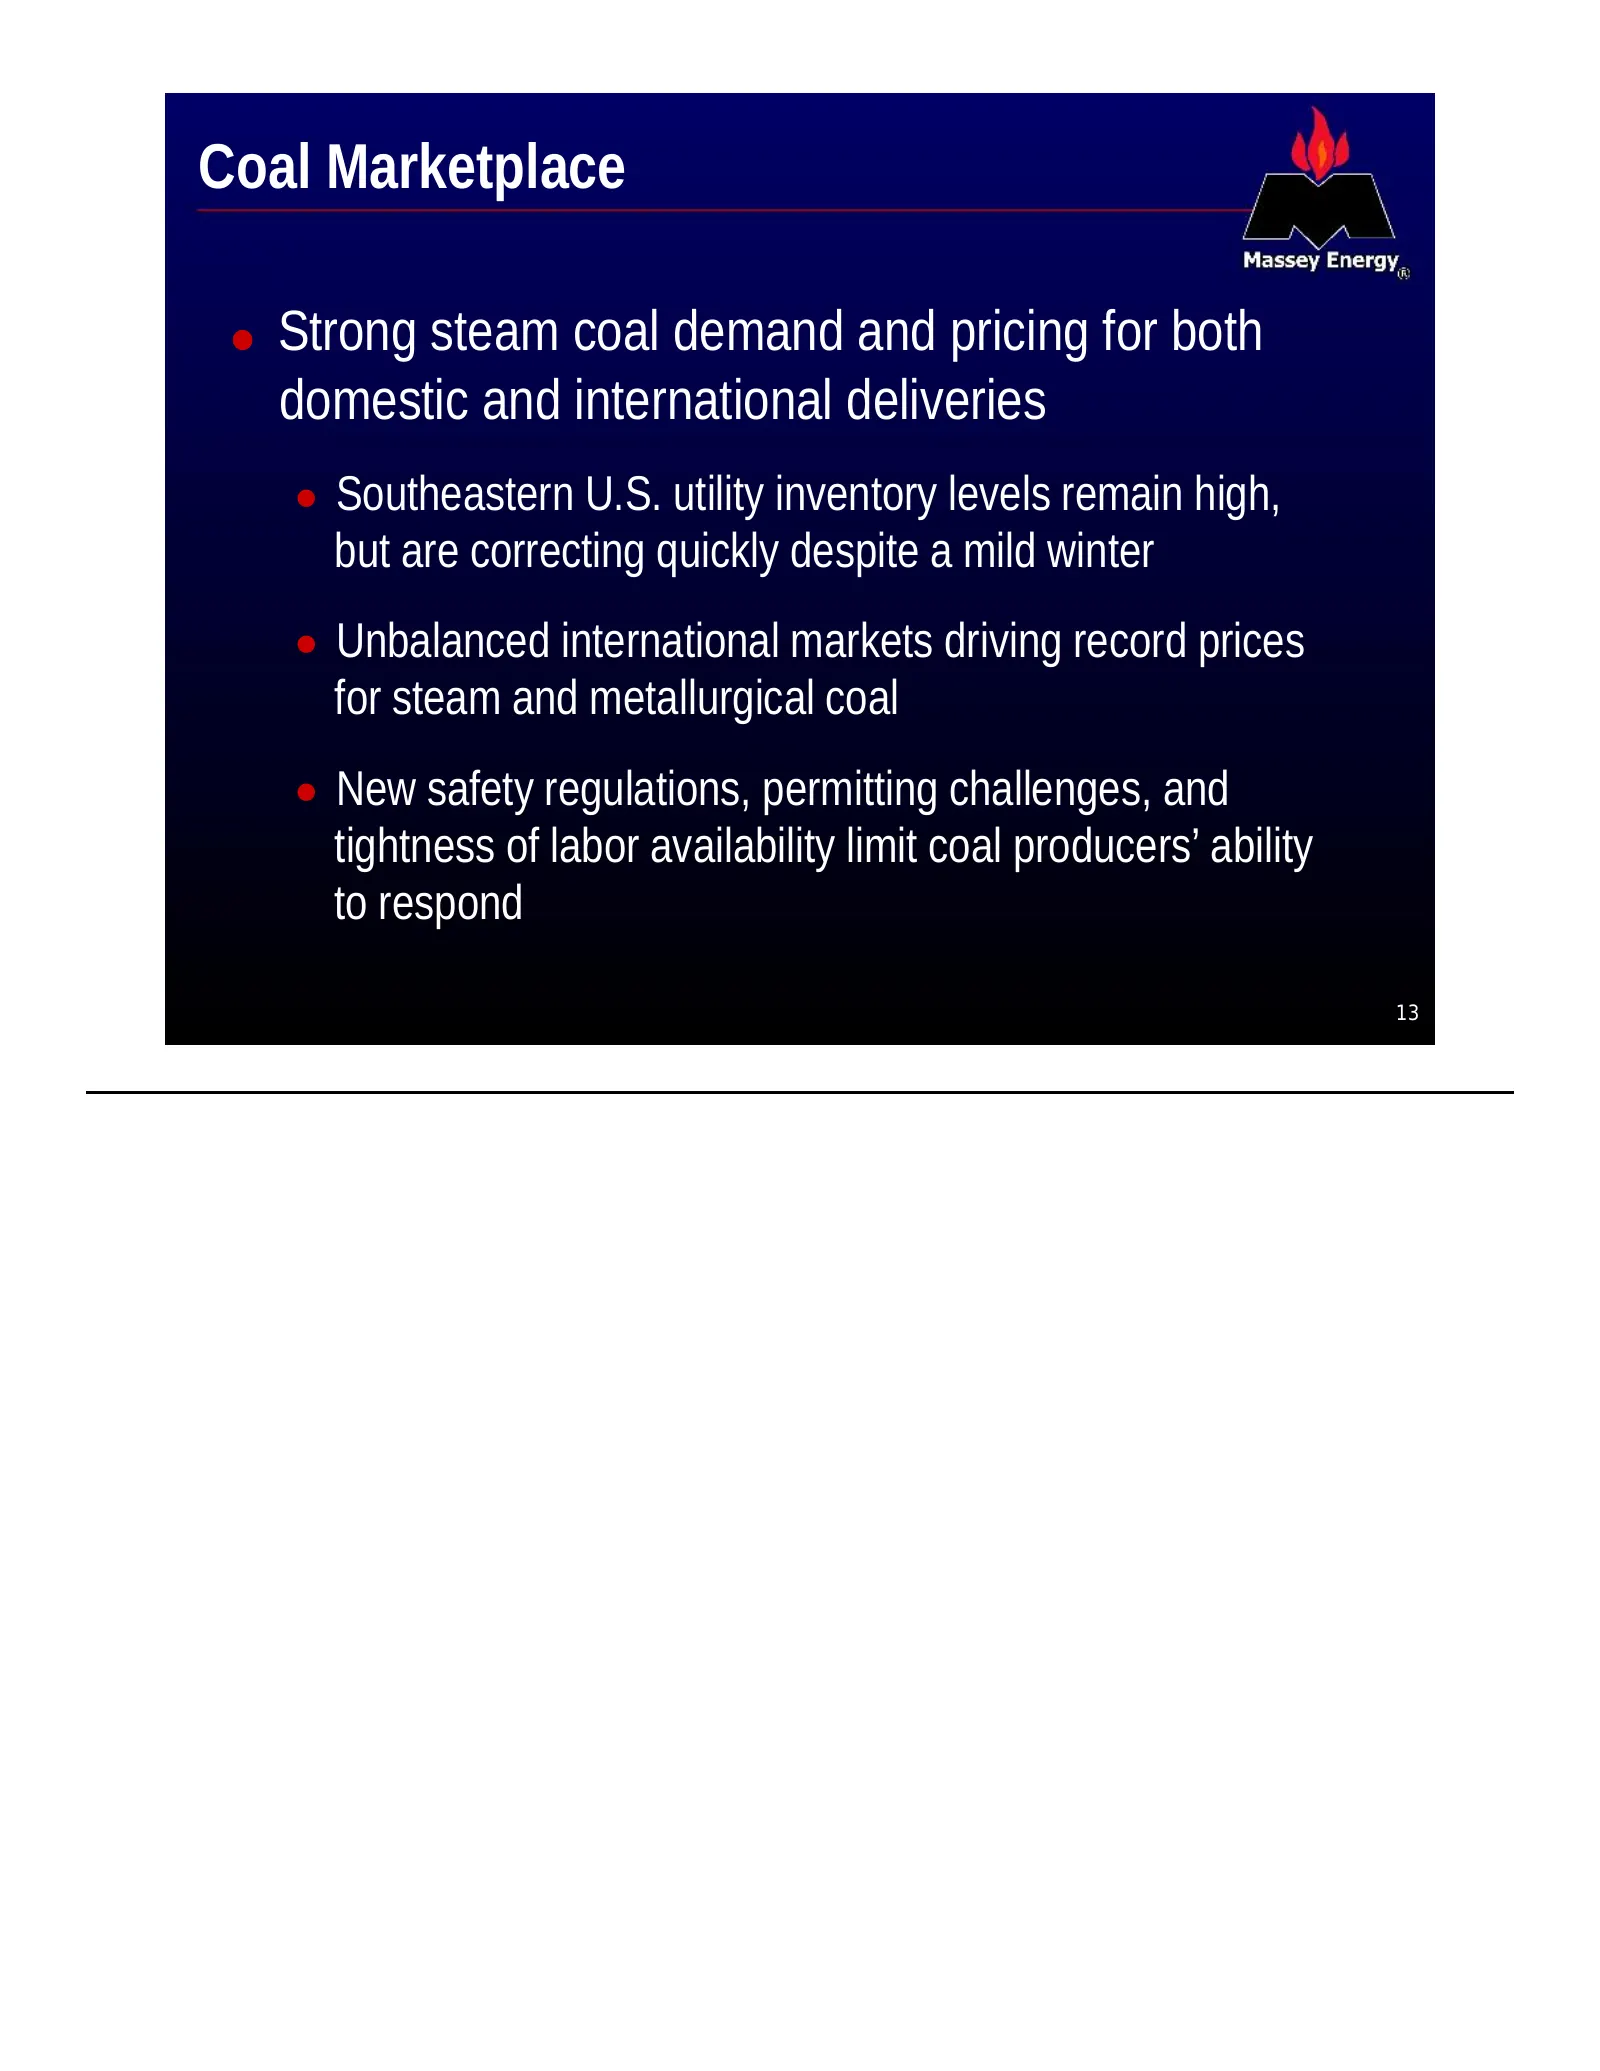
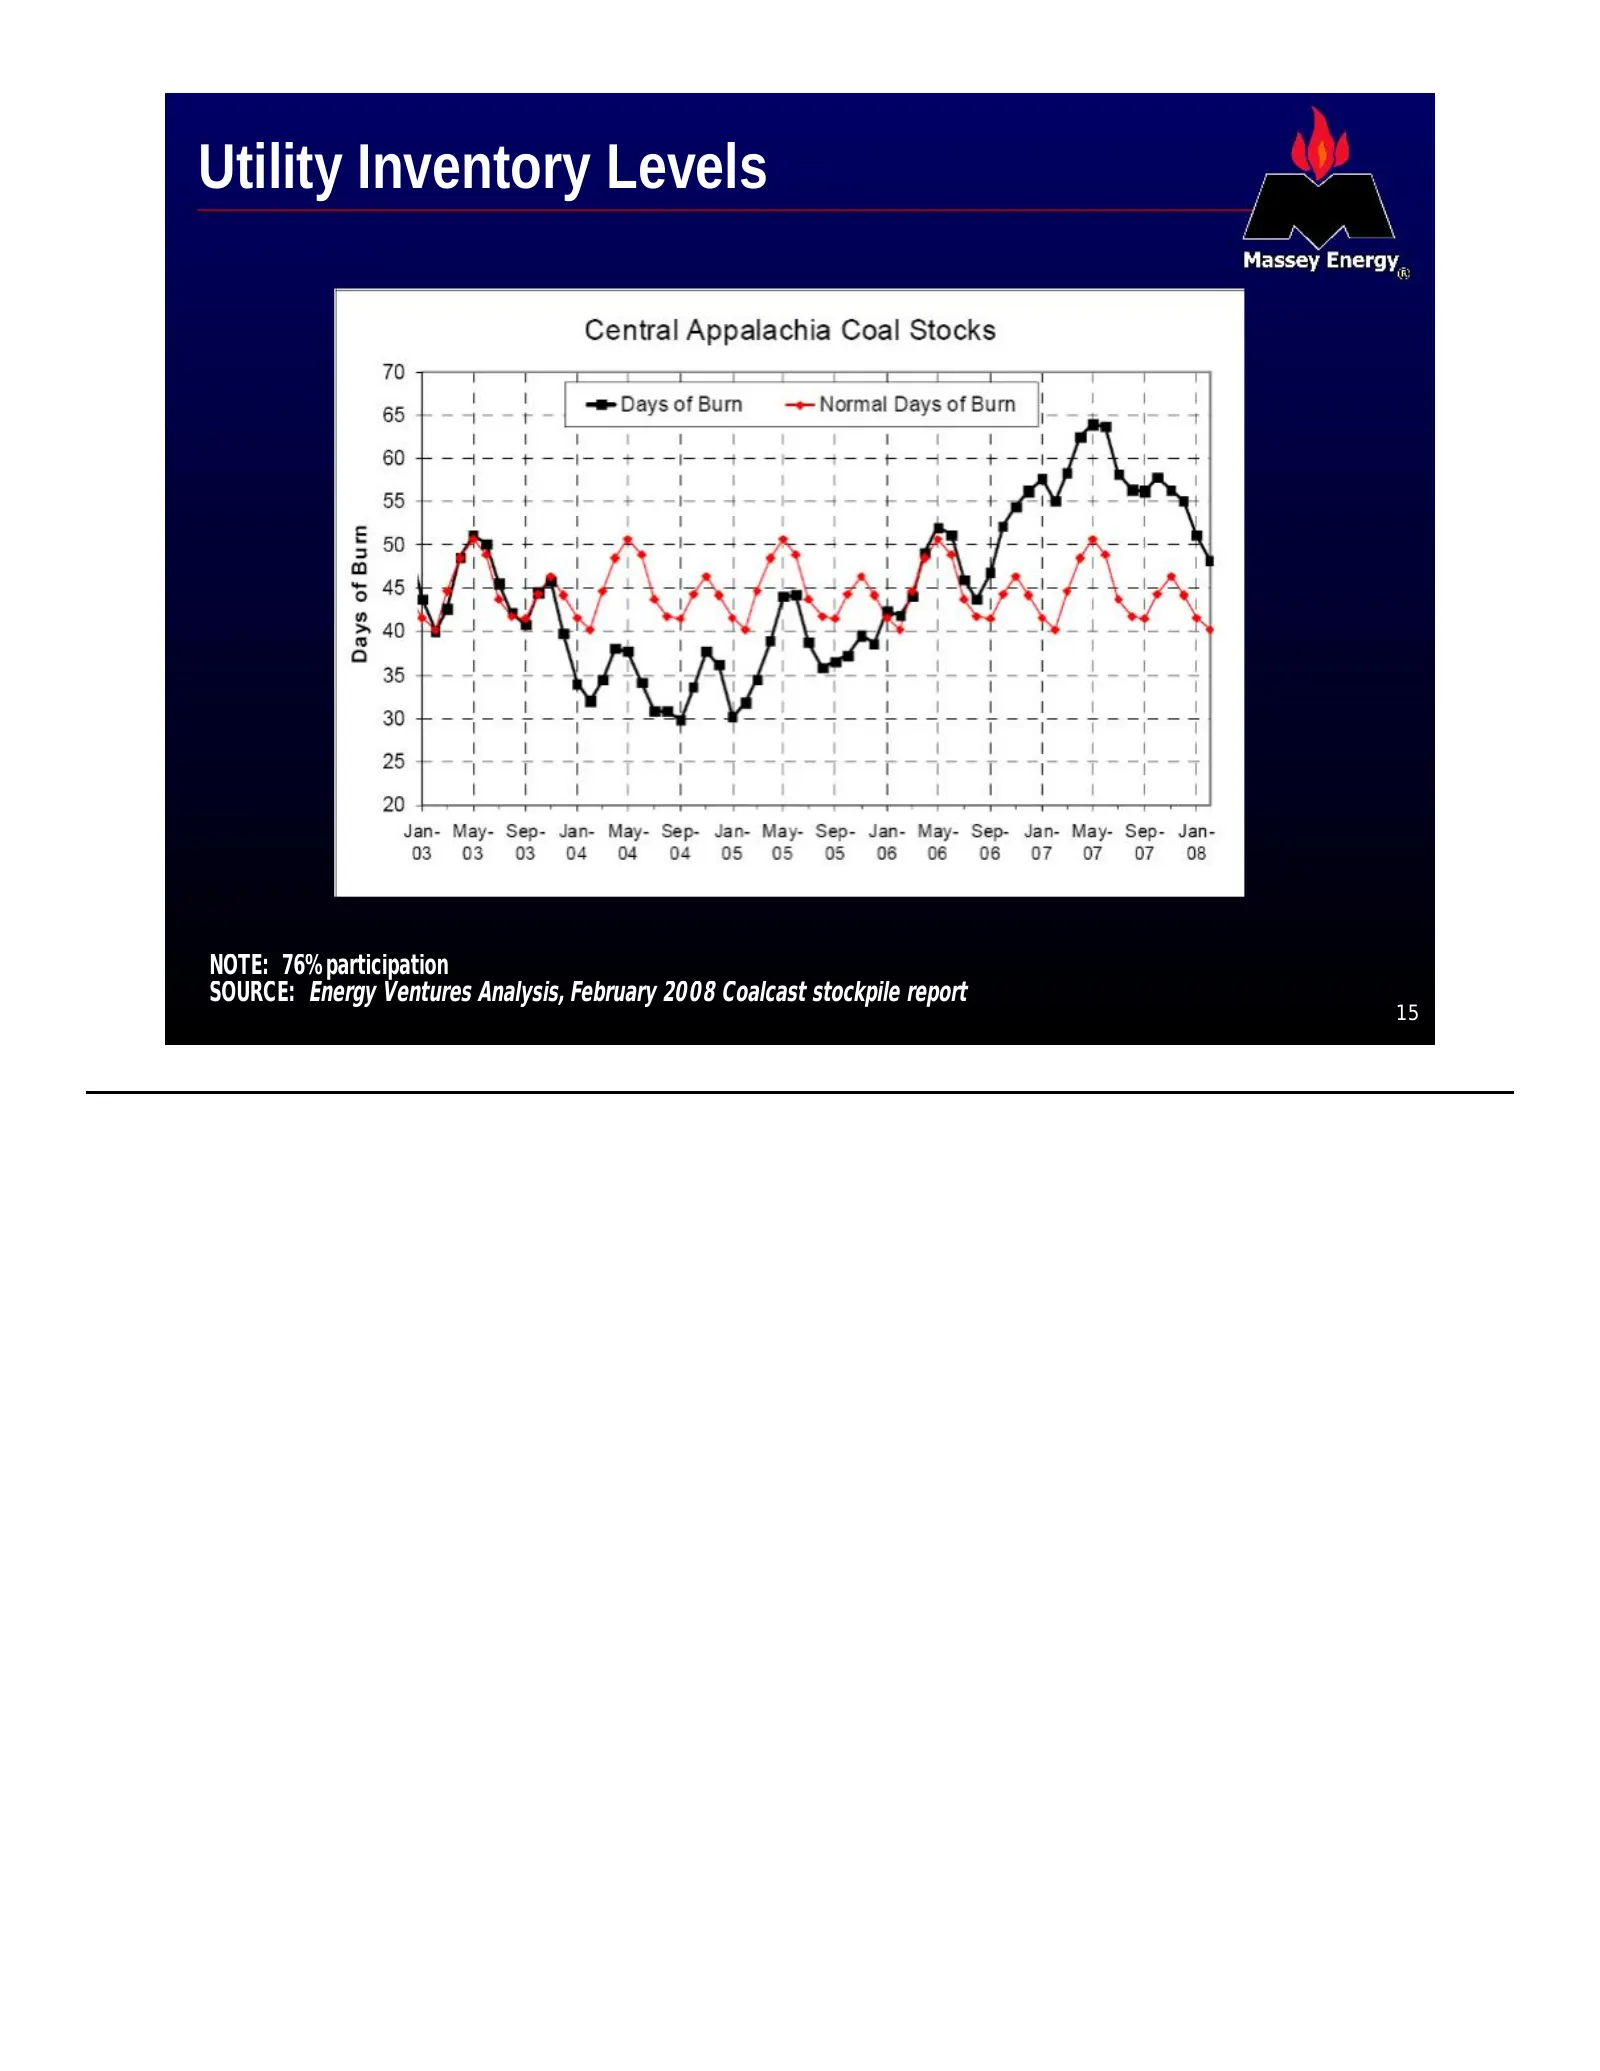
Coal Marketplace · Strong steam coal demand and pricing for both domestic and international deliveries · Southeastern U.S. utility inventory levels remain high, but are correcting quickly despite a mild winter · Unbalanced international markets driving record prices for steam and metallurgical coal
Slide 14: Market Outlook - Domestic Steam Coal
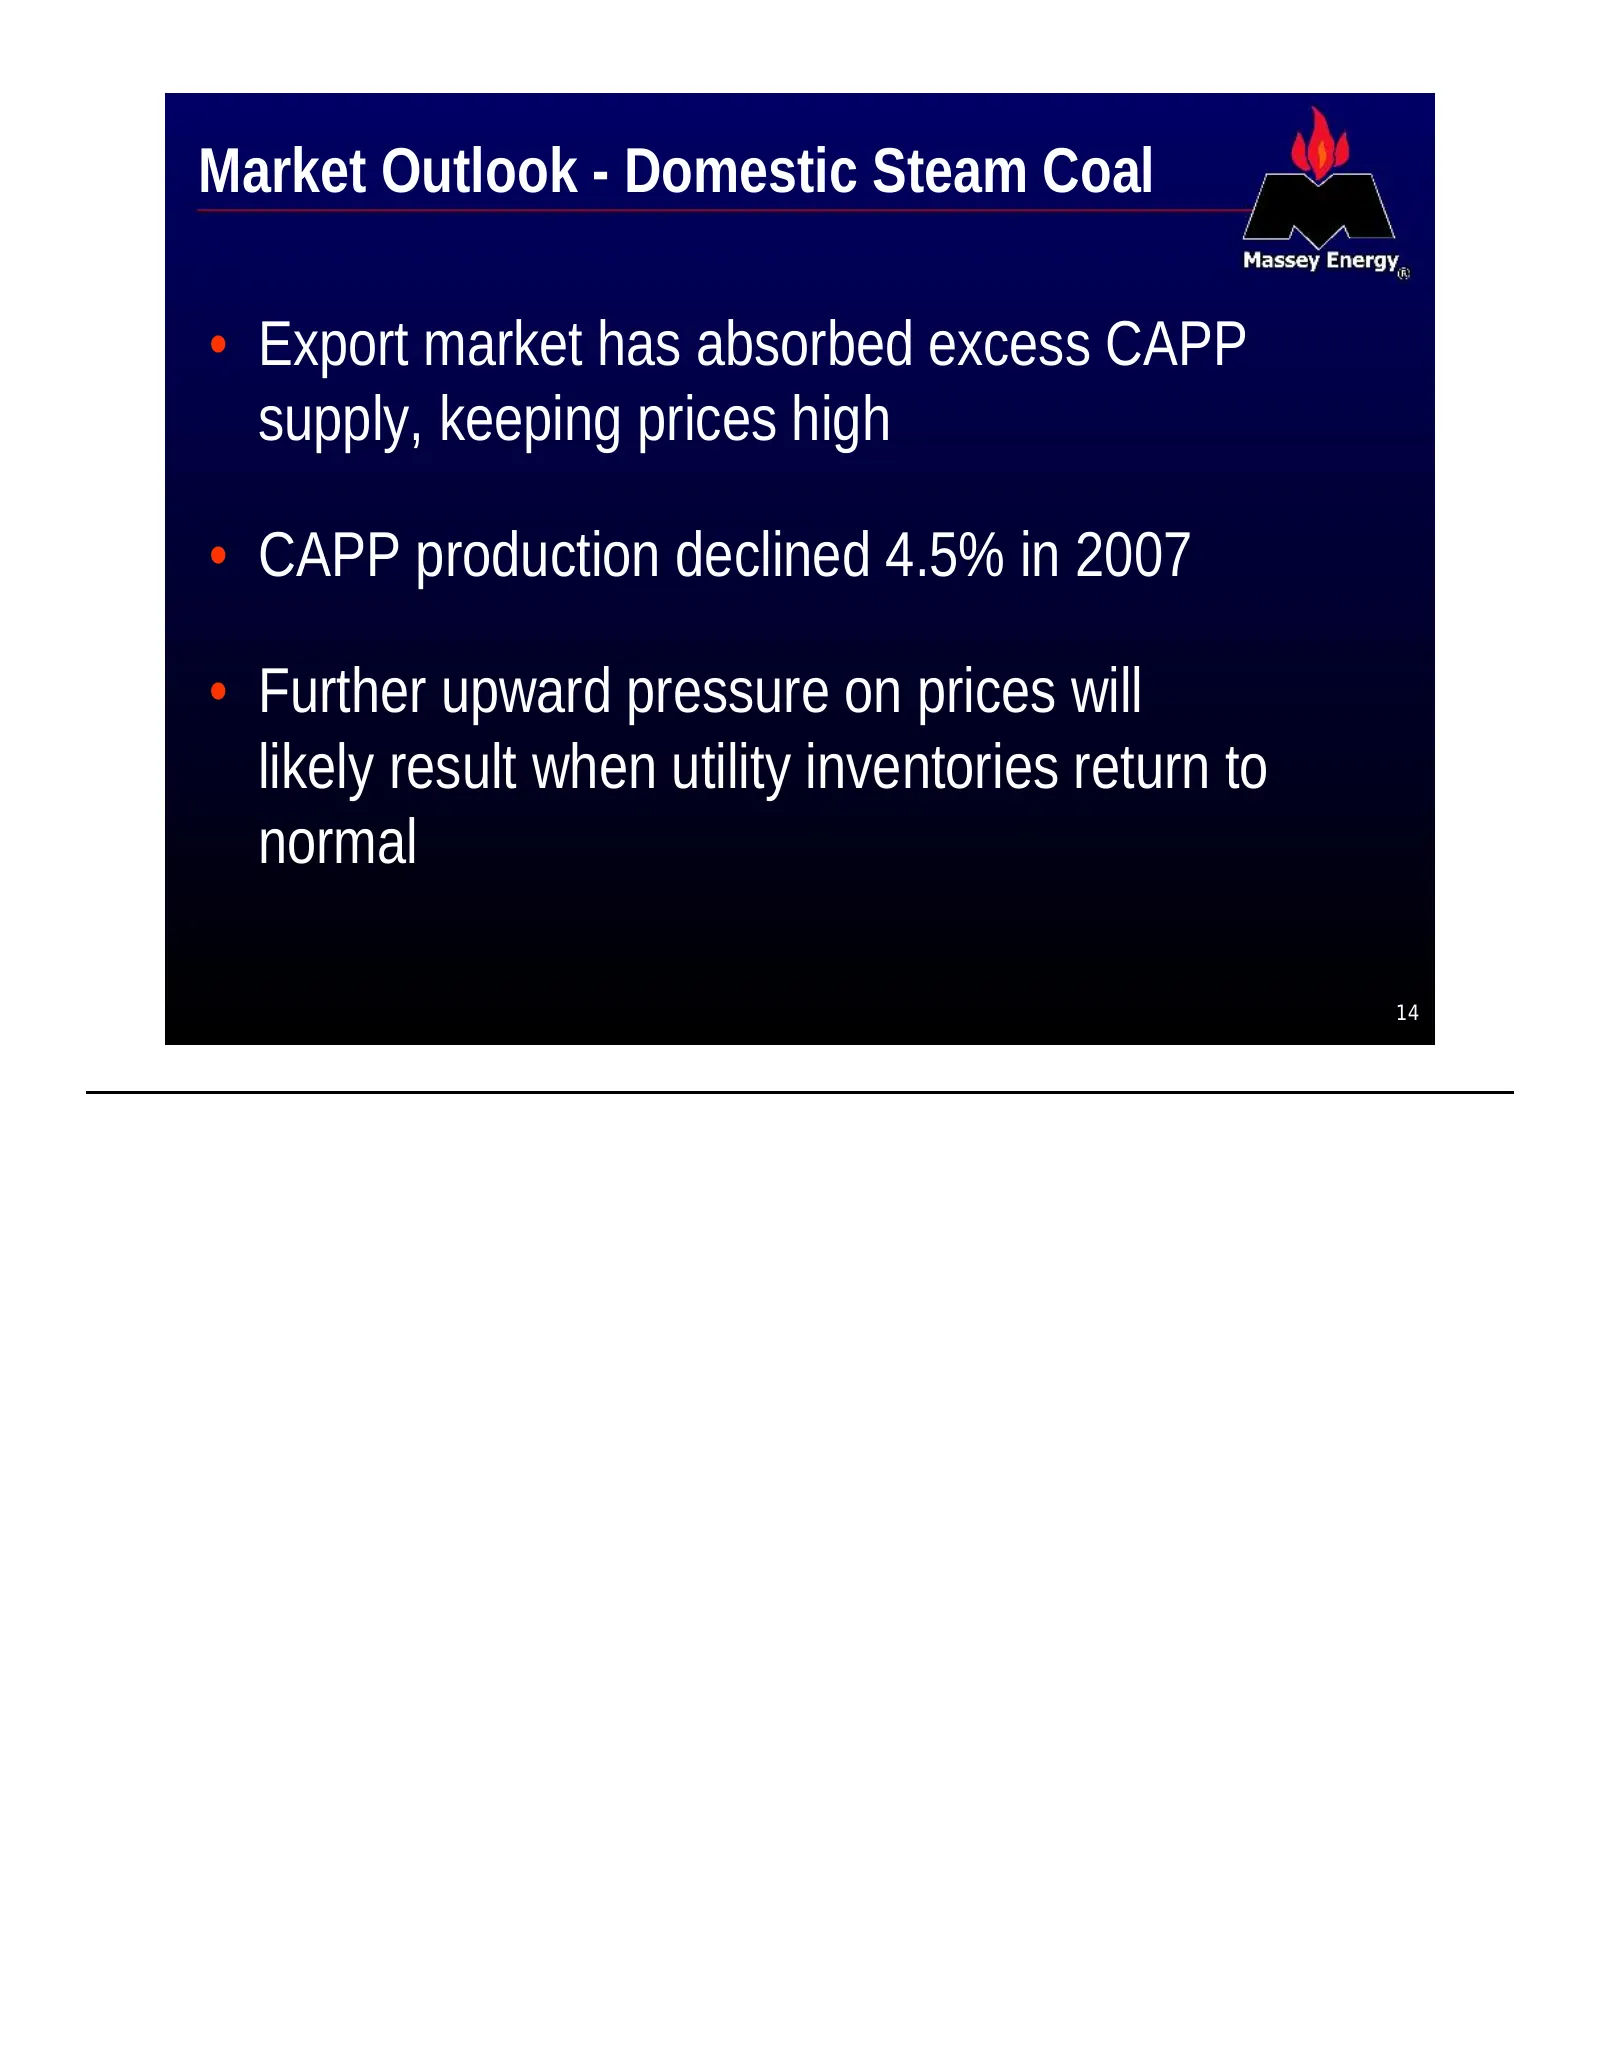
Market Outlook - Domestic Steam Coal • Export market has absorbed excess CAPP supply, keeping prices high • CAPP production declined 4.5% in 2007 • Further upward pressure on prices will likely result when utility inventories return to normal 14
Slide 15: Utility Inventory Levels
Utility Inventory Levels NOTE: 76% participation SOURCE: Energy Ventures Analysis, February 2008 Coalcast stockpile report 15
Slide 16: Market Outlook - Export Steam Coal
Market Outlook - Export Steam Coal • China demand exceeds its domestic supply • Demand in India increasing • Former Soviet Union countries seeking new supply • Europe becomes a natural market for CAPP coal • U.S. Dollar remains weak • Export demand appears to be sustainable 16
Slide 17: Central App Spot Coal Prices
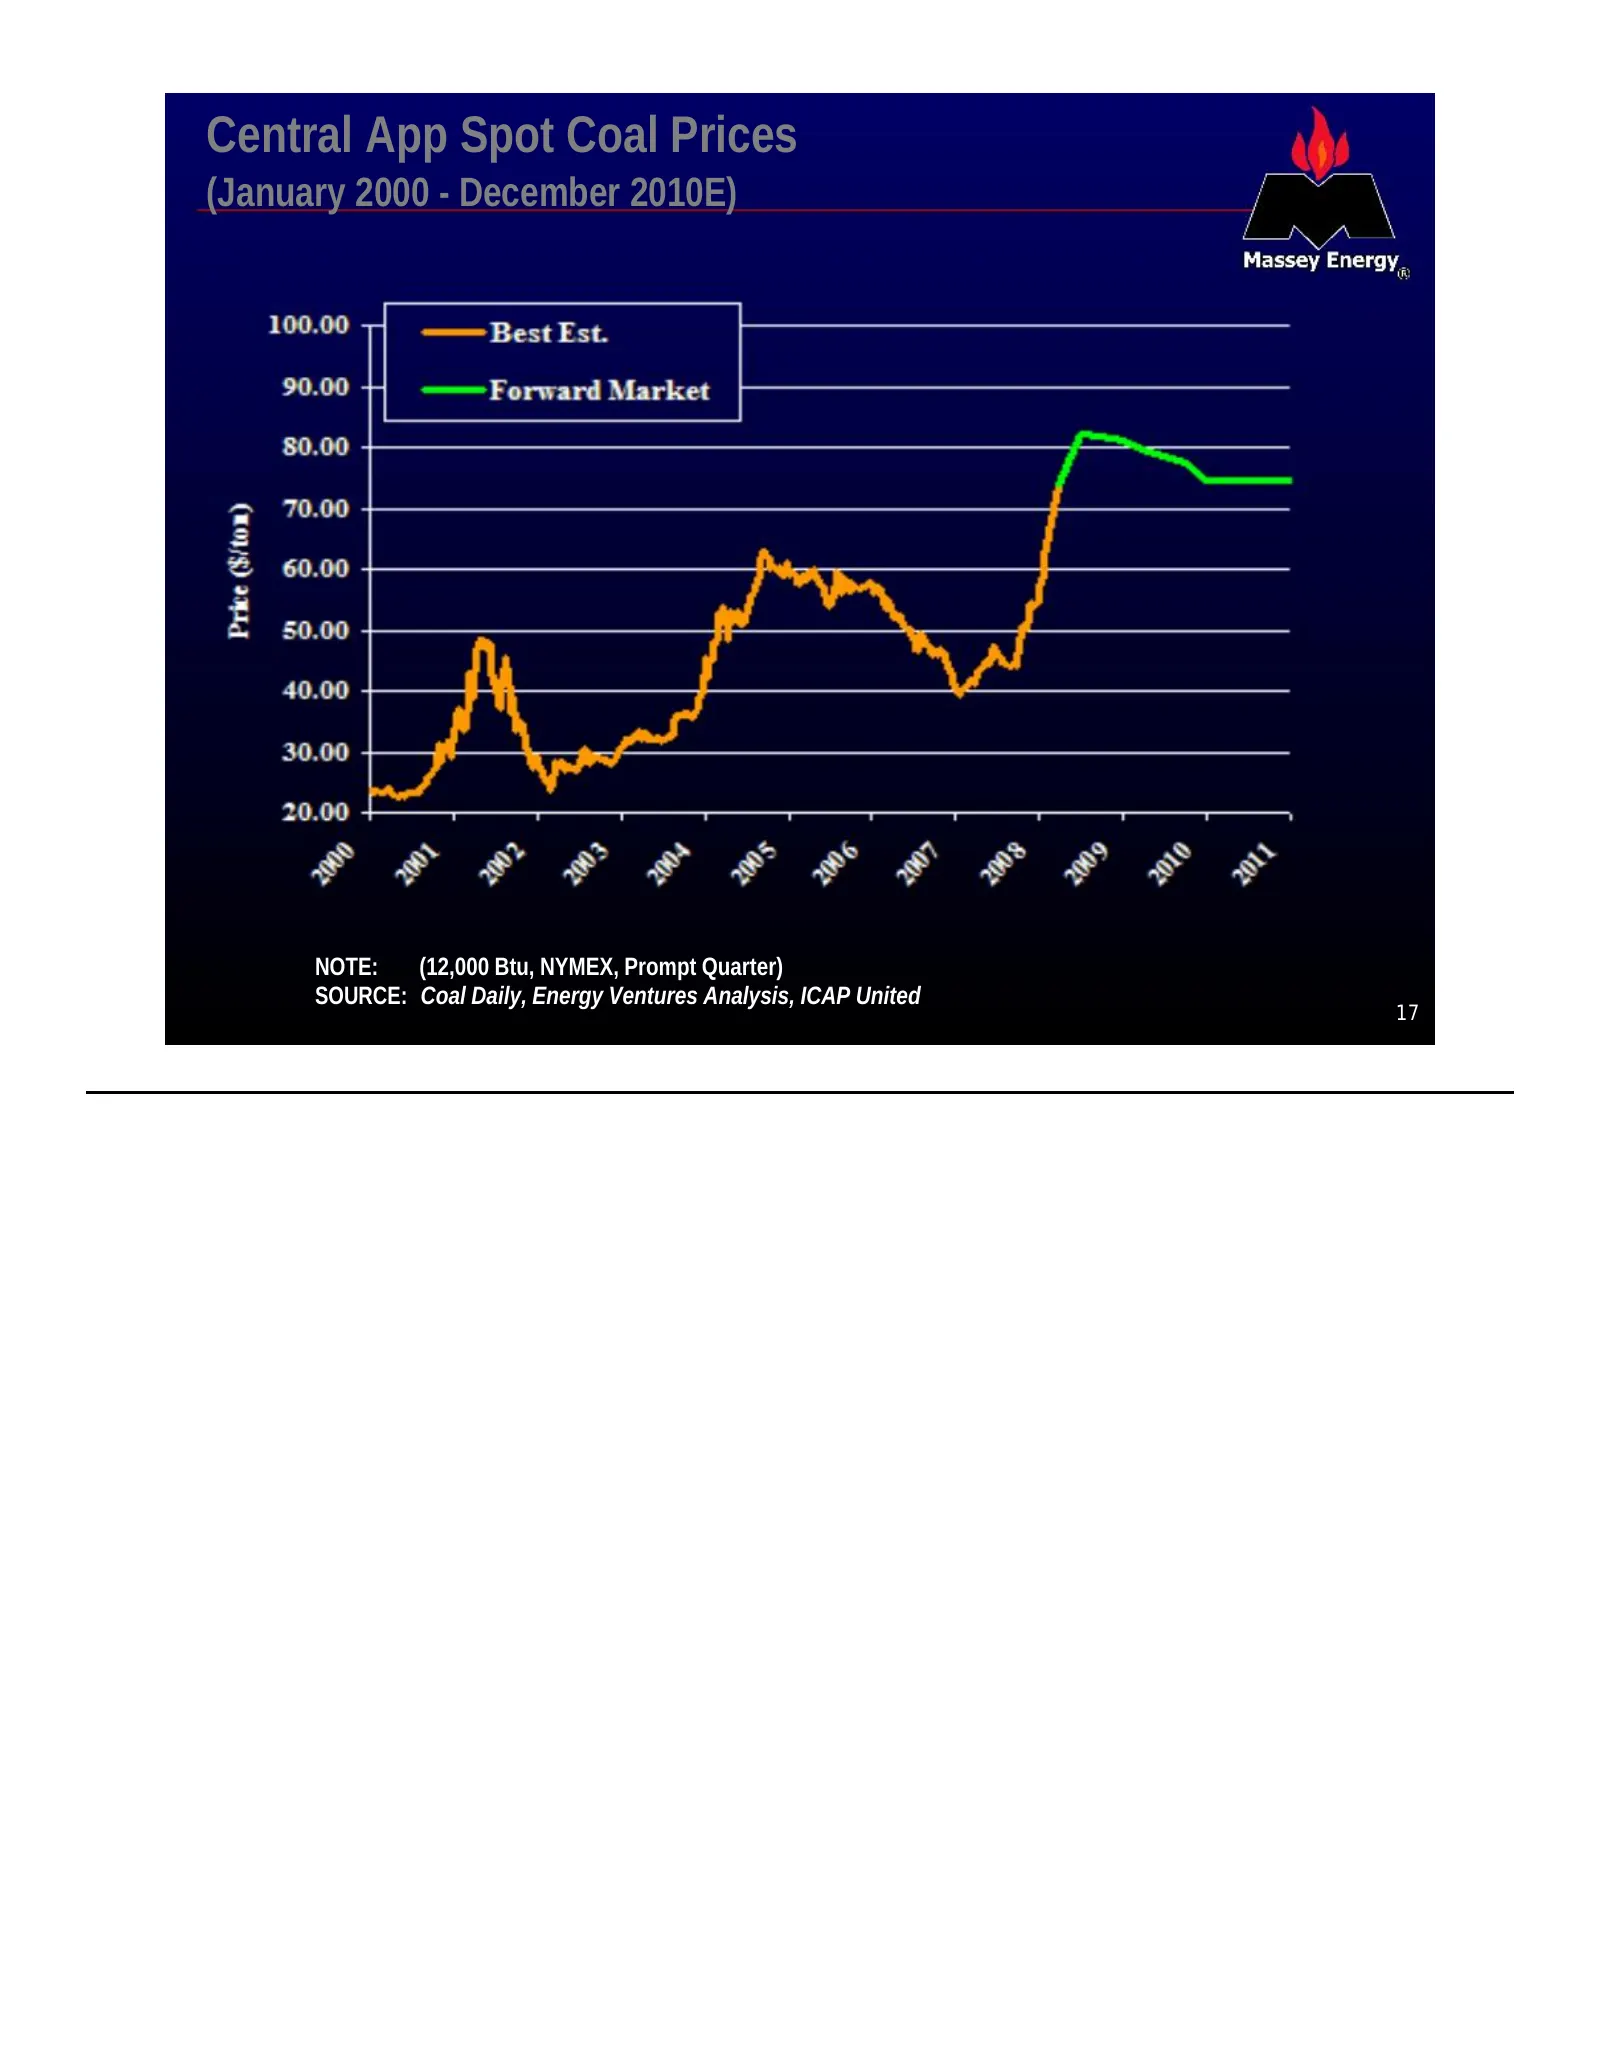
Central App Spot Coal Prices (January 2000 - December 2010E) NOTE: (12,000 Btu, NYMEX, Prompt Quarter) SOURCE: Coal Daily, Energy Ventures Analysis, ICAP United 17
Slide 18: Forward Market - CAPP Steam Coal
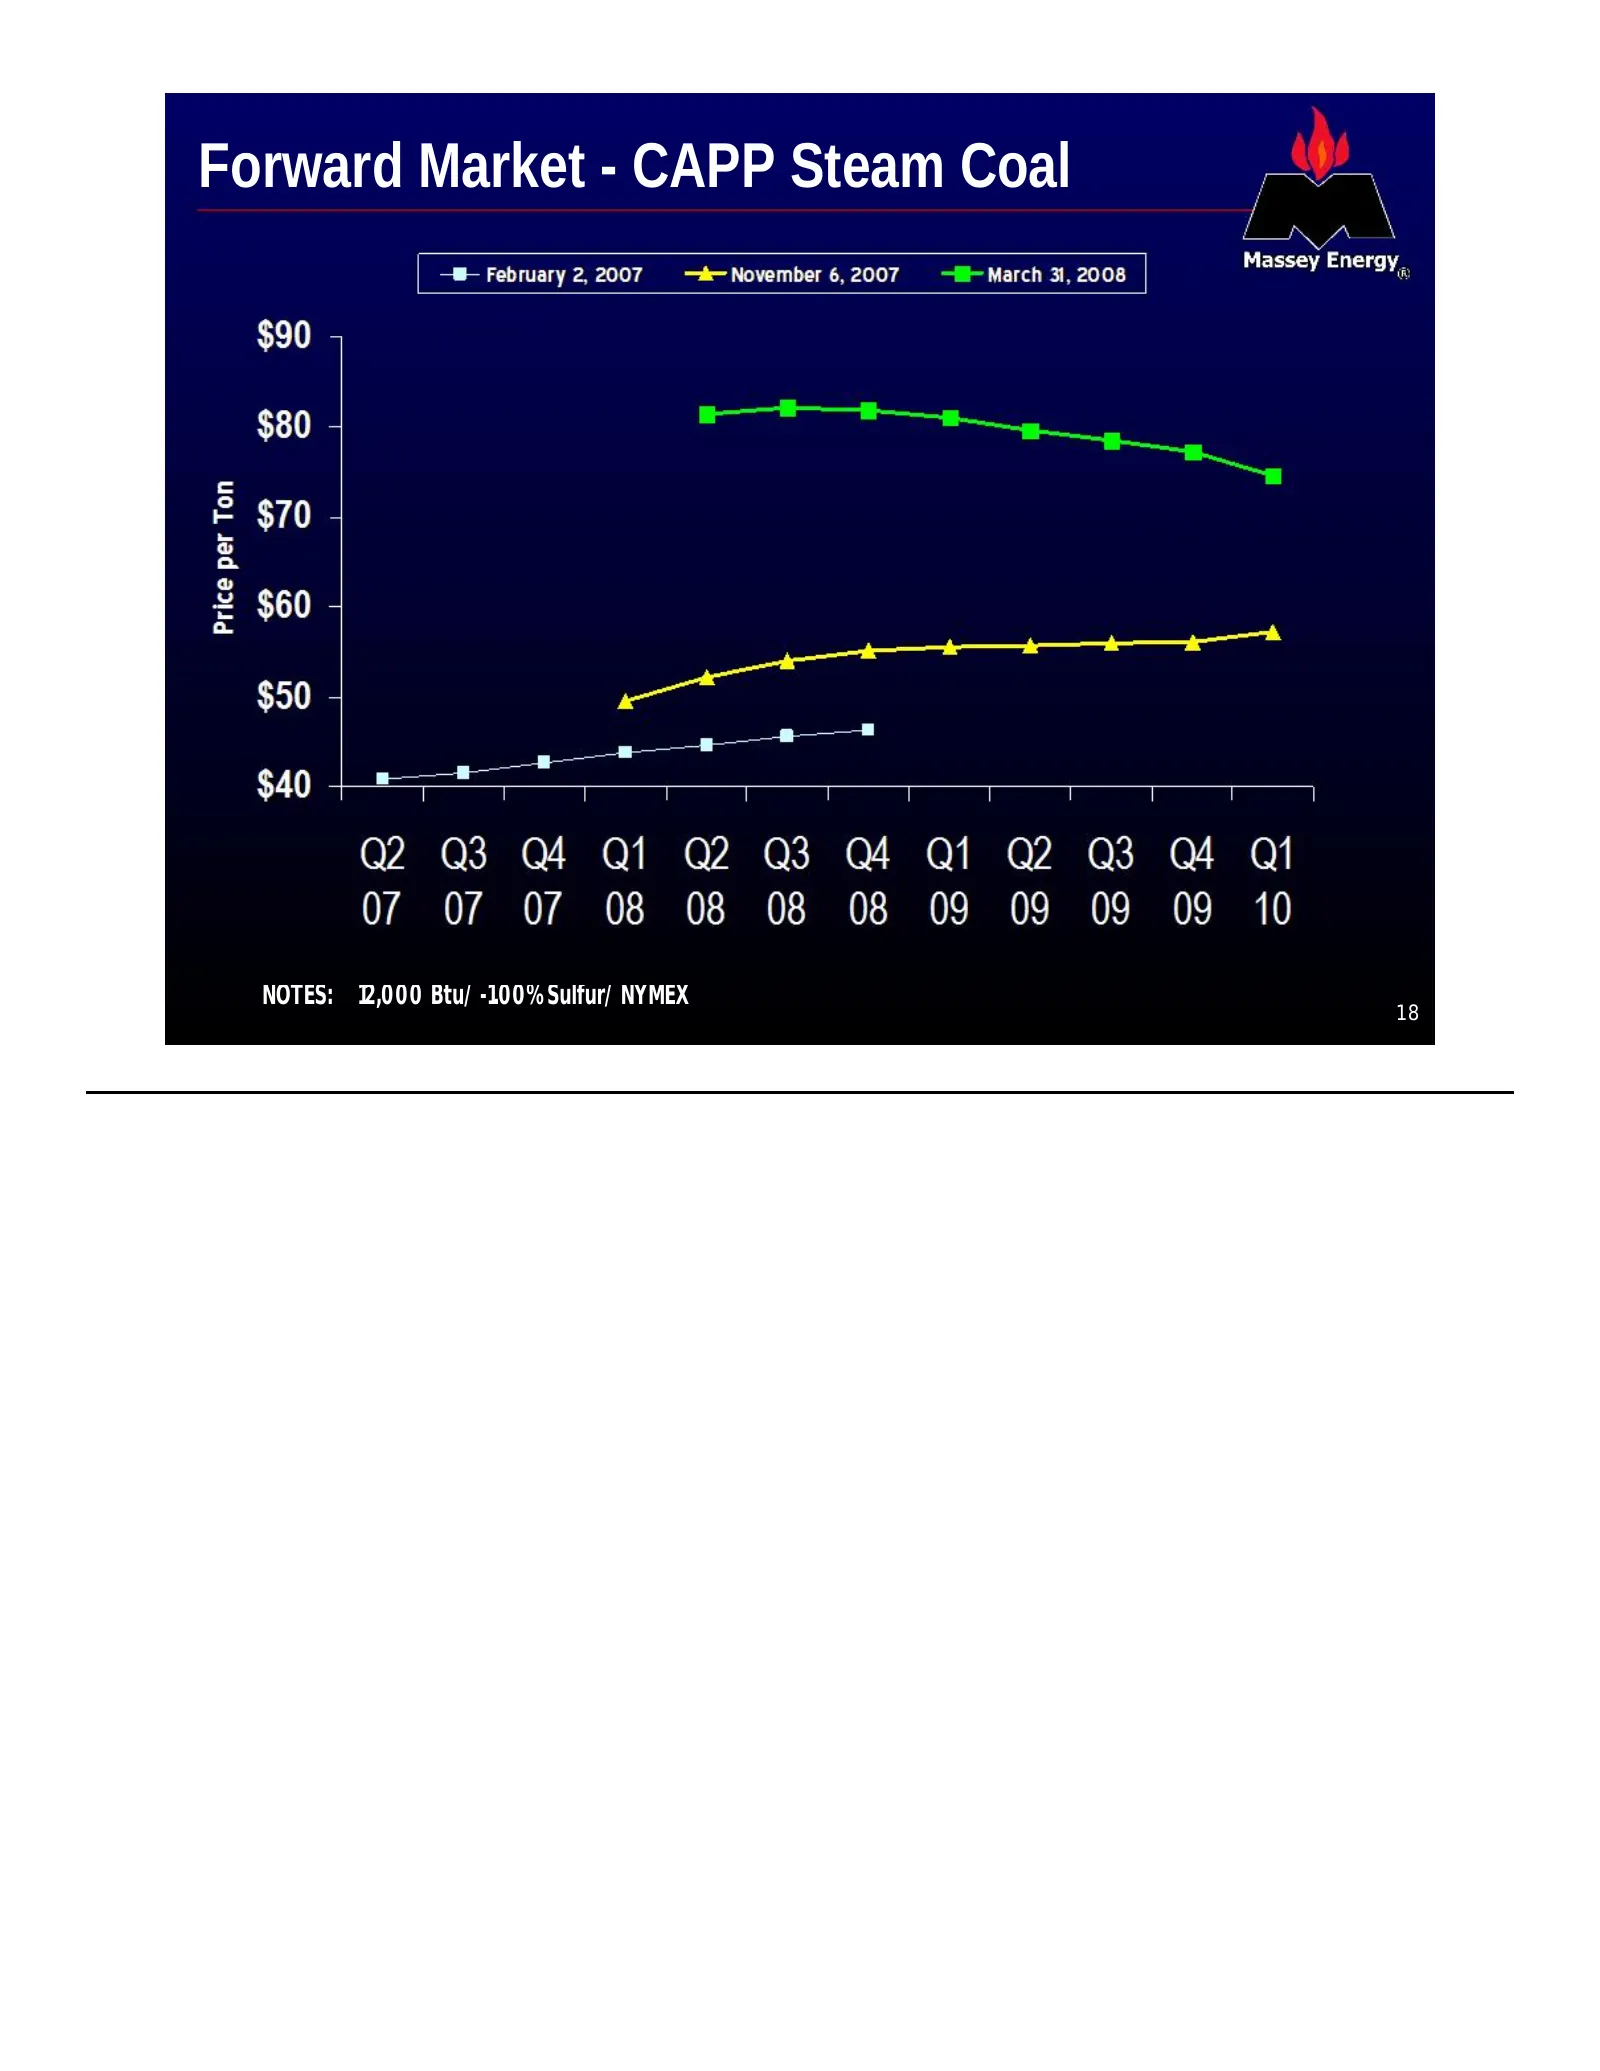
Forward Market - CAPP Steam Coal NOTES: 12,000 Btu/ -1.00% Sulfur/ NYMEX 18
Slide 19: Market Outlook - Metallurgical Coal
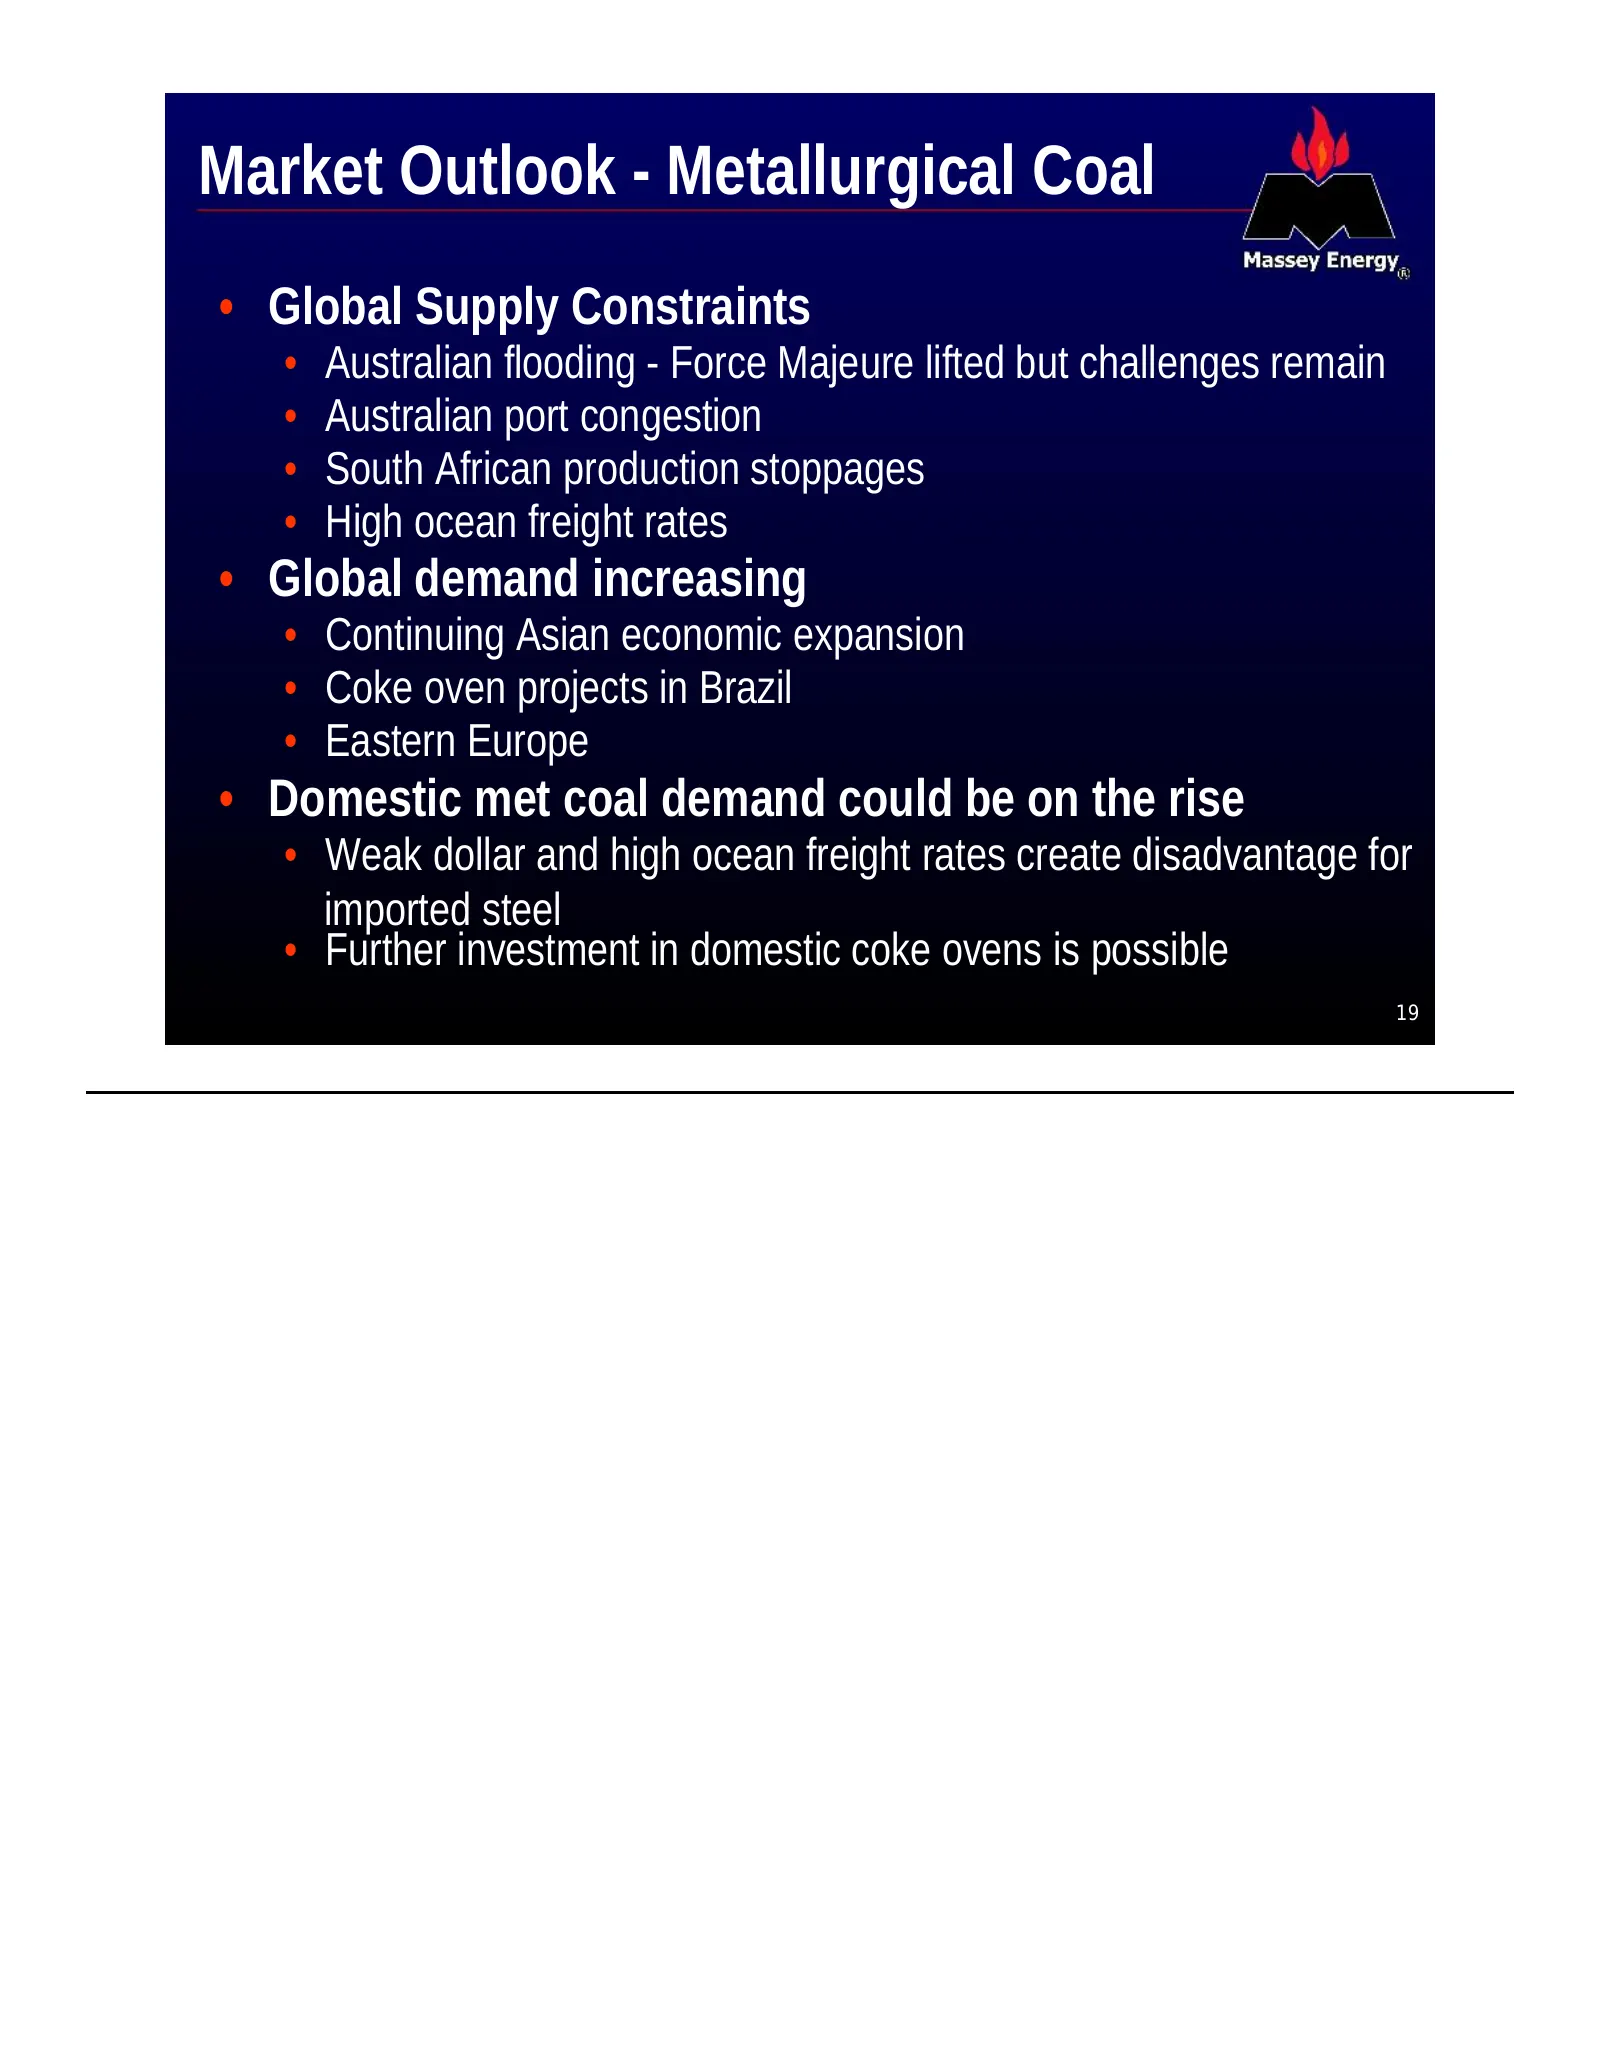
Market Outlook - Metallurgical Coal • Global Supply Constraints • Australian flooding - Force Majeure lifted but challenges remain • Australian port congestion • South African production stoppages • High ocean freight rates • Global demand increasing • Continuing Asian economic expansion • Coke oven
Slide 20: World Steel Production
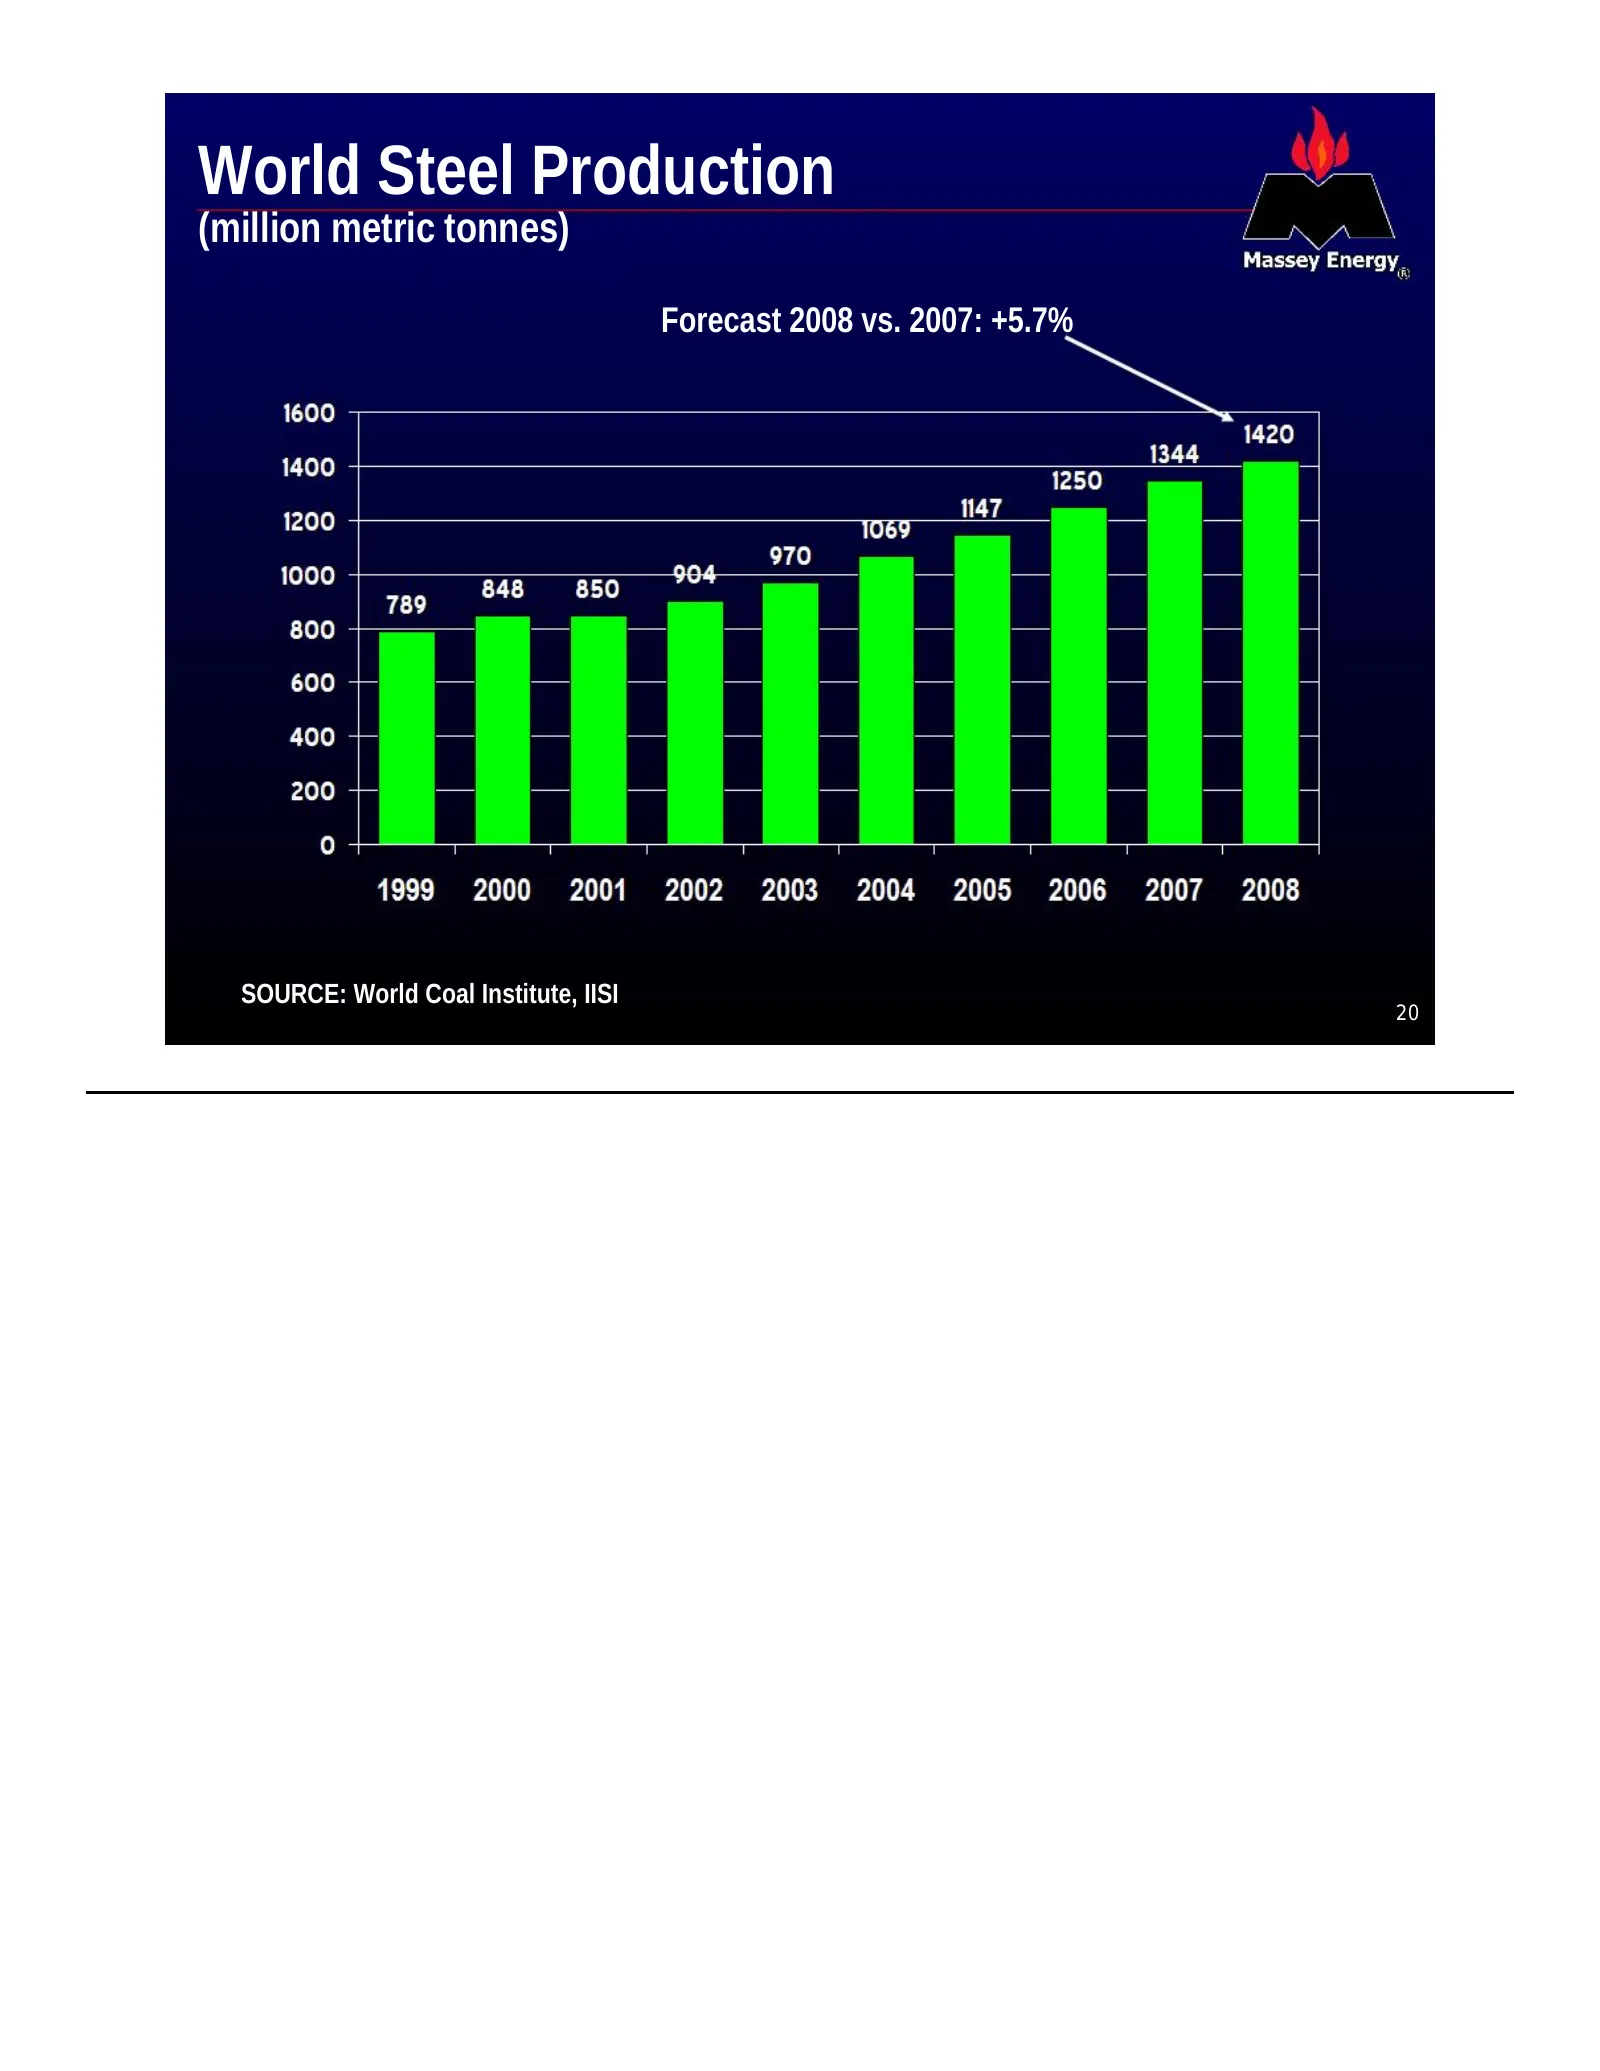
World Steel Production (million metric tonnes) Forecast 2008 vs. 2007: +5.7% SOURCE: World Coal Institute, IISI 20
Slide 21: Met Coal Pricing
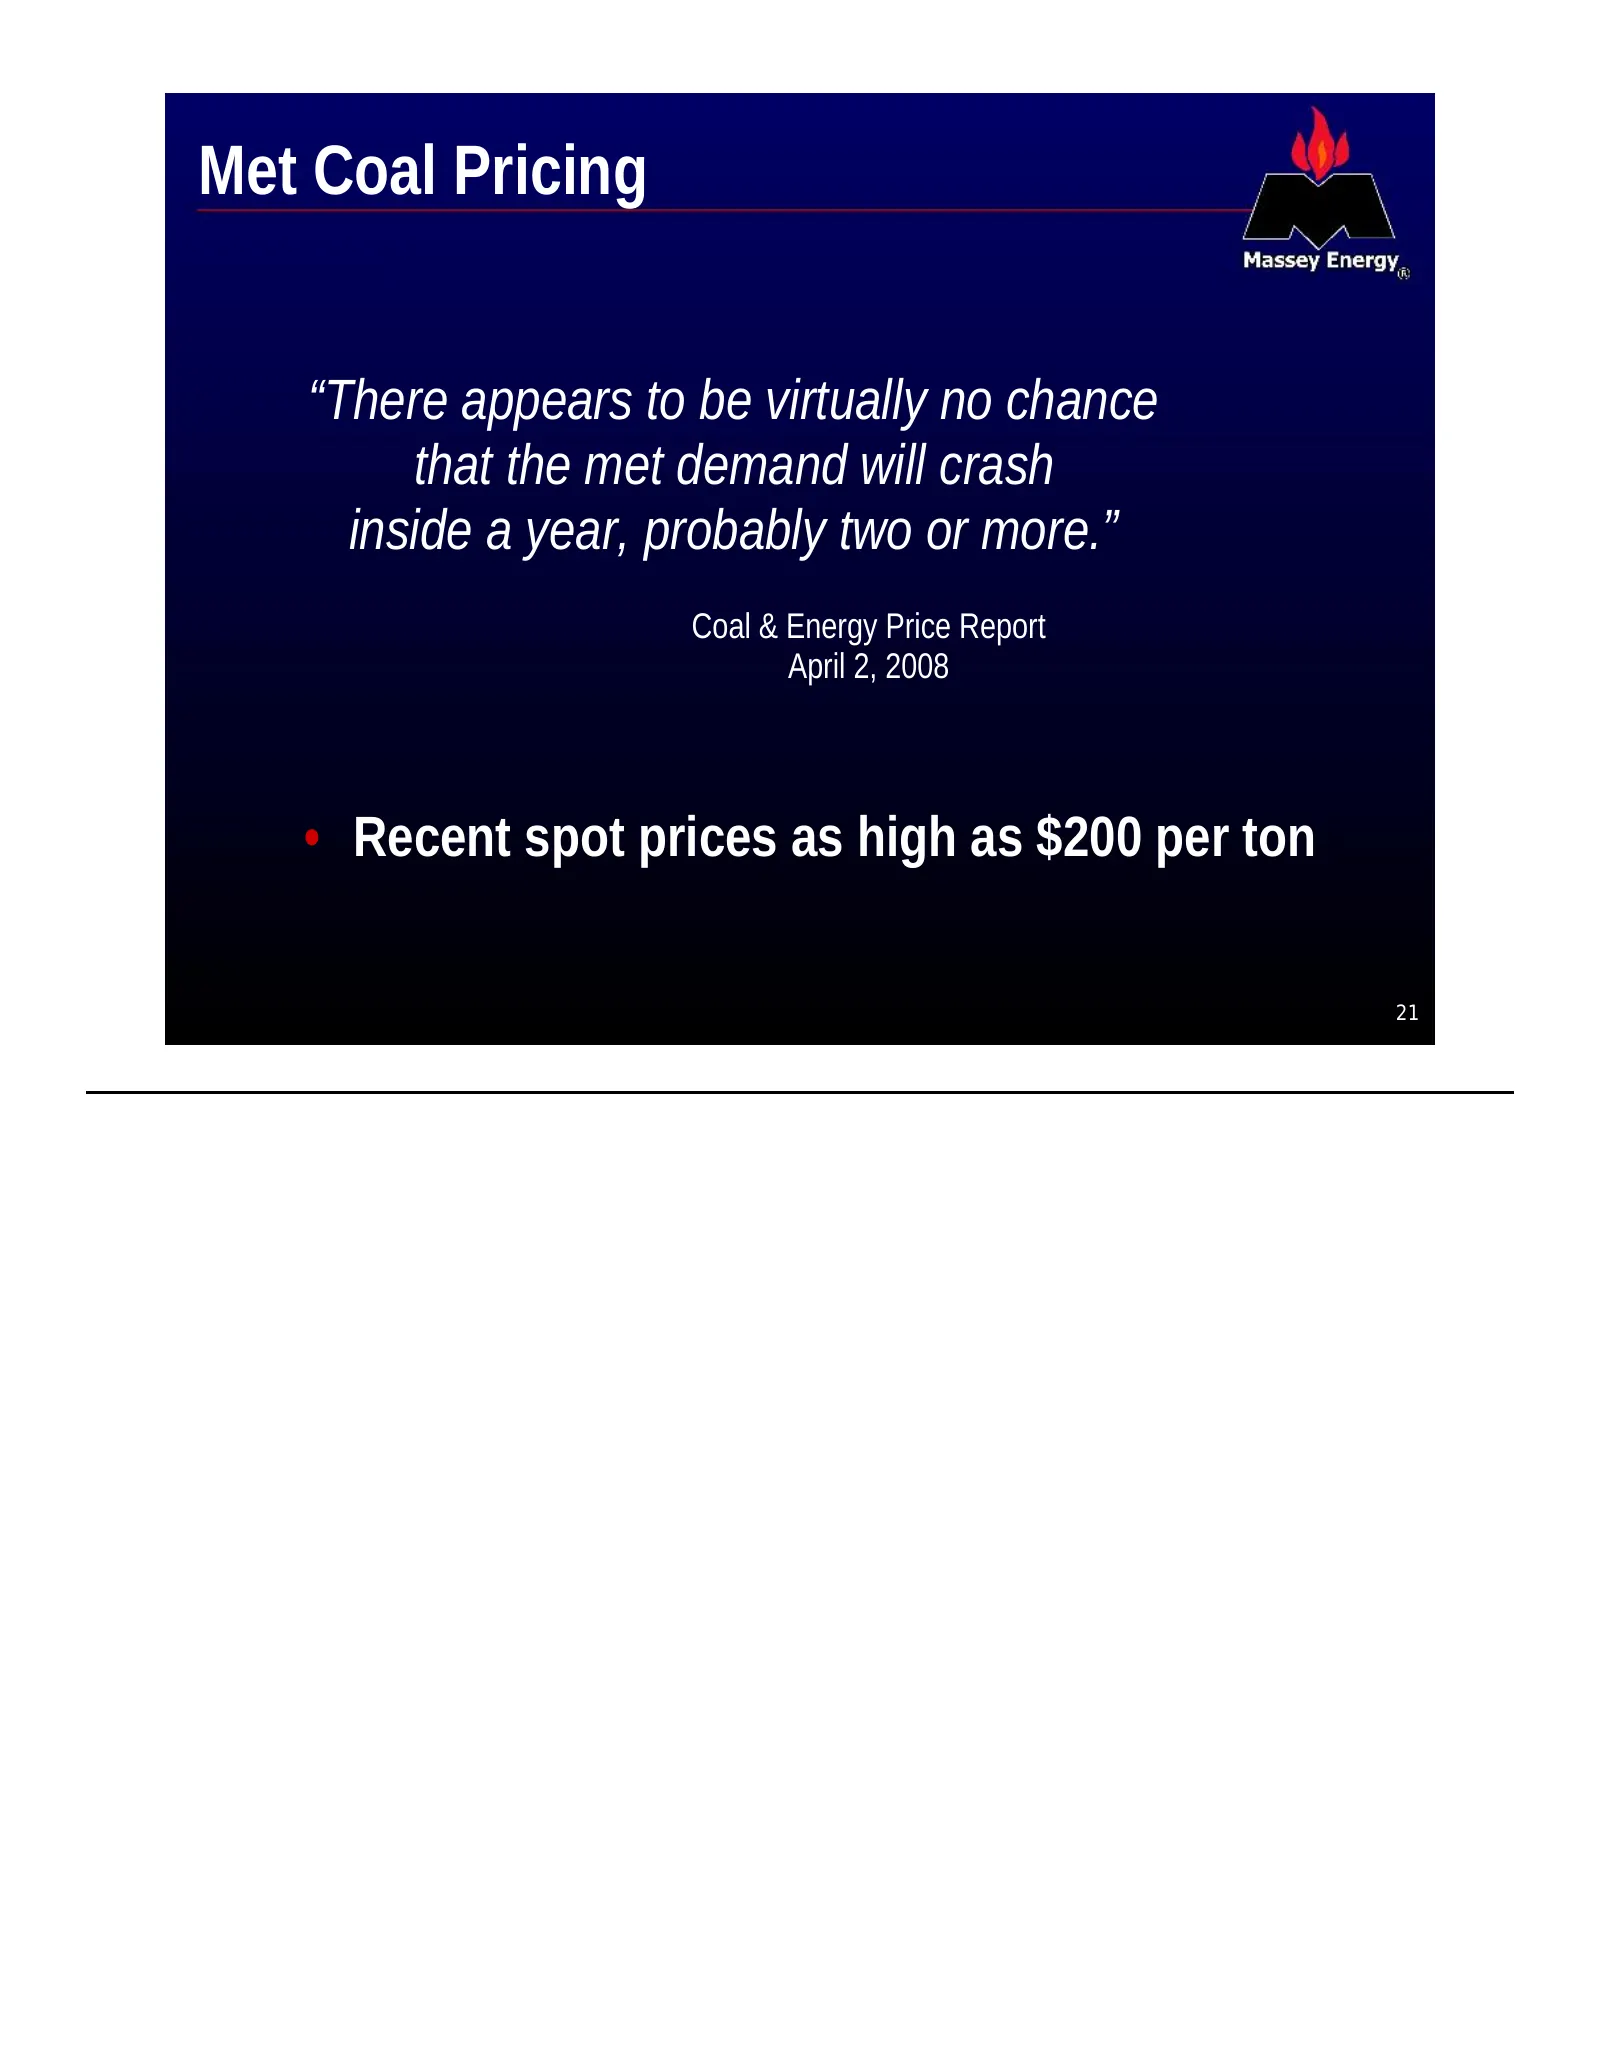
Met Coal Pricing “There appears to be virtually no chance that the met demand will crash inside a year, probably two or more.” Coal & Energy Price Report April 2, 2008 • Recent spot prices as high as $200 per ton 21

Slide 22: Massey Opportunities
abs Massey Energy. Massey Opportunities
Slide 23: Expansion Plan
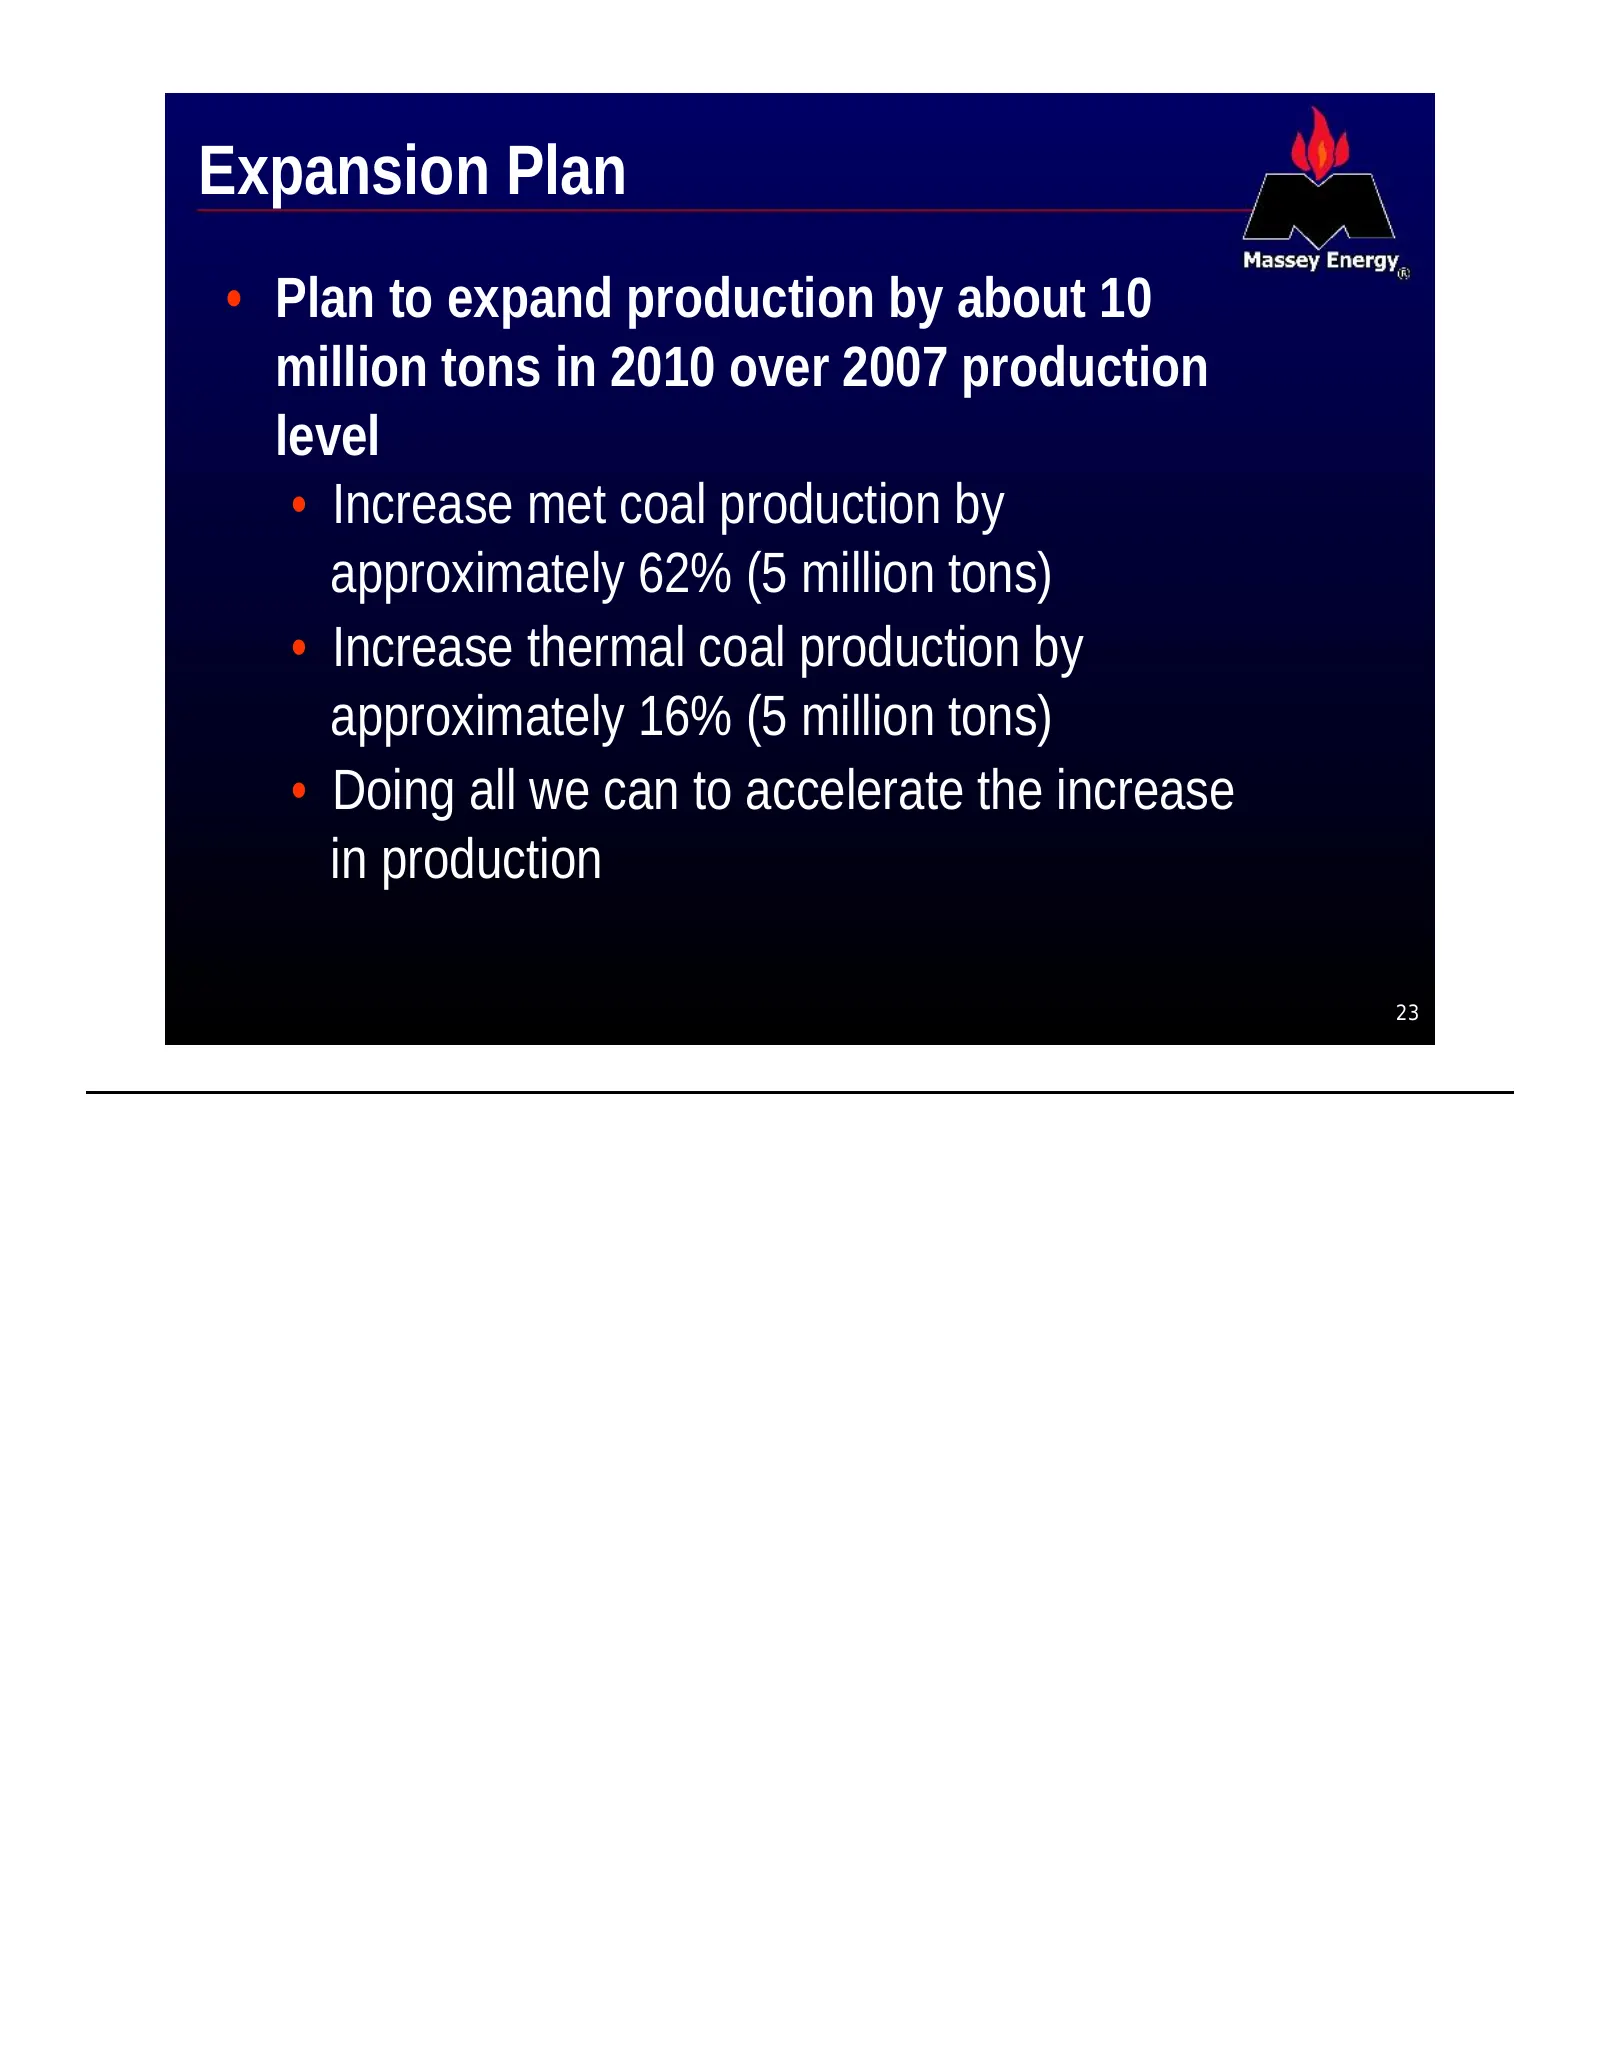
Expansion Plan • Plan to expand production by about 10 million tons in 2010 over 2007 production level • Increase met coal production by approximately 62% (5 million tons) • Increase thermal coal production by approximately 16% (5 million tons) • Doing all we can to accelerate the increase in produc
Slide 24: Expansion Plan - Update
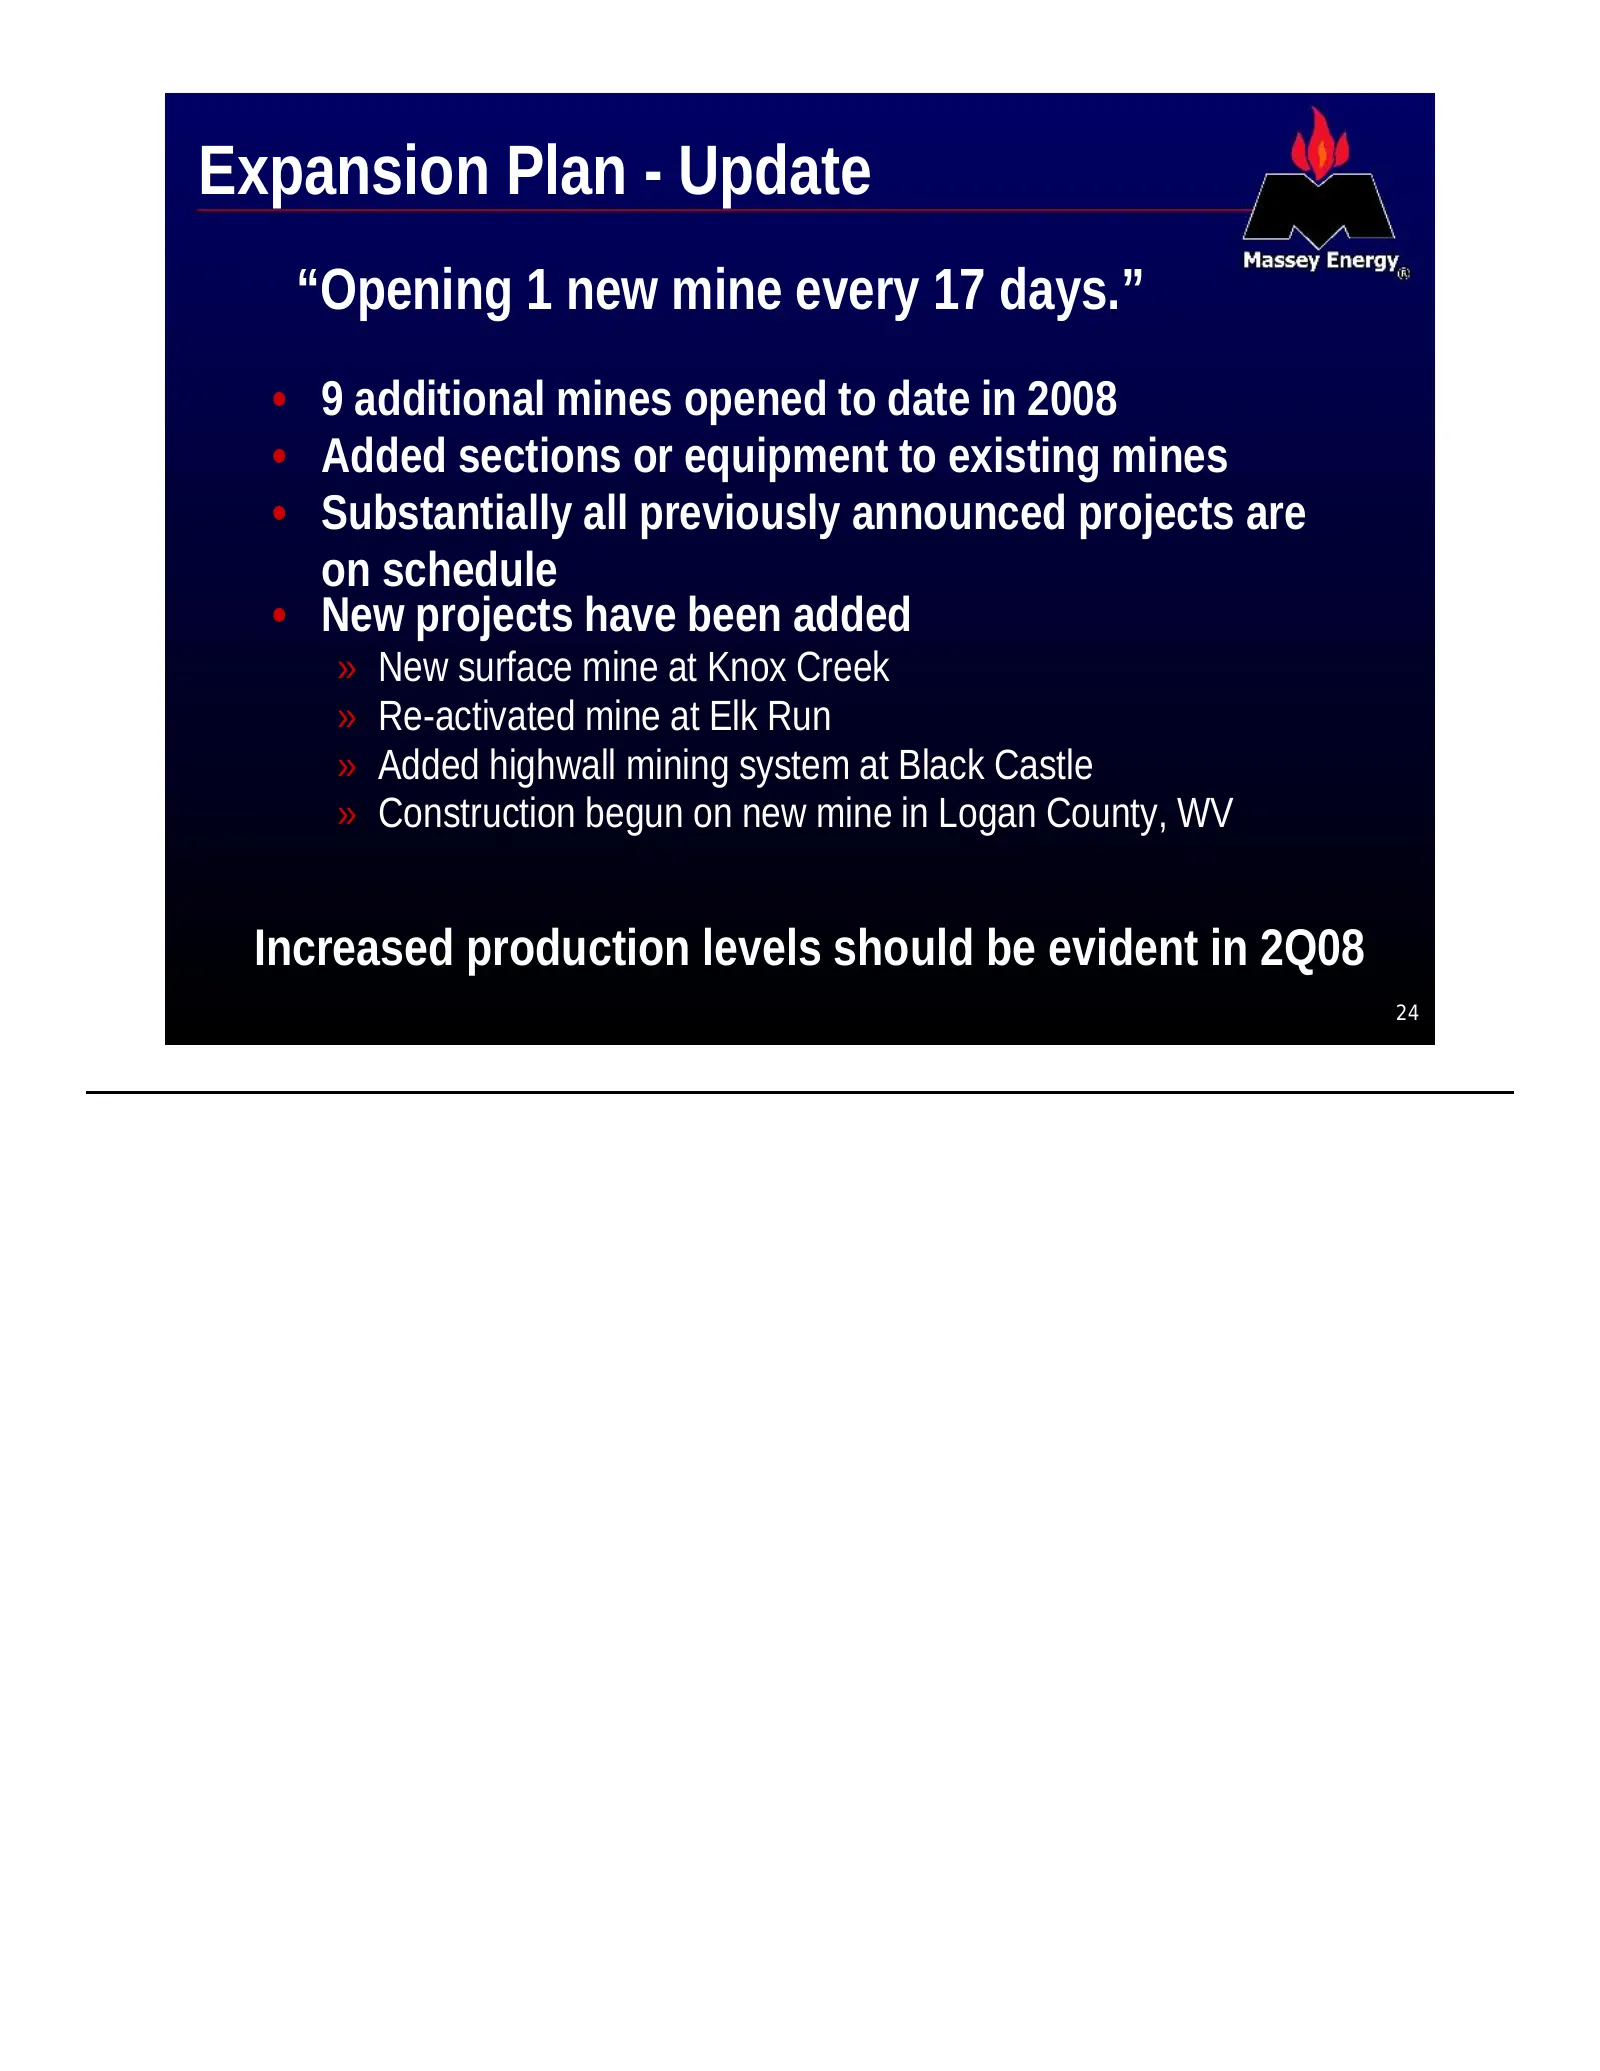
Expansion Plan - Update “Opening 1 new mine every 17 days.” • 9 additional mines opened to date in 2008 • Added sections or equipment to existing mines • Substantially all previously announced projects are on schedule • New projects have been added » New surface mine at Knox Creek » Re-activated min
Slide 25: Expansion - Mammoth Coal Load-out
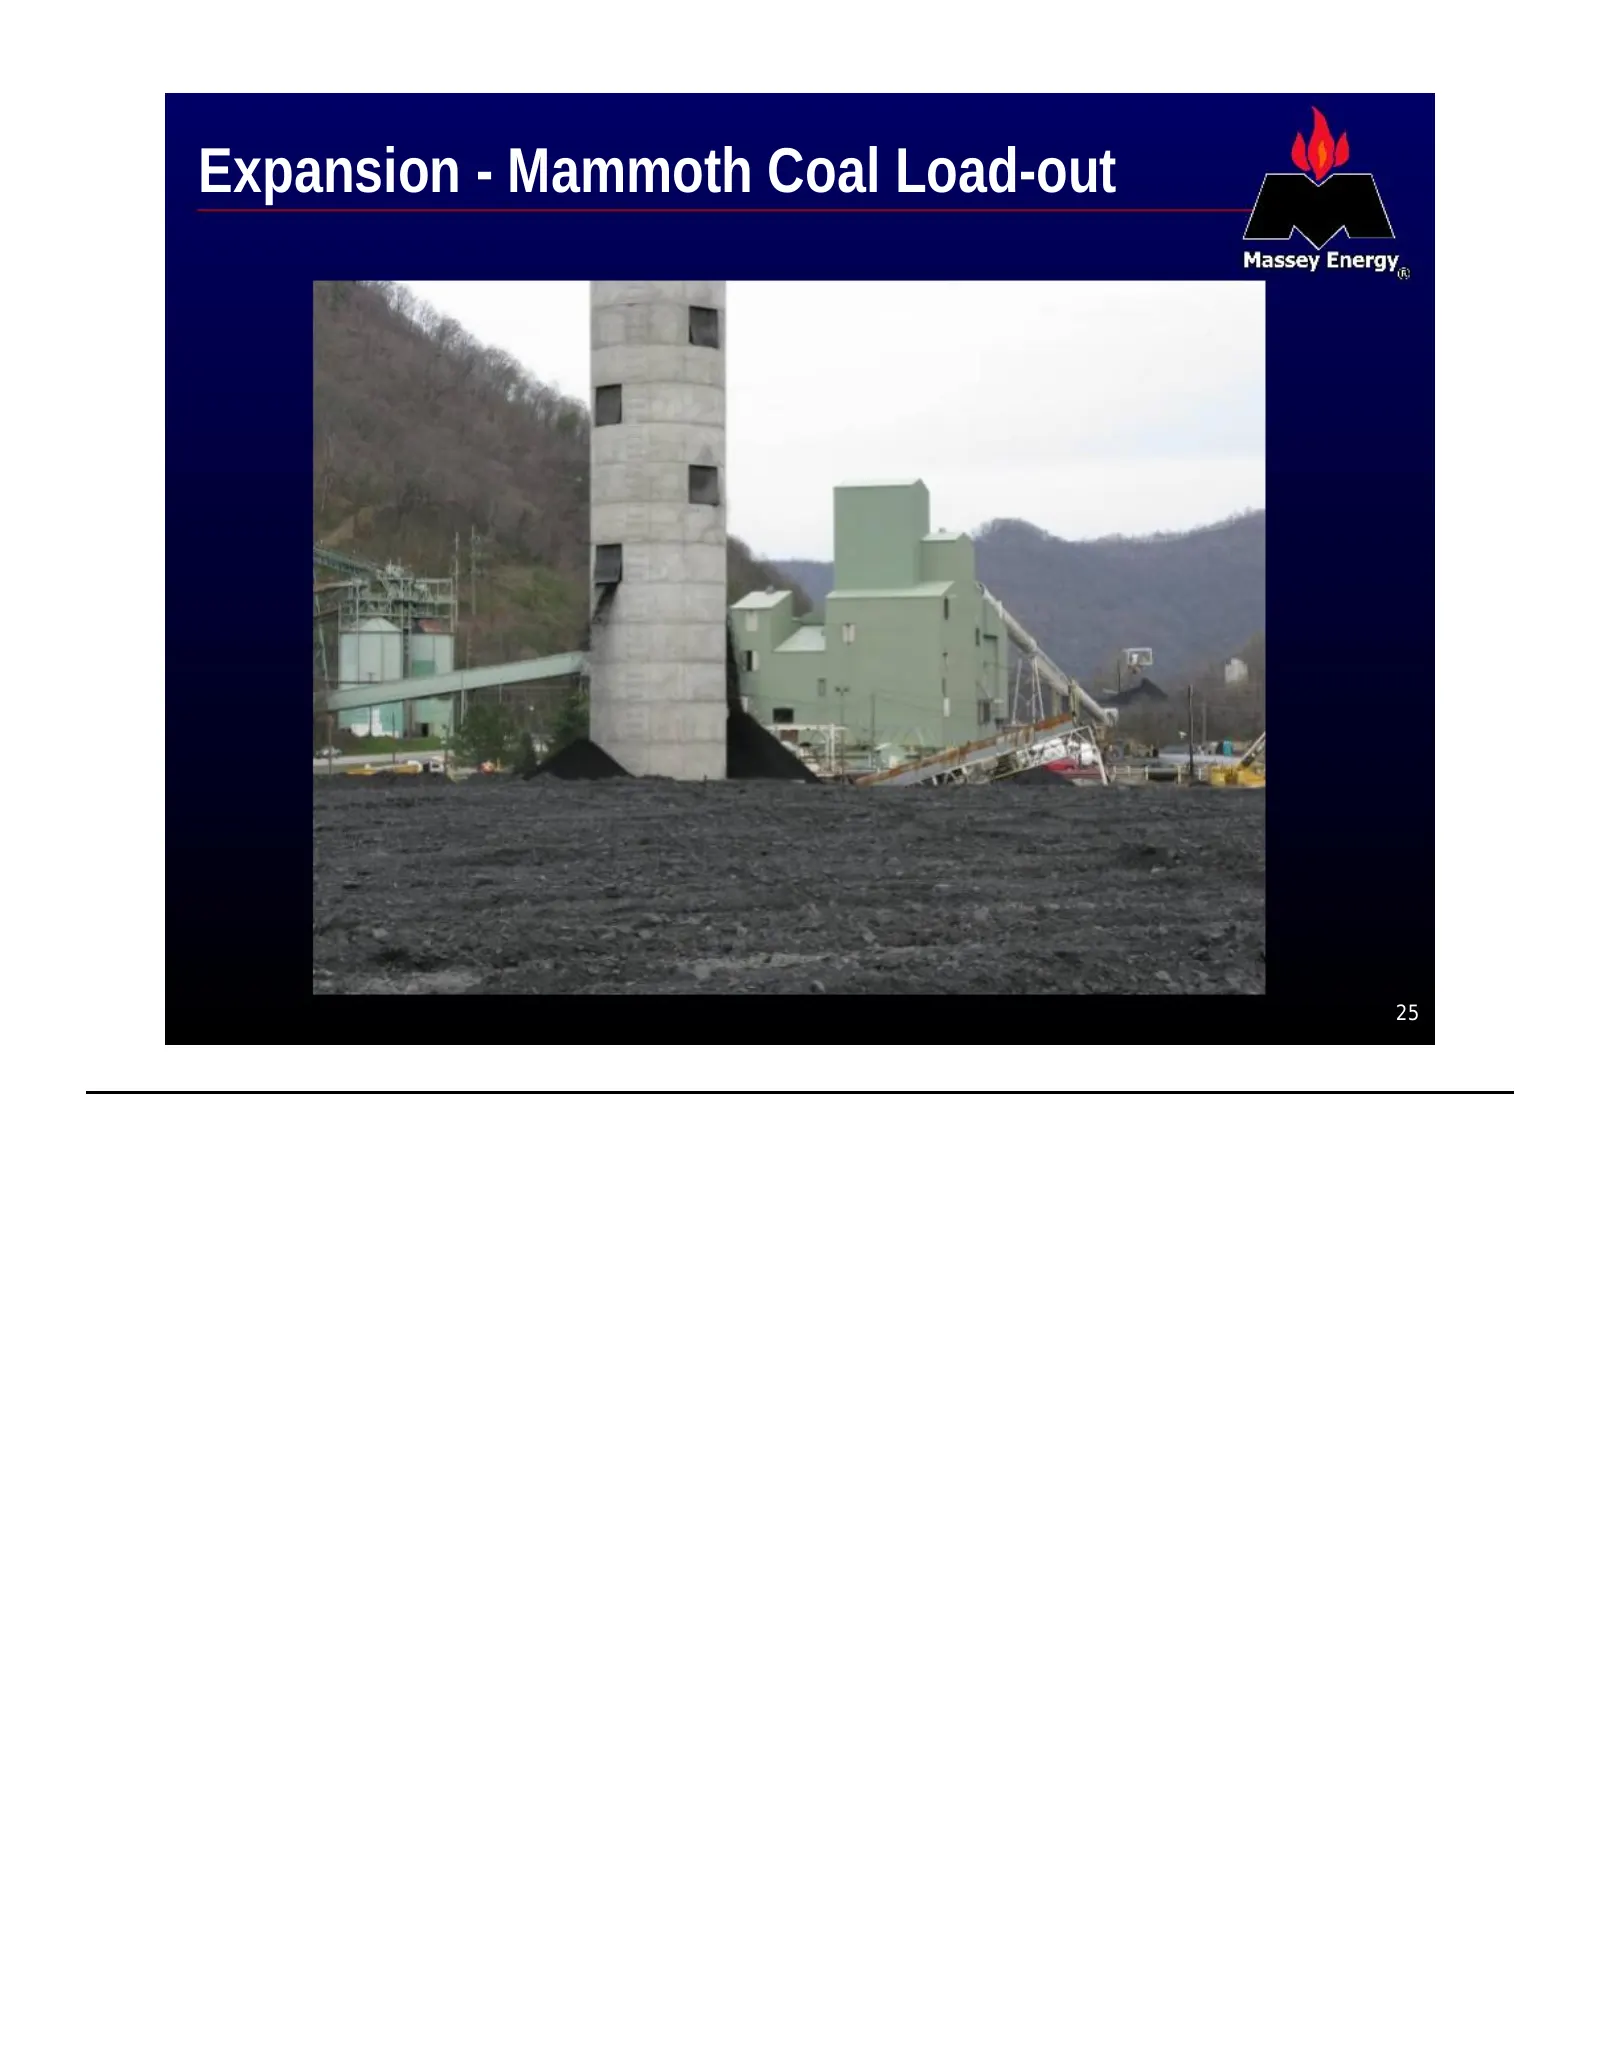
Expansion - Mammoth Coal Load-out 25
Slide 26: Expansion - Mammoth Coal Load-out
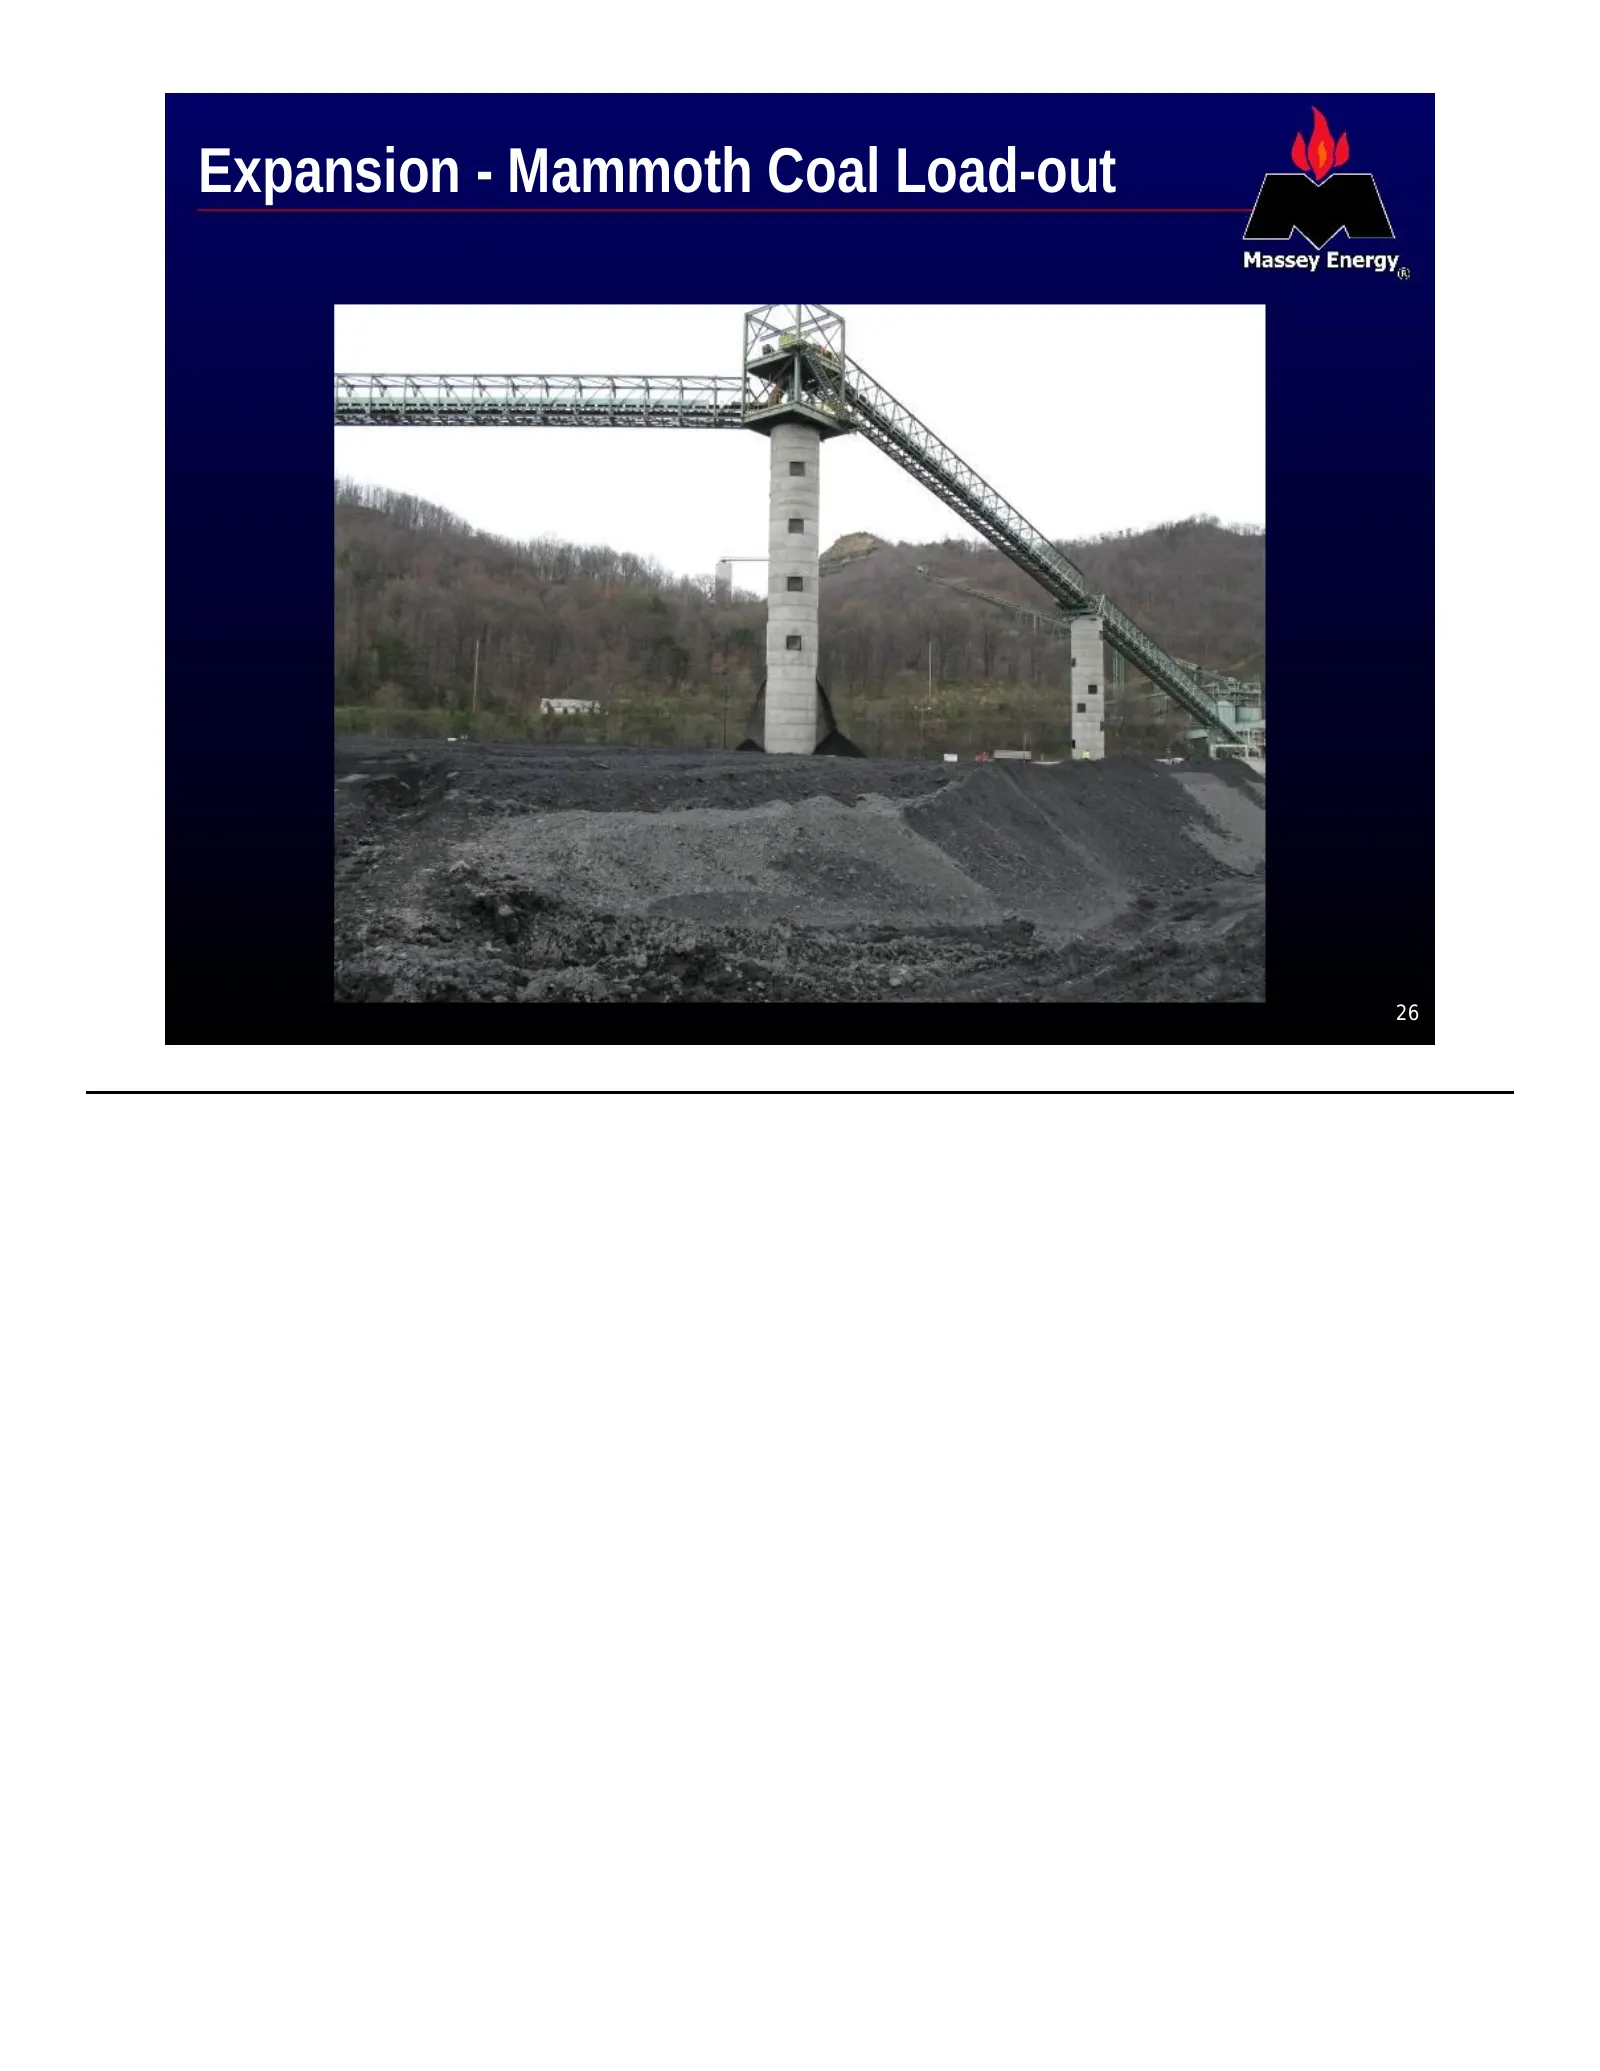
Expansion - Mammoth Coal Load-out 26
Slide 27: Expansion - Inman Coal Company
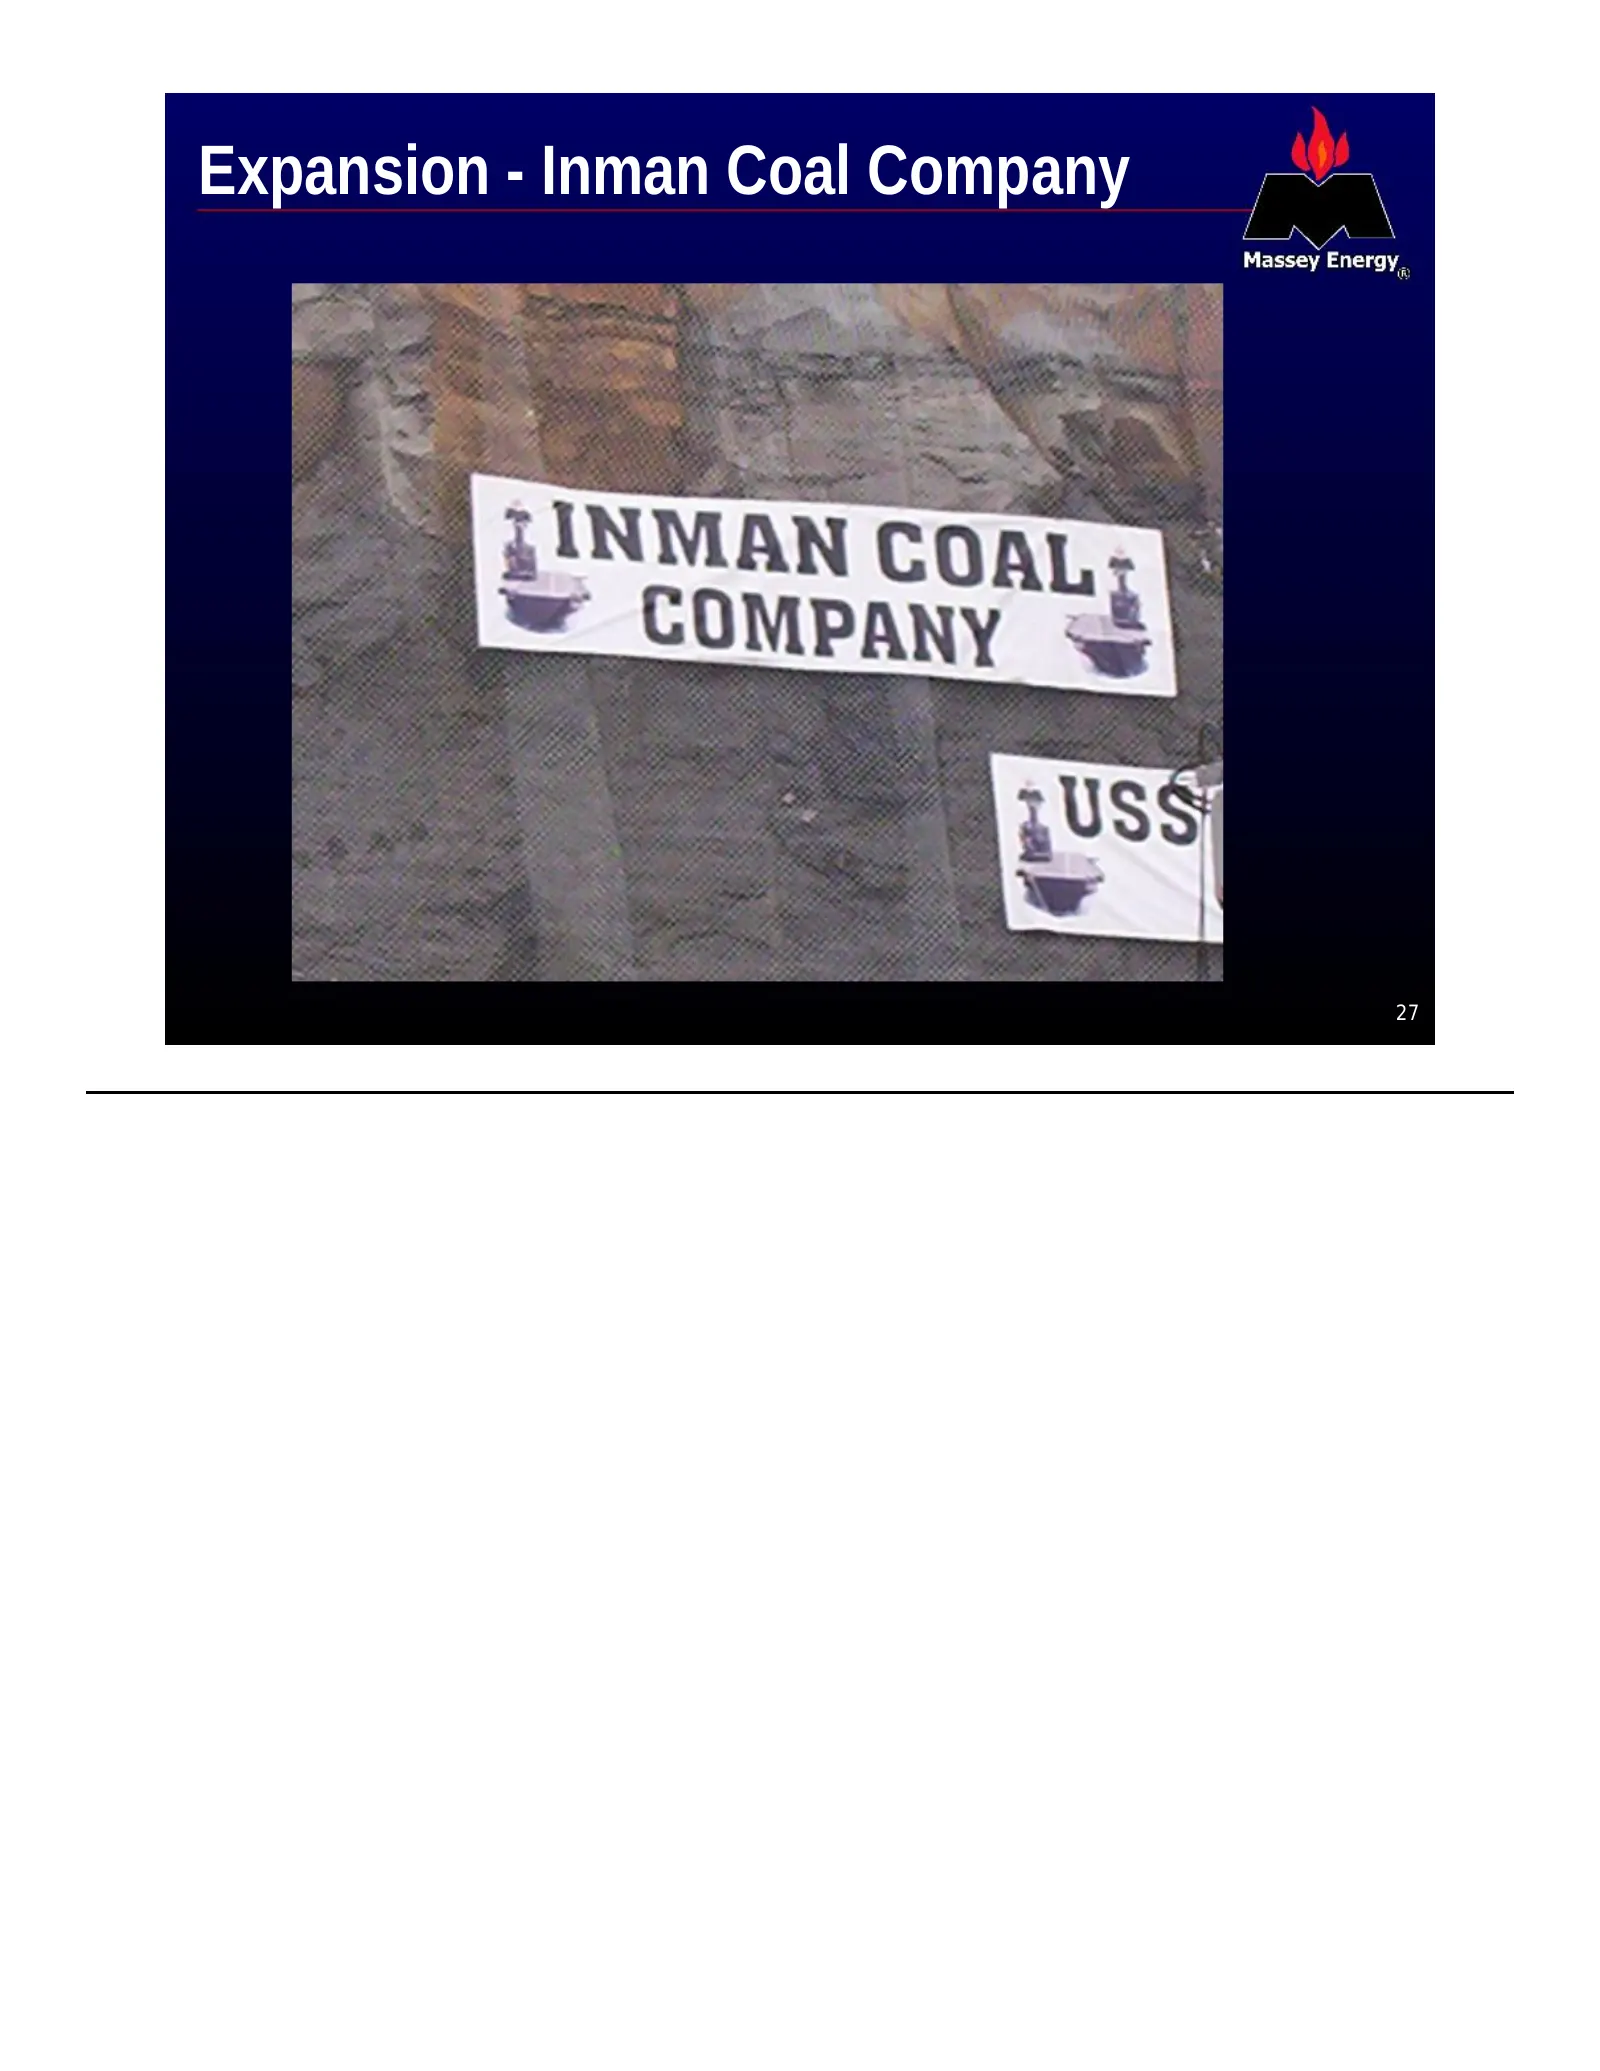
Expansion - Inman Coal Company 27
Slide 28: Expansion - Inman Coal Company
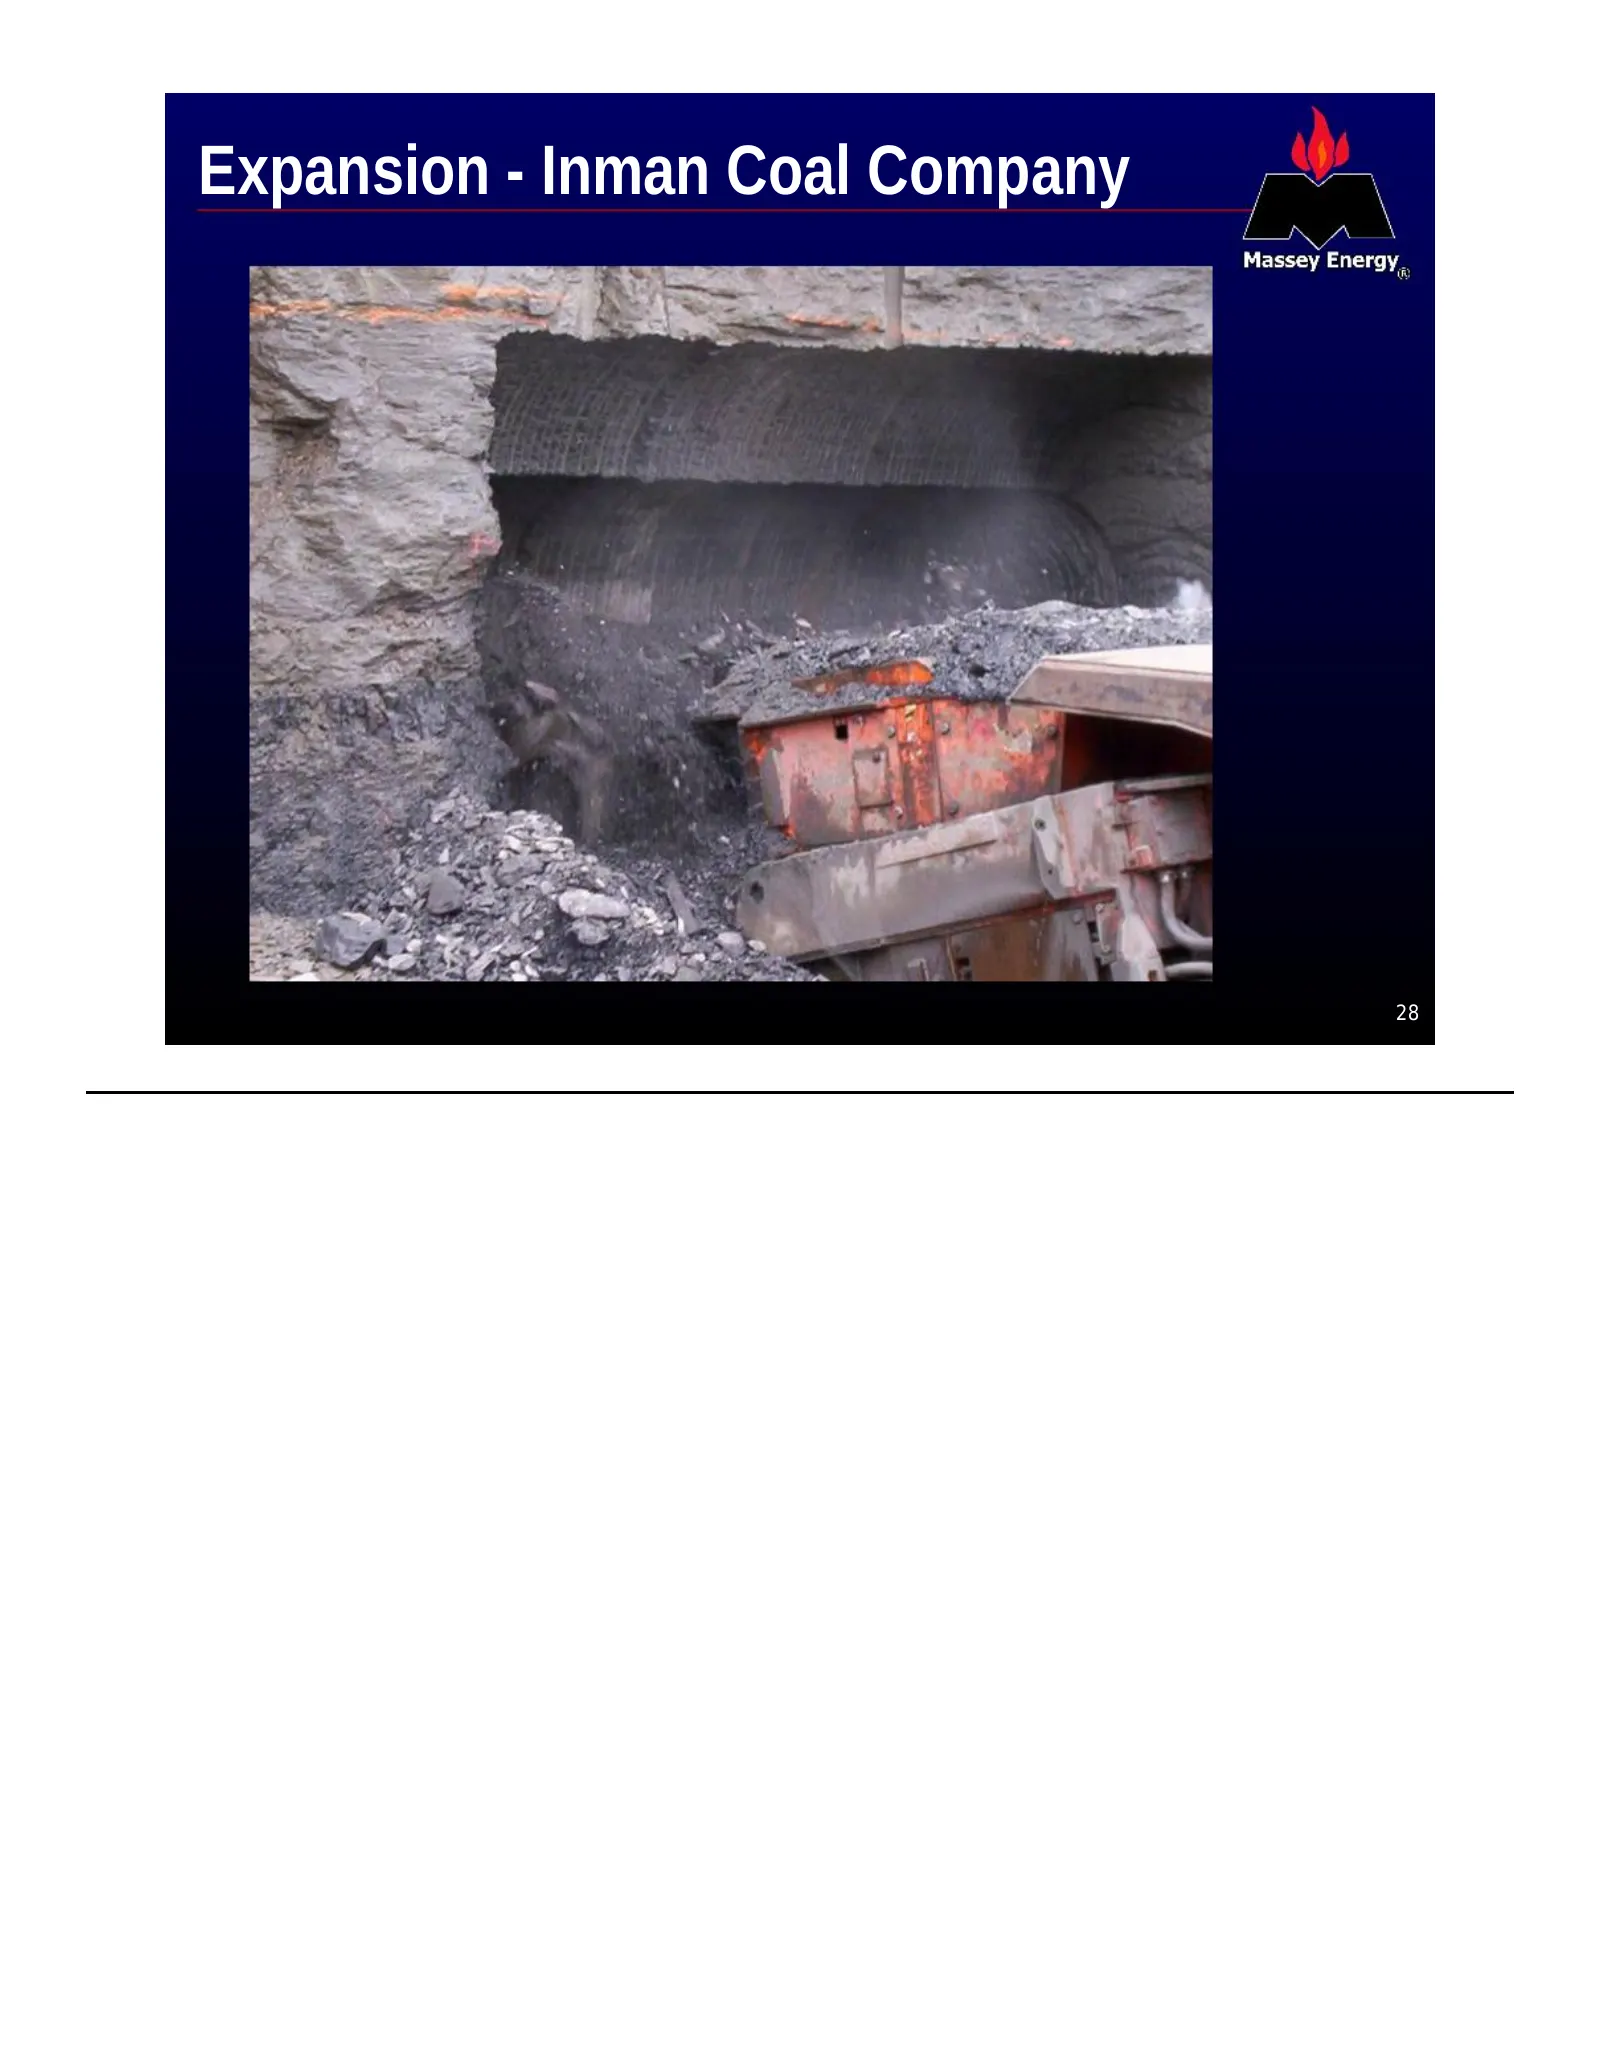
Expansion - Inman Coal Company 28
Slide 29: Expansion - Inman Coal Company
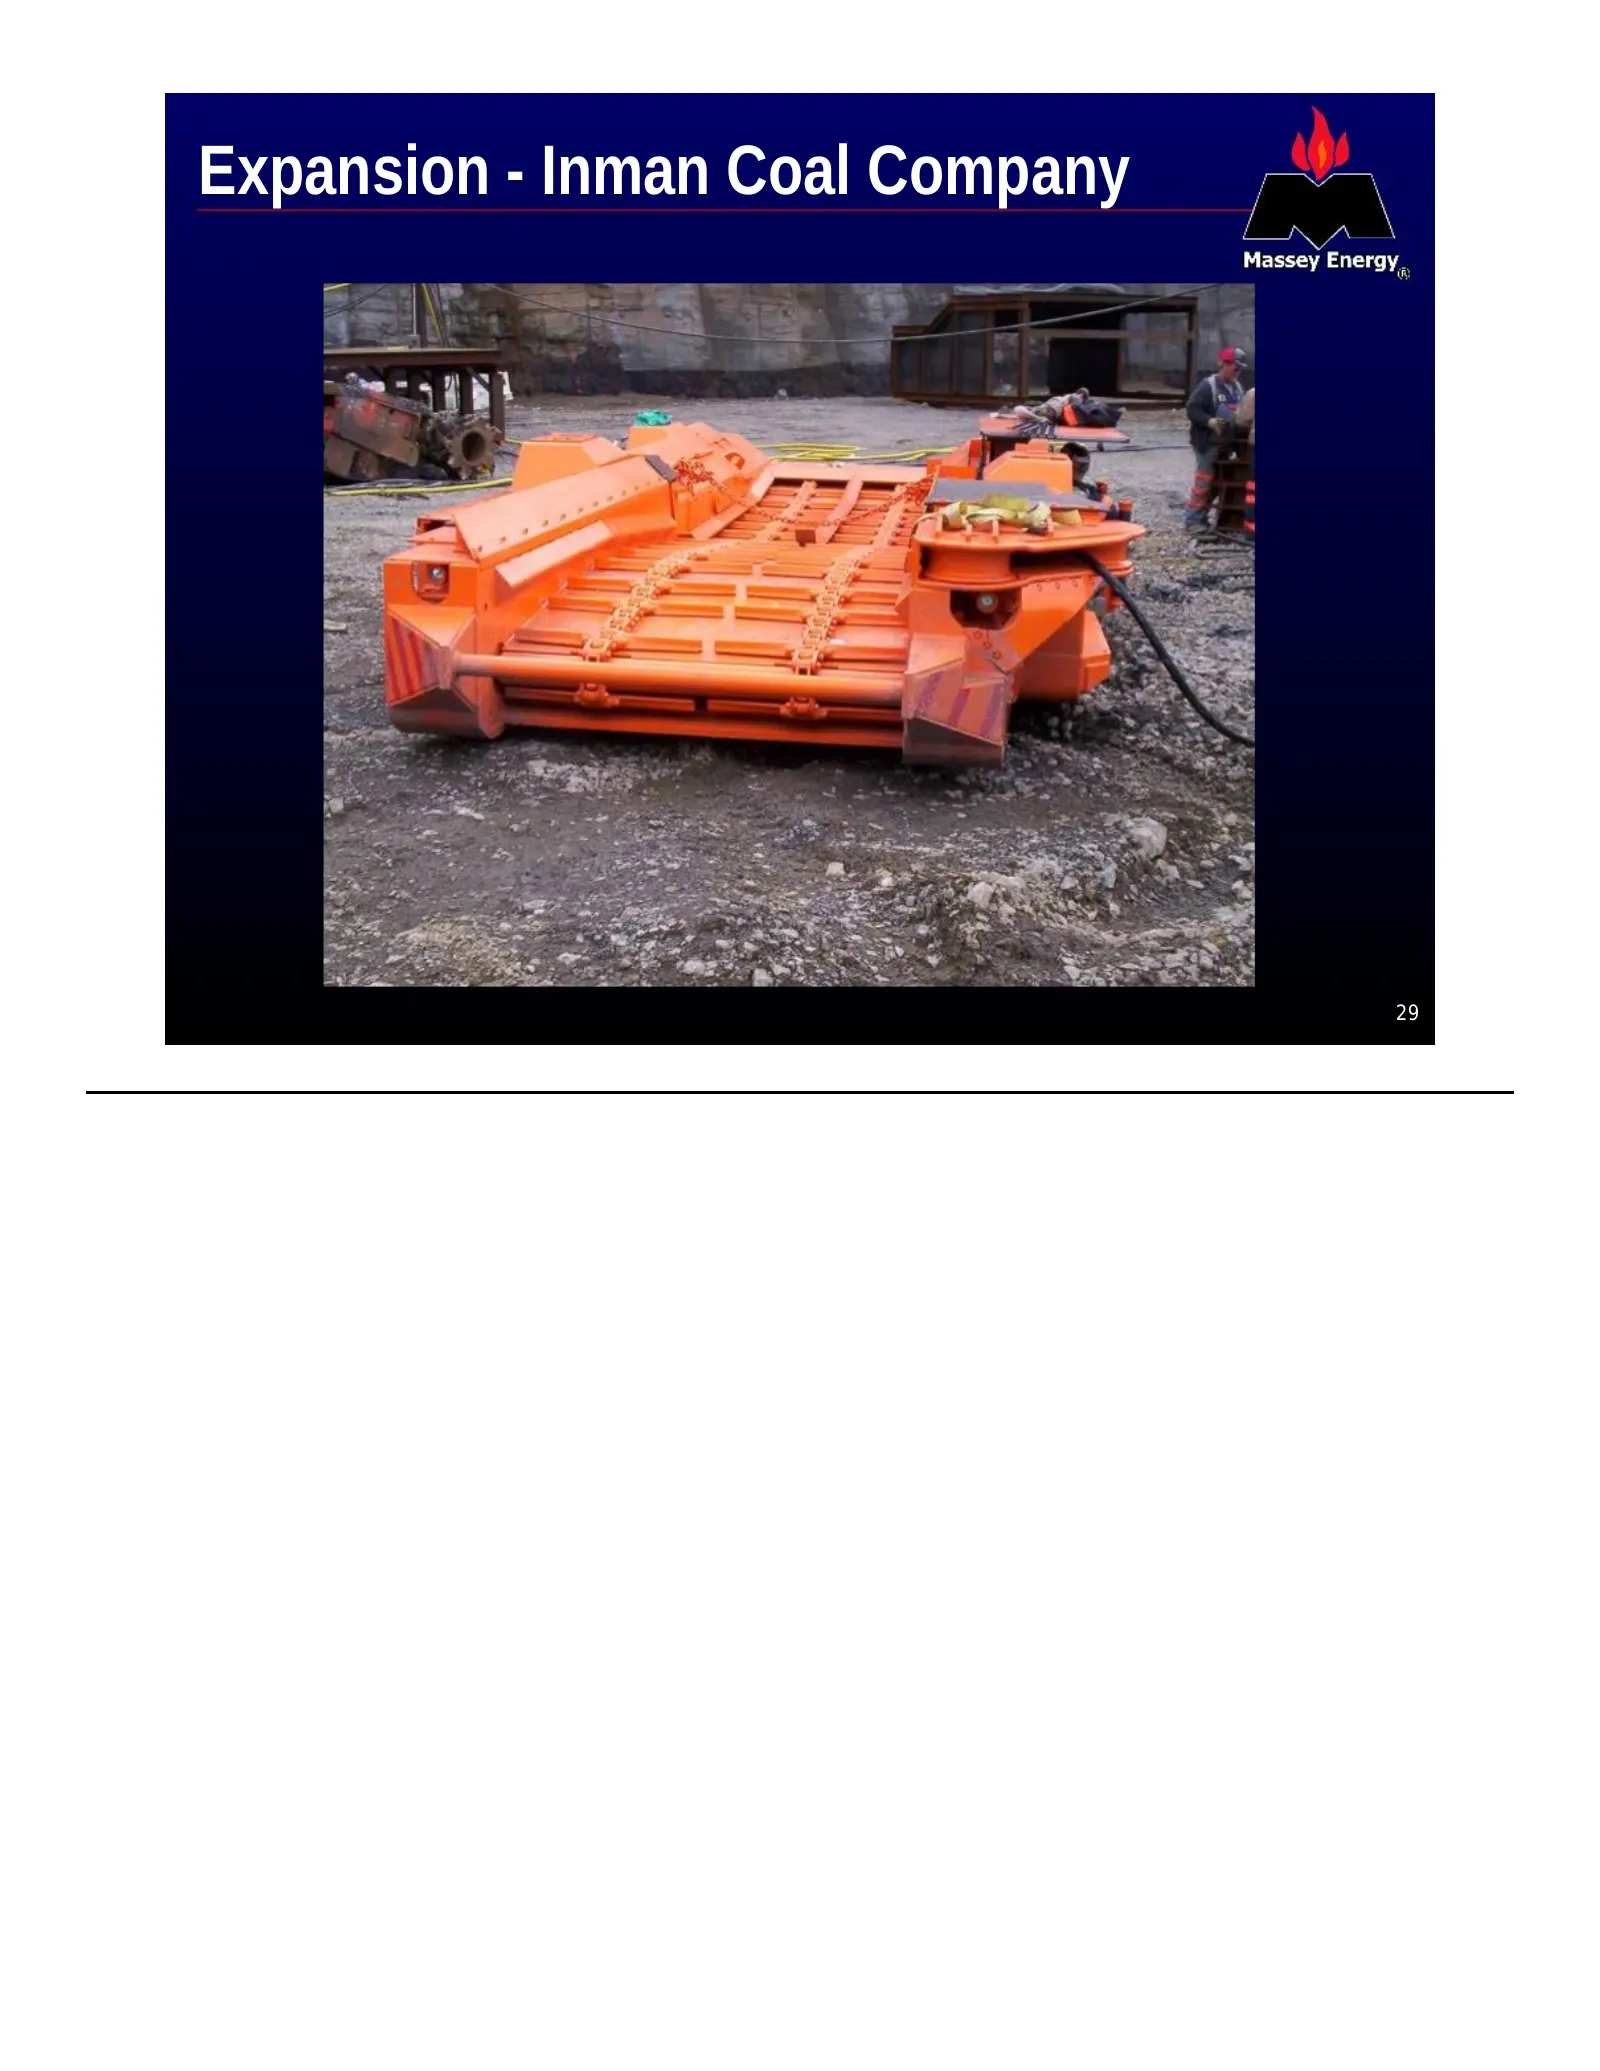
Expansion - Inman Coal Company 29
Slide 30: Expansion - Empire
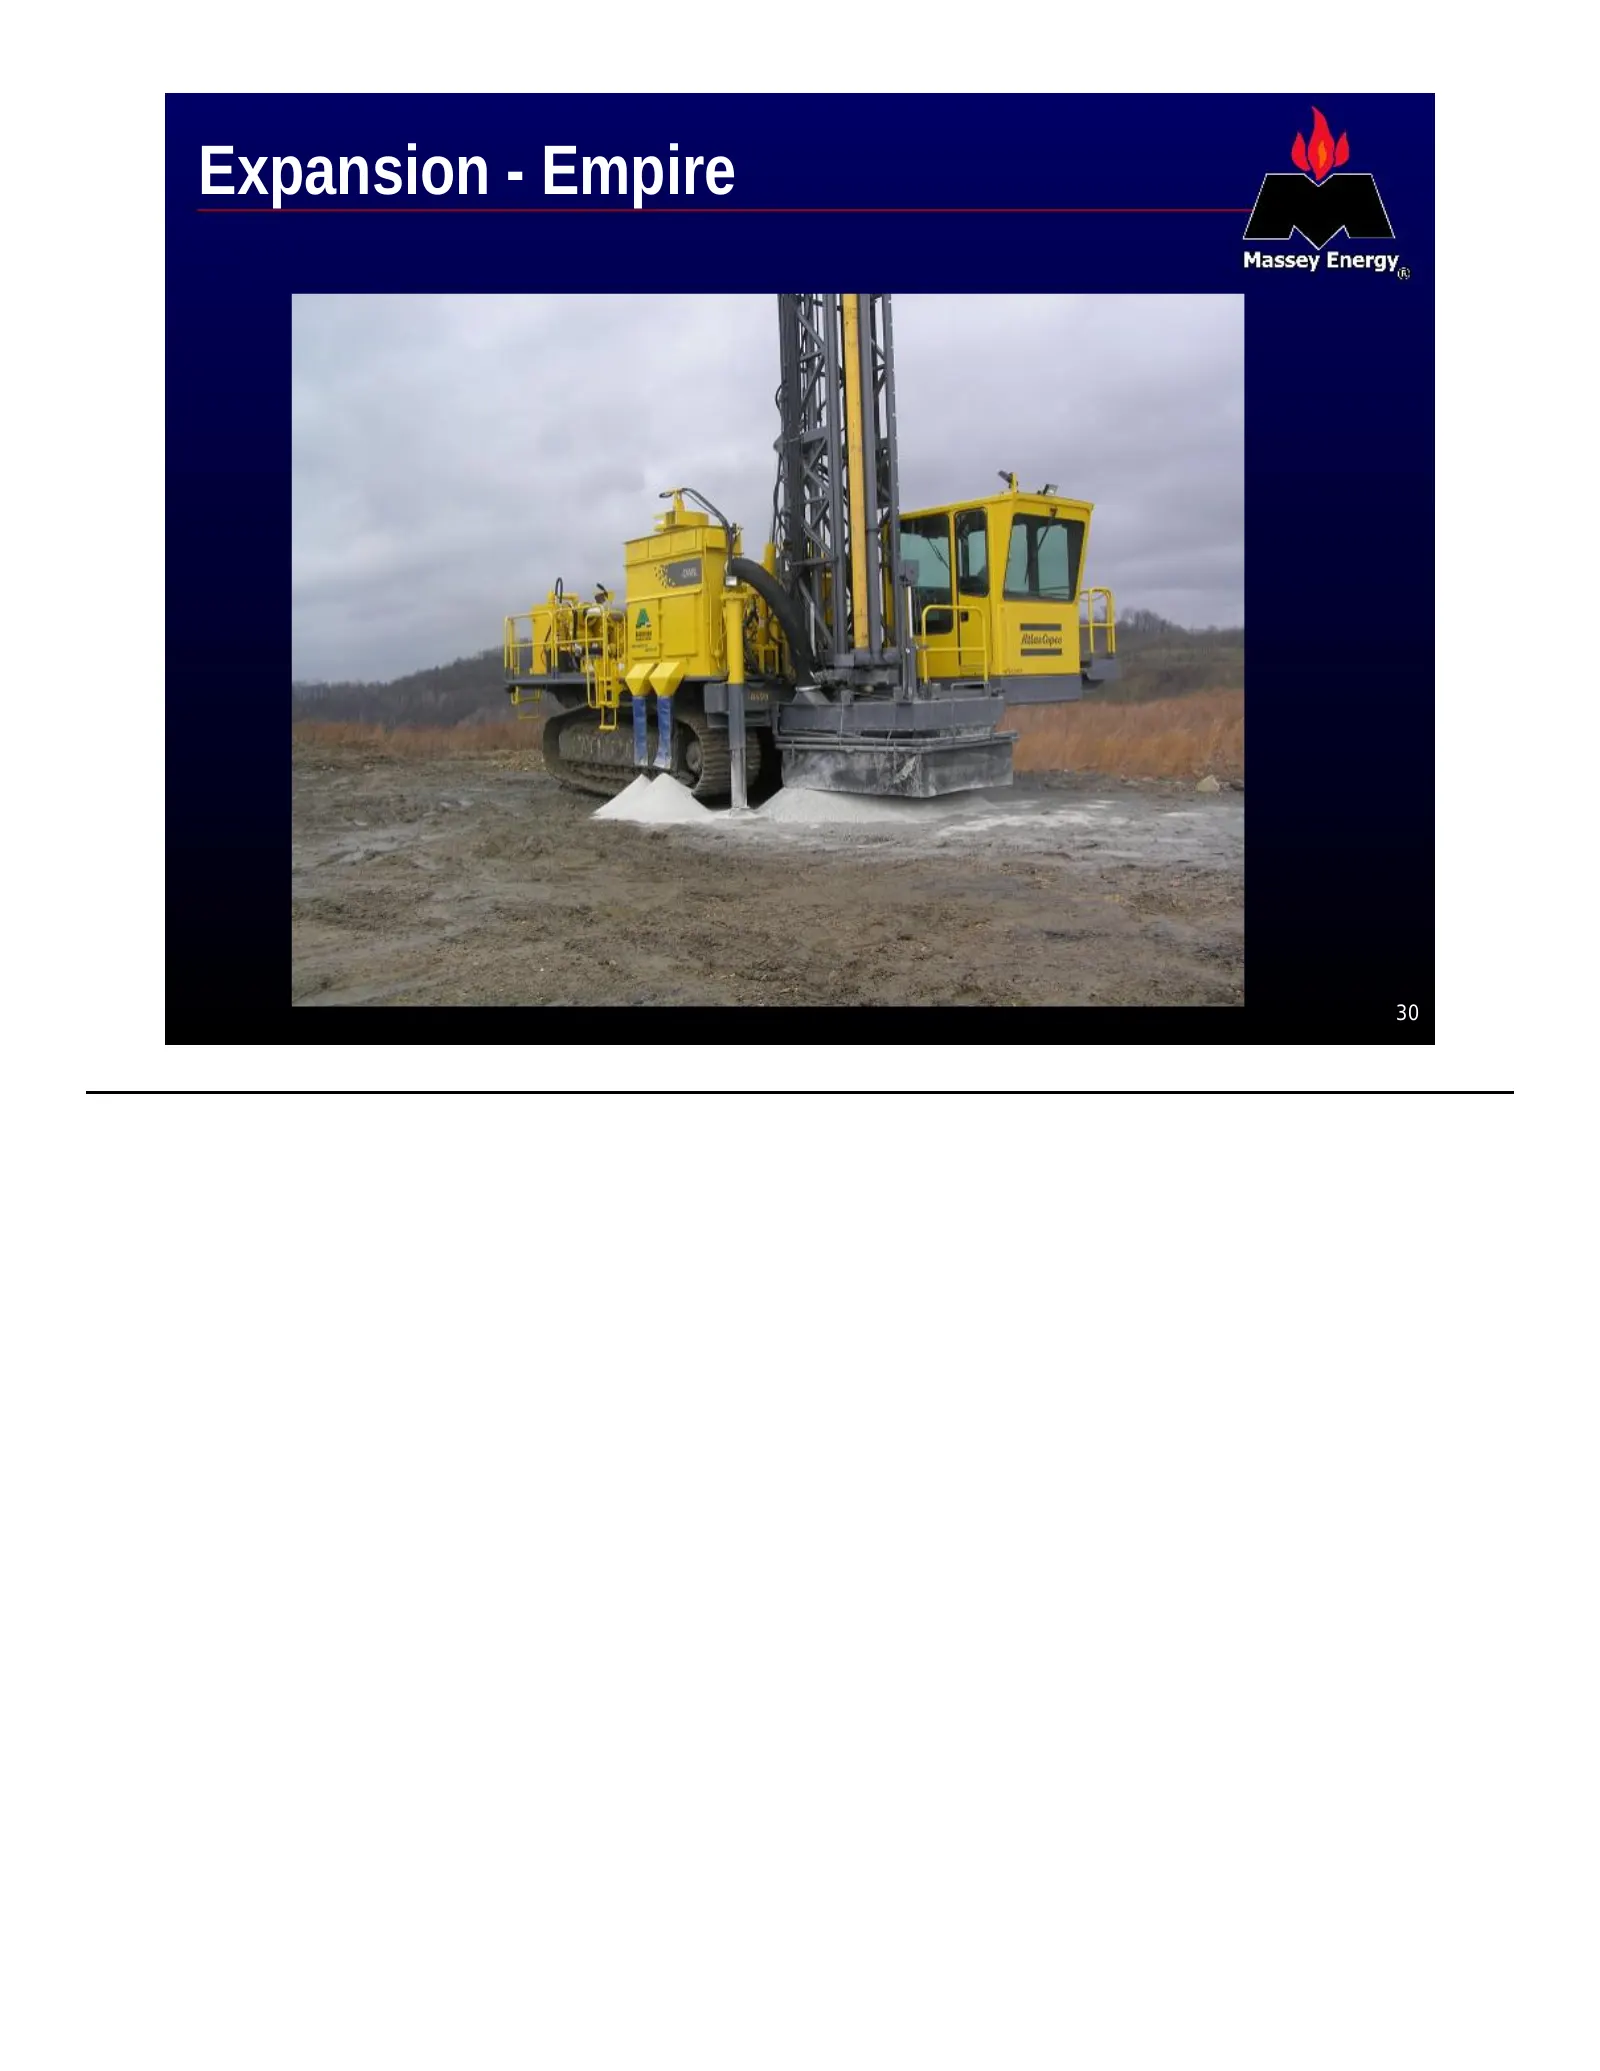
Expansion - Empire y= Massey Energy.
Slide 31: Expansion - Empire
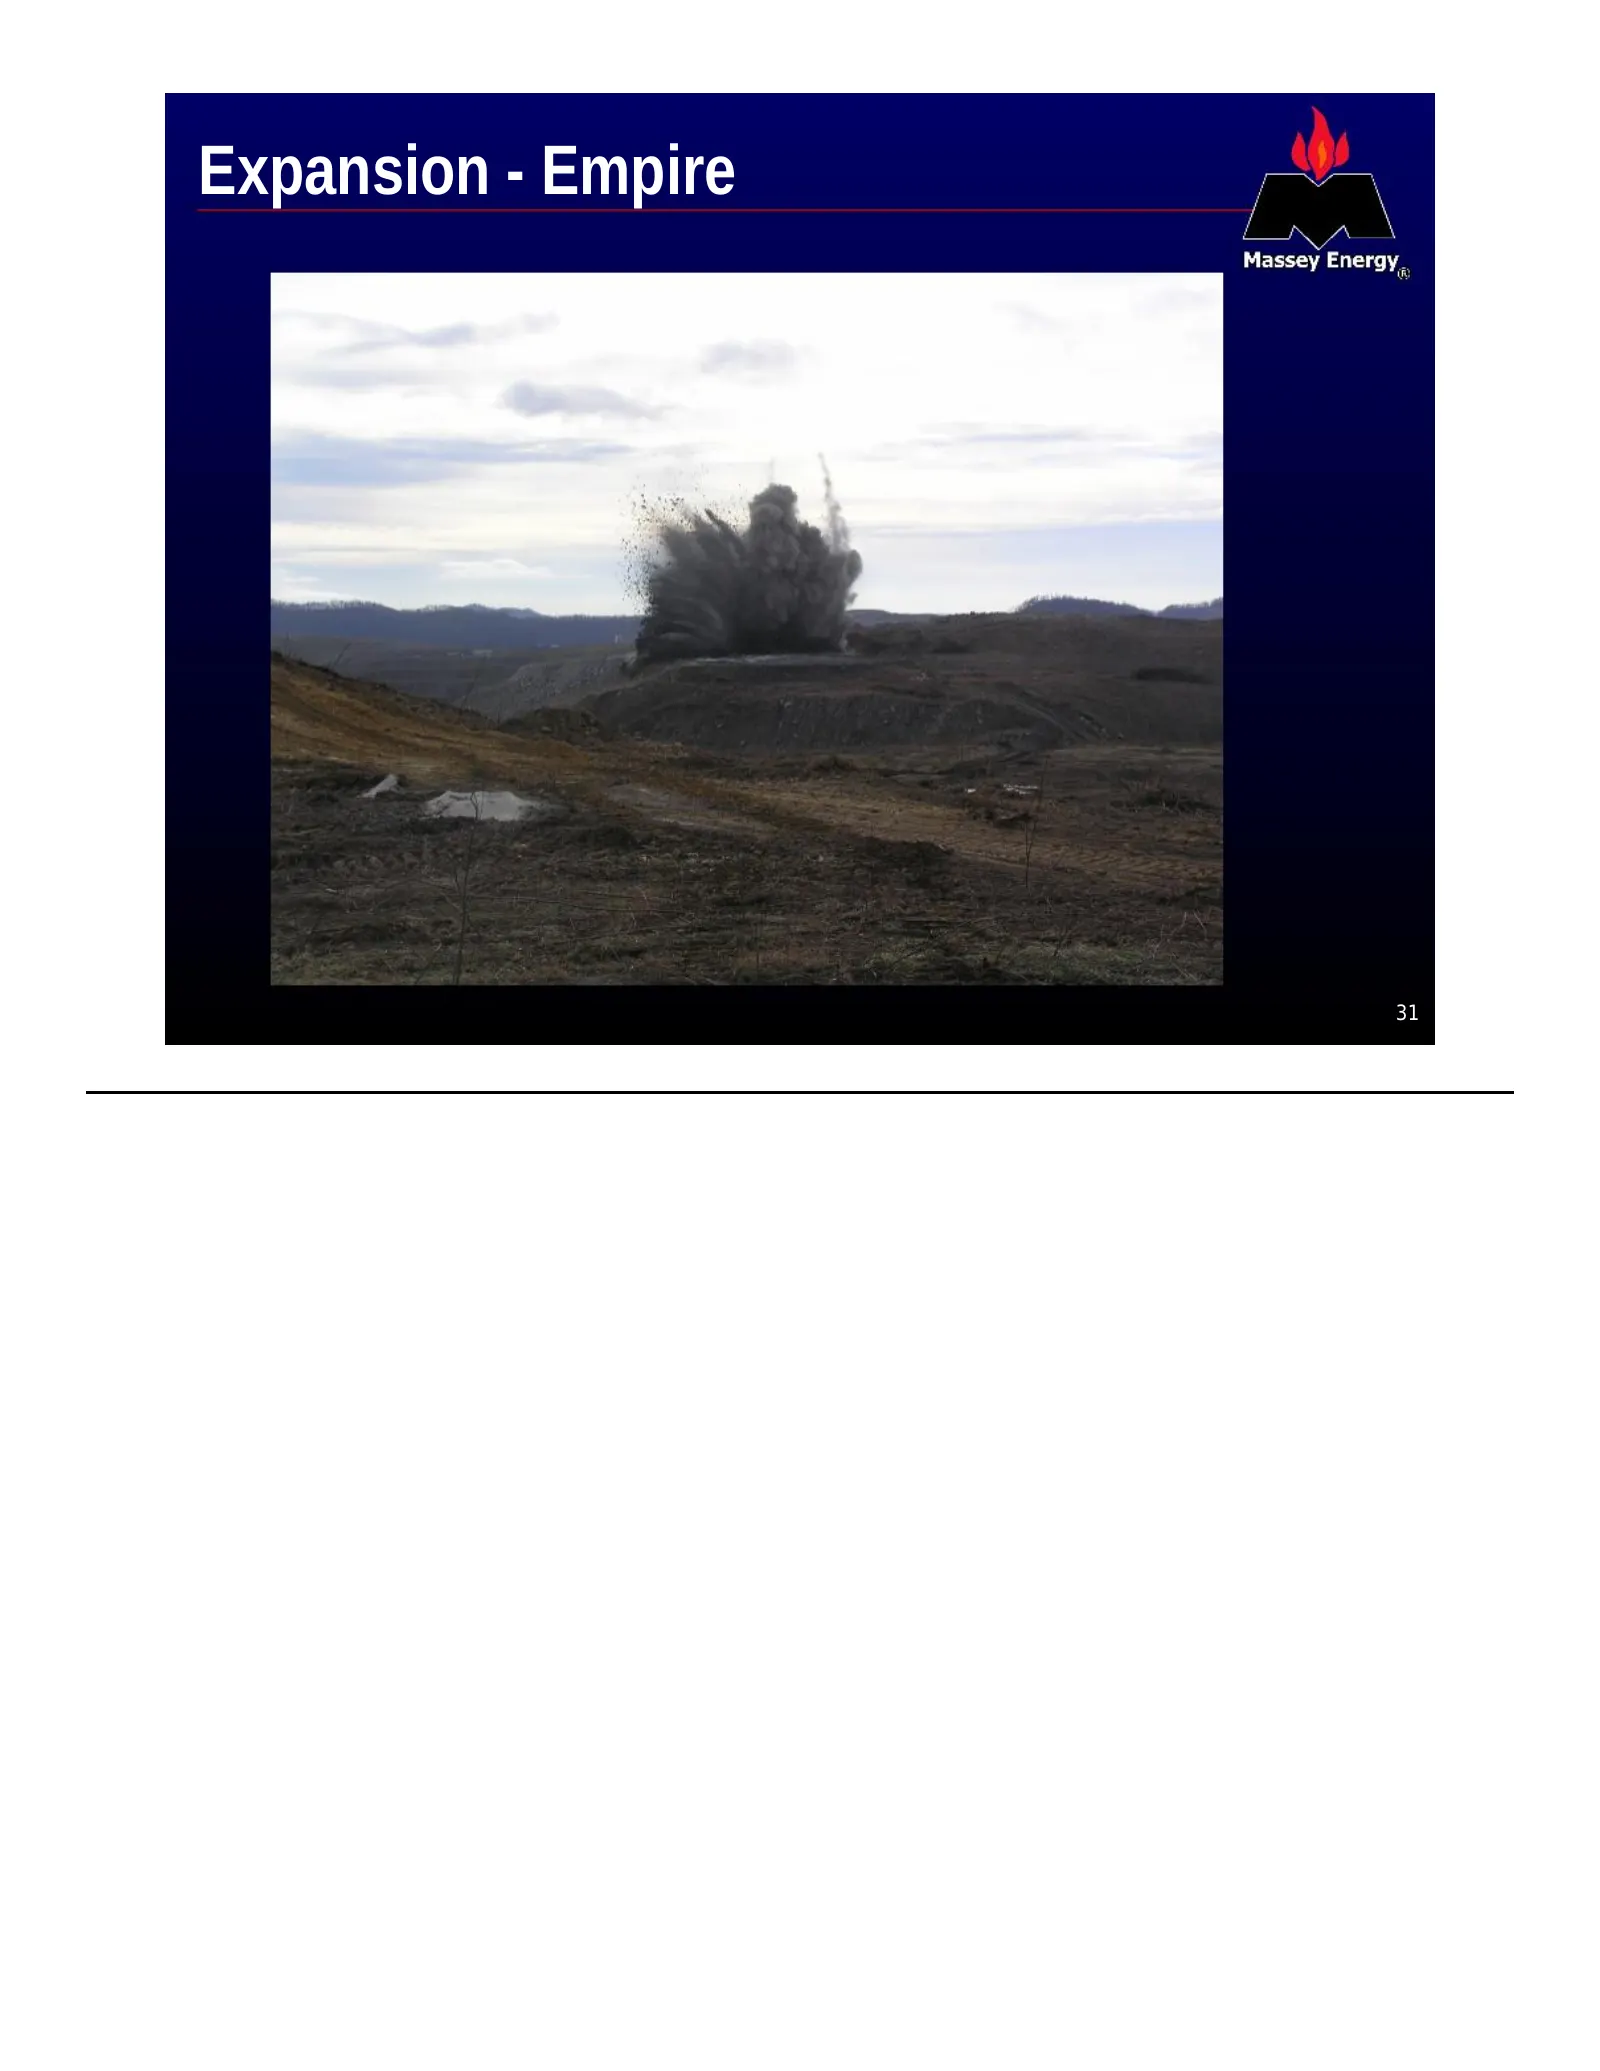
Expansion - Empire 31
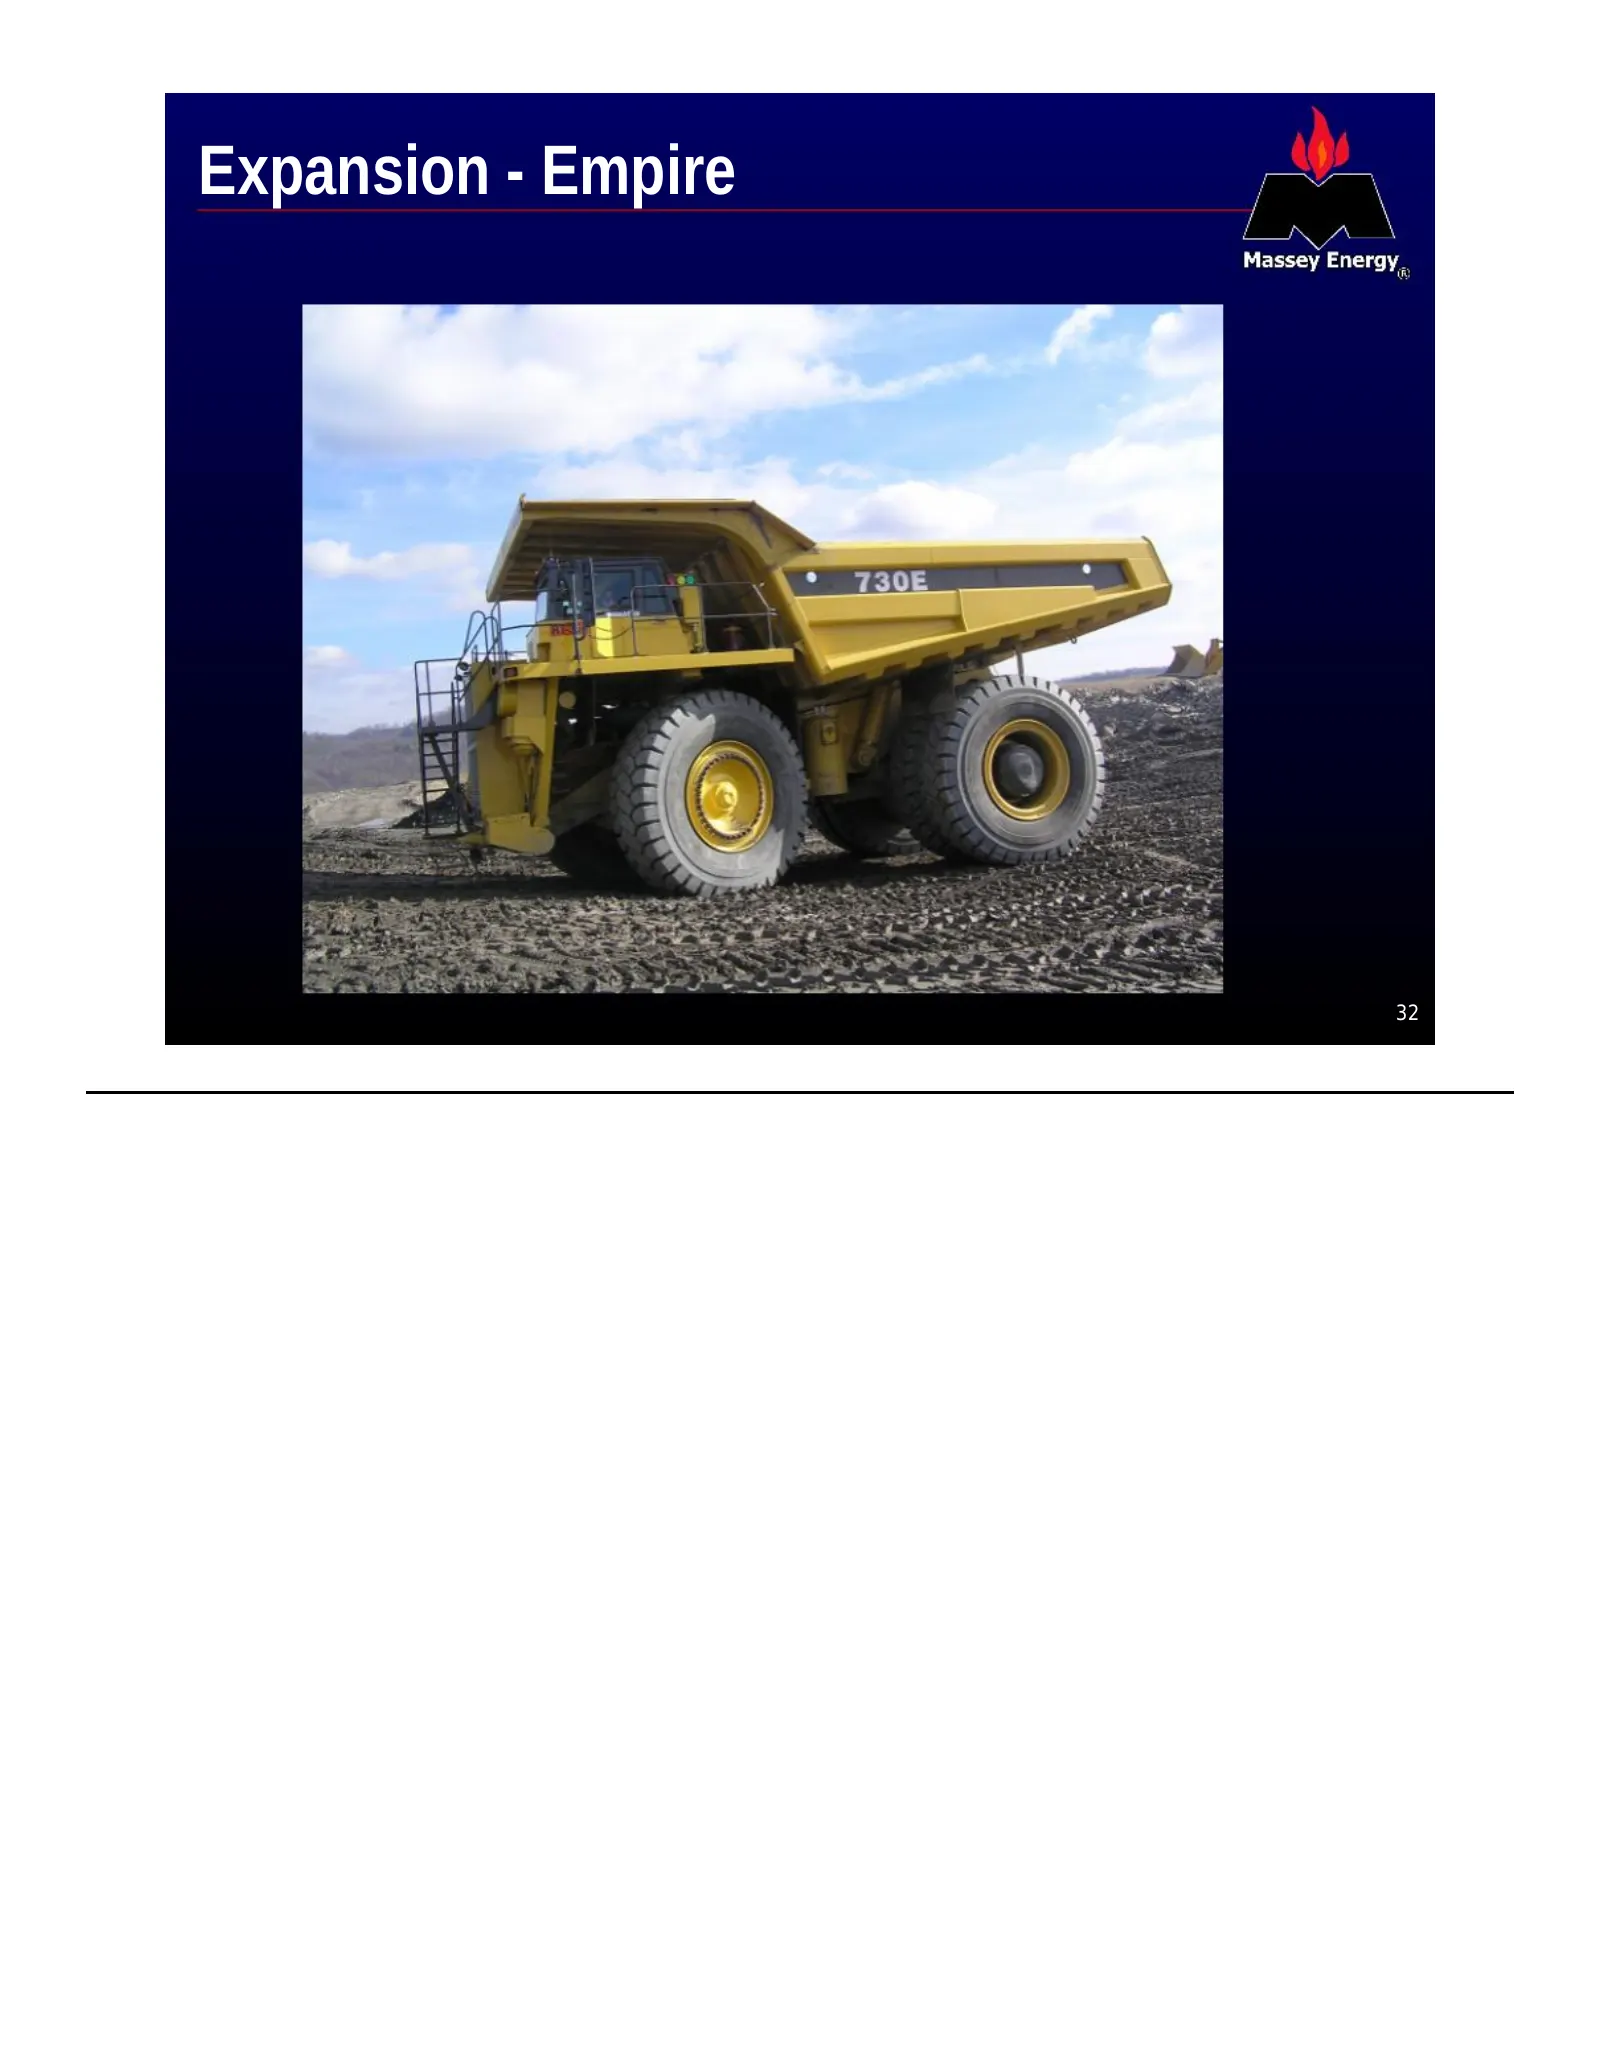
Slide 32: Expansion - Empire
Expansion - Empire VZ Massey Energy.
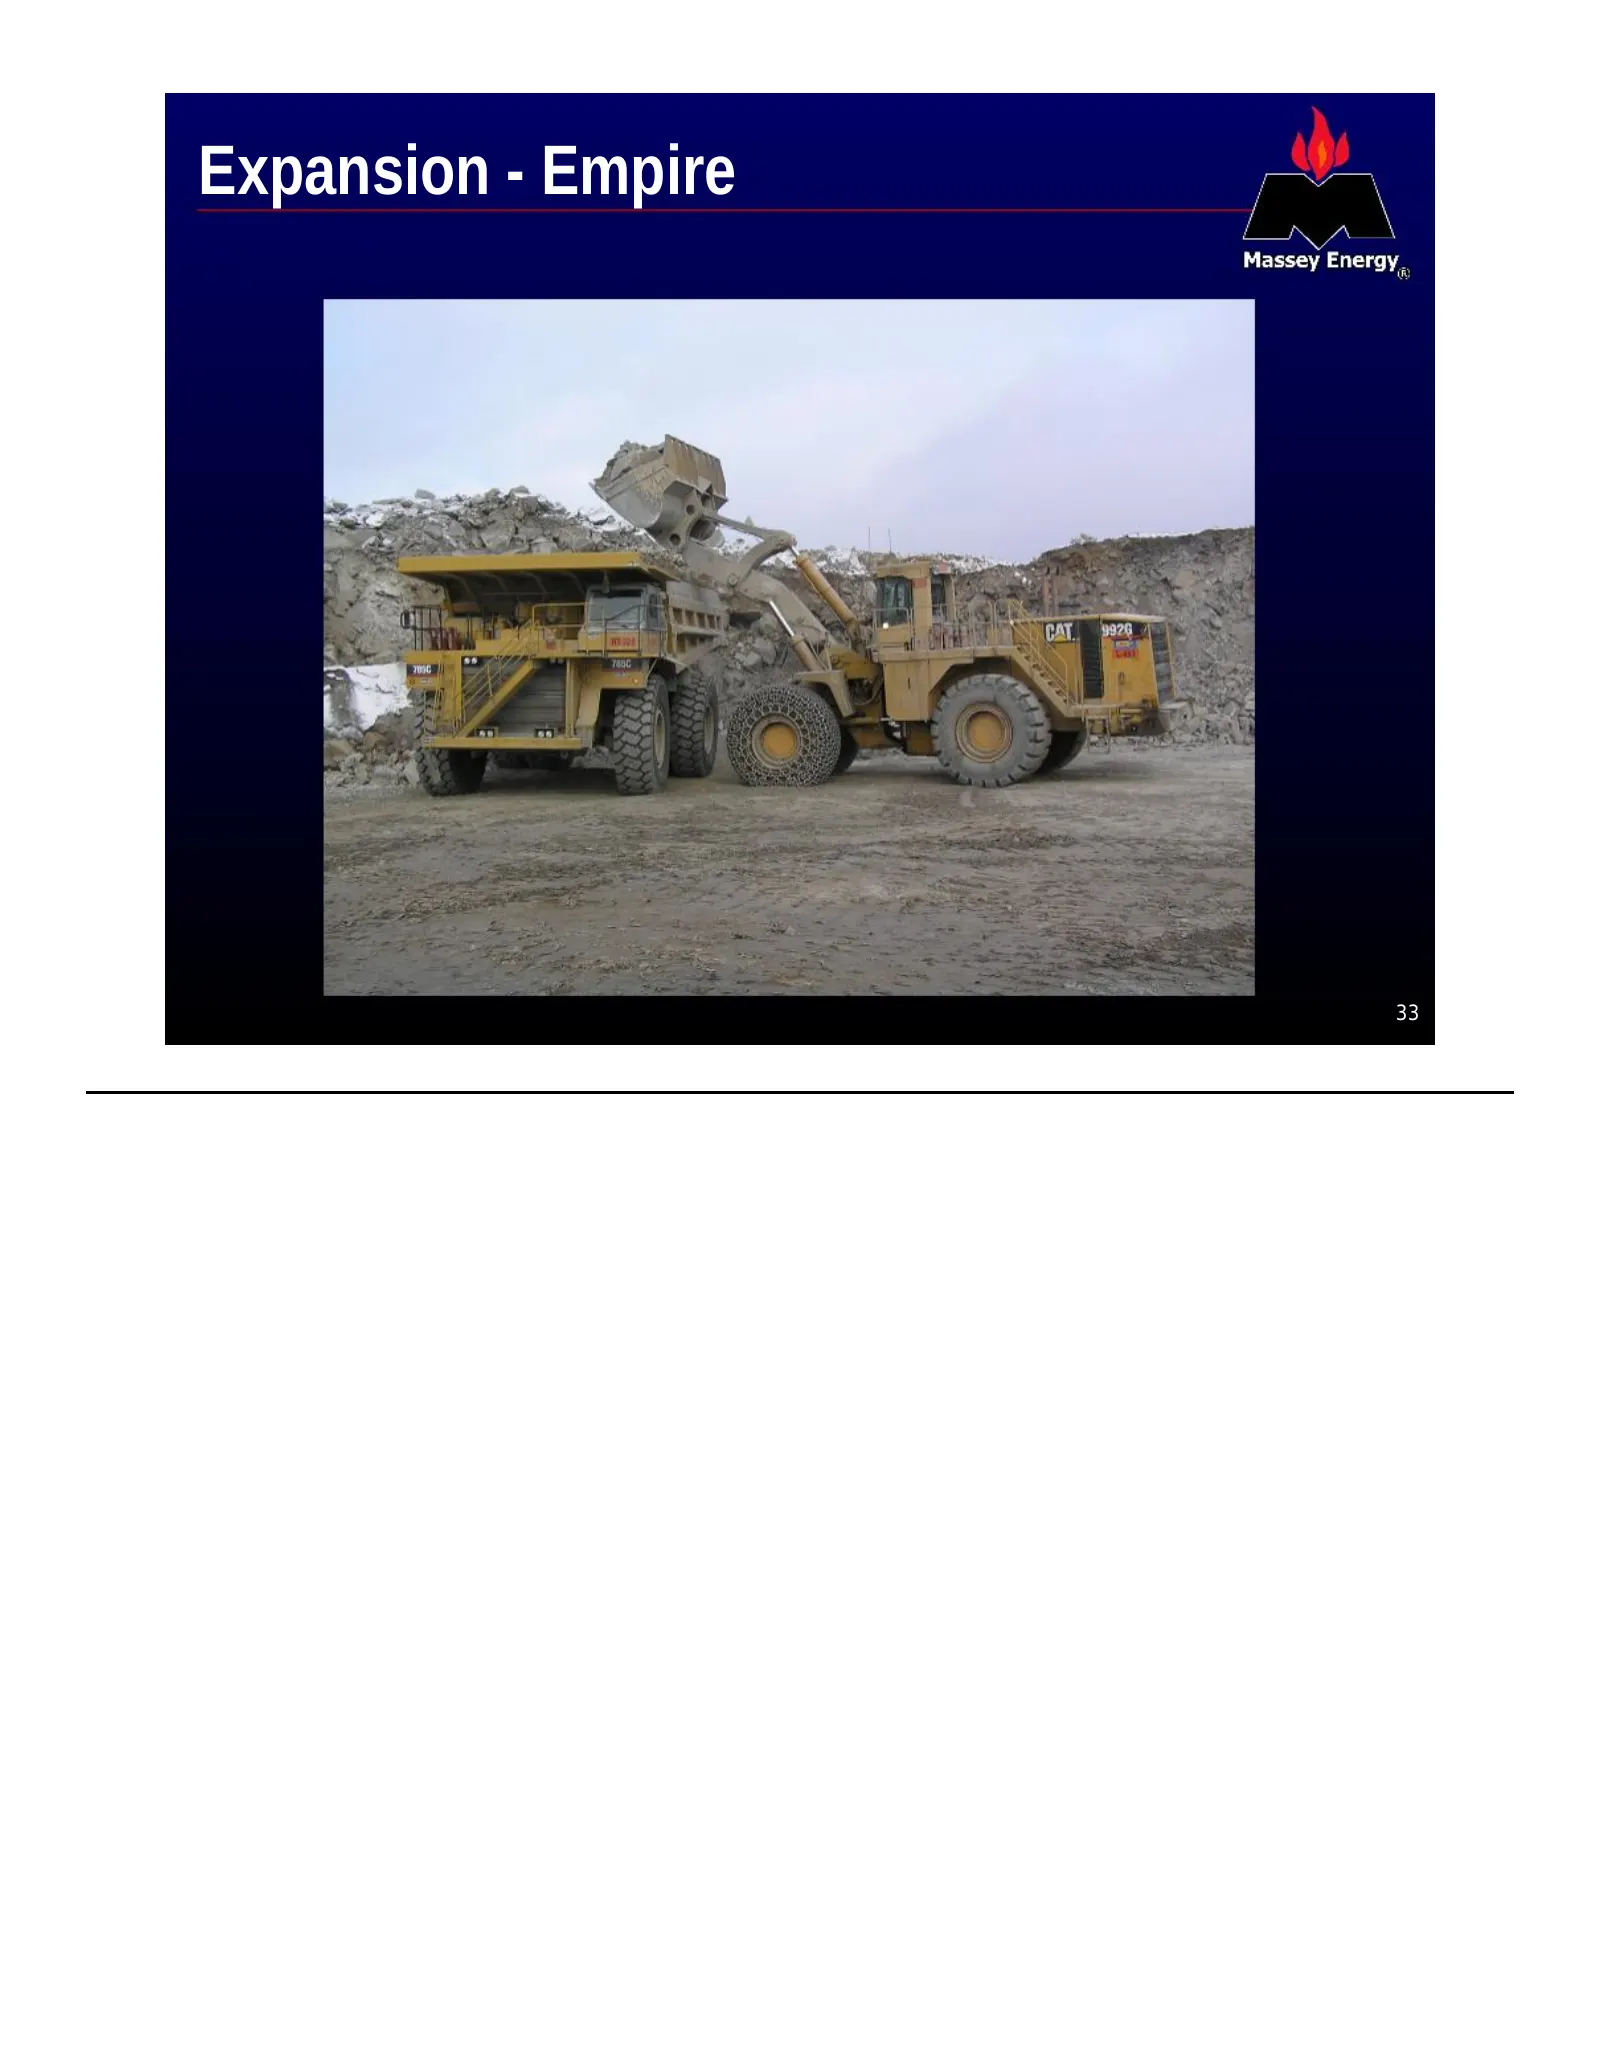
Slide 33: Expansion - Empire
Expansion - Empire S van \ Massey Energy.
Slide 34: Expansion Plan - CAPEX Update
Expansion Plan - CAPEX Update • Additional capital for 2008 authorized by the Board of Directors on April 3, 2008 • 2008 expansion CAPEX* now expected to be approximately $310 million * Expansion CAPEX is in addition to normal “on-going” CAPEX of approximately $240 million annually 34
Slide 35: 2008 Market Opportunities
2008 Market Opportunities • Expand production as quickly as possible • Un-sold or Un-priced Met Coal 35
Slide 36: Price Realization Update
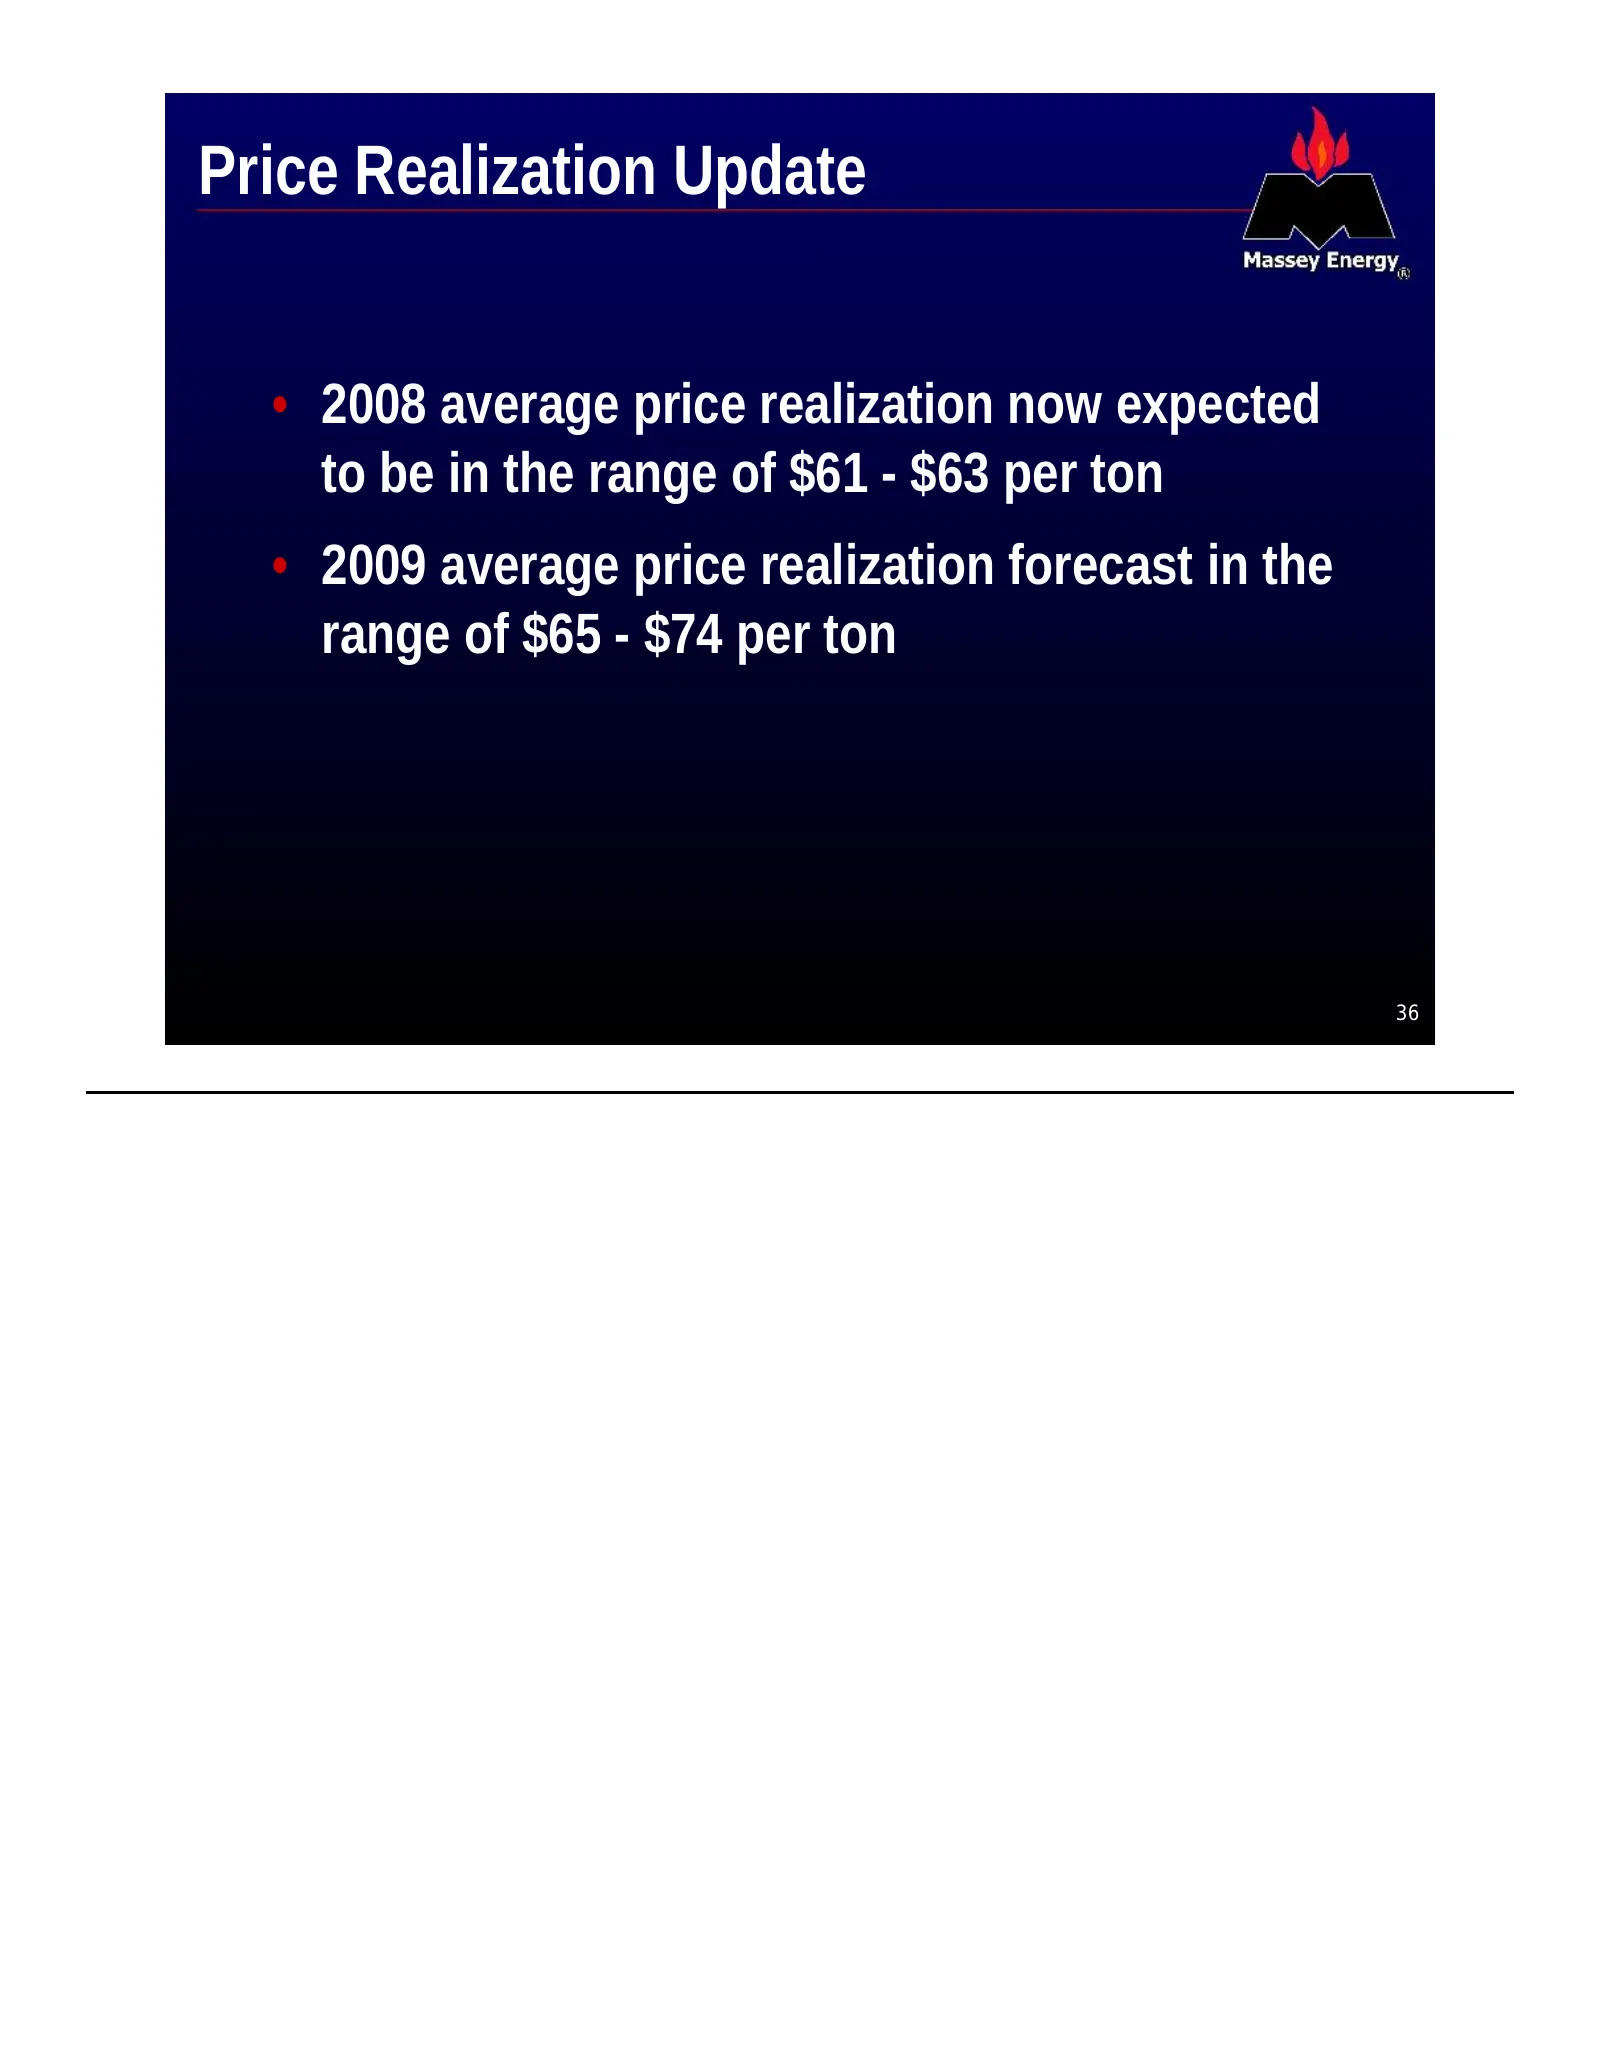
Price Realization Update • 2008 average price realization now expected to be in the range of $61 - $63 per ton • 2009 average price realization forecast in the range of $65 - $74 per ton 36
Slide 37: 2008 Outlook - Cash Margin per Ton
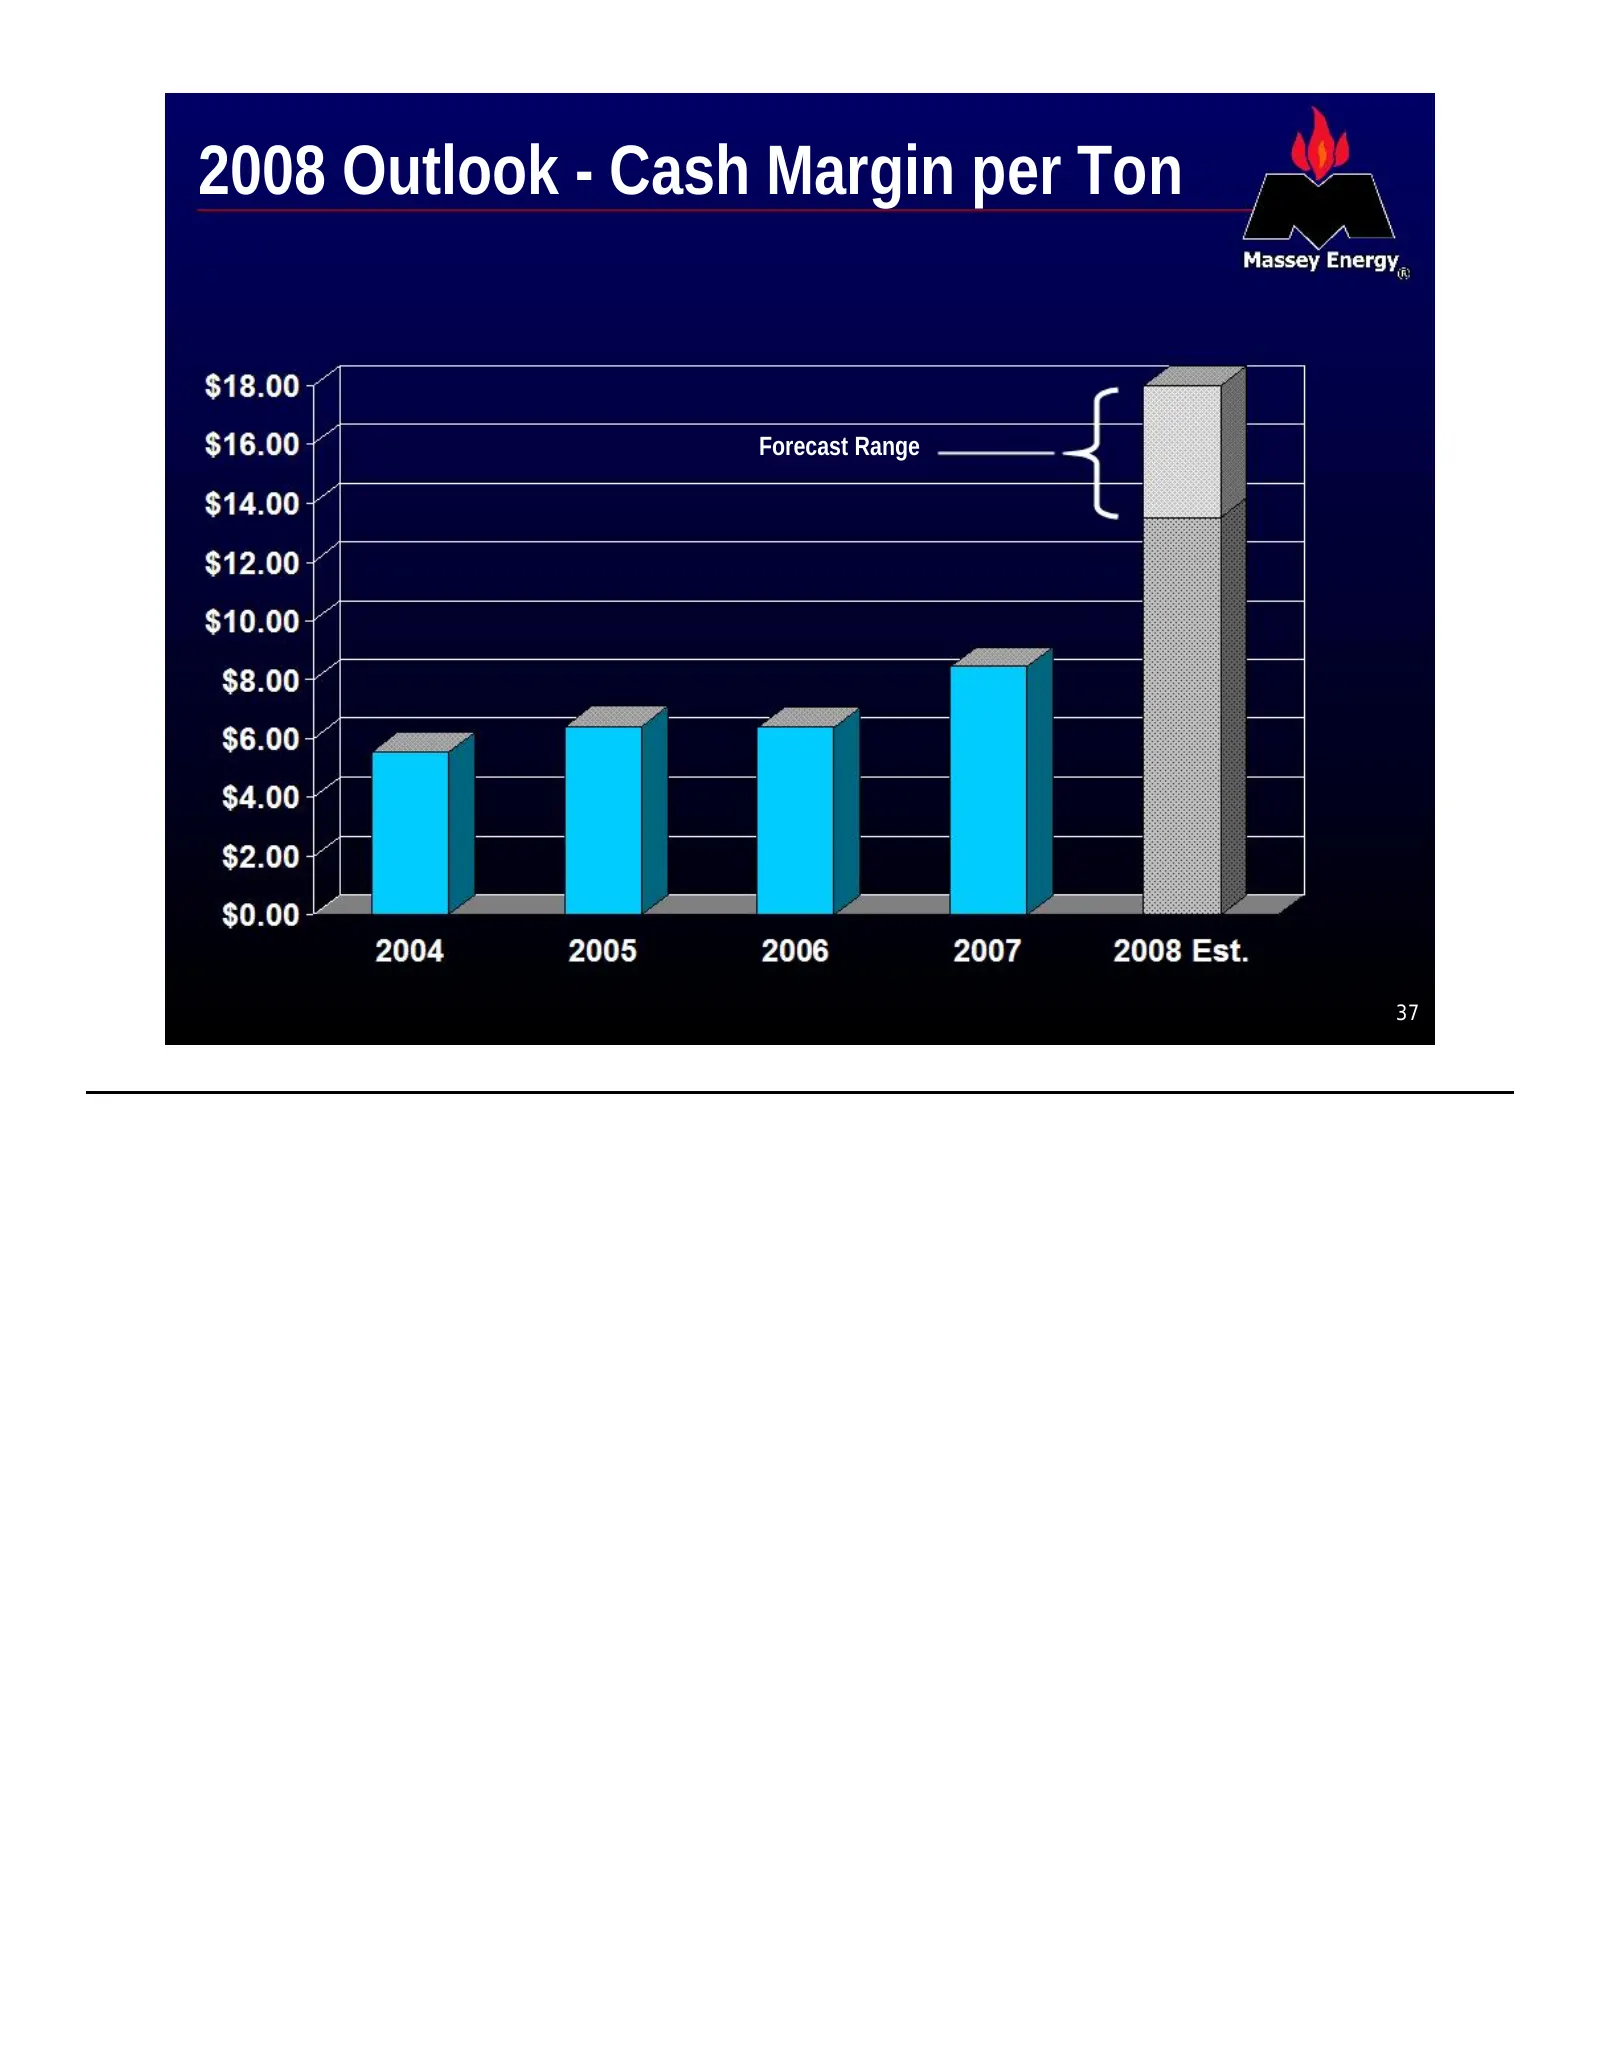
2008 Outlook - Cash Margin per Ton Forecast Range 37
Slide 38: Guidance Update (April 3, 2008)
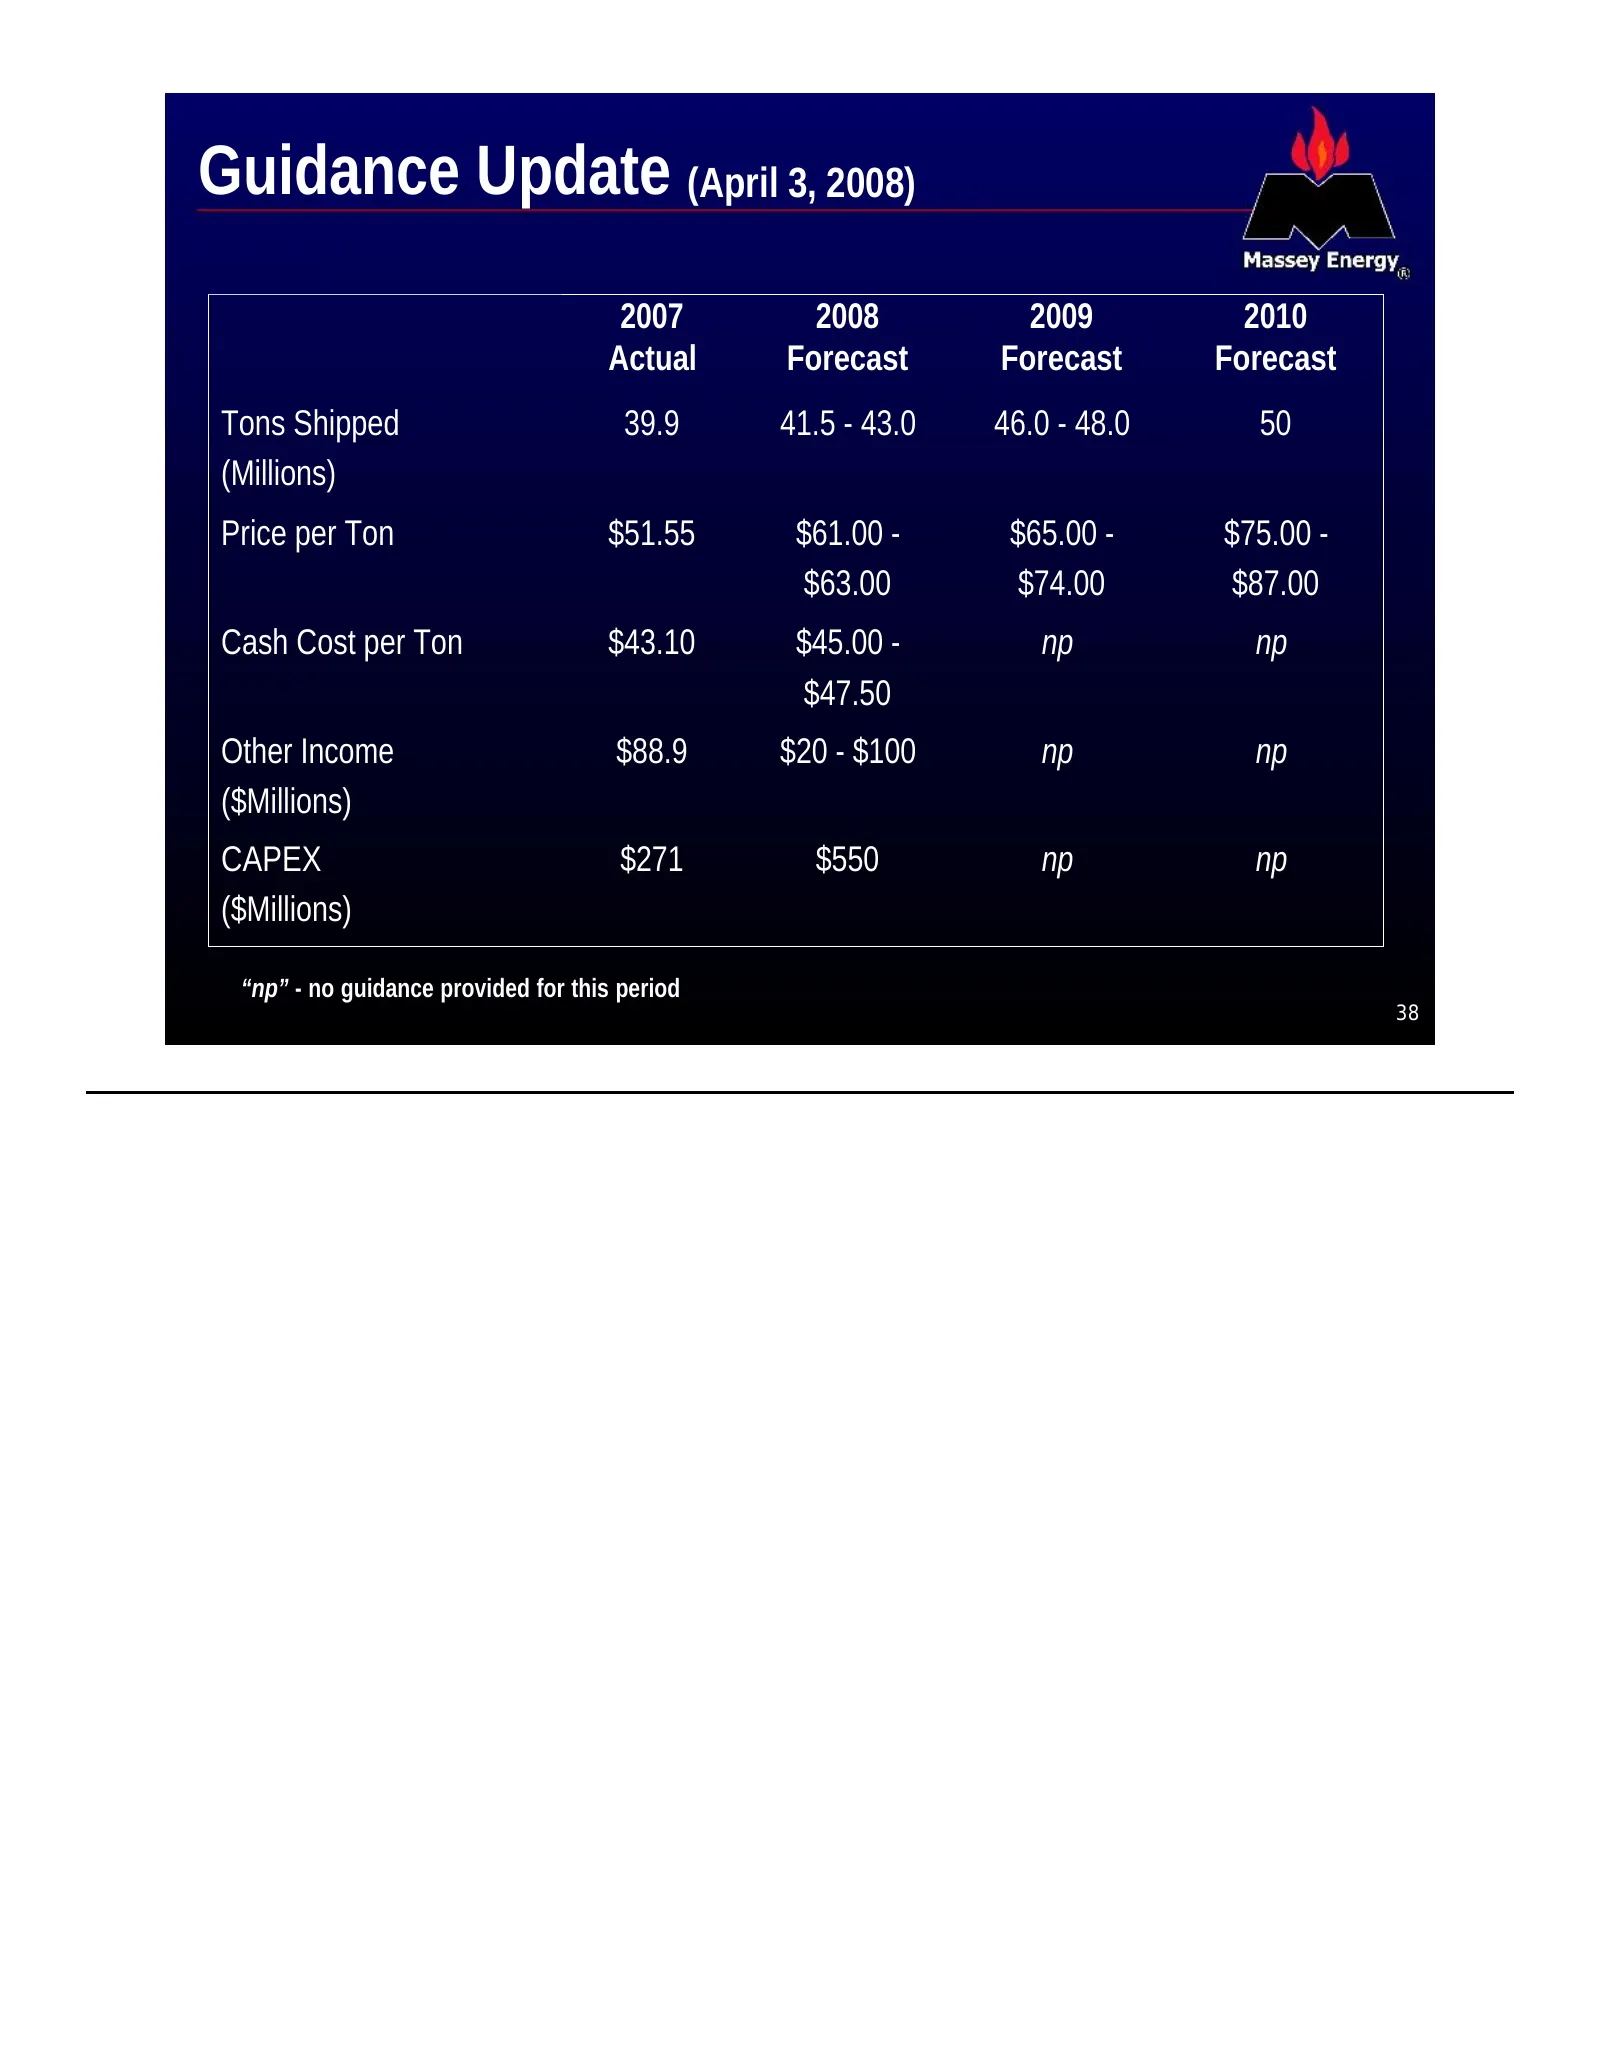
Guidance Update (April 3, 2008) 2007 2008 2009 2010 Actual Forecast Forecast Forecast Tons Shipped 39.9 41.5 - 43.0 46.0 - 48.0 50 (Millions) Price per Ton $51.55 $61.00 - $65.00 - $75.00 - $63.00 $74.00 $87.00 Cash Cost per Ton $43.10 $45.00 - np np $47.50 Other Income $88.9 $20 - $100 np np ($Mill

Slide 39: "What else am I missing?"
abs Massey Energy. “What else am I missing?”
Slide 40: Valuation Disconnect
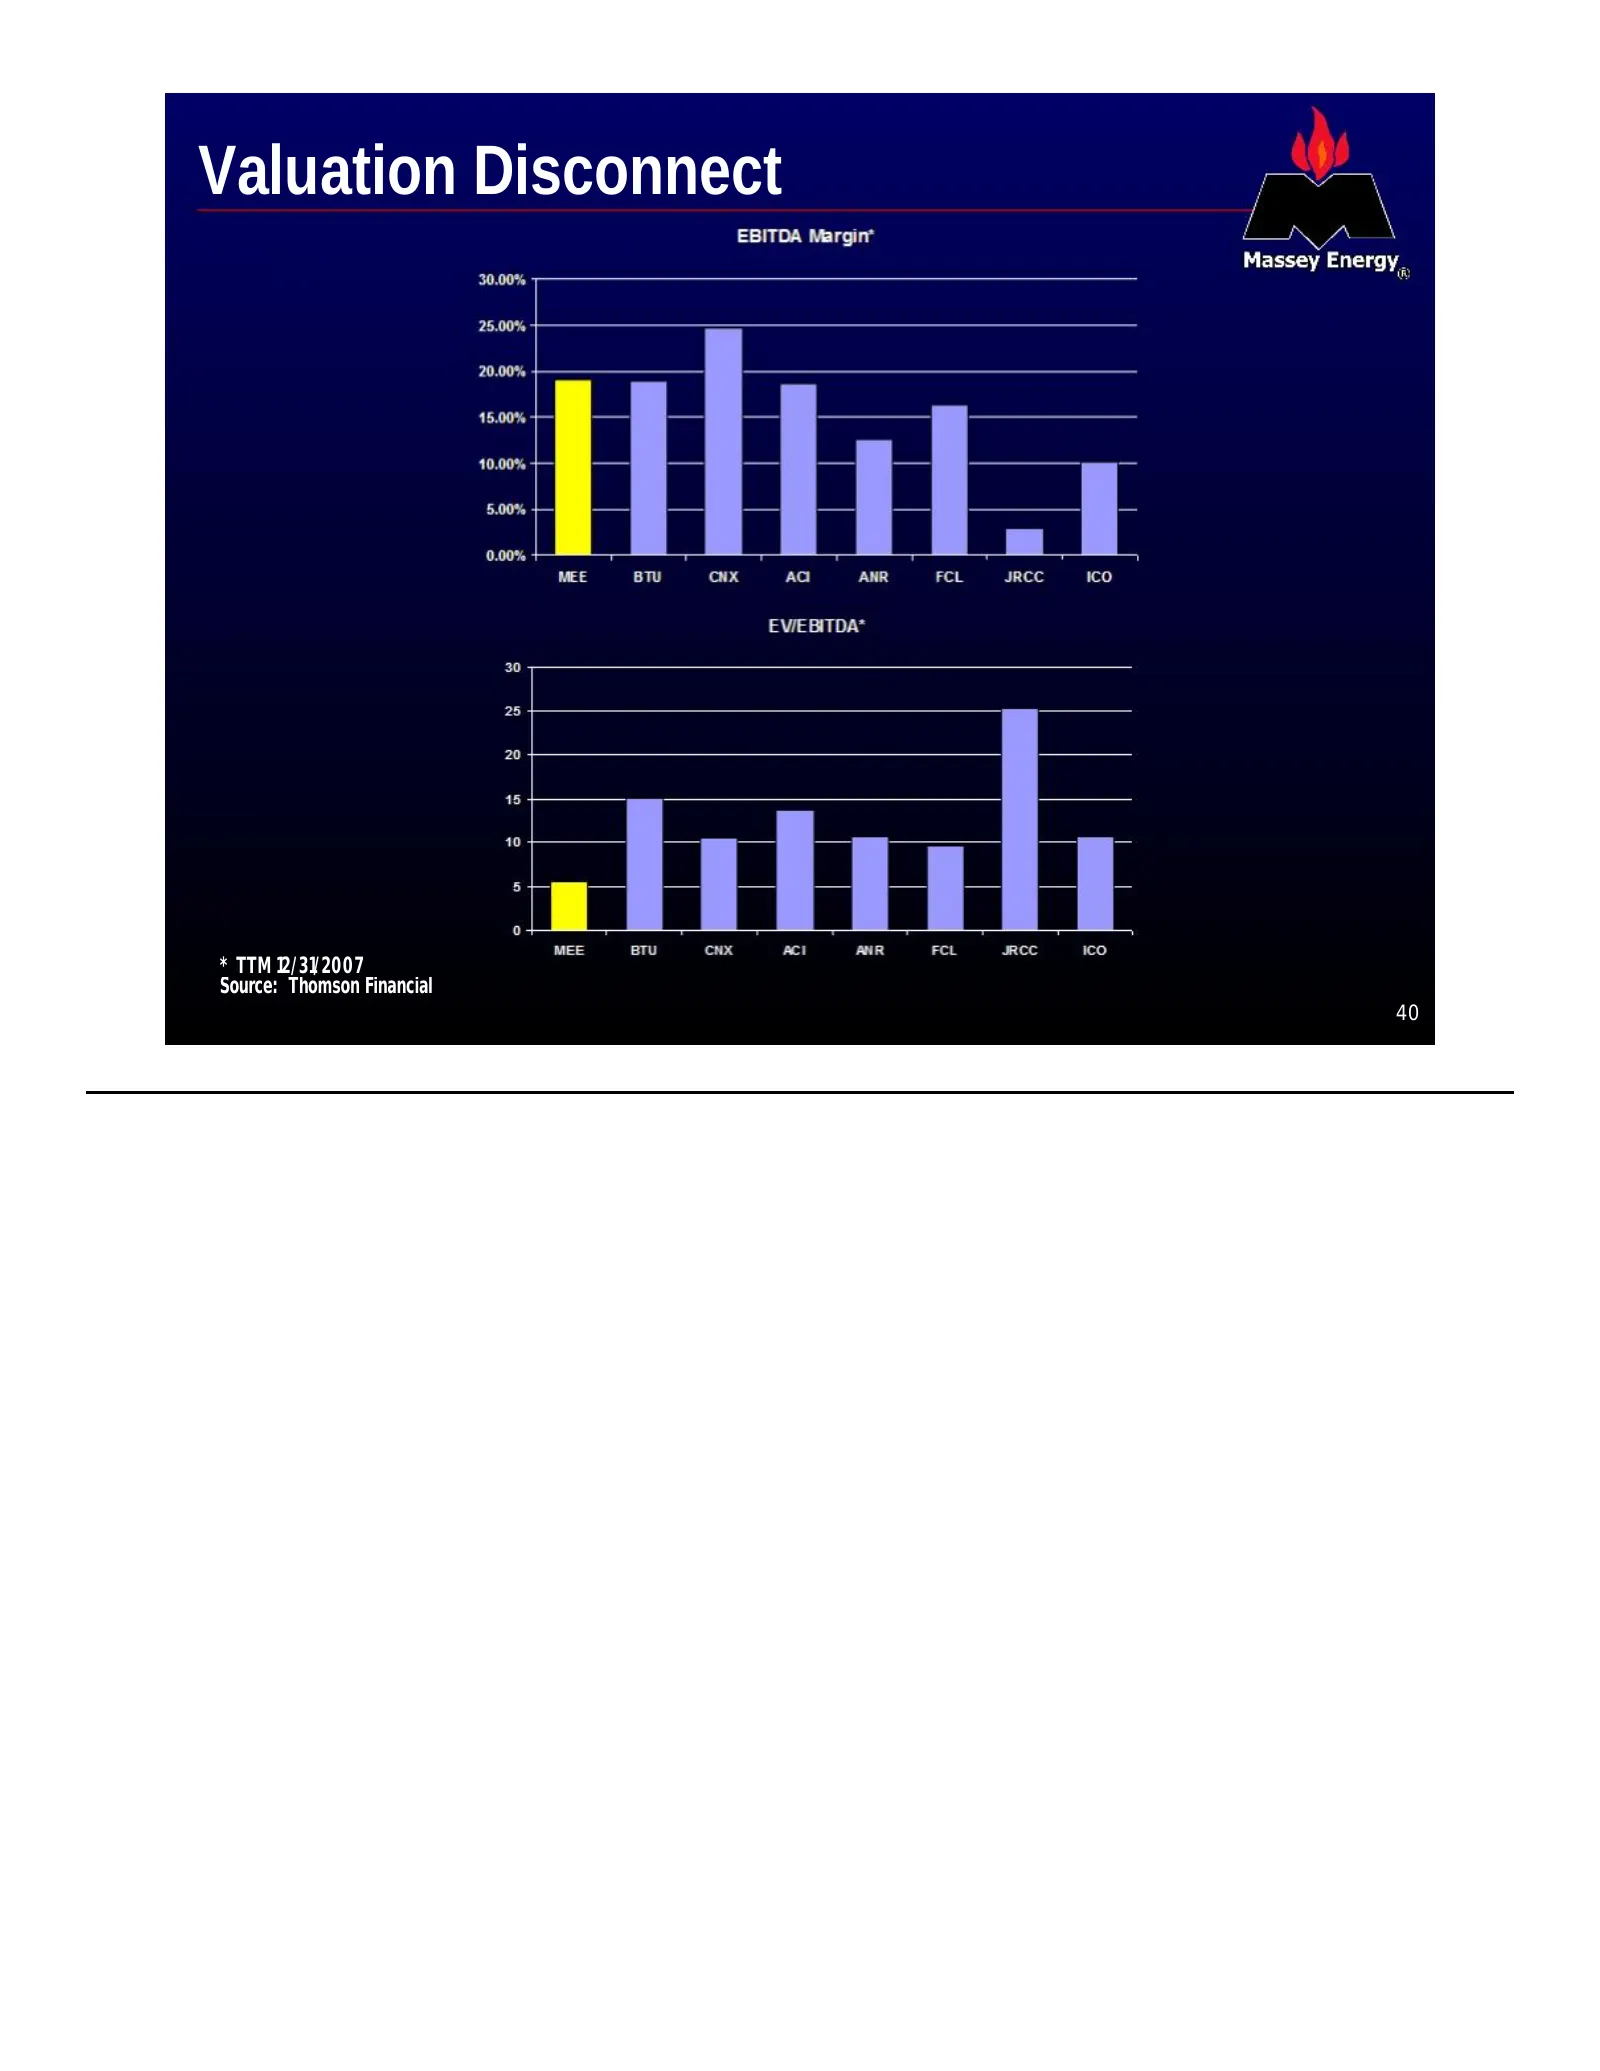
Valuation Disconnect * TTM 12/31/2007 Source: Thomson Financial 40

Slide 41: Risk of Central Appalachia
Risk of Central Appalachia 41
Slide 42: Risk Value of Central Appalachia/Massey
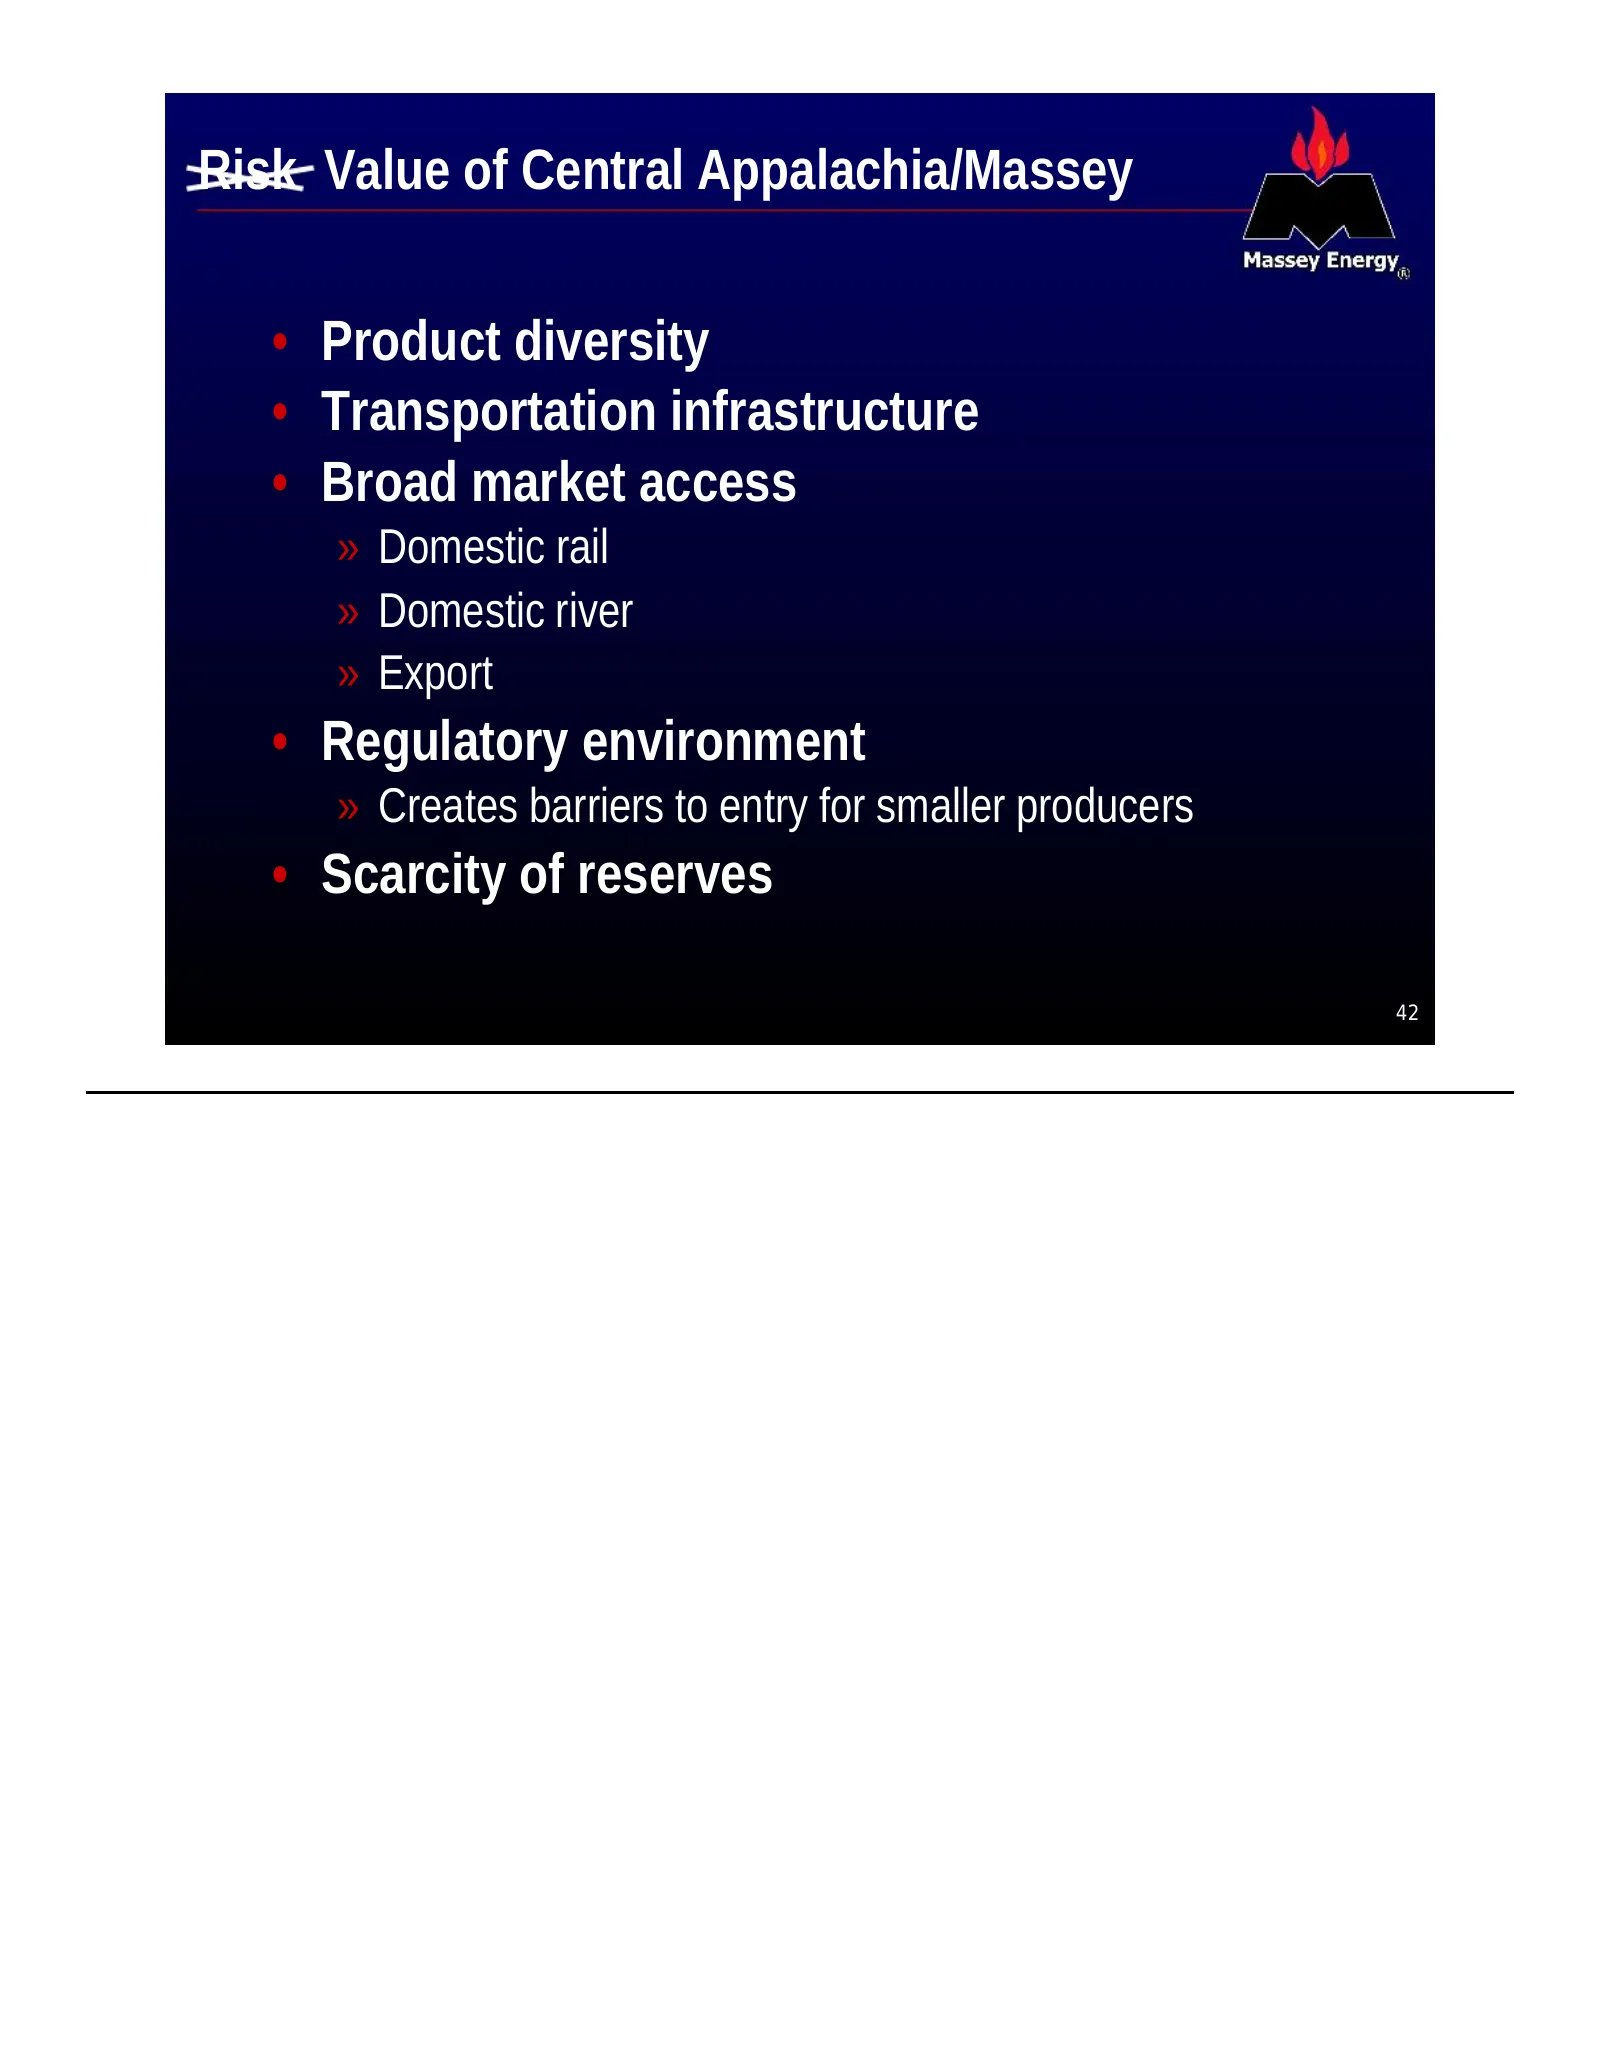
Risk Value of Central Appalachia/Massey • Product diversity • Transportation infrastructure • Broad market access » Domestic rail » Domestic river » Export • Regulatory environment » Creates barriers to entry for smaller producers • Scarcity of reserves 42
Slide 43: Risk Value of Central Appalachia/Massey
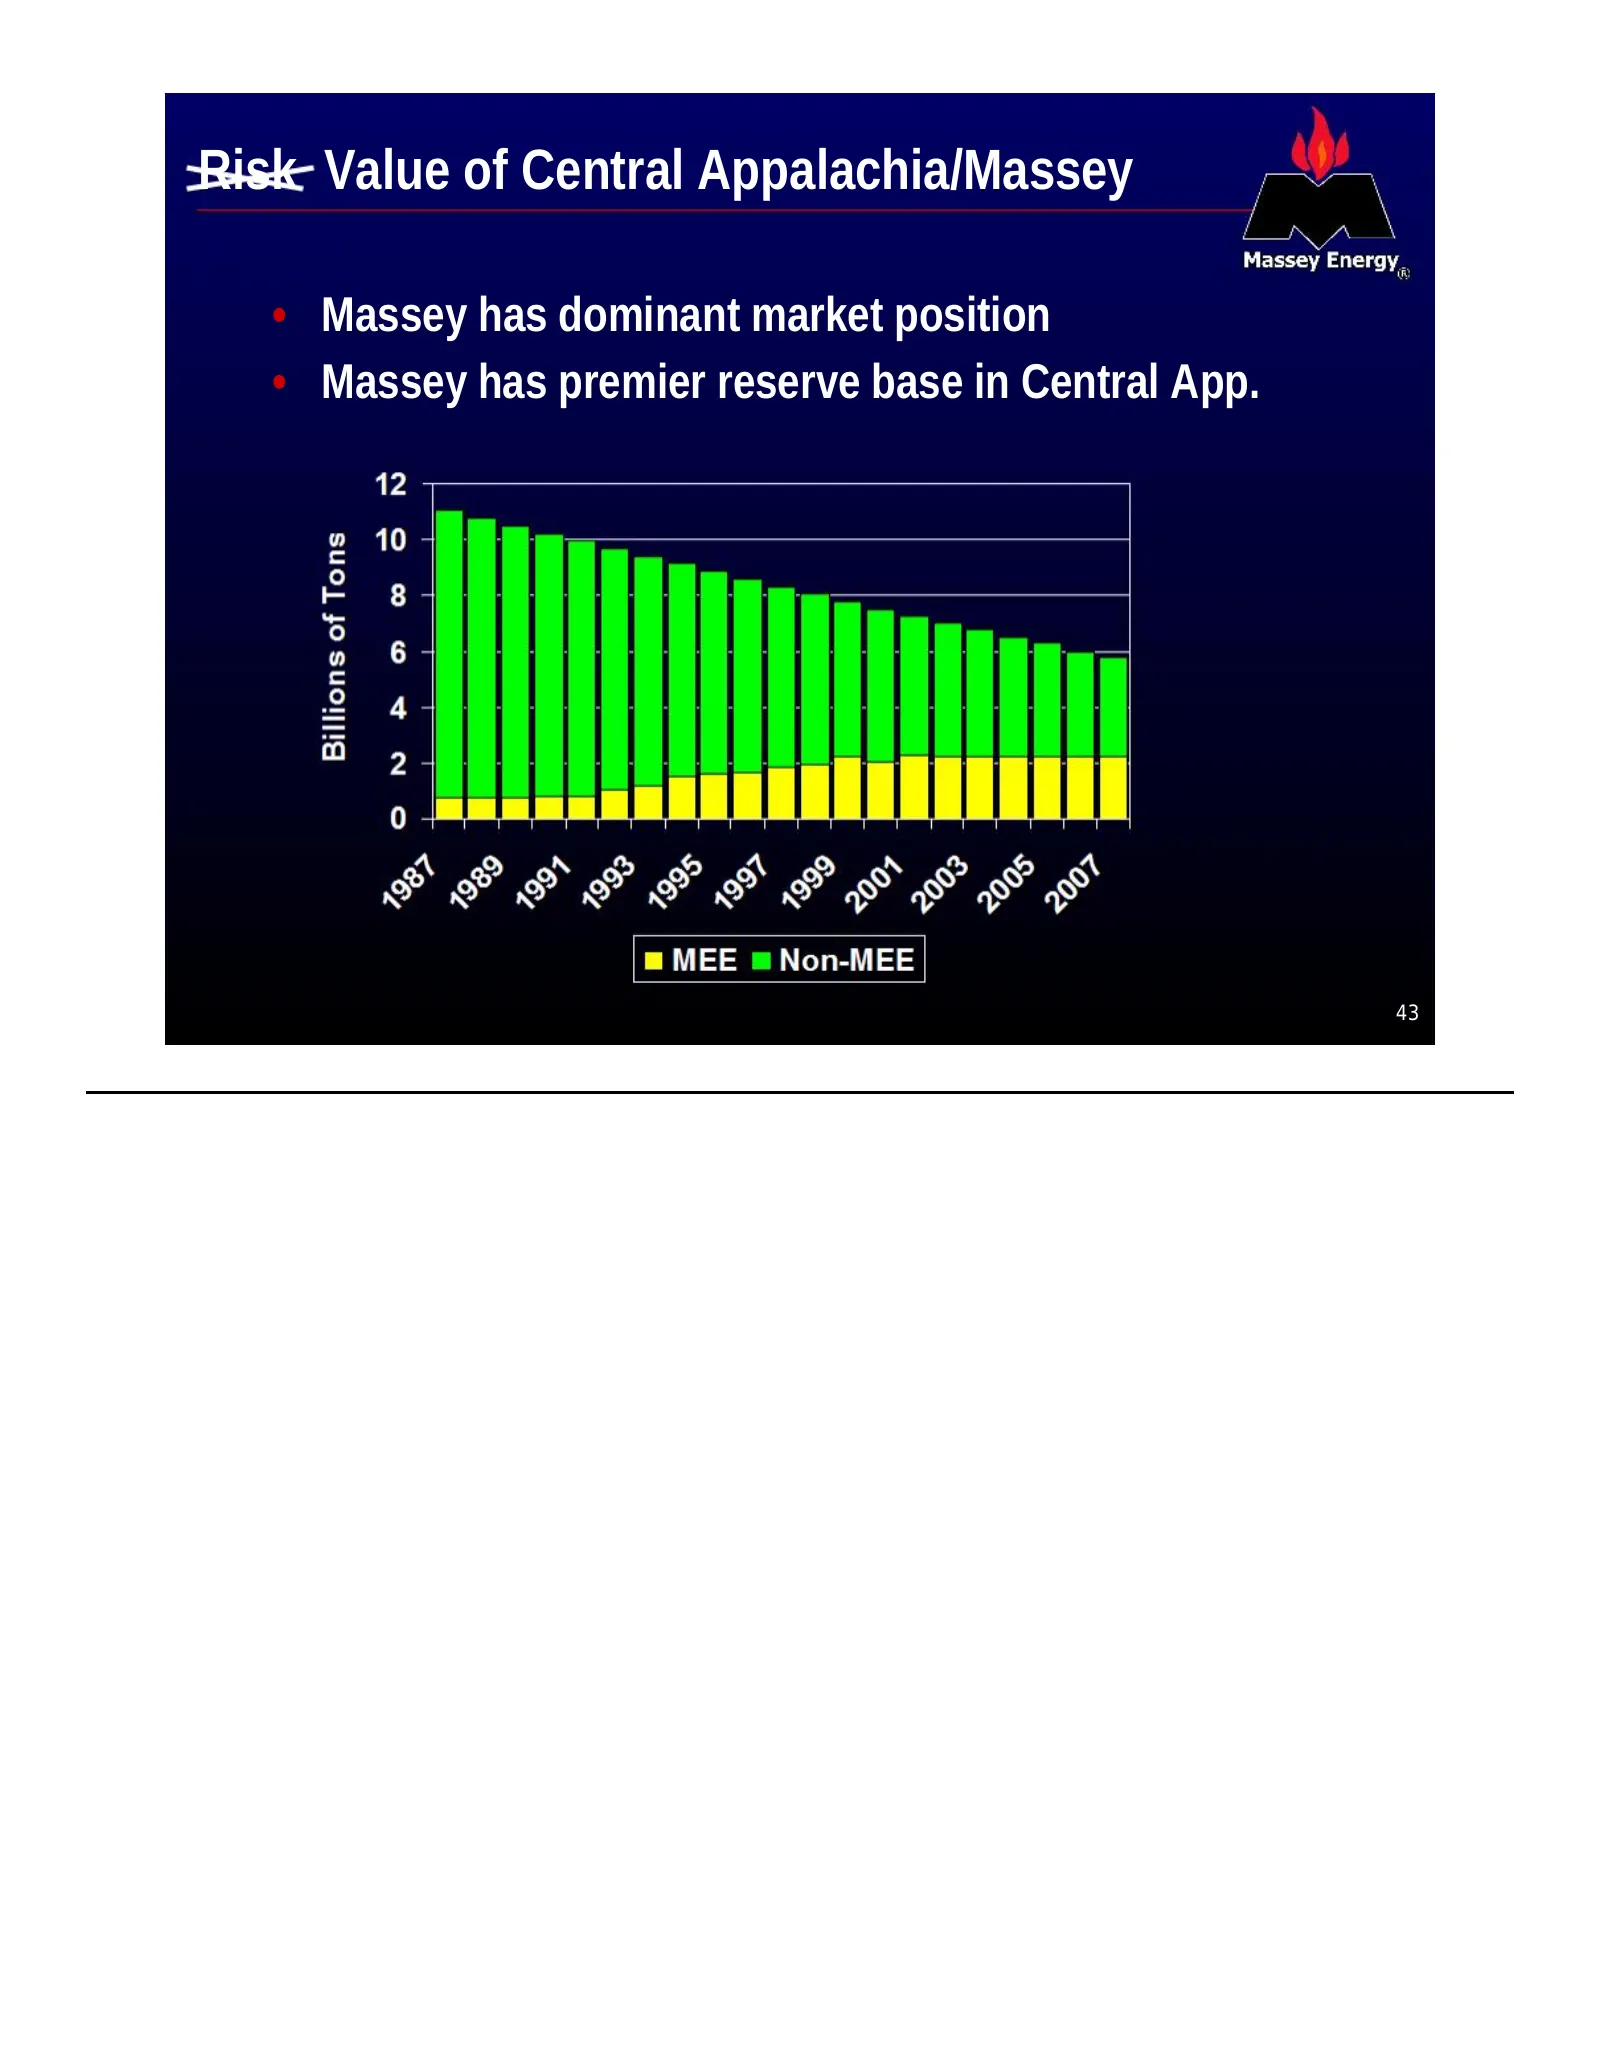
Risk Value of Central Appalachia/Massey • Massey has dominant market position • Massey has premier reserve base in Central App. 43
Slide 44: Execution Risk?
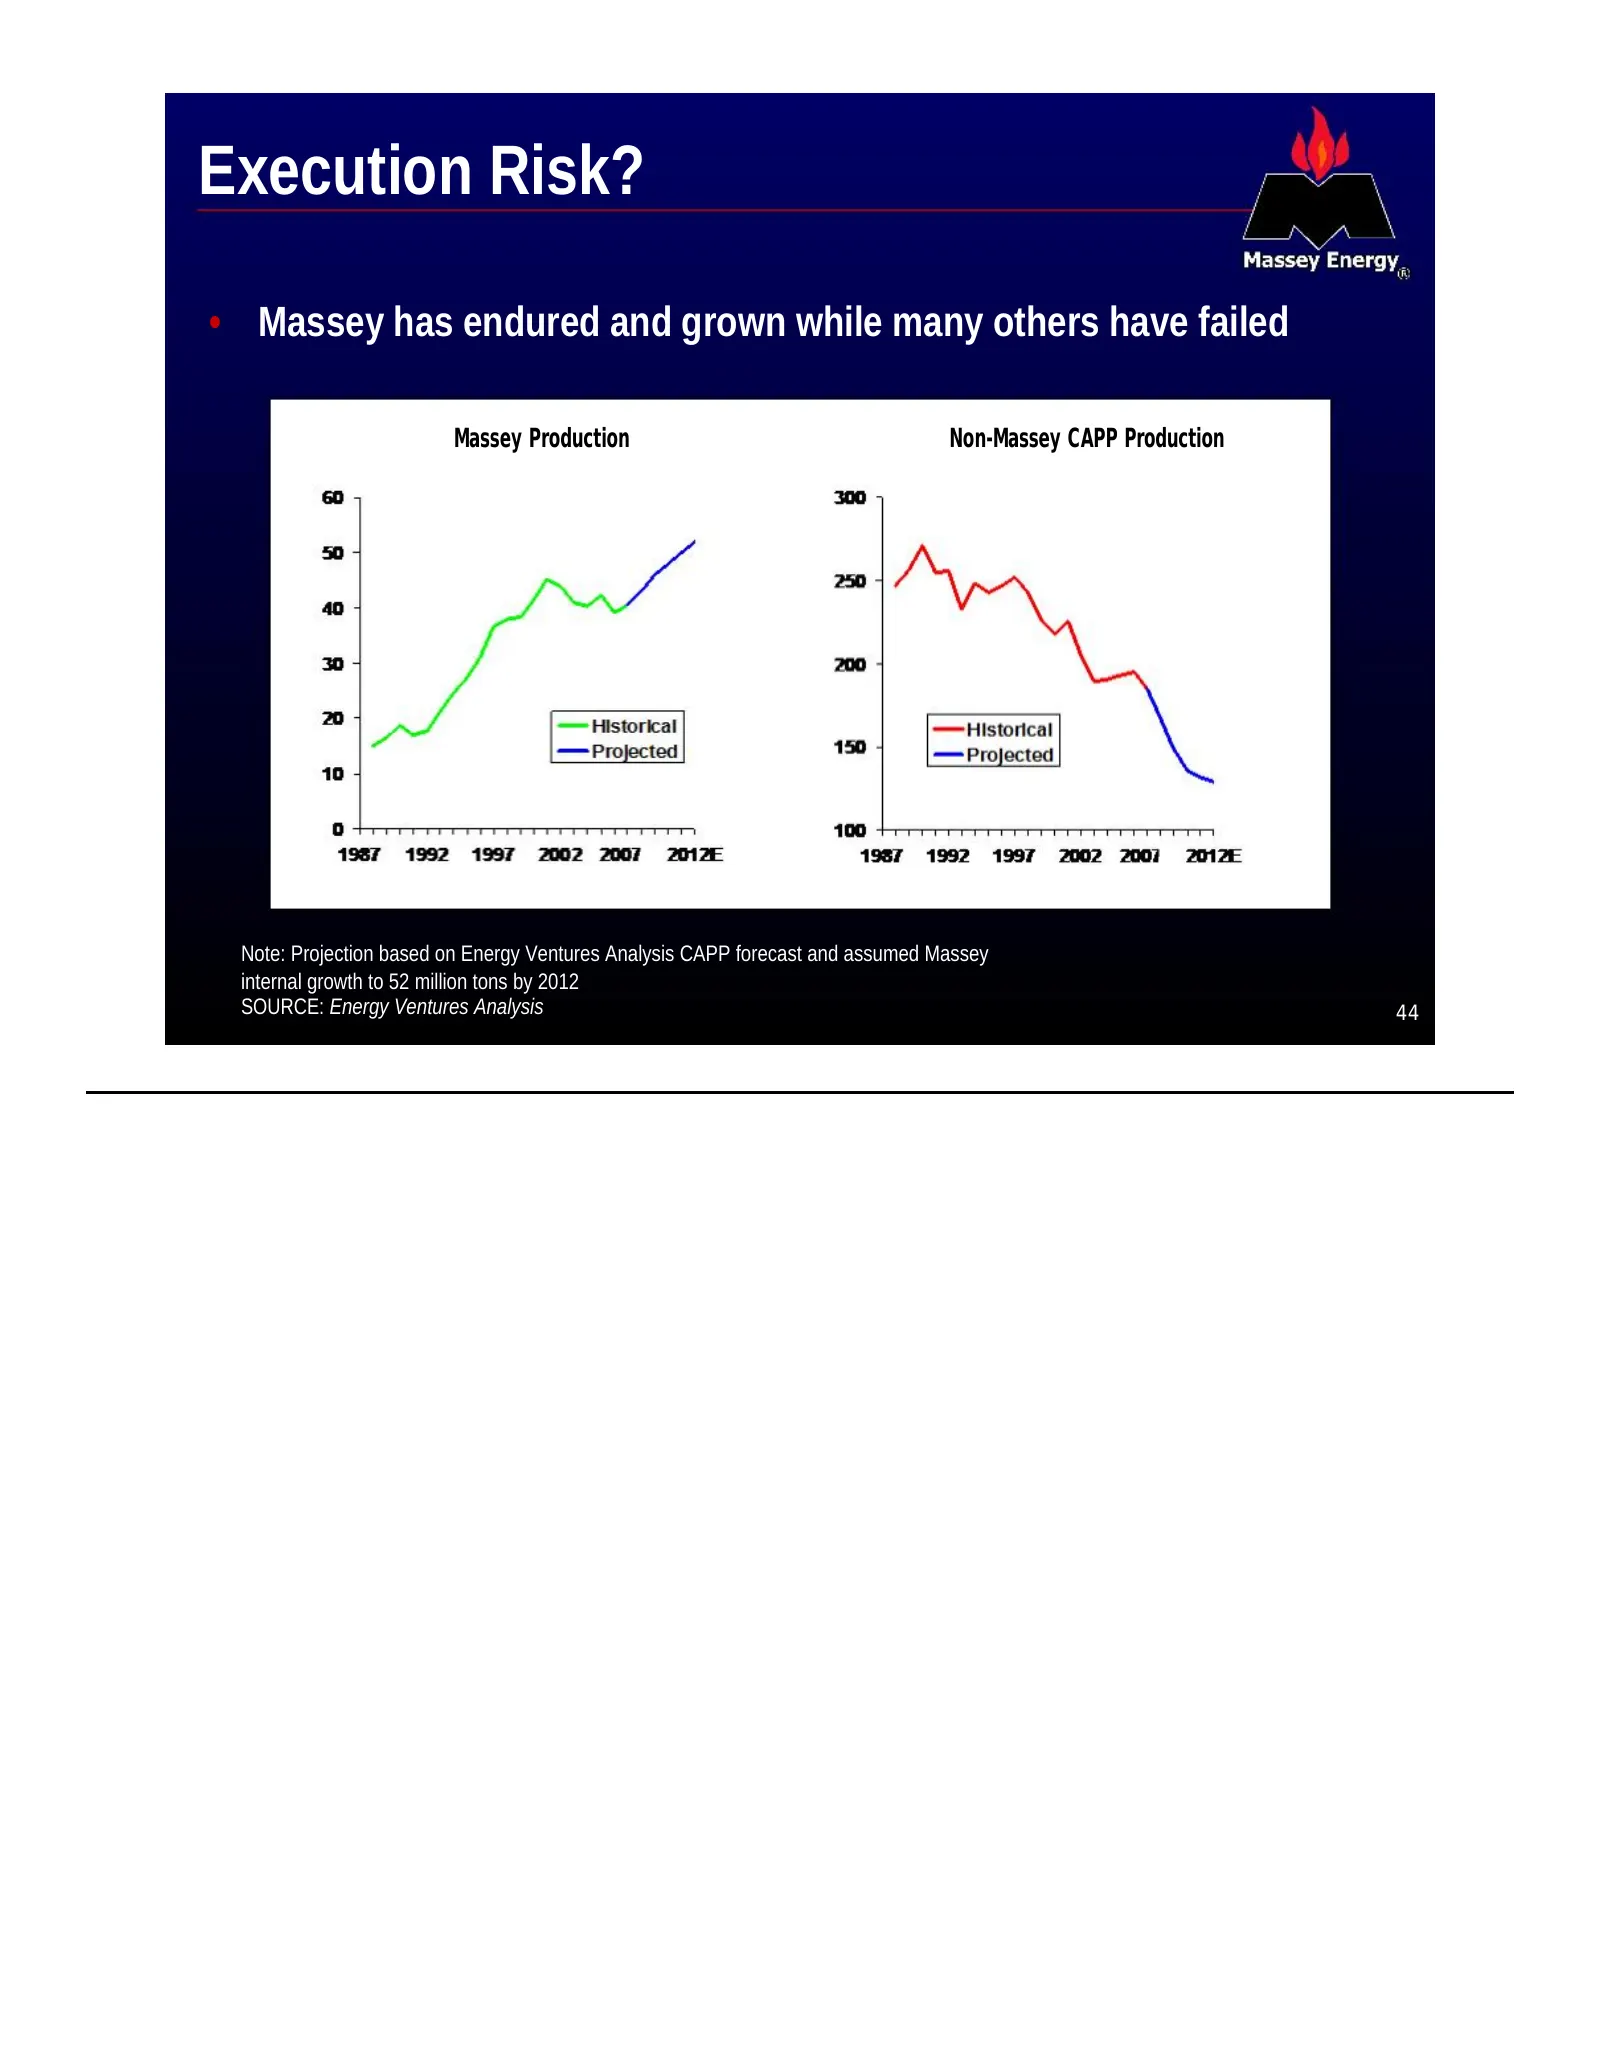
Execution Risk? • Massey has endured and grown while many others have failed Massey Production Non-Massey CAPP Production Note: Projection based on Energy Ventures Analysis CAPP forecast and assumed Massey internal growth to 52 million tons by 2012 SOURCE: Energy Ventures Analysis 44
Slide 45: Execution Risk?
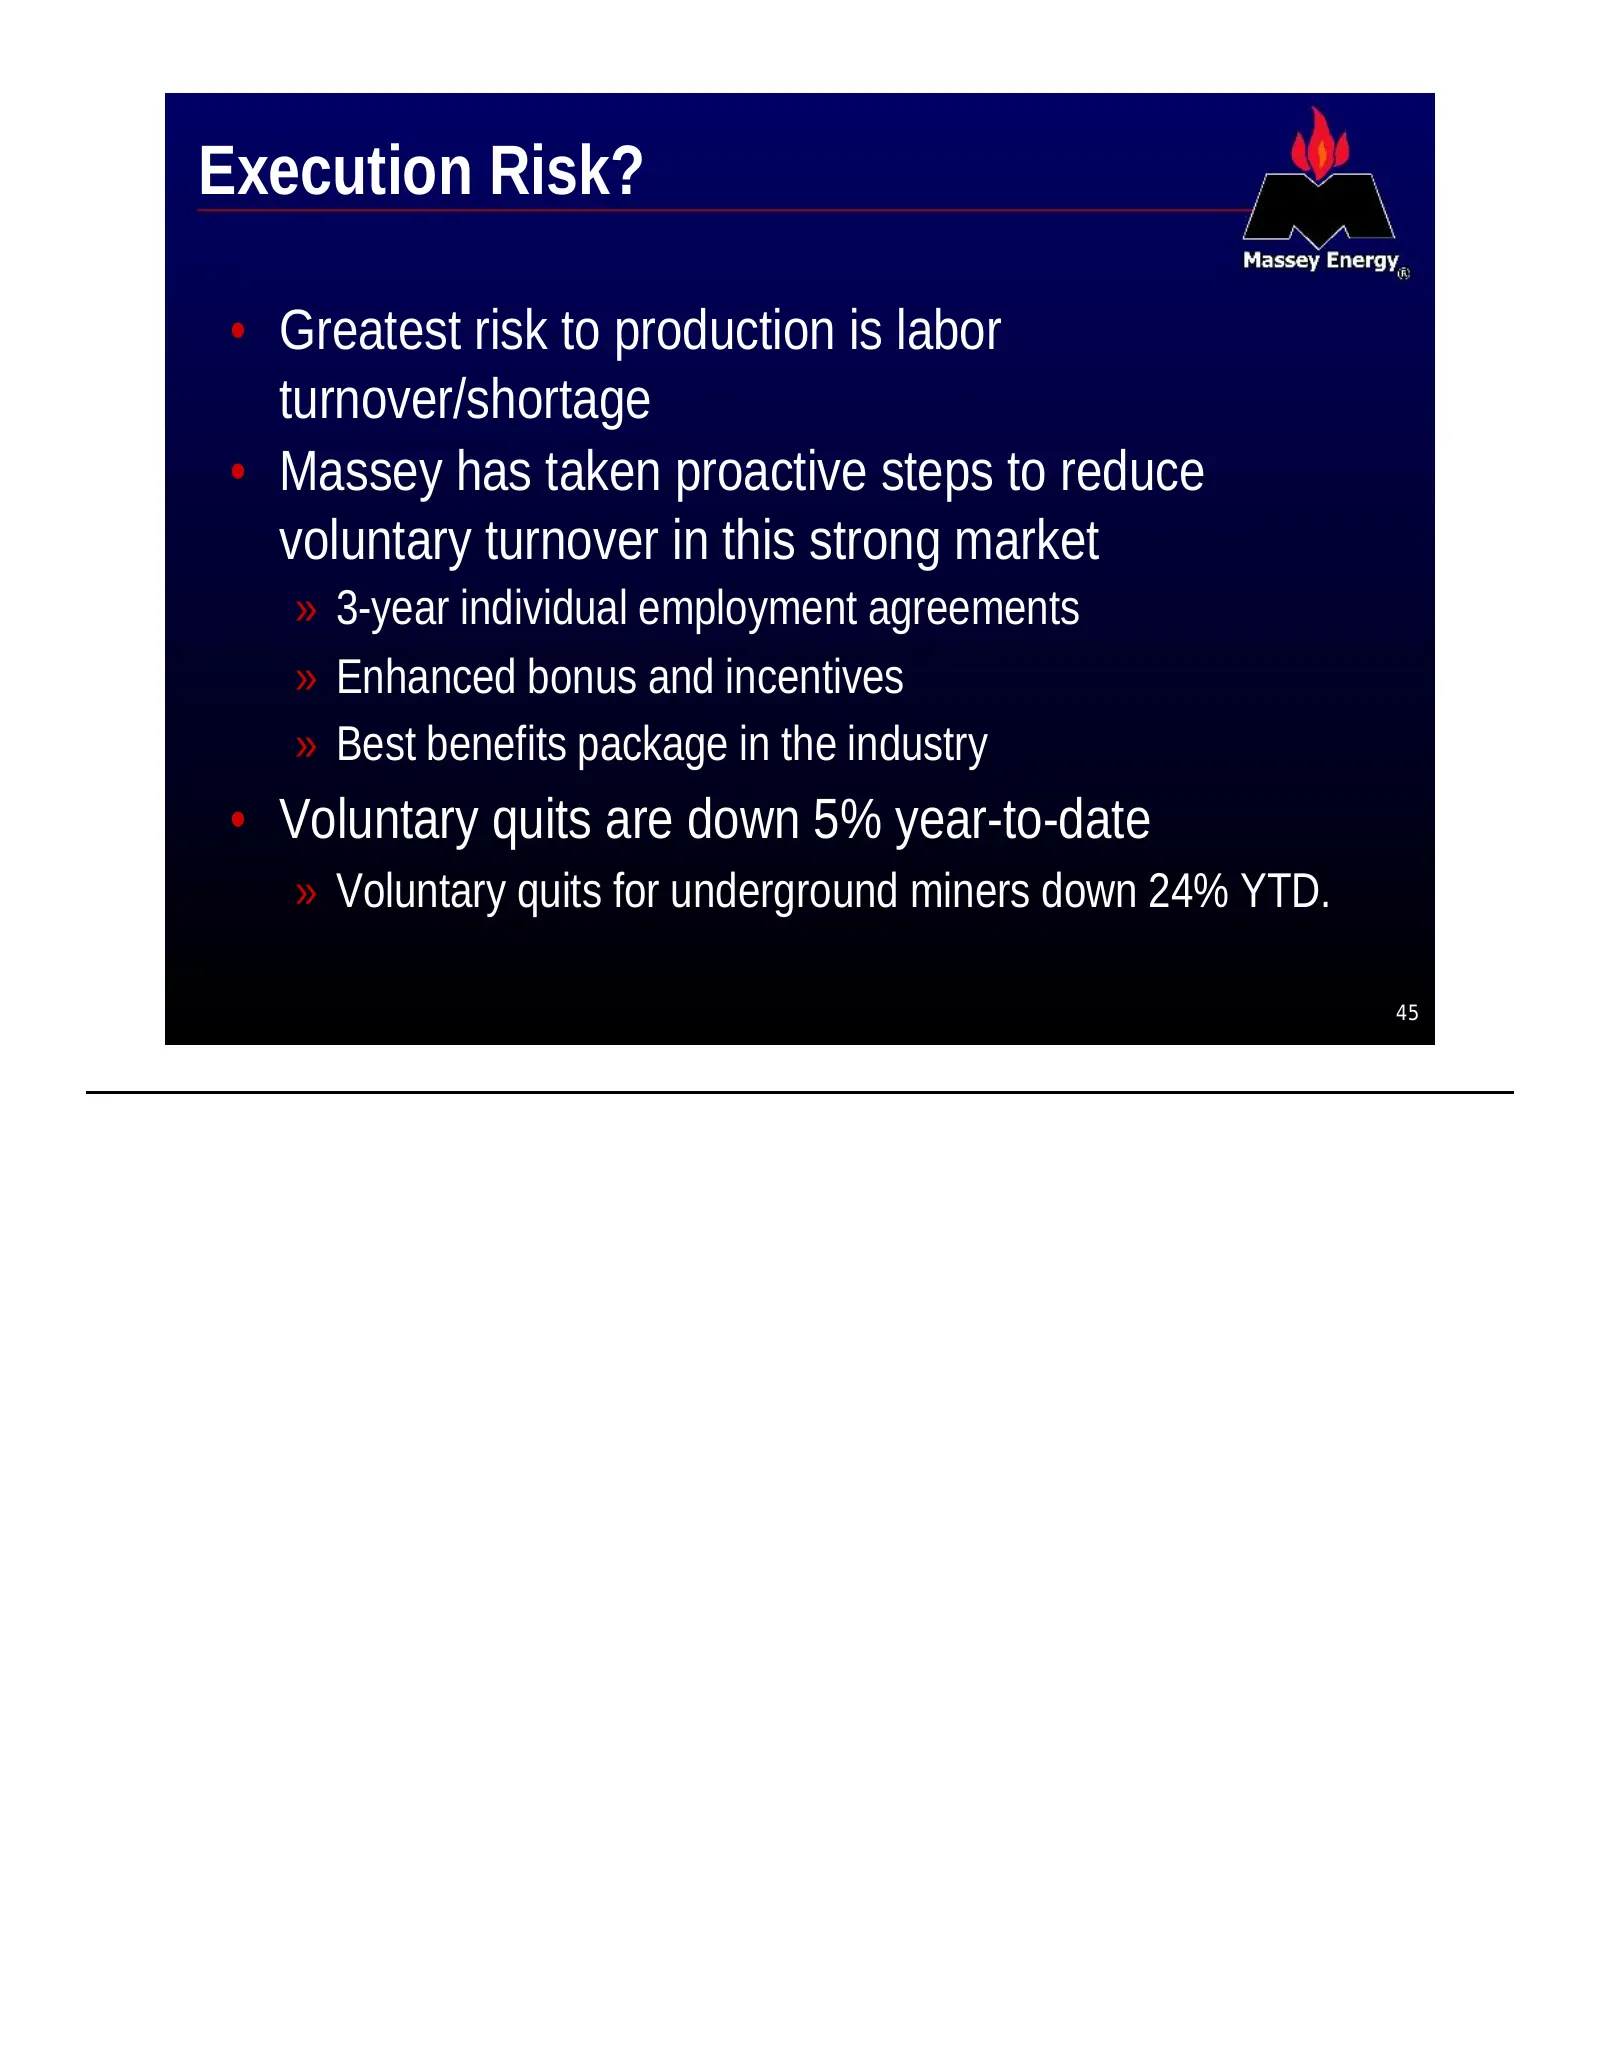
Execution Risk? • Greatest risk to production is labor turnover/shortage • Massey has taken proactive steps to reduce voluntary turnover in this strong market » 3-year individual employment agreements » Enhanced bonus and incentives » Best benefits package in the industry • Voluntary quits are down
Slide 46: Execution Risk?
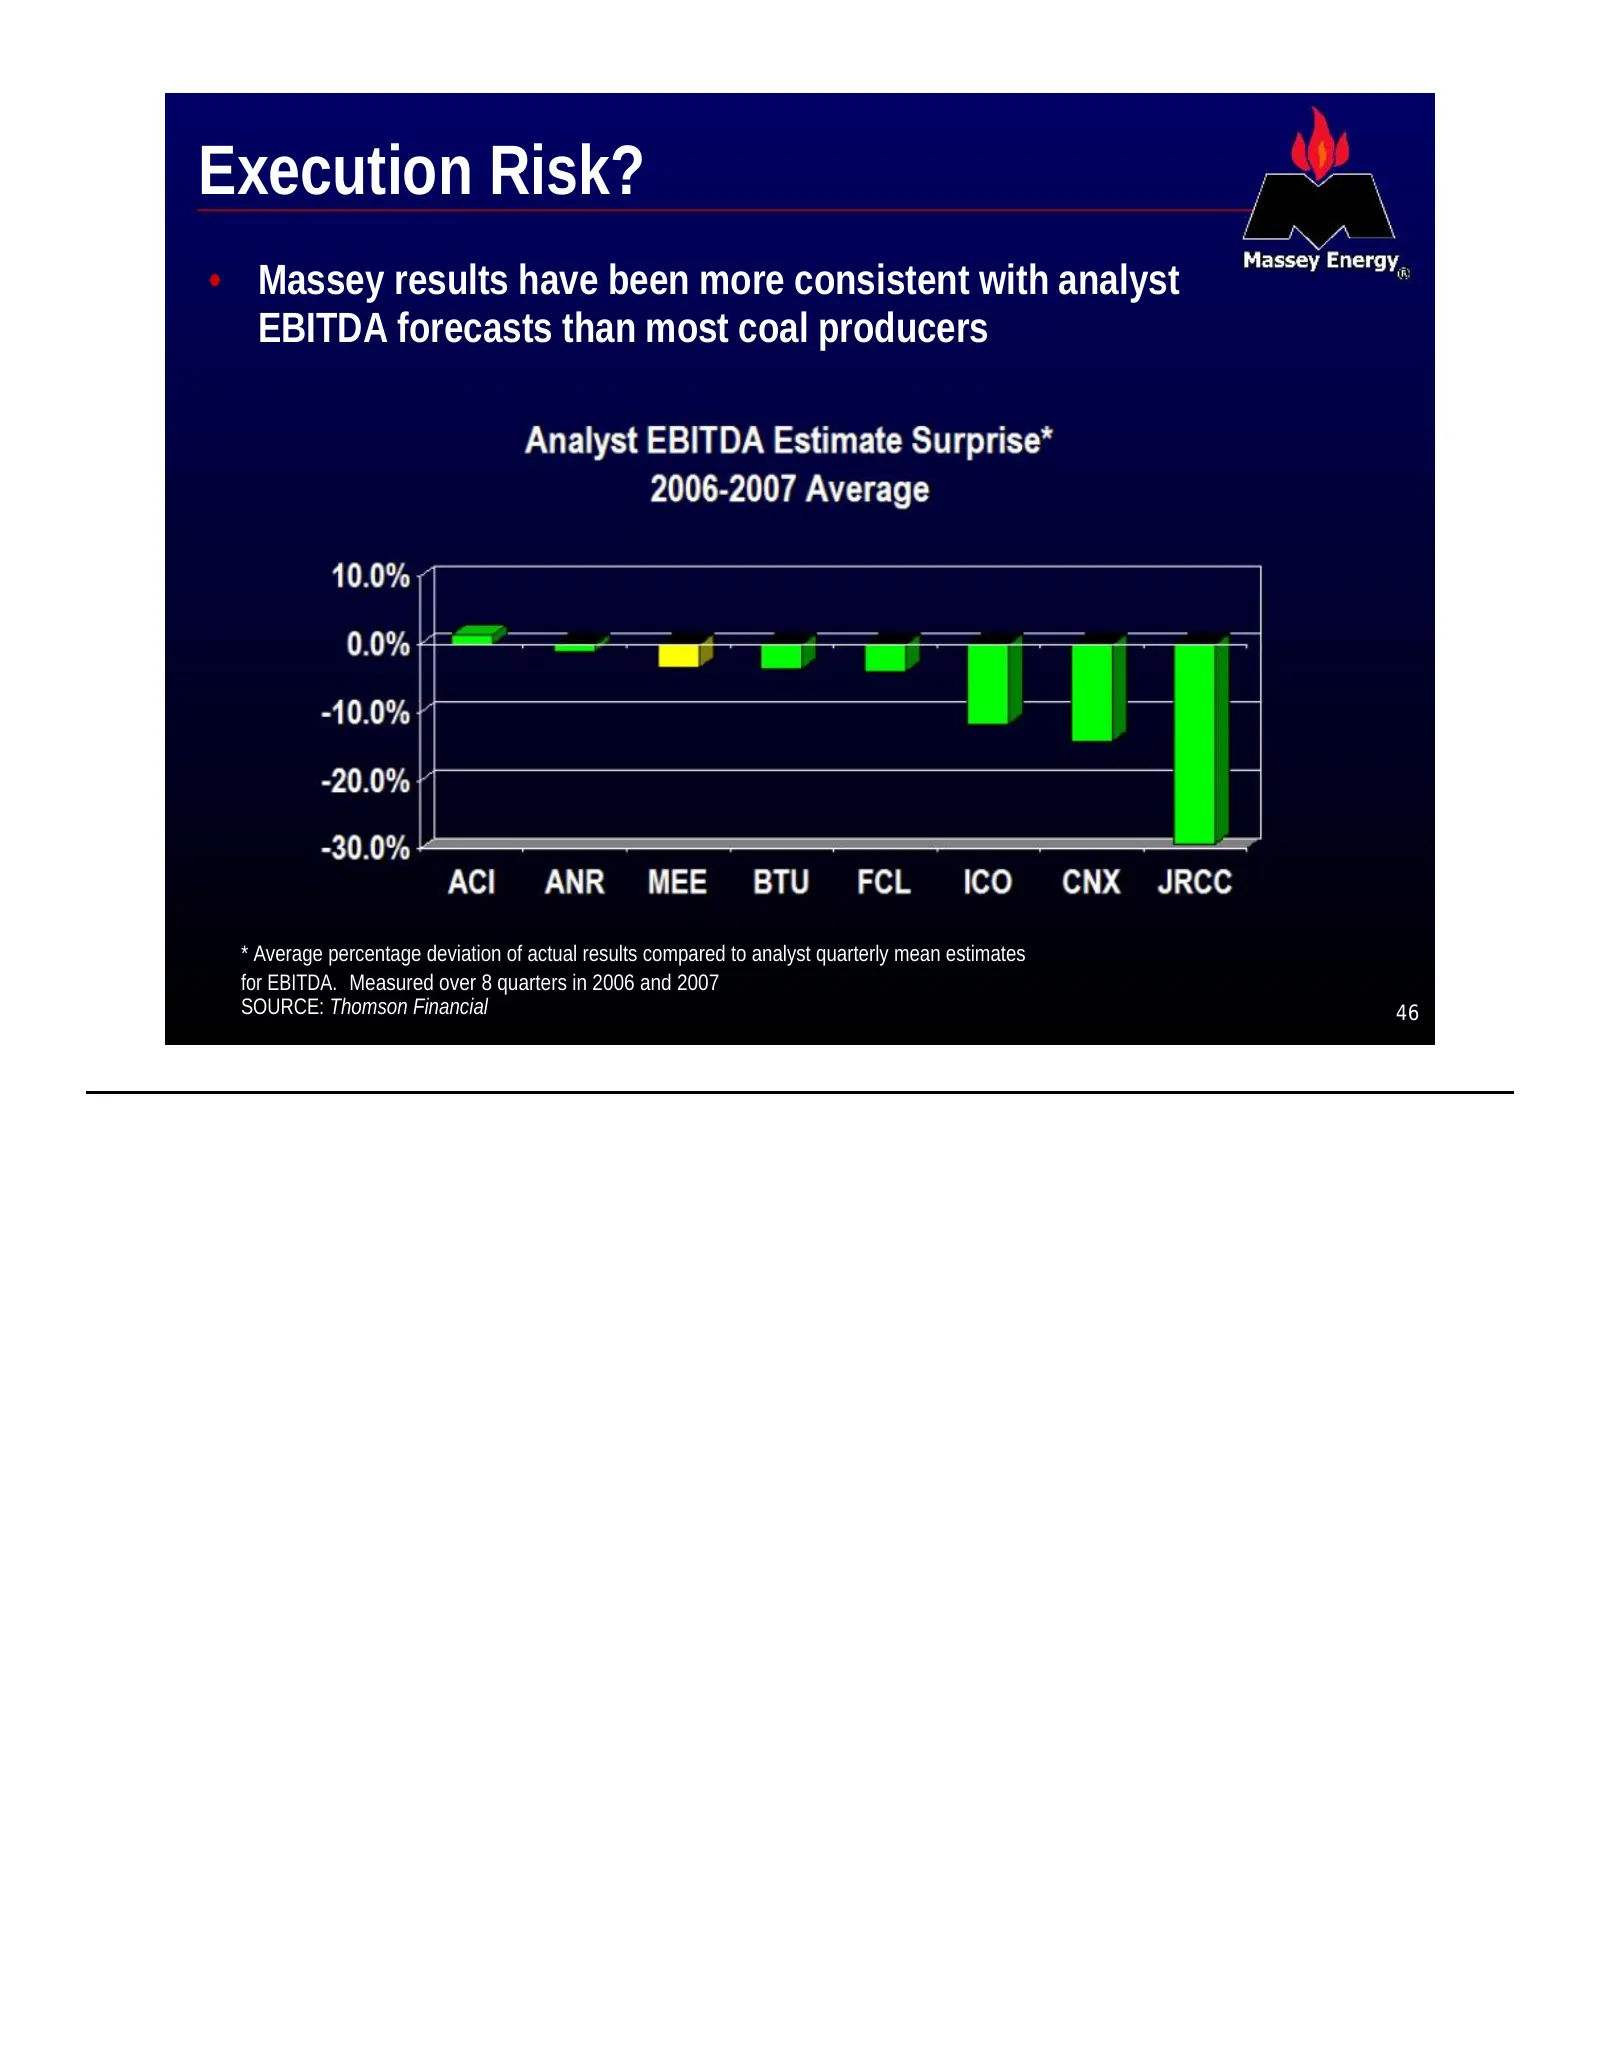
Execution Risk? • Massey results have been more consistent with analyst EBITDA forecasts than most coal producers * Average percentage deviation of actual results compared to analyst quarterly mean estimates for EBITDA. Measured over 8 quarters in 2006 and 2007 SOURCE: Thomson Financial 46
Slide 47: Litigation Risk?
Litigation Risk? • First place team always has a “target” on their back • Conforming or giving in on all issues is not in shareholders’ best interest in the long term • Massey has resources to manage known liabilities 47
Slide 48: Summary
Summary • Coal market outlook is strong • Expansion plans are on track and accelerating • Execution on plan will result in significant projected cash flow generation and growth • Investors have not recognized full value and opportunity of Massey • Massey remains focused on long-term enhancement of s
Slide 49: Disclaimer
Disclaimer FORWARD-LOOKING STATEMENTS: Certain statements in this press release are forward-looking as defined by the Private Securities Litigation Reform Act of 1995. Such forward-looking statements are based on facts and conditions as they exist at the time such statements are made as well as pred
Slide 50: Non-GAAP Information
Non-GAAP Information EBITDA is defined as income before interest and taxes, depreciation, depletion and amortization. Although EBITDA is not a measure of performance calculated in accordance with generally accepted accounting principles, management believes that it is useful to an investor in evalua

Slide 51: Doing the Right Thing... with Energy
Doing the Right Thing... with Energy
Source: SEC EDGAR · 8-K filed Apr 7, 2008
More decks from Massey Energy Co
 Merger or Acquisition (March 2011)18 slides · Mar 9, 2011
 BMO Capital Markets 2011 Global Metals & Mining Conference27 slides · Mar 1, 2011
 Credit Suisse Energy Summit 201126 slides · Feb 10, 2011
 Merger or Acquisition (January 2011)19 slides · Jan 31, 2011
 Proxy Contest (May 2010)32 slides · May 5, 2010
 Proxy Contest (April 2010)26 slides · Apr 30, 2010