Massey Energy — BMO Capital Markets 2011 Global Metals & Mining Conference
27 slides from Massey Energy's conference presentation, Mar 1, 2011
Slide 1: BMO Capital Markets 2011 Global Metals & Mining Conference
aA Alpha Natural Resources a ~ RUNNING RIGHT BMO Capital Markets 2011 Global Metals & Mining Conference March 1, 2011 Frank Wood, CFO
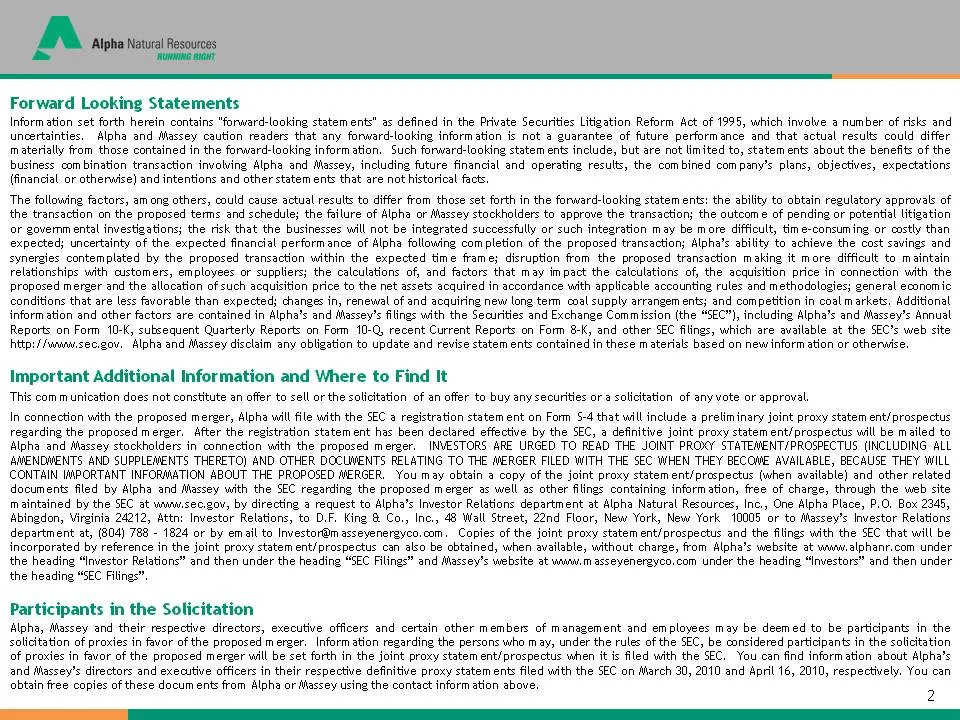
Slide 2: Forward Looking Statements
A Alpha Natural Resources ‘nome nein Forward Looking Statements Information set forth herein contsins“forwarchlooking statem ent as defined in the Private Securities Litigation Reform Act of 1995, which involve a number of risks and Uncertainties. Alpha and Massey caution readers that shy forward:lo
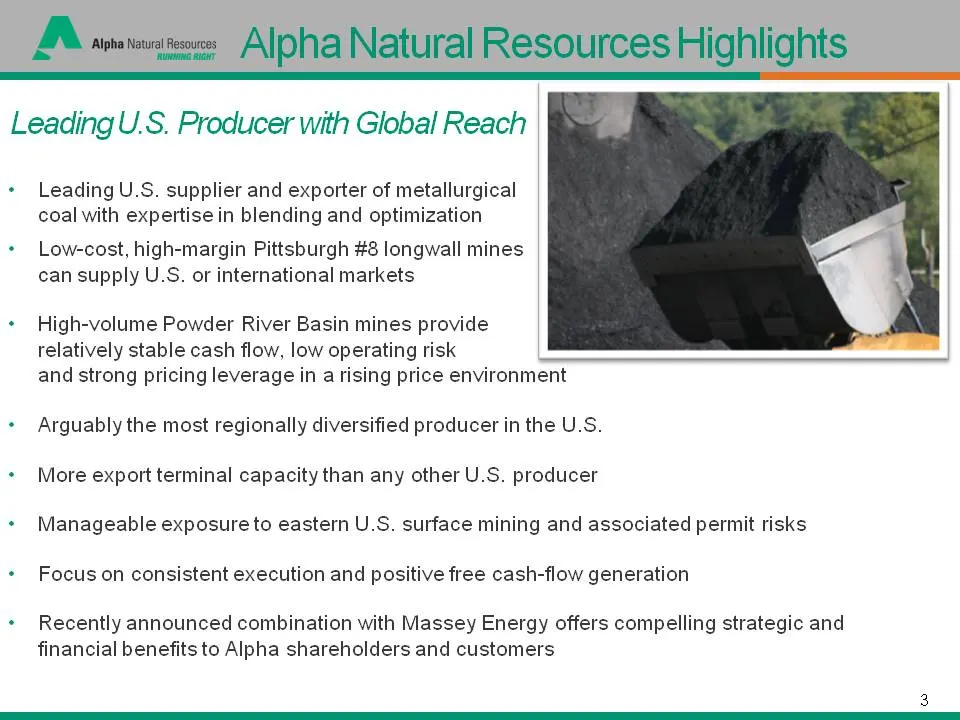
Slide 3: Alpha Natural Resources Highlights
AA mene Alpha Natural Resources Highlights Leading U.S. Producer with Global Reach + Leading U.S. supplier and exporter of metallurgical coal with expertise in blending and optimization + Low-cost, high-margin Pittsburgh #8 longwall mines can supply U.S. or international markets + High-volume Powder
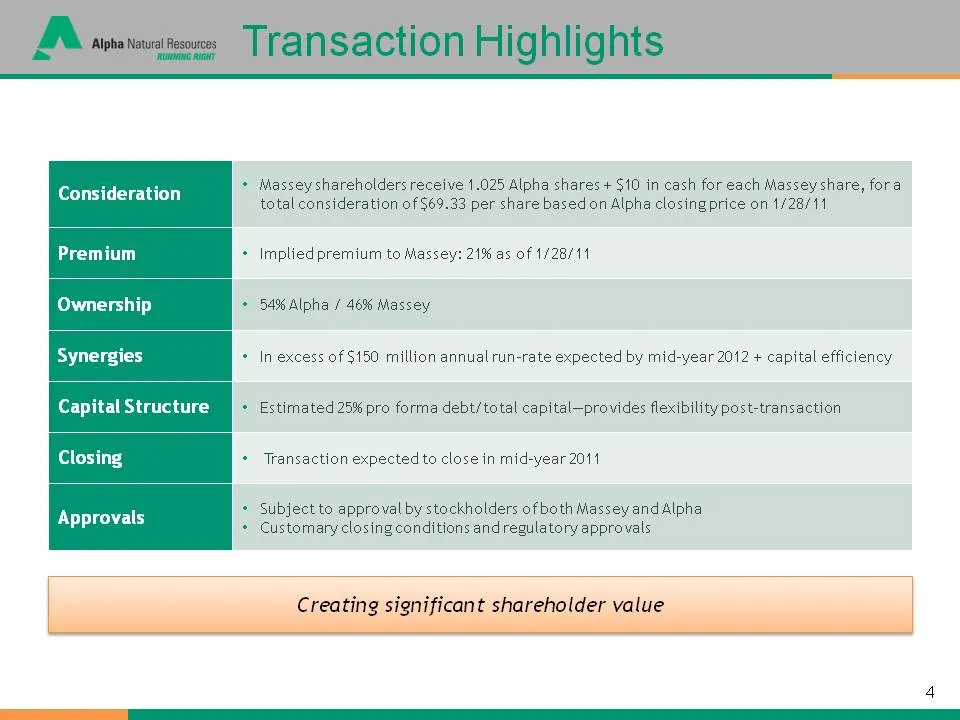
Slide 4: Transaction Highlights
AA sm eixe, Transaction Highlights Consideration Capital Structure Approvals Massey shareholders receive 1.025 Alpha shares + $10 in cash for each Massey share, fora total consideration of $69.33 per share based on Allpha closingprice on 1/28/11 Implied premium to Massey: 21% as of 1/28/11 54% Alpha
Slide 5: A Compelling Combination
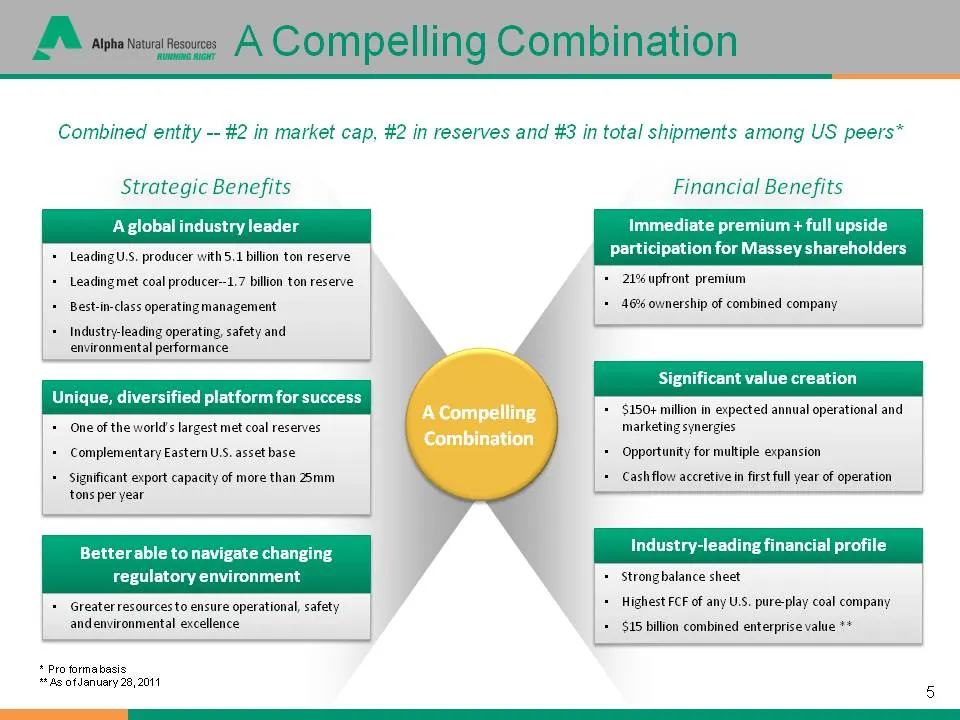
A smear A Compelling Combination Combined entity -- #2 in market cap, #2 in reserves and #3 in total shipments among US peers* Strategic Benefits Financial Benefits Aglobal industry leader Immediate premium + full upside + LeadingU.S, producer with 5.1 billion ton reserve n for Massey shareholders +
Slide 6: Combined company, a leading provider of total coal and met coal globally
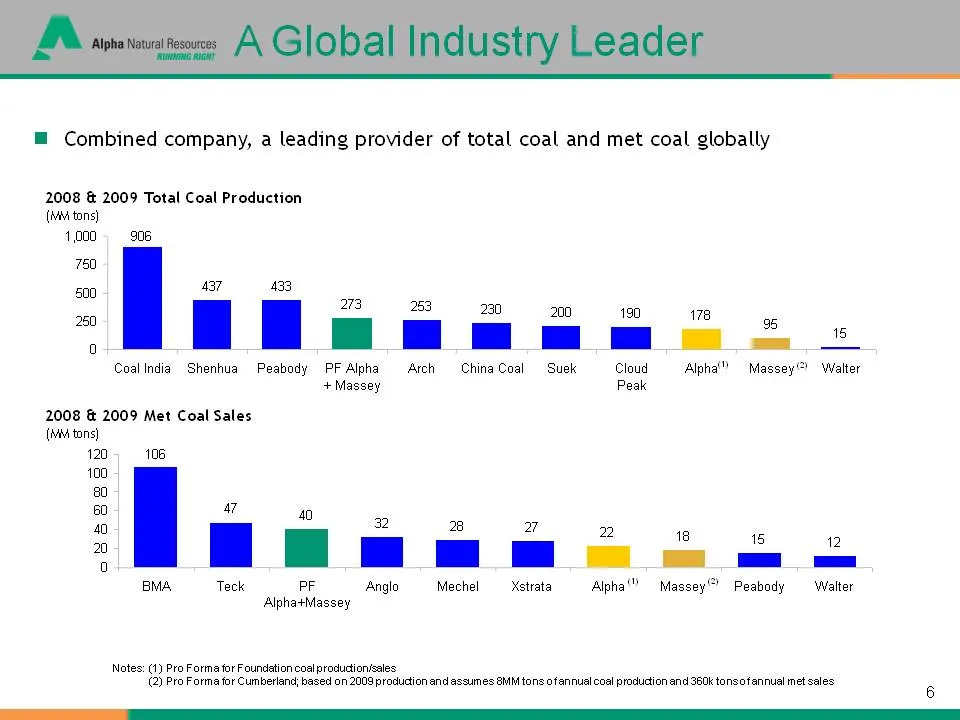
@ Combined company, a leading provider of total coal and met coal globally 2008 & 2009 Total Coal Production (WM tons} 4 Ae = aL eee Coal India Shenhua Peabody PF Alpha Arch China Coal Suek Cloud. «== Alpha!” Massey") Walter + Massey Peak 2008 & 2009 Met Coal Sales (i tons) 120) 106 ‘00 an. a 18 15
Slide 7: Complementary Footprint in Central App
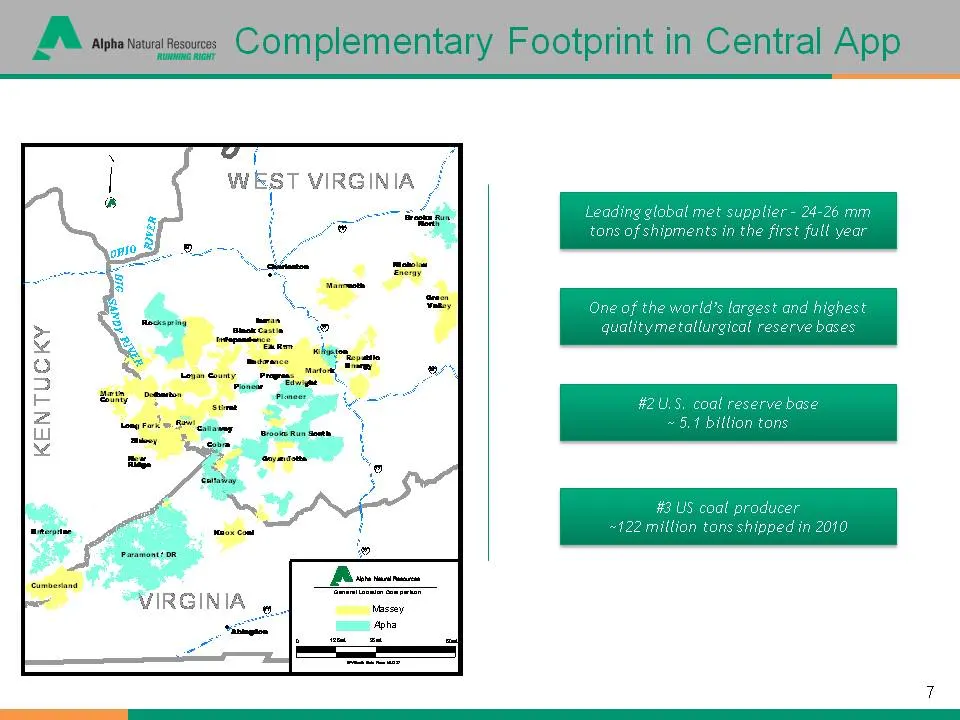
AA essoeateeee Complementary Footprint in Central App
Slide 8: Significant Expected Synergies
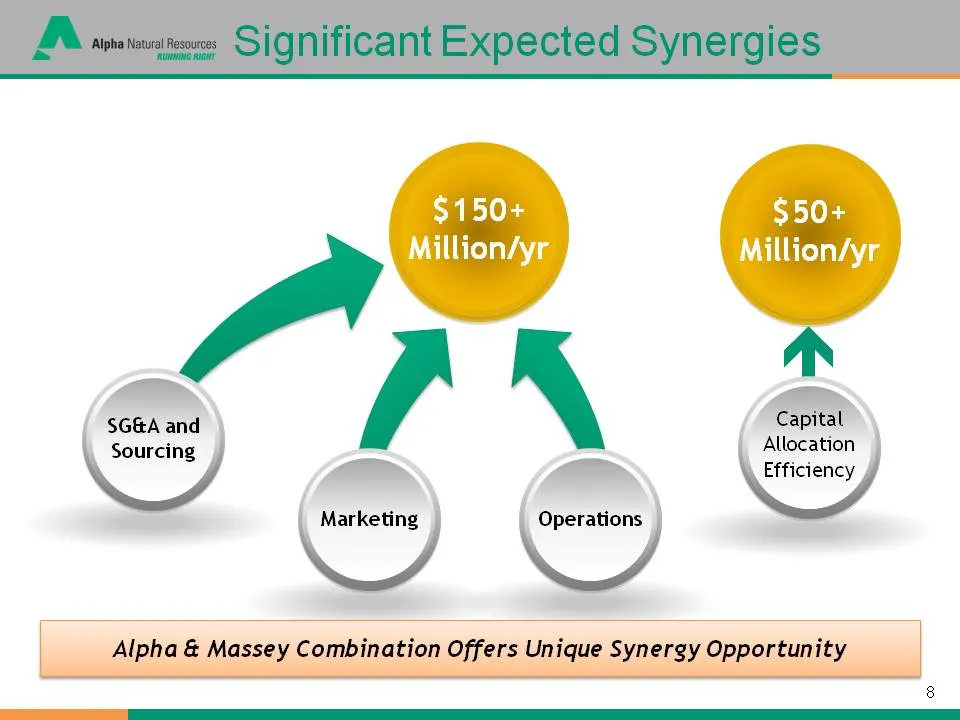
A vmmitere Significant Expected Synergies Zn SG&A and Capital \. Sourcing Allocation \ J \\ Efficiency Marketing Operations Alpha & Massey Combination Offers Unique Synergy Opportunity

Slide 9: Alpha Natural Resources
Alpha Natural Resources
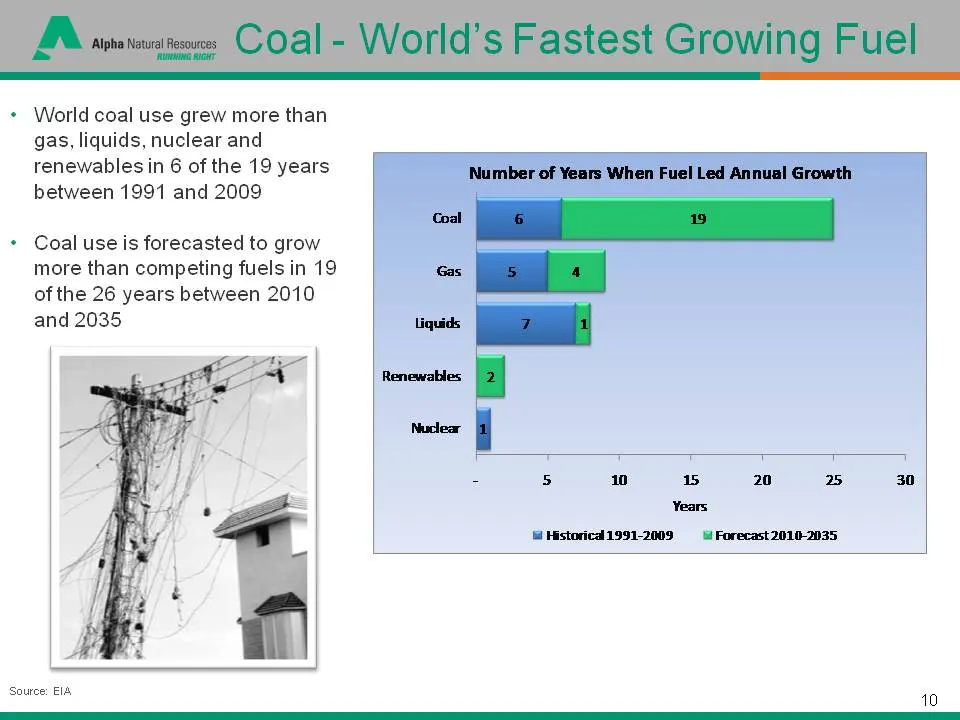
Slide 10: World coal use growth versus competing fuels
+ World coal use grew more than gas, liquids, nuclear and renewables in 6 of the 19 years between 1991 and 2009 + Coal use is forecasted to grow more than competing fuels in 19 of the 26 years between 2010 and 2035 Source: ElA Coal Gas Number of Years When Fuel Led Annual Growth Years li Historic 19
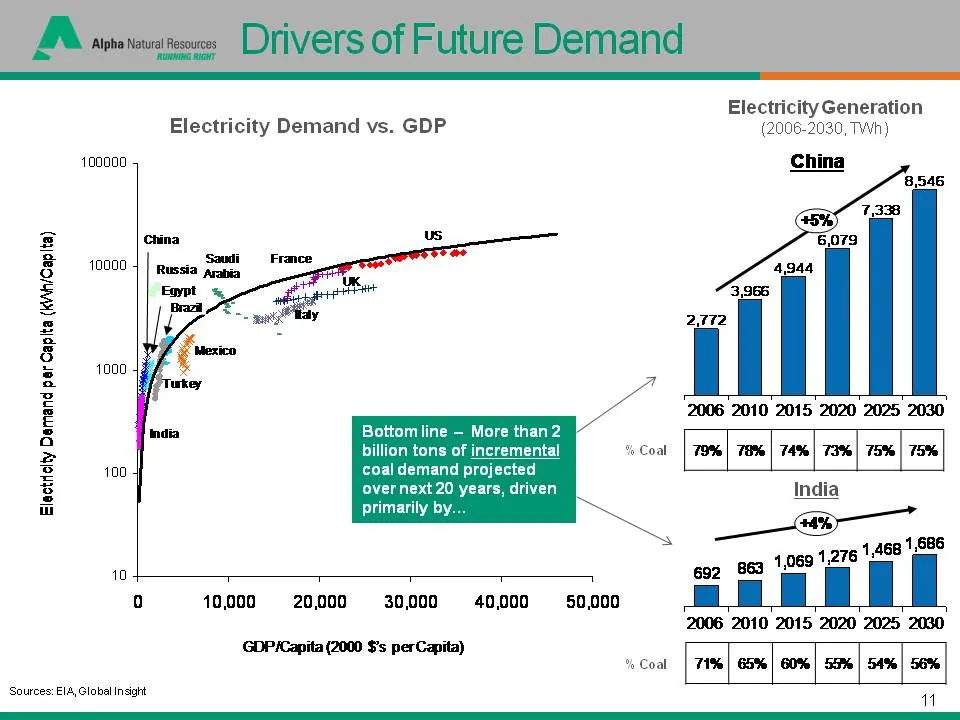
Slide 11: Electricity Demand vs. GDP
10000 1000 1000 100 Electricity Demand per Capita (kVWh/Capita) 10 Electricity Demand vs. GDP Bottom line — More than 2 billion tons of incremental coal demand projected over next 20 years, driven primarily by... Q Sources: Ela, Global Insight 10,000 20,000 30,000 40,000 GDPiCapita (2000 $'s perCapi
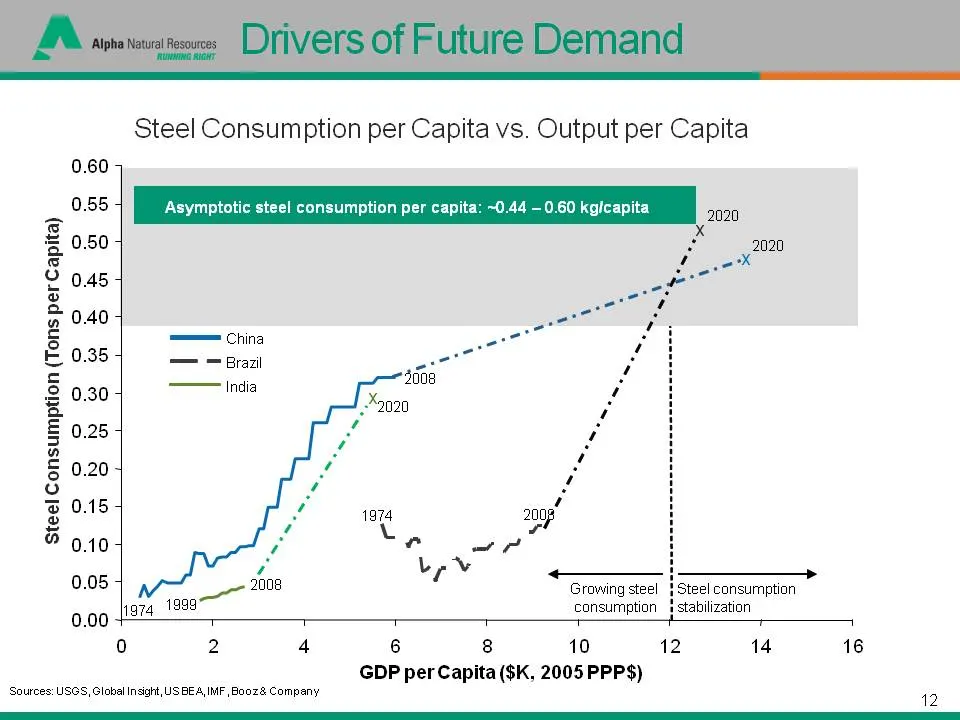
Slide 12: Steel consumption per capita vs. output per capita
(ESB) Asymptotic steel consumption per cay Steel Consumption per Capita vs. Output per Capita 60 kgicapita supa —_ _ | Growing steel} Steel consumption azg 1999 consumption {stabilization 0 2 4 6 8 10 12 14 16 GDP per Capita ($K, 2005 PPP$) Sources: USGS, Global Insight, USBEA,IMF ,Booz& Company 12
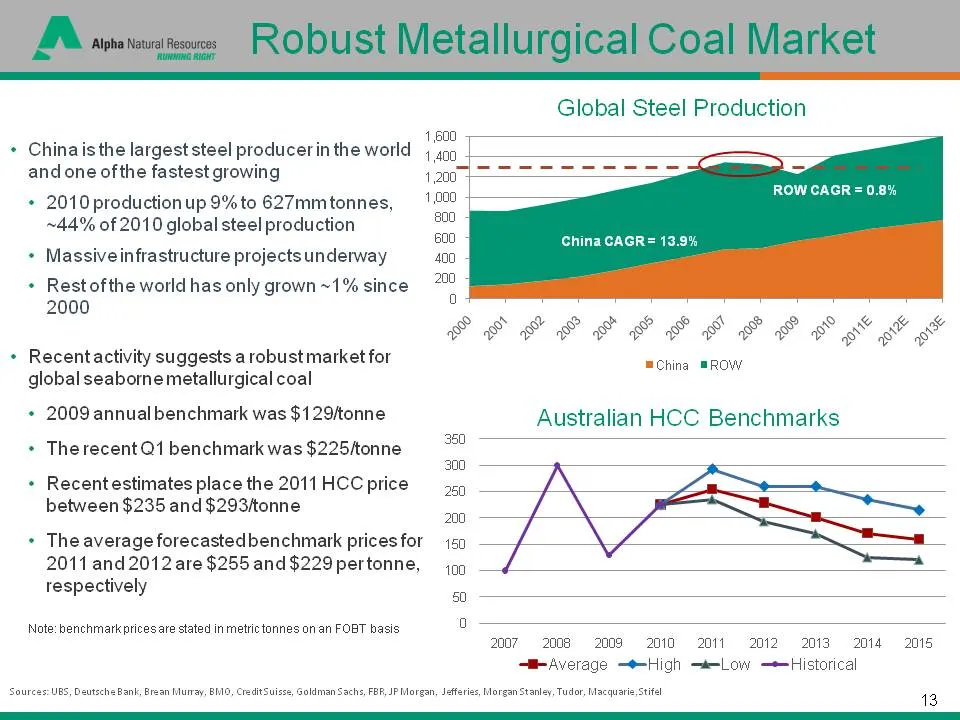
Slide 13: Robust Metallurgical Coal Market
AA vmionsteeee Robust Metallurgical Coal Market Global Steel Production a ' 1,600 * Chinais the largest steel producerinthe world {sop and one ofthe fastest growing 4297 ROW CAGR =0¥ + 2010 productionup9%to 627mmtonnes, 10% ~44% of 2010 global steel production China CAGR= 13.9% + Massiveinfrastructu
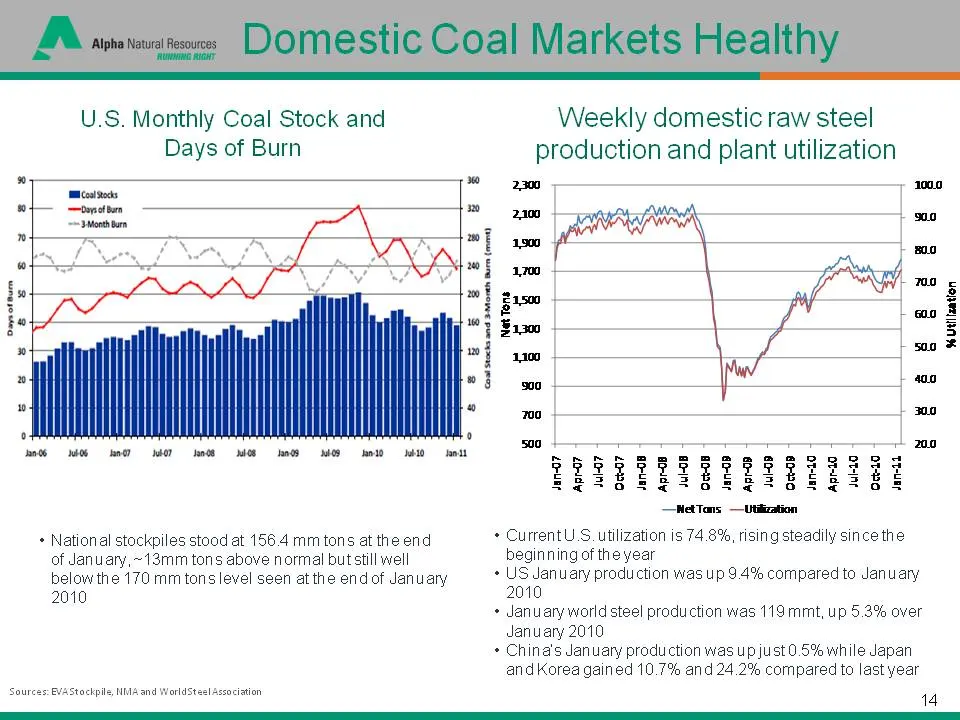
Slide 14: U.S. Monthly Coal Stock and Weekly domestic raw steel production
U.S. Monthly Coal Stock and Weekly domestic raw steel Days of Burn production and plant utilization ‘Utilization i Beerergeee —NetTans —Utiization + National stockpiles stood at 156.4 mm tons at the end + CurrentU.S. utilization is 74.8%, rising steadily since the of January,~13mm tons above normal
Slide 15: Alpha Natural Resources Overview
A Alpha Natural Resources mn Alpha Natural Resources Overview Leading U.S. Producer With Global Reach 15
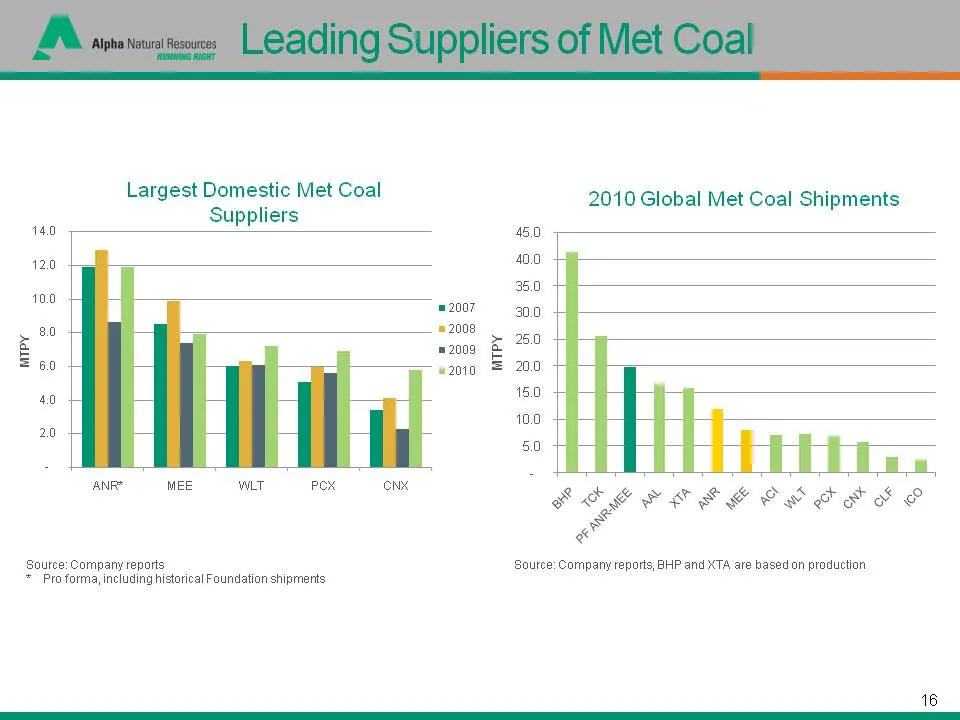
Slide 16: Largest Domestic Met Coal Suppliers
Largest Domestic Met Coal 2010 Global Met Coal Shipments Suppliers 14.0 45.0 y20 | 40.0 tb 36.0 "2007 ang = 2008 2 > m0 Pe m2009 2 oa sono = 20 40 15.0 10.0 20 50 ANR® MEE WLT POX CNX . ° ¢ Source: Company reports Source: Company reports, BHP and XTA are hased on production > Pro forma, including hi
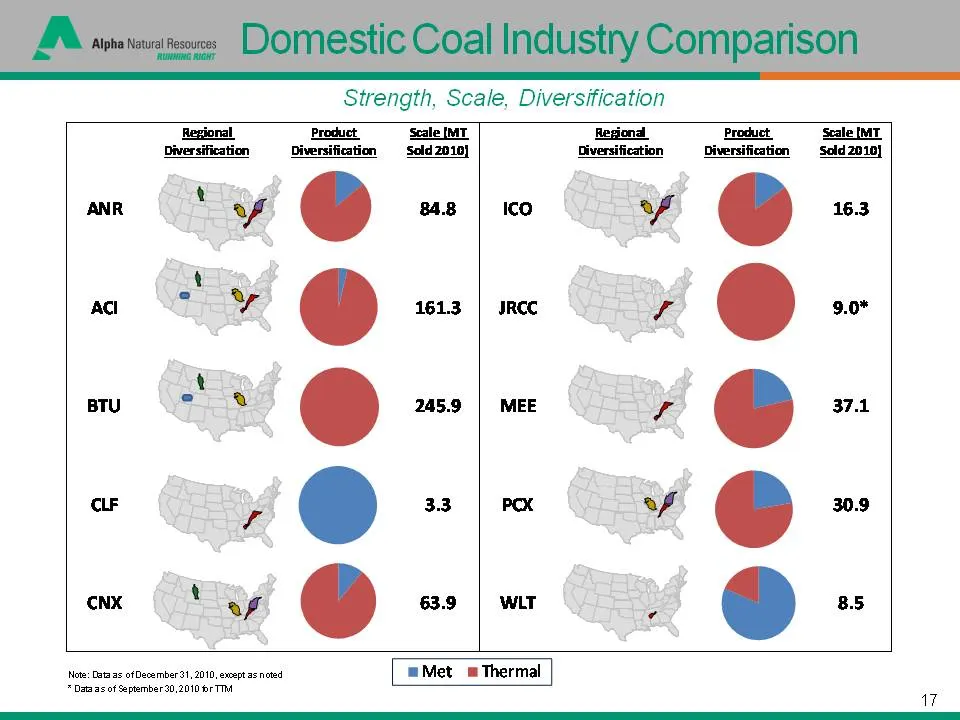
Slide 17: Strength, Scale, Diversification
Strength, Scale, Diversification Regional, Product ‘Seale [MT Regional Product ‘Seale [MT Diversification Diversification Sold 2010] Diversification Diversification Sold 2010] 16.3 sag | ico Avan 161.3 JRCC ¥ f y t » 4 man, { ™ a! © aeyee a Cg aa” + } CLF CNX ‘ 63.9 WLT vs Note: Data as ofDecember31
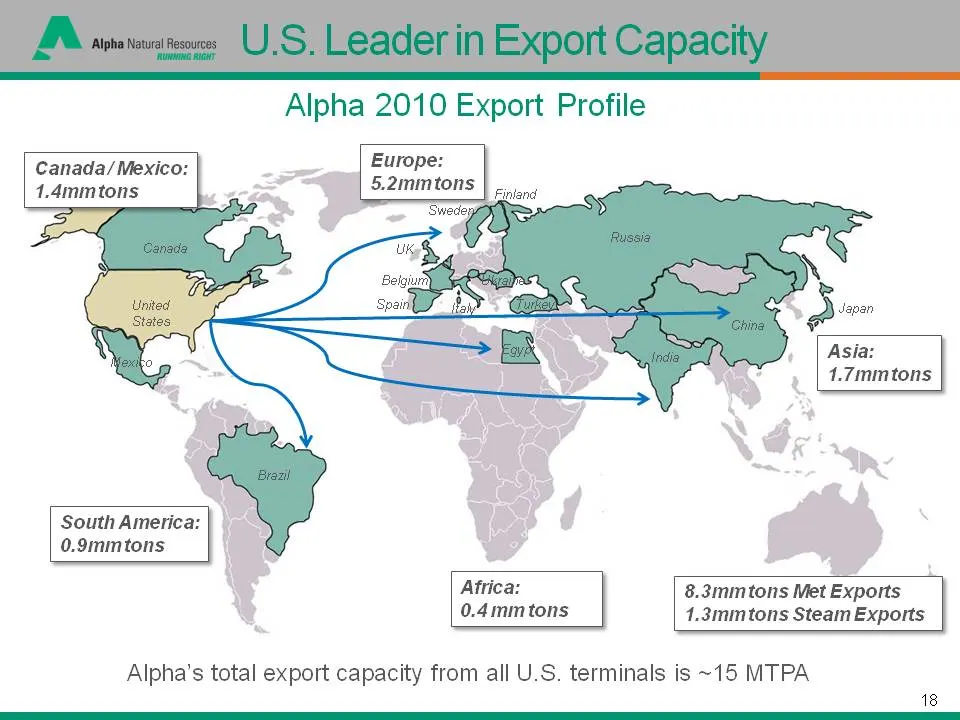
Slide 18: Alpha 2010 Export Profile
Alpha 2010 Export Profile Canada/Mexico: Europ 1.4mmtons 2mmtons ‘Swede Uke Beigiury United Spaint States 0 South America: 0.9mmtons ER Asia: Finland Soon 1.7mmtons Africa: 8.3mmtons Met Exports 0.4mm tons 1.3mmtons Steam Exports Alpha’s total export capacity from all U.S. terminals is ~15 MTPA 18
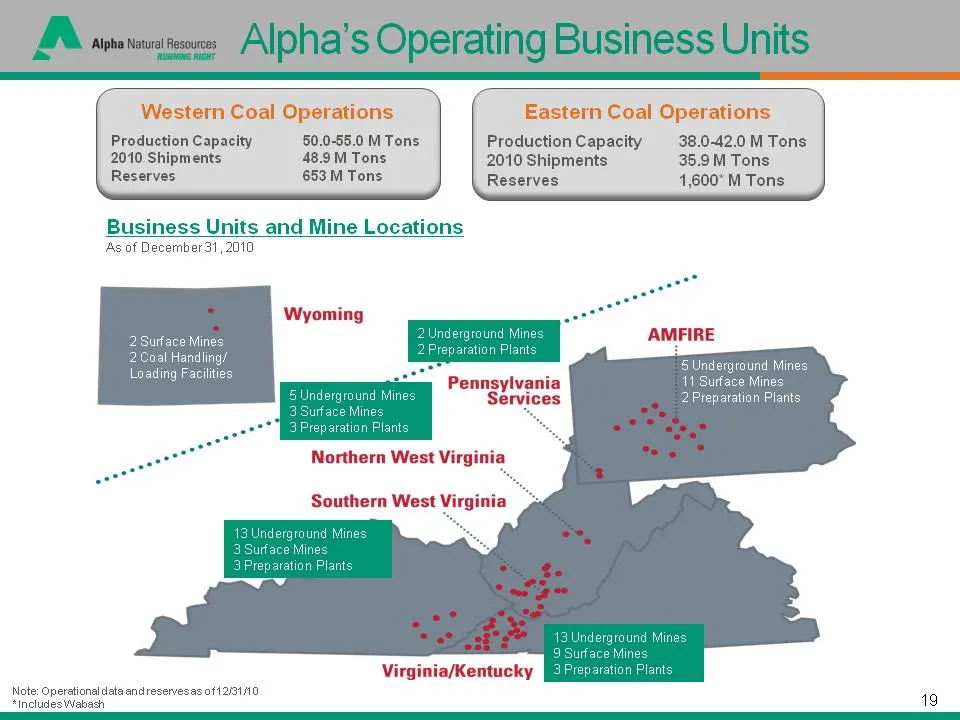
Slide 19: Business Units and Mine Locations
Production Capacity 38.0-42.0 M Tons 2010 Shipments 35.9M Tons Reserves 1,600° M Tons Production Capacity 50.0-55.0 M Tons 2010 Shipments 48.9 M Tons Reserves 653 M Tons Business Units and Mine Locations As of December31,2010 in val Handling? dling reparation Pla Note: Operationaldata and resenesas.
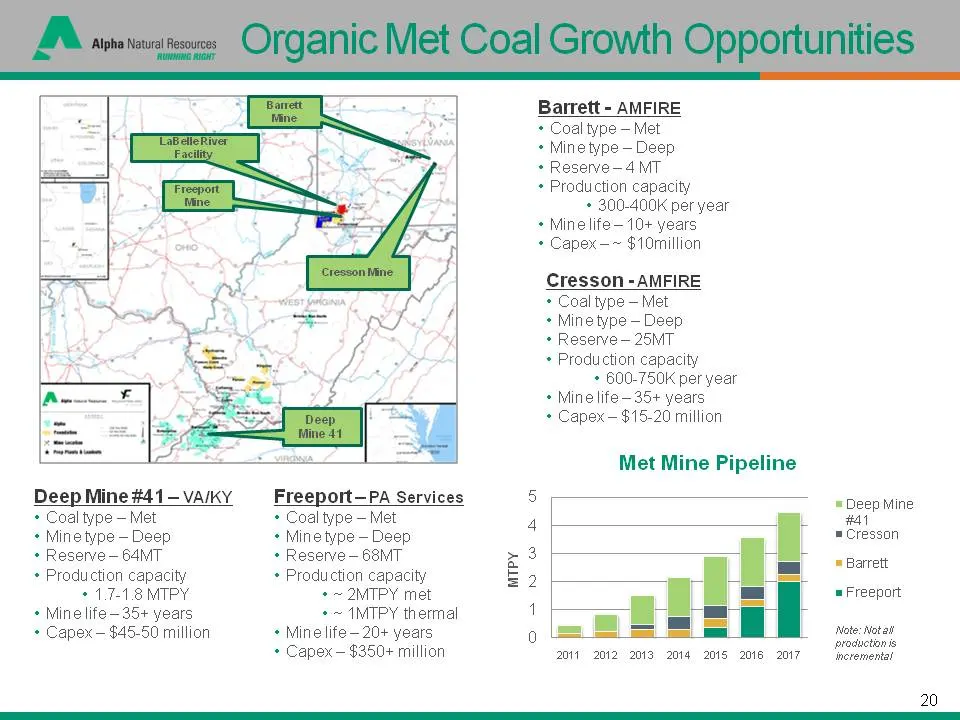
Slide 20: Met Mine Pipeline
Deep Mine #41 — VA/KY + Coal type — Met + Mine type — Deep + Reserve - 64MT + Production capacity + 1.7-18MTPY + Mine life-35+ years + Capex —$45-50 million Freeport—PA Services + Coal type — Met + Mine type — Deep + Reserve - 68MT + Production capacity + ~ 2MTPY met +~1IMTPY thermal + Mine life—20+
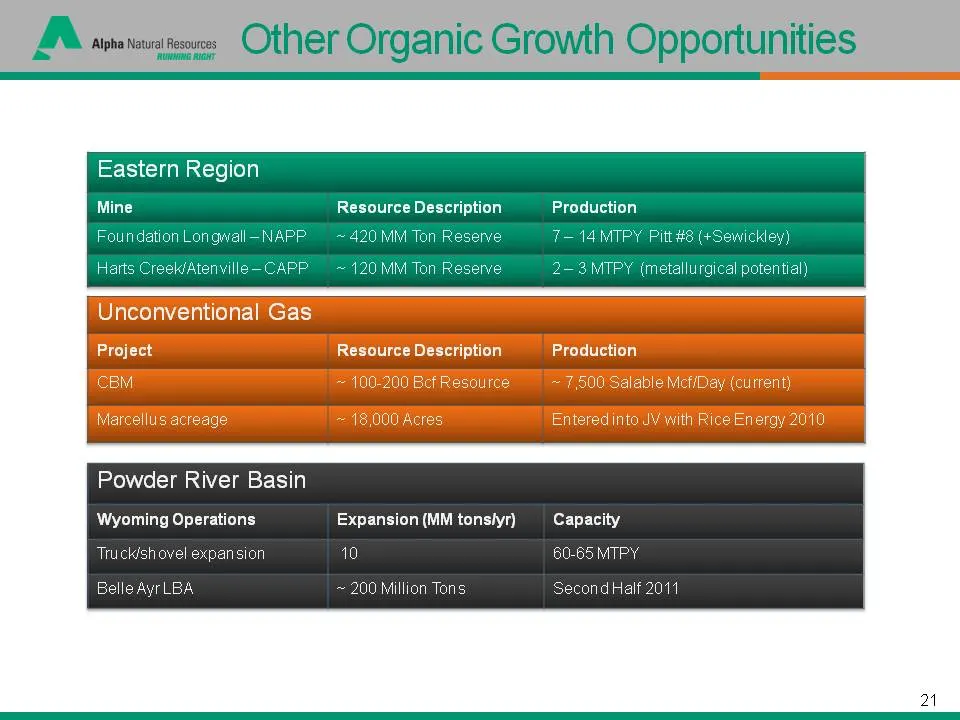
Slide 21: Other Organic Growth Opportunities
AA svateeee Other Organic Growth Opportunities Eastern Region Resource Description Production ~ 420 MM Ton Re e 7-14 MTPY Pitt ~ 120 MM Ton Re Powder River Basin Wyoming Operations Expansion (MM tonslyr) Capacity Tr n 10 10 Million Tor 21
Slide 22: Financial Strength
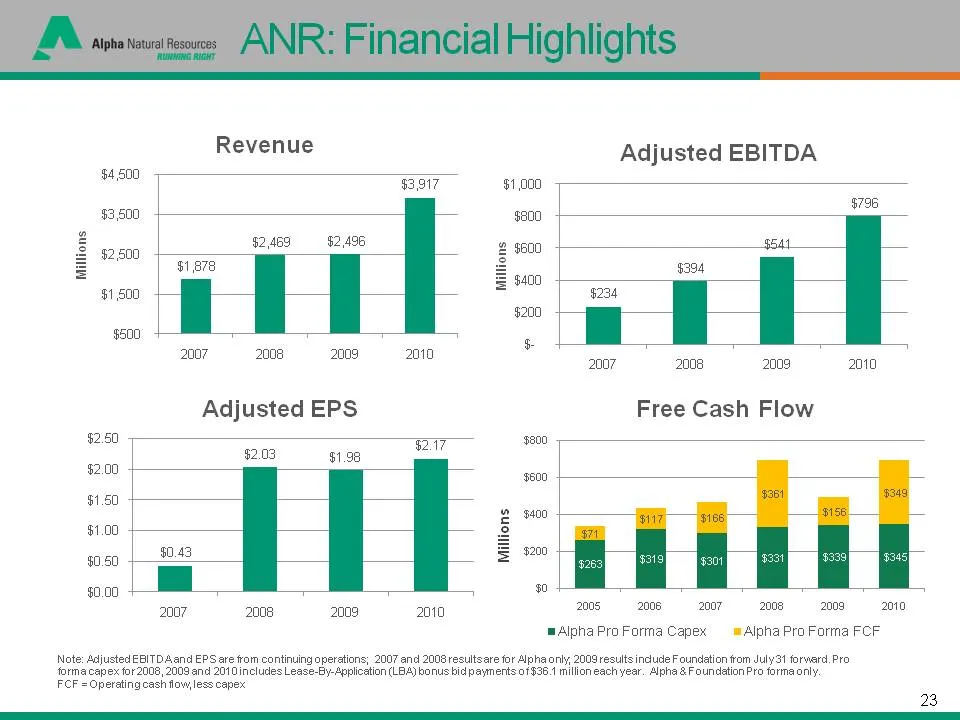
Slide 23: Revenue, Adjusted EBITDA, Adjusted EPS, Free Cash Flow
Revenue Adjusted EBITDA $4,500 Bor pF 96 $3,500 cf §2,500 $2,469 $2,496 $544 , $294 $1,500 $234 $600 $ i 2007 2008 2009 2010 2007 2008 2009 2010 Adjusted EPS Free Cash Flow $2.50 $2.00 a Med a $1.50 $1.00 $0.43 $0.50 0 | a ai ane ae zoos 2008-2007, 2008/0030 mAlpha Pro Forma Capex = Alpha Pro Forma
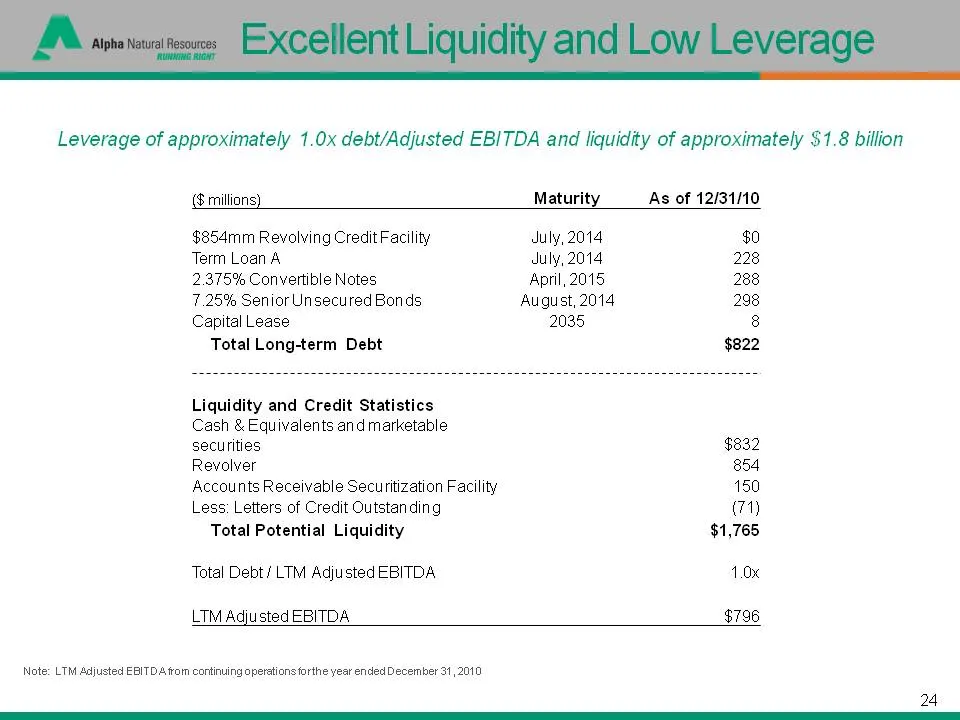
Slide 24: Leverage of approximately 1.0x debt/Adjusted EBITDA and liquidity of approximately $1.8 billion
Leverage of approximately 1.0x debt/Adjusted EBITDA and liquidity of approximately $1.8 billion (Smilions) Maturity As of 12/31/10 $854mm Revolving Credit Facility July, 2014 $0 Term Loan A July, 2014 228 2.375% Convertible Notes April, 2015 288 7.25% Senior Unsecured Bonds August, 2014 298 Capital
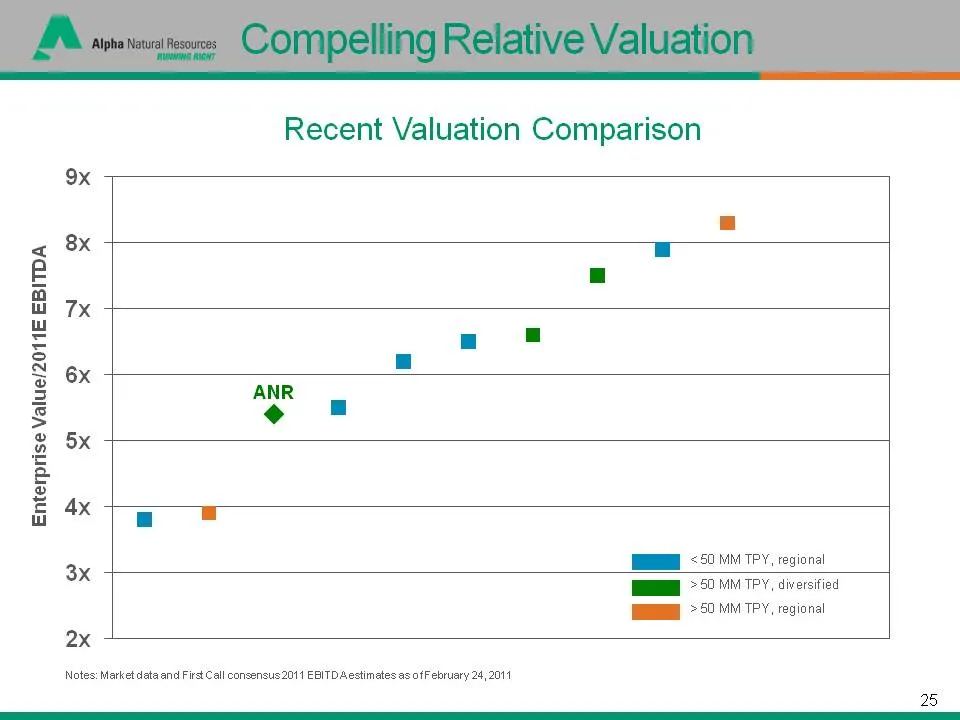
Slide 25: Recent Valuation Comparison
9x 8x IX 6x 5x 4x Enterprise Value/2011E EBITDA 3x 2x Recent Valuation Comparison ANR ME <50 MM TPY, regional HE > EO MM TPY, diversified HE > 50 MM TPY, regional Notes: Market data and First Call consensus2011 EBITD Aestimates as ofF ebruary 24,2011 25
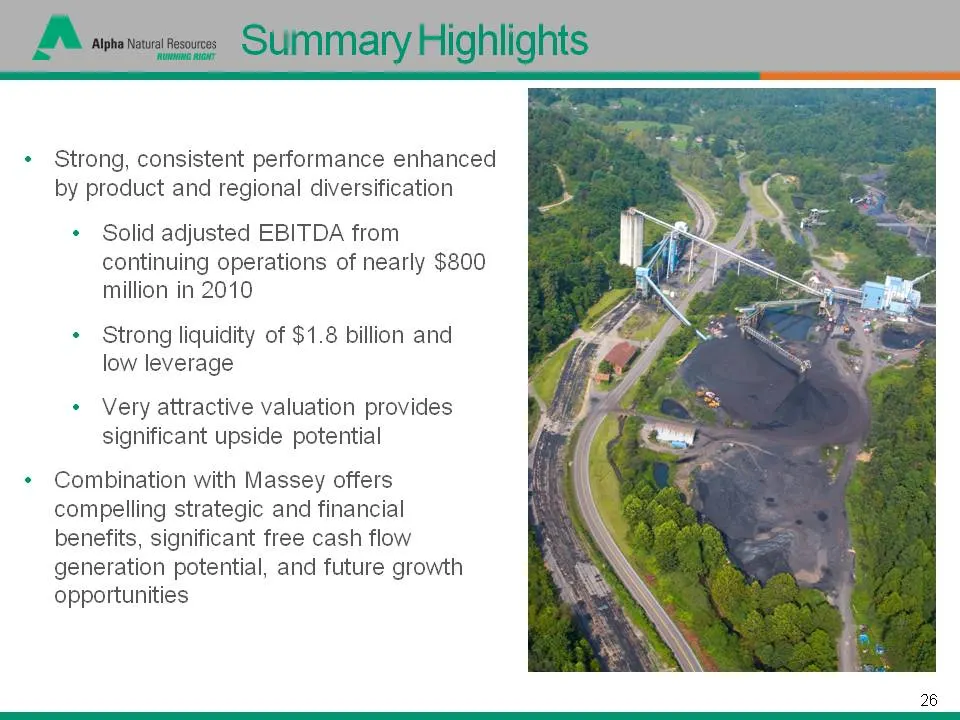
Slide 26: Summary of strengths and Massey combination benefits
+ Strong, consistent performance enhanced by product and regional diversification + Solid adjusted EBITDA from continuing operations of nearly $800 million in 2010 * Strong liquidity of $1.8 billion and low leverage + Very attractive valuation provides significant upside potential * Combination with
Slide 27: Alpha Natural Resources
A ‘Alpha Natural Resources ‘roman A Alpha Natural Resources y~ www.alphanr.com 27
Source: SEC EDGAR · 425 filed Mar 1, 2011
More decks from Massey Energy Co
 Merger or Acquisition (March 2011)18 slides · Mar 9, 2011
 Credit Suisse Energy Summit 201126 slides · Feb 10, 2011
 Merger or Acquisition (January 2011)19 slides · Jan 31, 2011
 Proxy Contest (May 2010)32 slides · May 5, 2010
 Proxy Contest (April 2010)26 slides · Apr 30, 2010
 Howard Weil Energy Conference 200851 slides · Apr 7, 2008