MainSource Financial Group Inc
MainSource Financial — Sandler O'Neill + Partners East Coast Financial Services Conference 2010
47 slides from MainSource Financial's conference presentation, Nov 12, 2010
Slide 1: Sandler O'Neill East Coast Financial Services Conference
PN MainSource FINANCIAL GROUP Sandler O’Neill + Partners, L.P. EAST COAST FINANCIAL SERVICES CONFERENCE November 11, 2010

Slide 2: Meeting the financial needs of our customers...for life!
PN MainSource FINANCIAL GROUP Meeting the financial needs of our customers...for life!
Slide 3: Presenters
We will achieve our vision by: Archie M. Brown, Jr. : President and CEO James (Jamie) M. Anderson: Executive Vice President and CFO Presenters
Slide 4: Disclosure Regarding Forward Looking Statements
We will achieve our vision by: Disclosure Regarding Forward Looking Statements This presentation may include forward-looking statements regarding, among other things, MainSource’s business strategy, financial position and prospects, dividend policy, business results, strategic initiatives, credit qu
Slide 5: Corporate History
Corporate History Fw MainSource FINANCIAL GROUP.
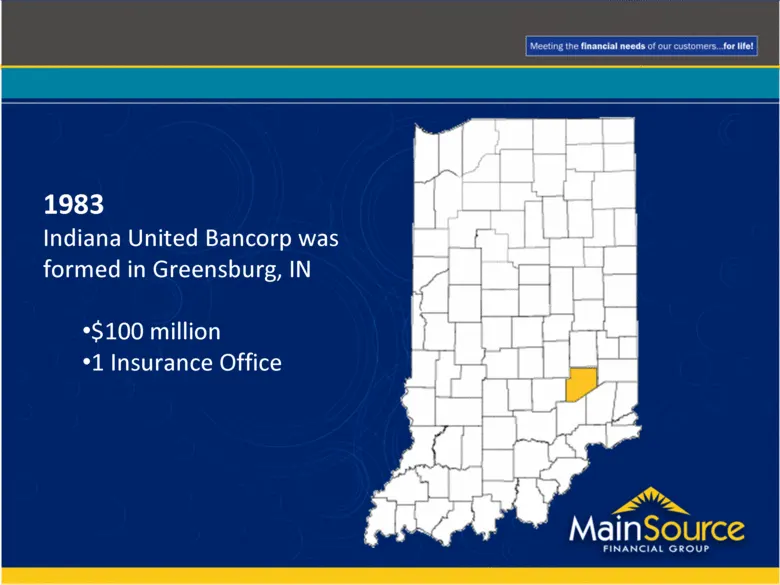
Slide 6: 1983 Indiana United Bancorp formed in Greensburg, IN
1983 Indiana United Bancorp was formed in Greensburg, IN $100 million 1 Insurance Office
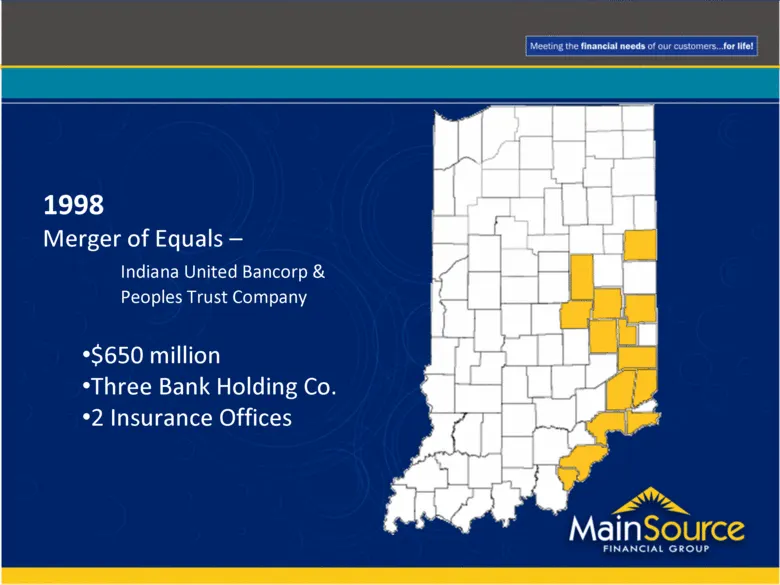
Slide 7: 1998 Merger of Equals
1998 Merger of Equals – Indiana United Bancorp & Peoples Trust Company $650 million Three Bank Holding Co. 2 Insurance Offices
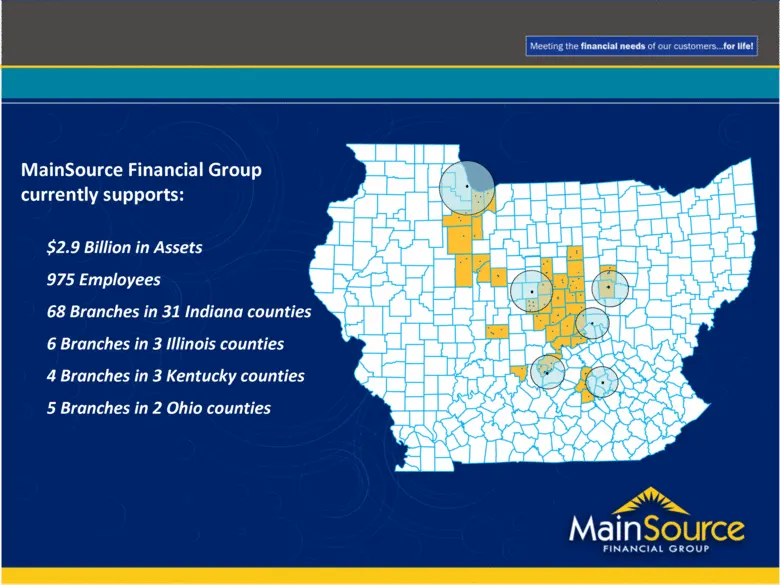
Slide 8: MainSource Financial Group currently supports
$2.9 Billion in Assets 975 Employees 68 Branches in 31 Indiana counties 6 Branches in 3 Illinois counties 4 Branches in 3 Kentucky counties 5 Branches in 2 Ohio counties MainSource Financial Group currently supports:
Slide 9: Corporate Strategy
Develops highly competent and engaged employees Provides local leadership and employee involvement in the life of our communities Grows and expands consumer and owner-managed business relationships Provides competitive services when and how our customers want them Provides services and advice that h
Slide 10: Financial Information
Financial Information FUN MainSource FINANCIAL GROUP.
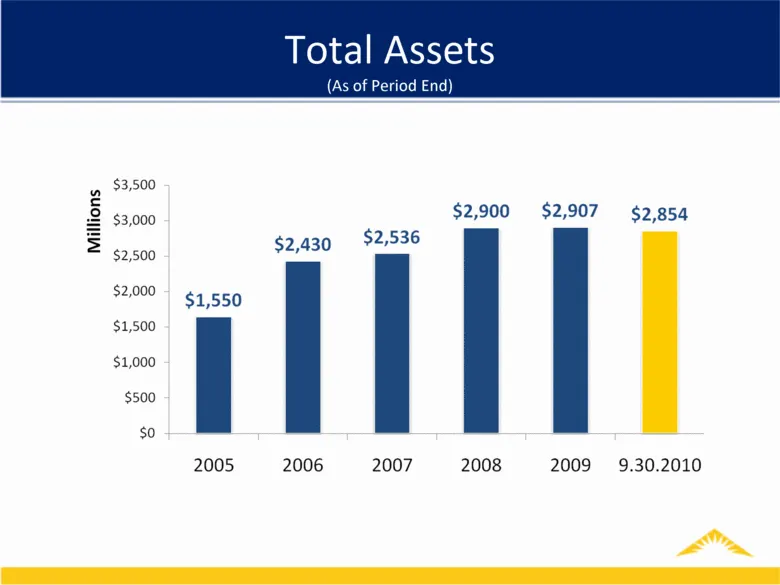
Slide 11: Total Assets (As of Period End)
Total Assets (As of Period End)
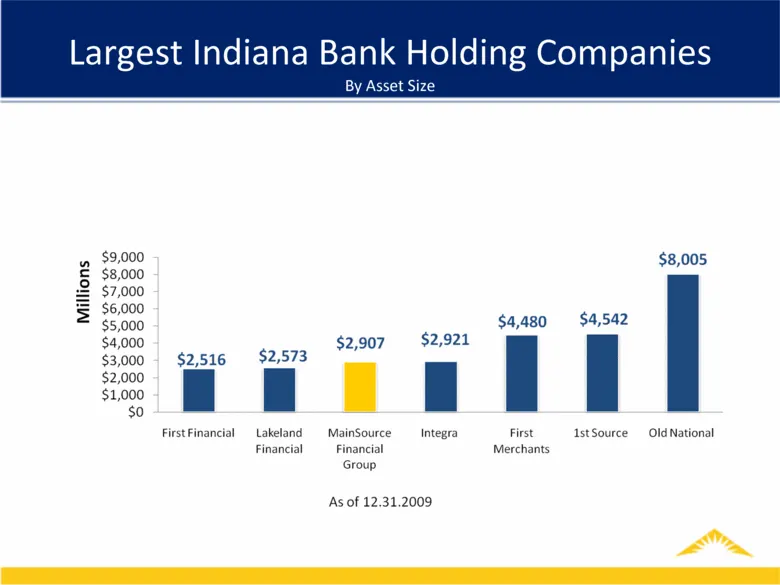
Slide 12: Largest Indiana Bank Holding Companies By Asset Size
Largest Indiana Bank Holding Companies By Asset Size
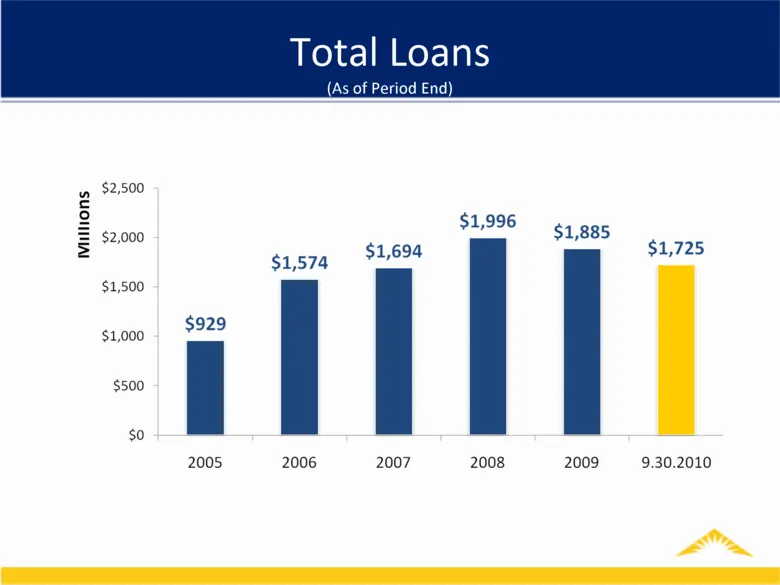
Slide 13: Total Loans (As of Period End)
Total Loans (As of Period End)
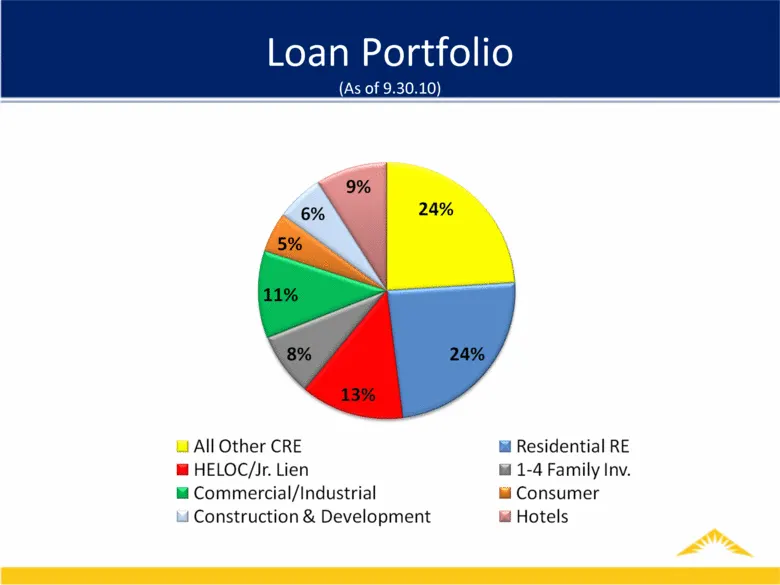
Slide 14: Loan Portfolio (As of 9.30.10)
Loan Portfolio (As of 9.30.10)
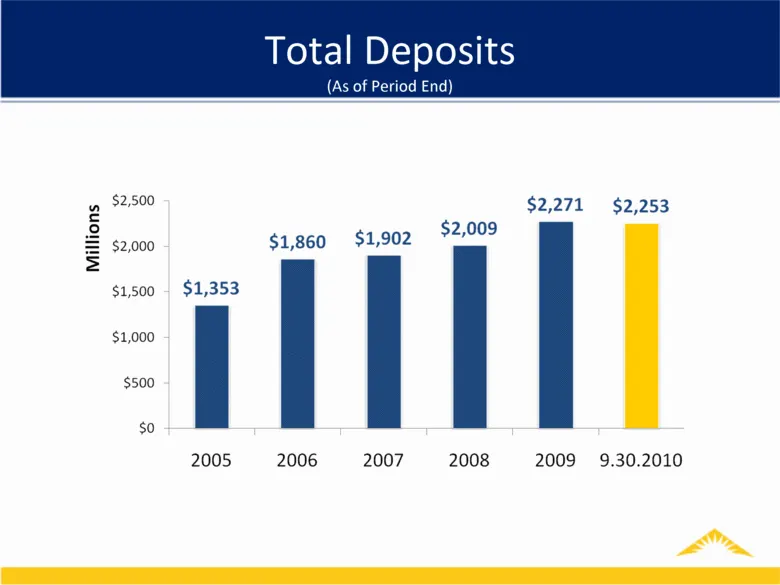
Slide 15: Total Deposits (As of Period End)
Total Deposits (As of Period End)
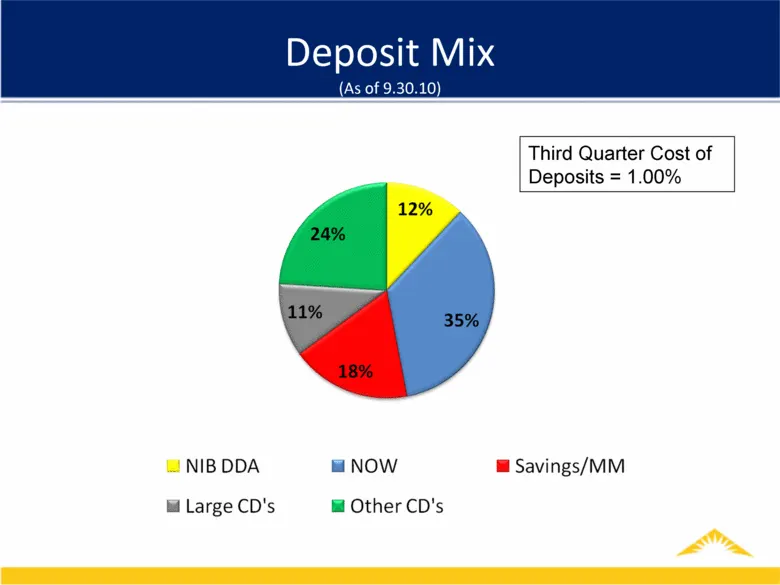
Slide 16: Deposit Mix (As of 9.30.10)
Deposit Mix (As of 9.30.10) Third Quarter Cost of Deposits = 1.00%
Slide 17: Capital
Capital Fi MainSource FINANCIAL GROUP.
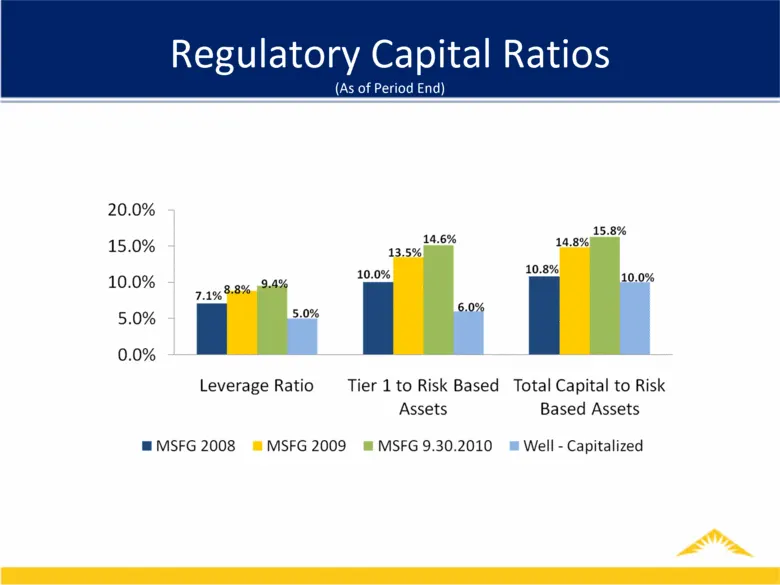
Slide 18: Regulatory Capital Ratios (As of Period End)
Regulatory Capital Ratios (As of Period End)
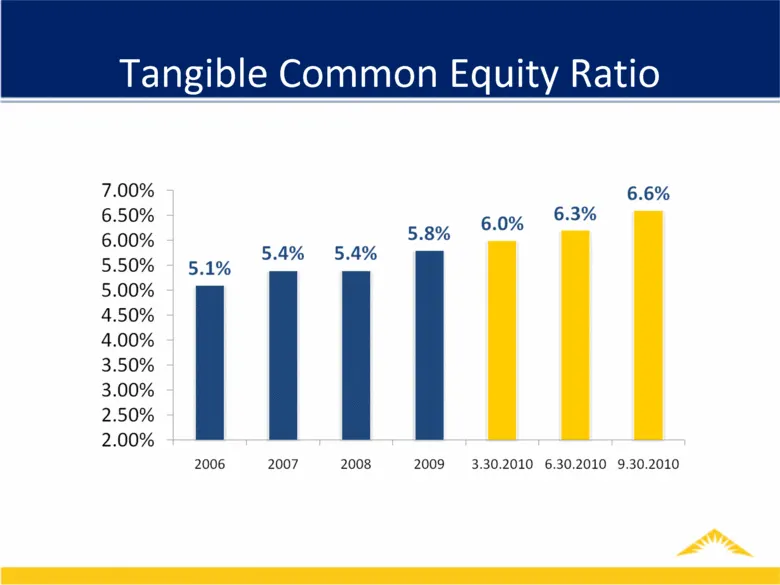
Slide 19: Tangible Common Equity Ratio
Tangible Common Equity Ratio
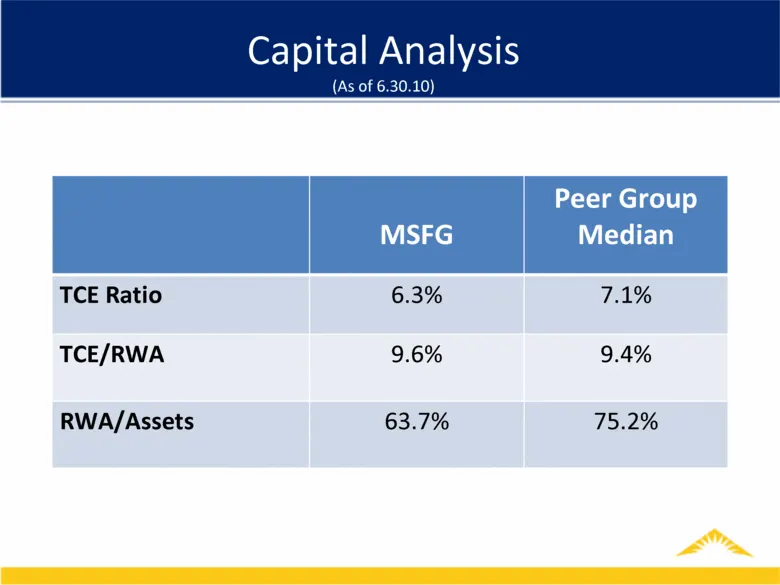
Slide 20: Capital Analysis (As of 6.30.10)
Capital Analysis (As of 6.30.10) MSFG Peer Group Median TCE Ratio 6.3% 7.1% TCE/RWA 9.6% 9.4% RWA/Assets 63.7% 75.2%
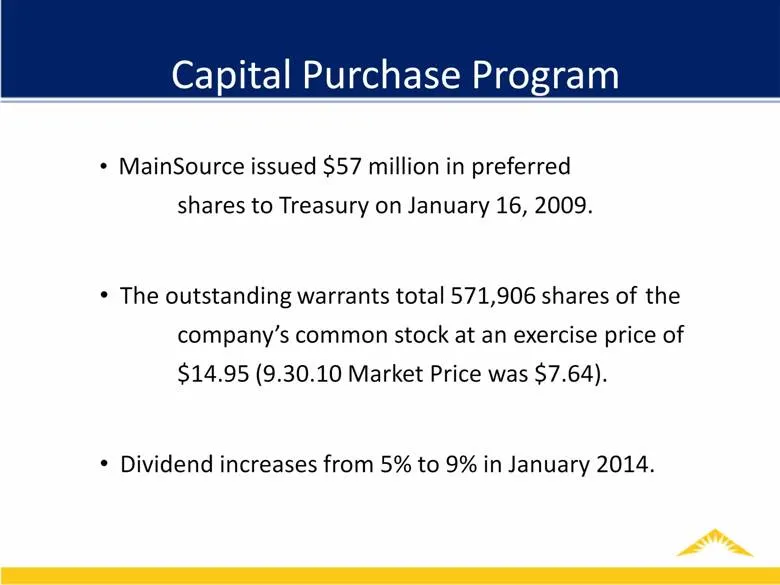
Slide 21: Capital Purchase Program
MainSource issued $57 million in preferred shares to Treasury on January 16, 2009. The outstanding warrants total 571,906 shares of the company’s common stock at an exercise price of $14.95 (9.30.10 Market Price was $7.64). Dividend increases from 5% to 9% in January 2014. Capital Purchase Program
Slide 22: Operating Performance
Operating Performance FUN MainSource FINANCIAL GROUP.
Slide 23: Third Quarter 2010 Highlights
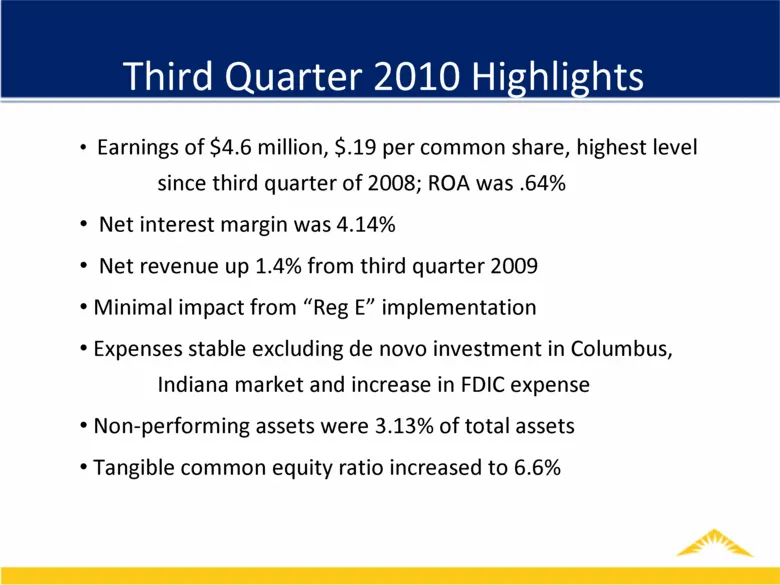
Earnings of $4.6 million, $.19 per common share, highest level since third quarter of 2008; ROA was .64% Net interest margin was 4.14% Net revenue up 1.4% from third quarter 2009 Minimal impact from “Reg E” implementation Expenses stable excluding de novo investment in Columbus, Indiana market and i
Slide 24: Net Operating Income
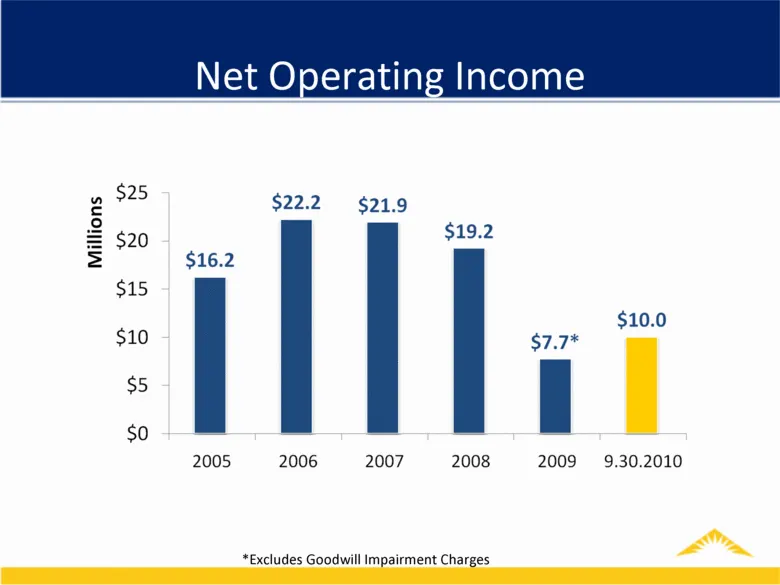
Net Operating Income *Excludes Goodwill Impairment Charges
Slide 25: Operating Earnings Per Share
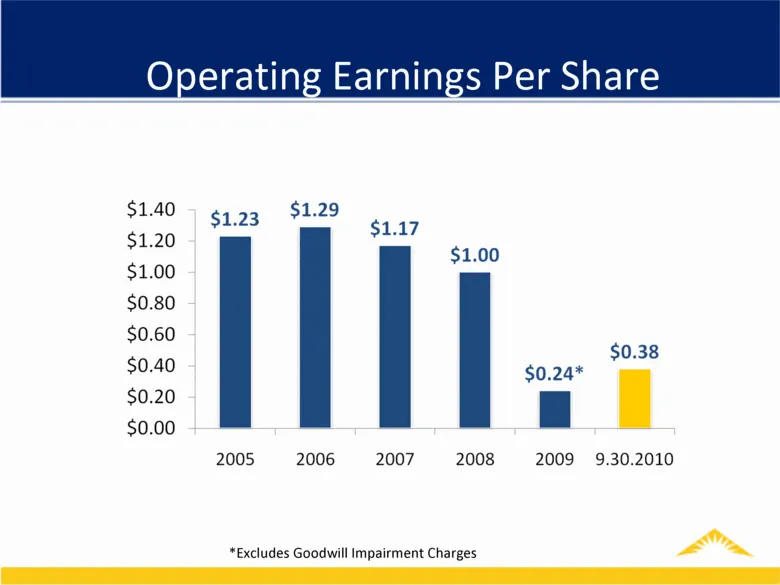
Operating Earnings Per Share *Excludes Goodwill Impairment Charges
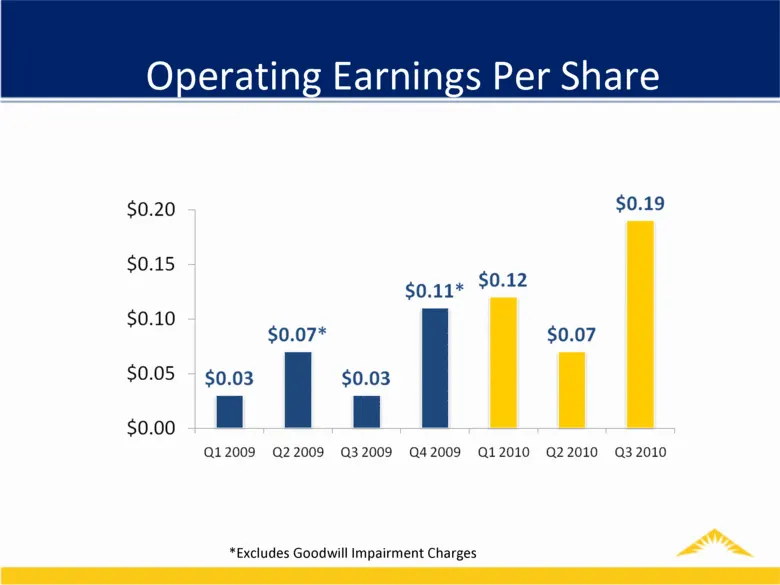
Slide 26: Operating Earnings Per Share
Operating Earnings Per Share *Excludes Goodwill Impairment Charges
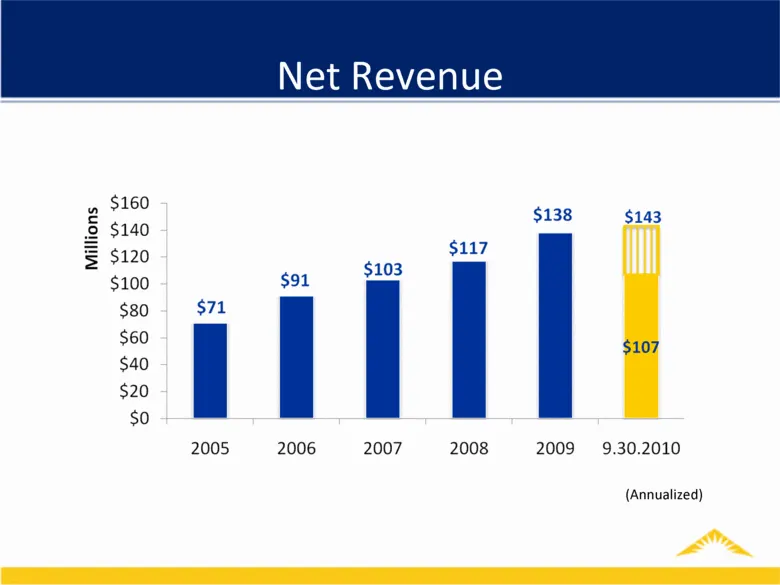
Slide 27: Net Revenue
ions Mill $160 $140 $120 $100 $80 $60 $40 $20 so Net Revenue $138 $143 $117 $91 $103 $71 ] $107 2005 2006 2007 2008 2009 = 9.30.2010 (Annualized)
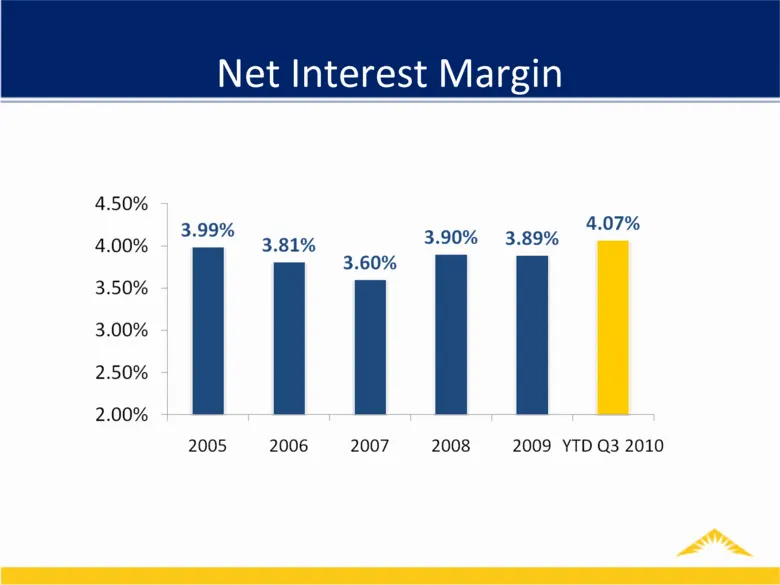
Slide 28: Net Interest Margin
Net Interest Margin 4.50% 4.07% oot hea 3.90% 3.89% . 3.81% AG 3.50% 3.00% 2.50% 2.00% 2005 2006 2007 2008 2009 YTD Q3 2010
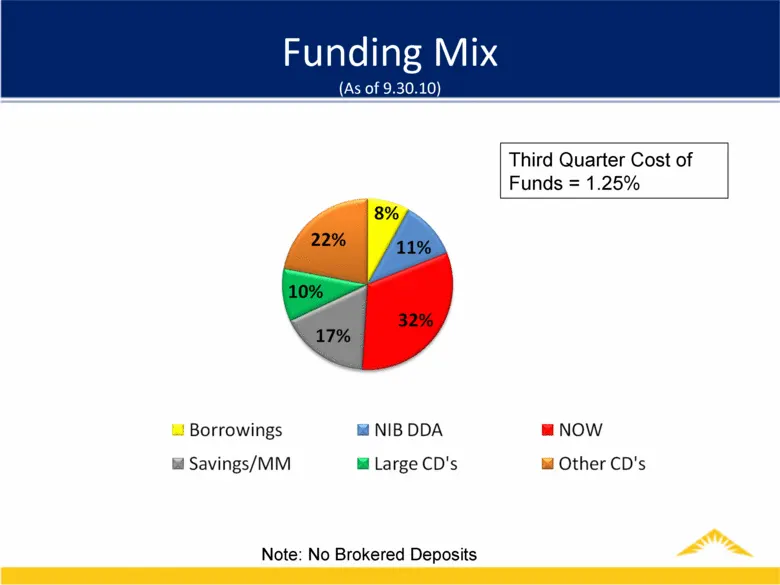
Slide 29: Funding Mix (As of 9.30.10)
Funding Mix (As of 9.30.10) Note: No Brokered Deposits Third Quarter Cost of Funds = 1.25%
Slide 30: Earnings Before LLP & Taxes
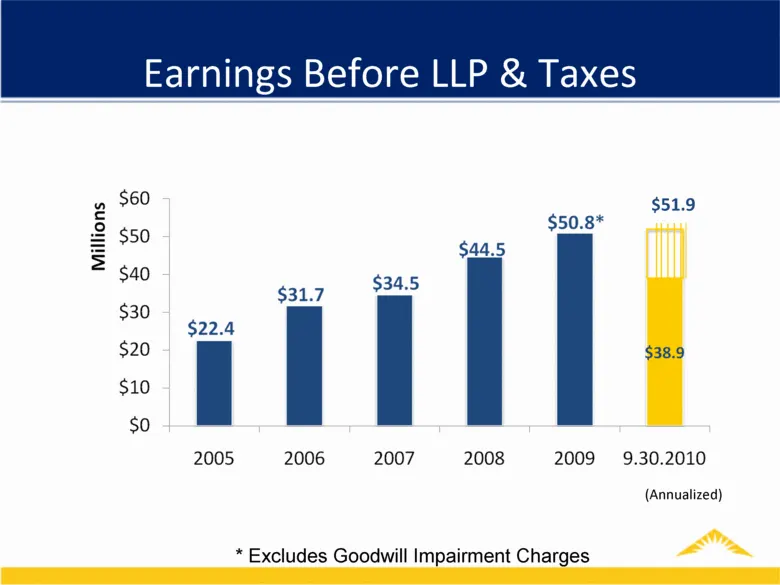
Earnings Before LLP & Taxes * Excludes Goodwill Impairment Charges $51.9 (Annualized)
Slide 31: Credit Quality
Credit Quality Fi MainSource FINANCIAL GROUP.
Slide 32: Indiana Unemployment Rate (Seasonally Adjusted)
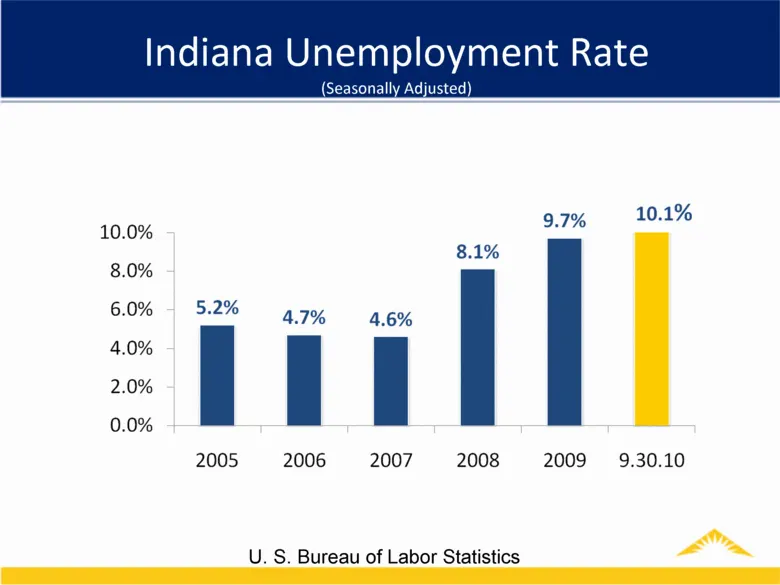
Indiana Unemployment Rate (Seasonally Adjusted) U. S. Bureau of Labor Statistics
Slide 33: Non-Performing Loans (End of Period)
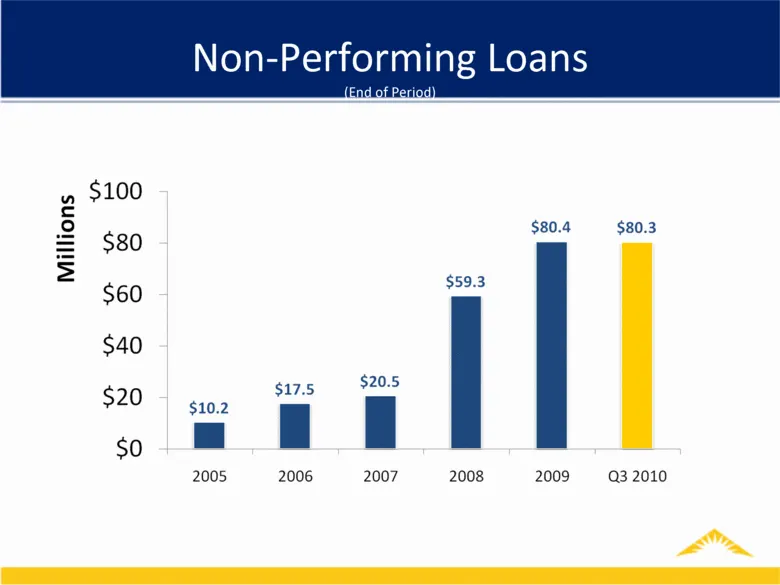
Non-Performing Loans (End of Period)
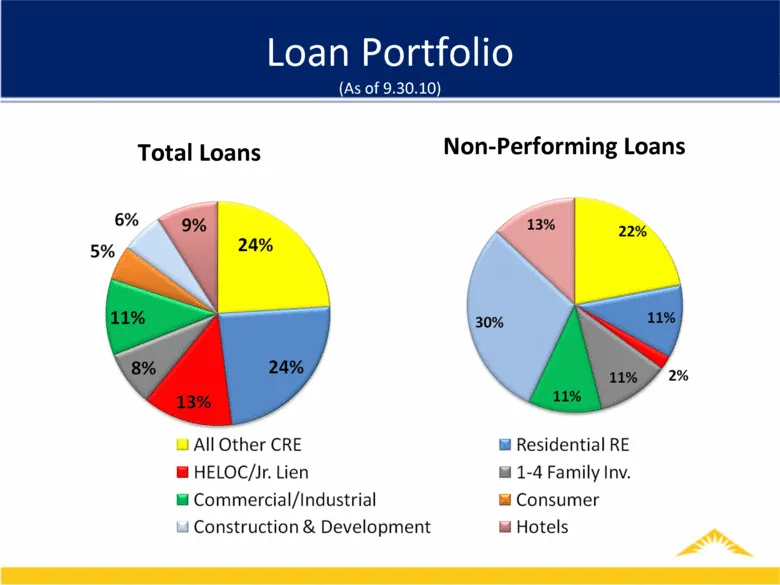
Slide 34: Loan Portfolio (As of 9.30.10) Non-Performing Loans
Loan Portfolio (As of 9.30.10) Total Loans Non-Performing Loans
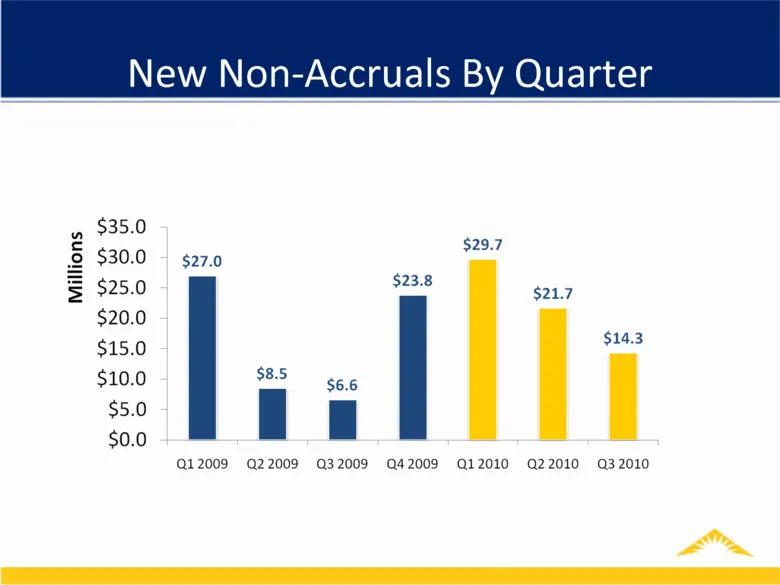
Slide 35: New Non-Accruals By Quarter
New Non-Accruals By Quarter E $30.0 $27.0 287 5 $25.0 ae $21.7 $20.0 $15.0 Gas $10.0 i $6.6 | : T $5.0 $0.0 Q12009 22009 032009 042009 Q12010 Q22010 32010
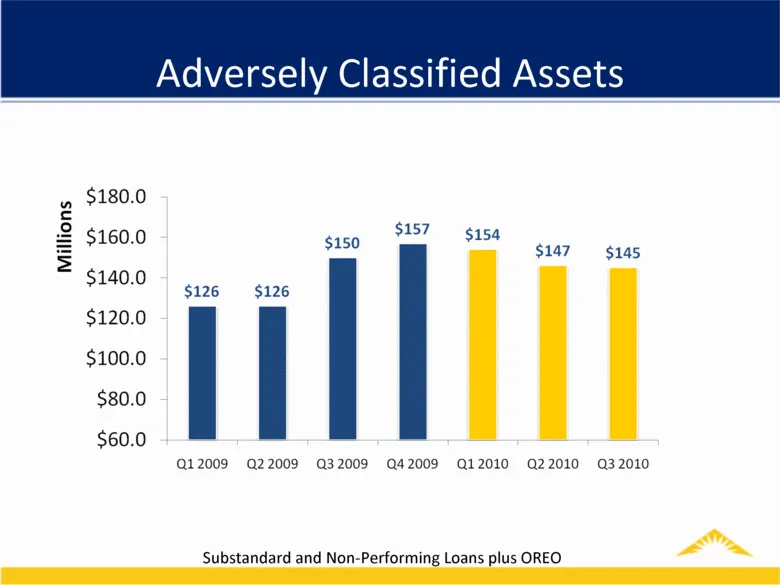
Slide 36: Adversely Classified Assets
Adversely Classified Assets Substandard and Non-Performing Loans plus OREO
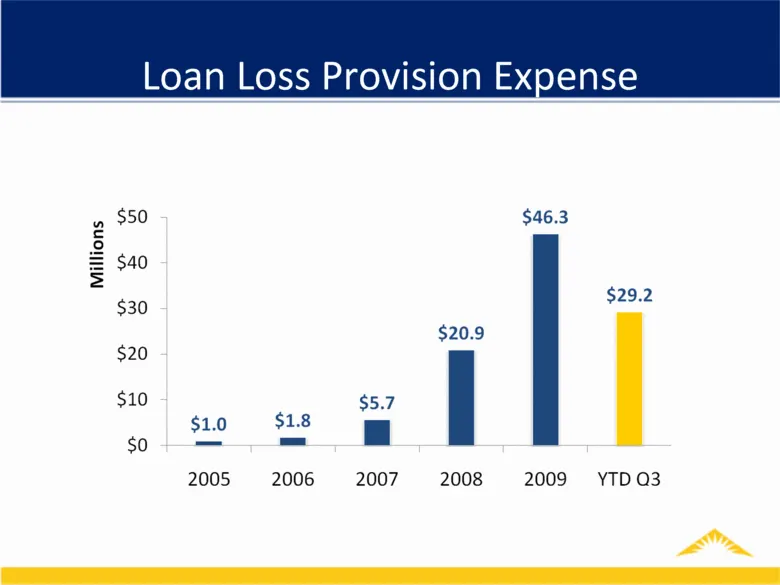
Slide 37: Loan Loss Provision Expense
Loan Loss Provision Expense wn a 6 $40 Millions $30 $46.3 $29.2 $20.9 $ $5.7 1.0 1.8 0 = 2005 2006 2007 2008 2009 YTDQ3 PN
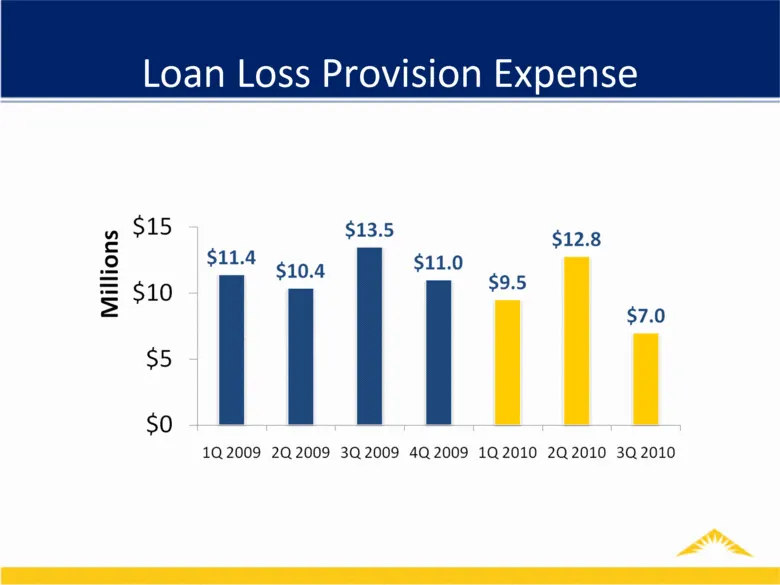
Slide 38: Loan Loss Provision Expense (Quarterly)
Loan Loss Provision Expense 2 $15 $13.5 $12.8 x] $11.4 $10.4 $11.0 = “ $9.5 = $10 = $7.0 $5 | so 1Q2009 2Q2009 3Q2009 4Q2009 1Q2010 2Q2010 3Q2010
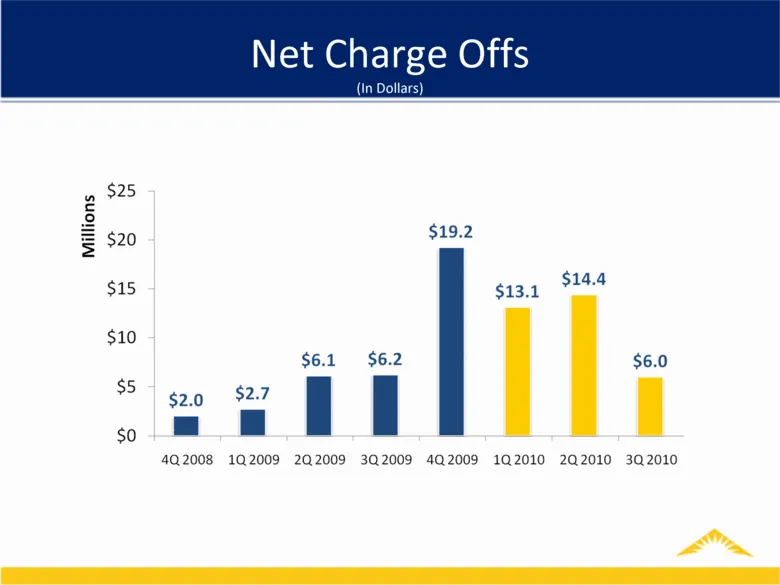
Slide 39: Net Charge Offs
Net Charge Offs (In Dollars) $25 $19.2 $15 giz. $144 $10 r 1 J 2 r 0) SS g29 $2.7 so a a 4Q2008 10.2009 202009 3Q2009 402009 1Q2010 22010 302010 Millions PN (SOR error orn
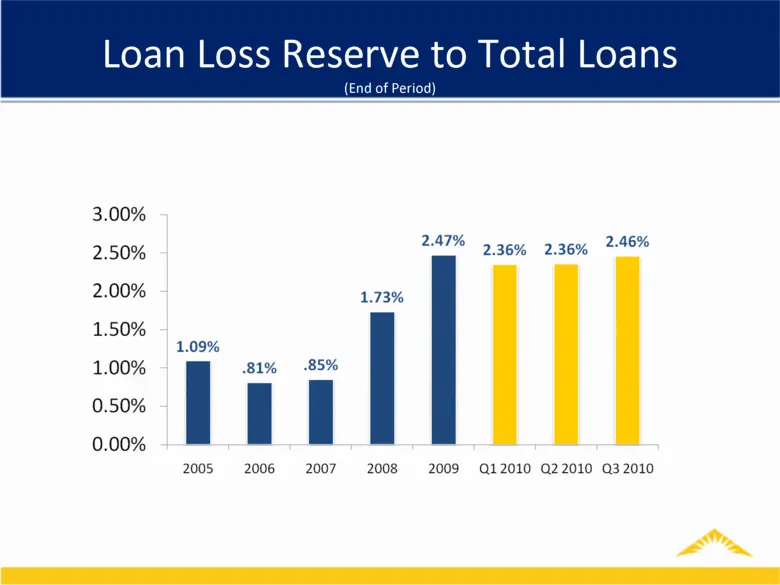
Slide 40: Loan Loss Reserve to Total Loans (End of Period)
Loan Loss Reserve to Total Loans (End of Period)
Slide 41: Investment Portfolio
Investment Portfolio FUN MainSource FINANCIAL GROUP.
Slide 42: Investment Portfolio (As of 9.30.10)
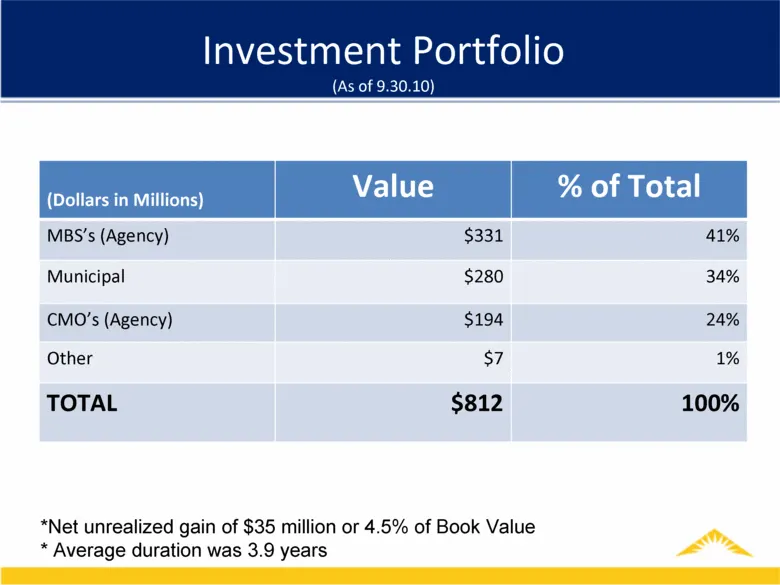
Investment Portfolio (As of 9.30.10) (Dollars in Millions) Value % of Total MBS’s (Agency) $331 41% Municipal $280 34% CMO’s (Agency) $194 24% Other $7 1% TOTAL $812 100% *Net unrealized gain of $35 million or 4.5% of Book Value * Average duration was 3.9 years
Slide 43: Investment Portfolio (As of 9.30.10)
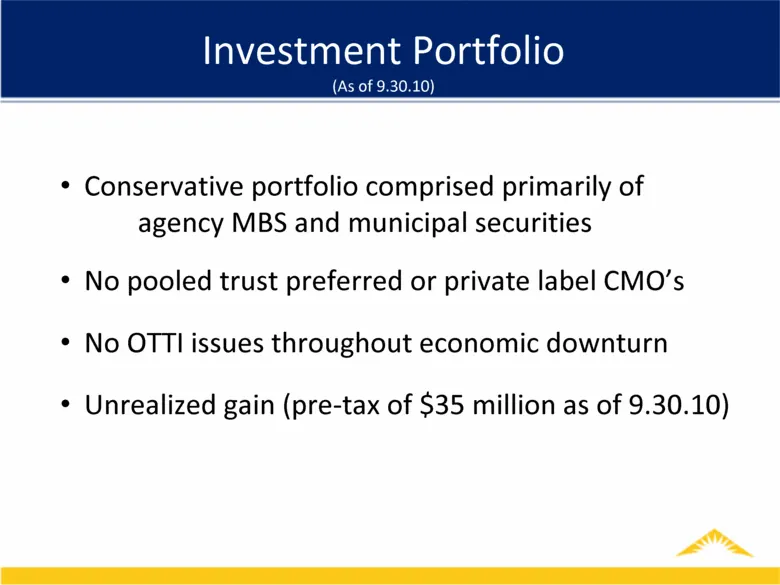
Investment Portfolio (As of 9.30.10) Conservative portfolio comprised primarily of agency MBS and municipal securities No pooled trust preferred or private label CMO’s No OTTI issues throughout economic downturn Unrealized gain (pre-tax of $35 million as of 9.30.10)
Slide 44: 2010 Strategic Priorities
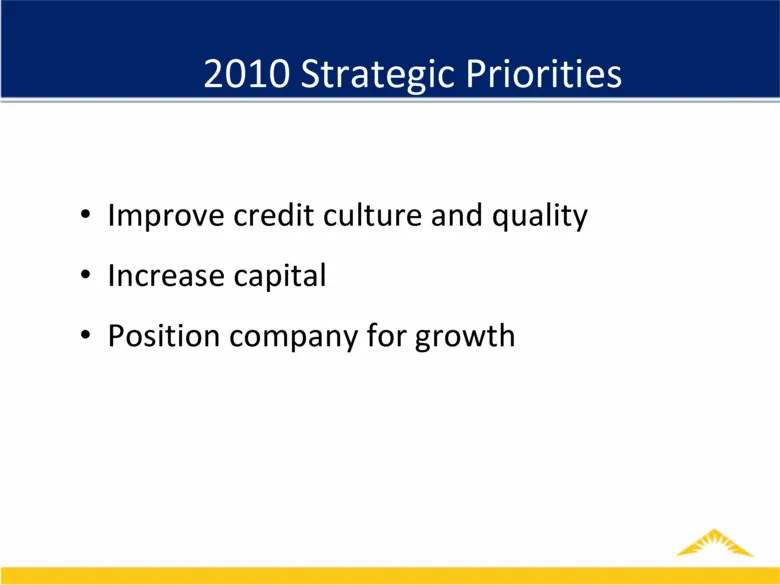
2010 Strategic Priorities Improve credit culture and quality Increase capital Position company for growth
Slide 45: Questions
Questions FUN MainSource FINANCIAL GROUP.
Slide 46: Contact Information
Contact Information MainSource Financial Group, Inc. common stock is traded on the NASDAQ Global Select Market under the symbol MSFG. Additional inquiries can be made at www.mainsourcefinancial.com For investor inquiries, please contact: Jamie Anderson – Chief Financial Officer Shareholder Relations

Slide 47: Meeting the financial needs of our customers...for life!
PN MainSource FINANCIAL GROUP Meeting the financial needs of our customers...for life!
Source: SEC EDGAR · 8-K filed Nov 12, 2010
More decks from MainSource Financial Group Inc
 Merger or Acquisition (October 2017)25 slides · Oct 31, 2017
 Merger or Acquisition (July 2017)23 slides · Jul 31, 2017
 Merger or Acquisition (July 2017)19 slides · Jul 26, 2017
 Shareholder Meeting (May 2017)67 slides · May 3, 2017
 Merger or Acquisition (December 2016)7 slides · Dec 19, 2016
 Investor Presentation (September 2016)34 slides · Sep 22, 2016