MainSource Financial Group Inc
MainSource Financial — Merger or Acquisition (July 2017)
23 slides from MainSource Financial's merger presentation, Jul 31, 2017

Slide 1: Filed by First Financial Bancorp pursuant to Rule 425
Filed by First Financial Bancorp. Pursuant to Rule 425 under the Securities Act of 1933 and deemed filed pursuant to Rule 14a-12 under the Securities Exchange Act of 1934 Subject Company: MainSource Financial Group, Inc. (Commission File No. 000-12422)
Slide 2: Creating a Leading Midwest Banking Franchise
Creating a Leading Midwest Banking Franchise
Slide 3: Forward-looking statements
2 Certain statements contained in this presentation which are not statements of historical fact constitute forward-looking statements within the meaning of the Private Securities Litigation Reform Act of 1955. Such statements include, but are not limited to, certain plans, expectations, goals, proje
Slide 4: Additional information about the proposed merger
3 This investor presentation is being made in respect of the proposed merger transaction between First Financial Bancorp. (“First Financial”) and MainSource Financial Group, Inc. (“MainSource”). First Financial intends to file a registration statement on Form S-4 with the Securities and Exchange Com
Slide 5: Transaction Overview
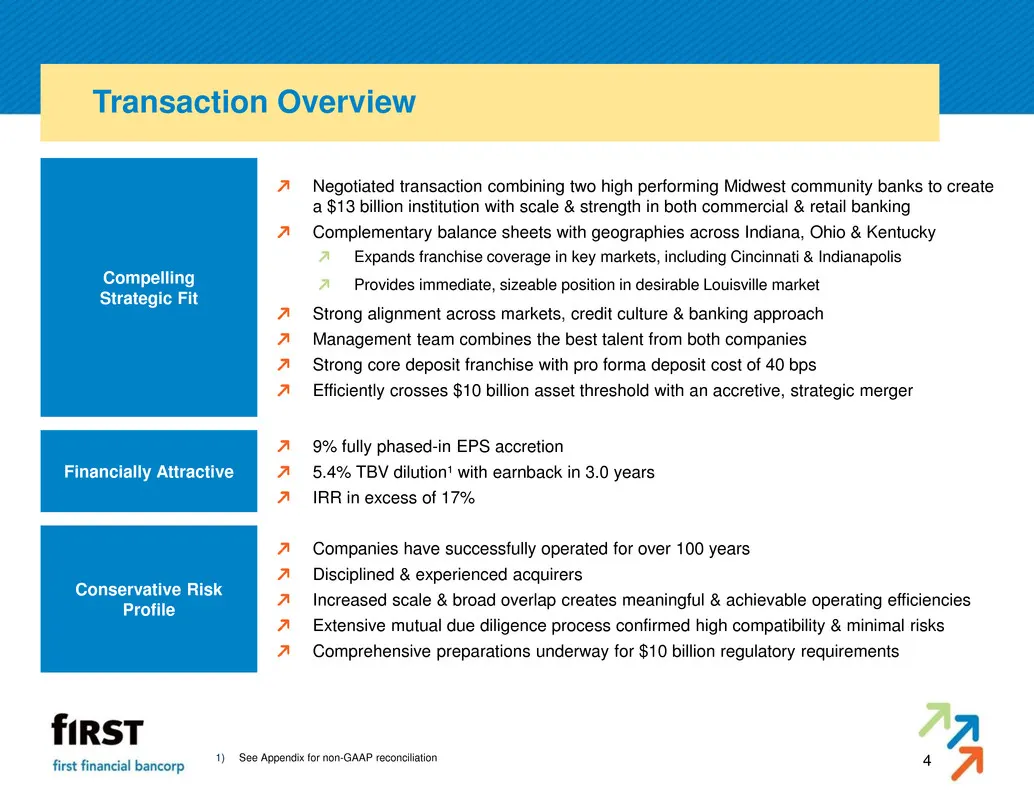
4 Transaction Overview Negotiated transaction combining two high performing Midwest community banks to create a $13 billion institution with scale & strength in both commercial & retail banking Complementary balance sheets with geographies across Indiana, Ohio & Kentucky Expands franchise coverage i
Slide 6: Complementary Midwest Footprint
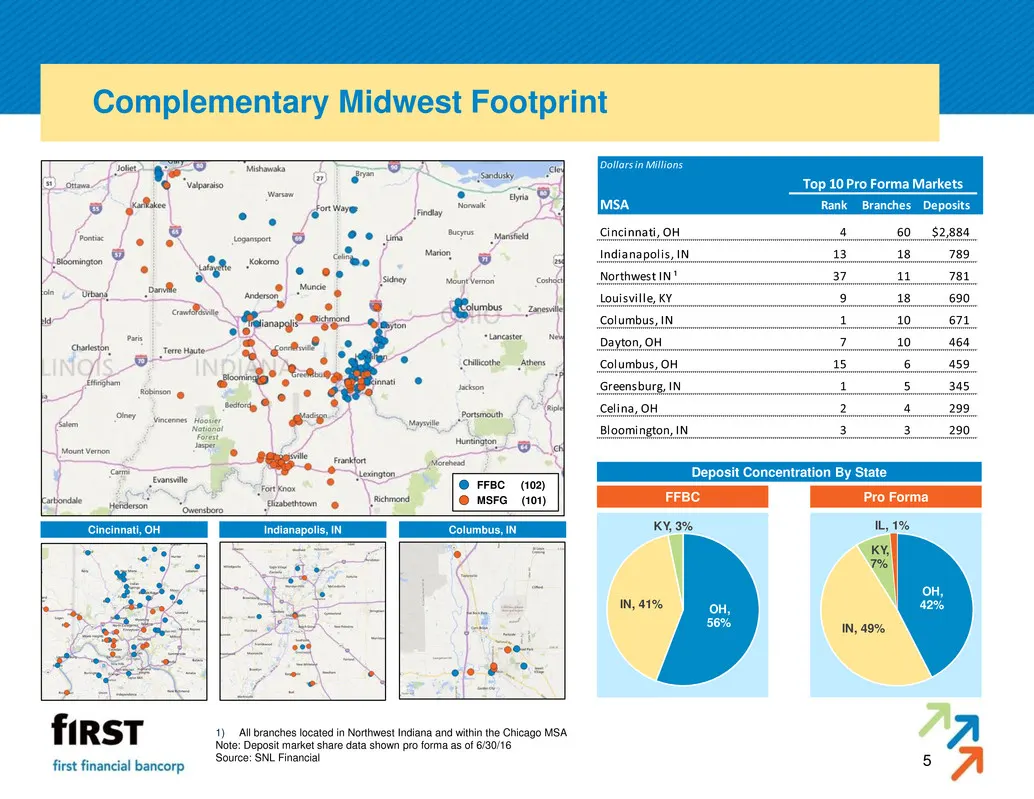
5 Complementary Midwest Footprint 1) All branches located in Northwest Indiana and within the Chicago MSA Note: Deposit market share data shown pro forma as of 6/30/16 Source: SNL Financial Deposit Concentration By State OH, 56% IN, 41% KY, 3% FFBC Pro Forma Dollars in Millions Top 10 Pro Forma Mark
Slide 7: The Combination of Two Strong Community Banks
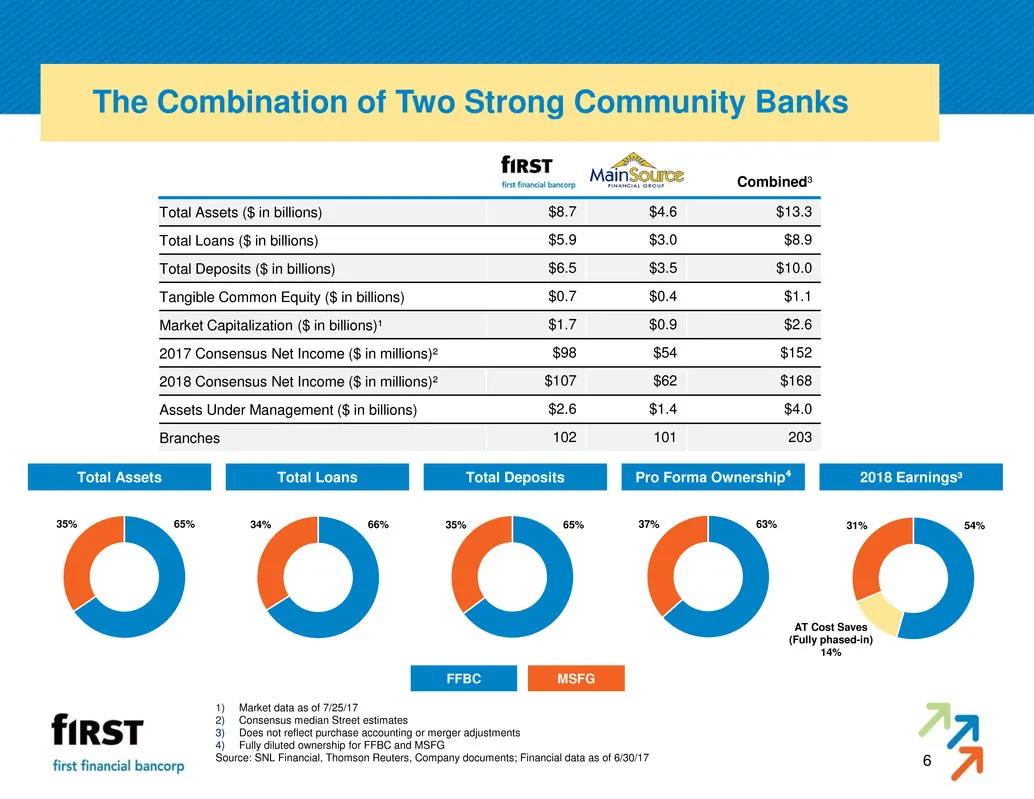
6 The Combination of Two Strong Community Banks 1) Market data as of 7/25/17 2) Consensus median Street estimates 3) Does not reflect purchase accounting or merger adjustments 4) Fully diluted ownership for FFBC and MSFG Source: SNL Financial, Thomson Reuters, Company documents; Financial data as of
Slide 8: Strong Commercial Business & High Quality Loan Portfolio
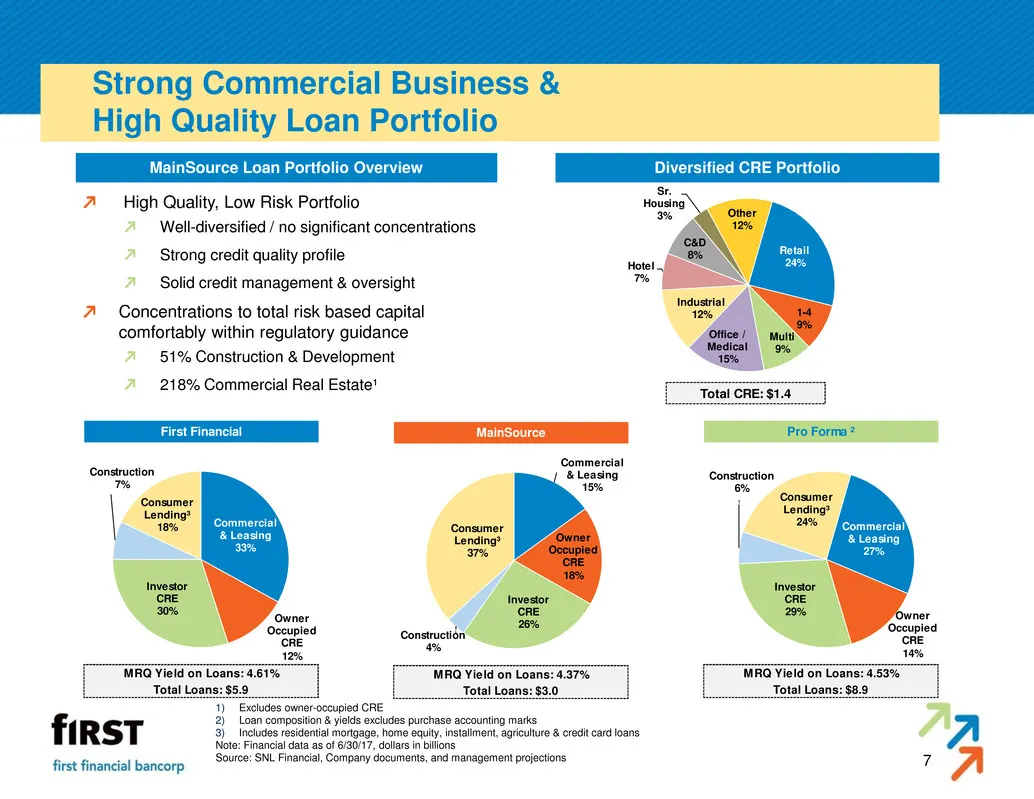
7 Strong Commercial Business & High Quality Loan Portfolio 1) Excludes owner-occupied CRE 2) Loan composition & yields excludes purchase accounting marks 3) Includes residential mortgage, home equity, installment, agriculture & credit card loans Note: Financial data as of 6/30/17, dollars in billion
Slide 9: Exceptional Retail Franchise
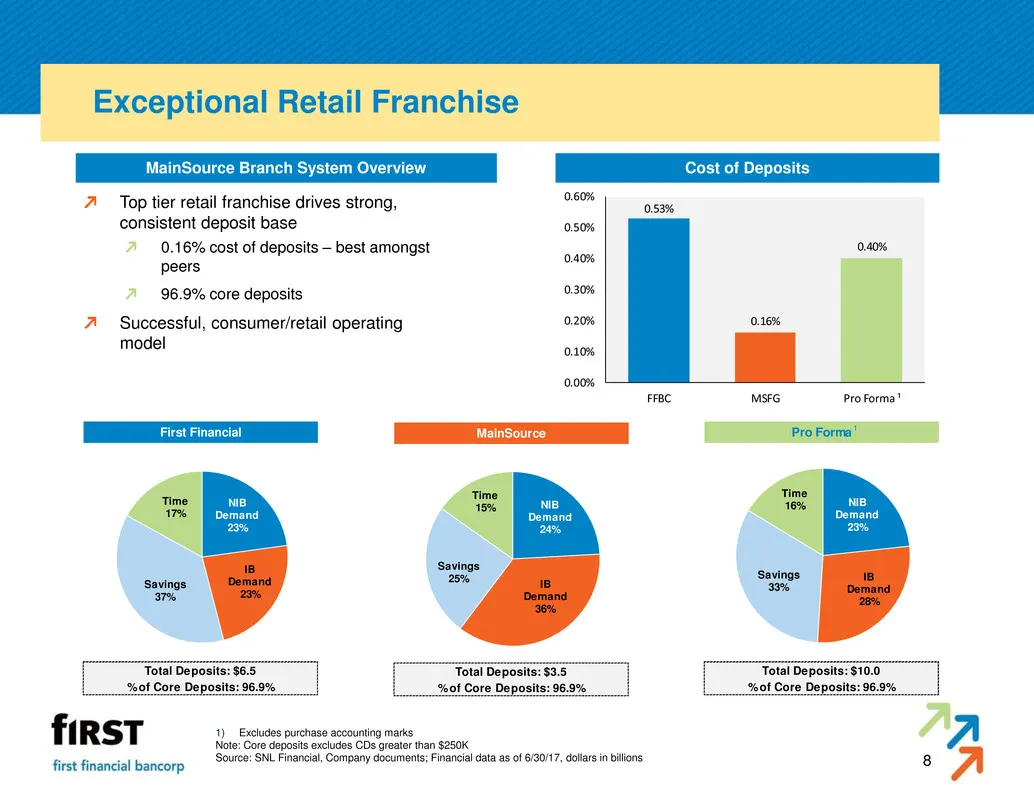
8 Exceptional Retail Franchise 1) Excludes purchase accounting marks Note: Core deposits excludes CDs greater than $250K Source: SNL Financial, Company documents; Financial data as of 6/30/17, dollars in billions Cost of Deposits MainSource Branch System Overview Top tier retail franchise drives str
Slide 10: Transaction Summary
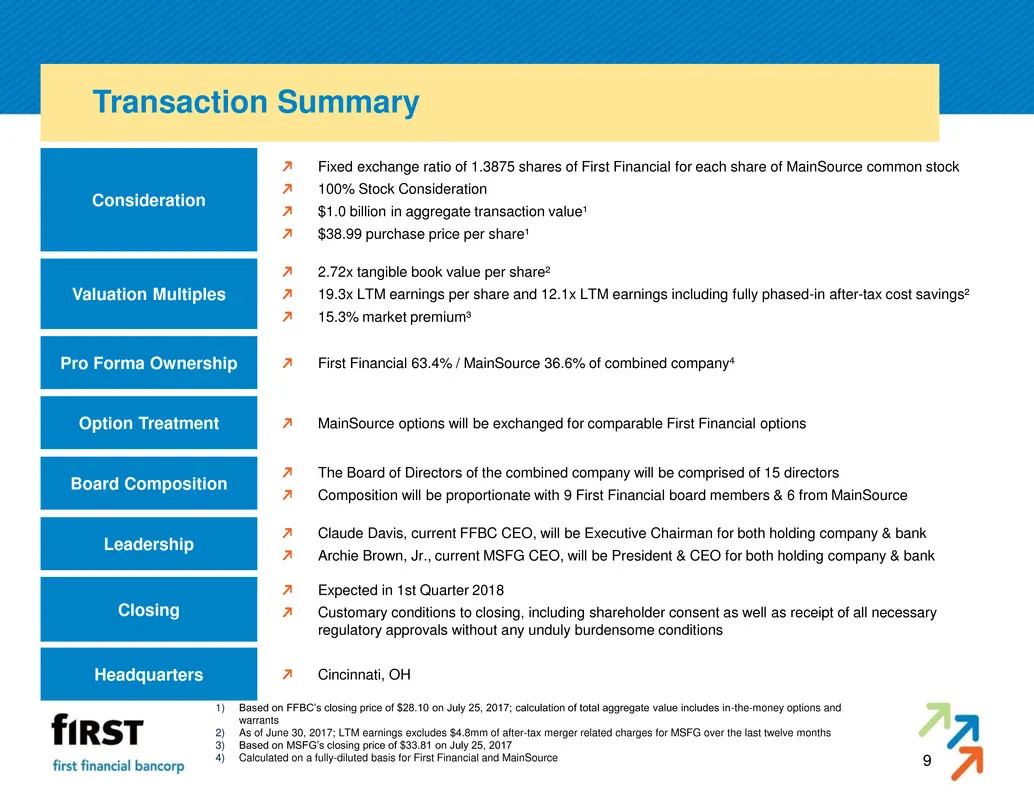
9 Transaction Summary Fixed exchange ratio of 1.3875 shares of First Financial for each share of MainSource common stock 100% Stock Consideration $1.0 billion in aggregate transaction value¹ $38.99 purchase price per share¹ MainSource options will be exchanged for comparable First Financial options
Slide 11: Financial Impact & Assumptions
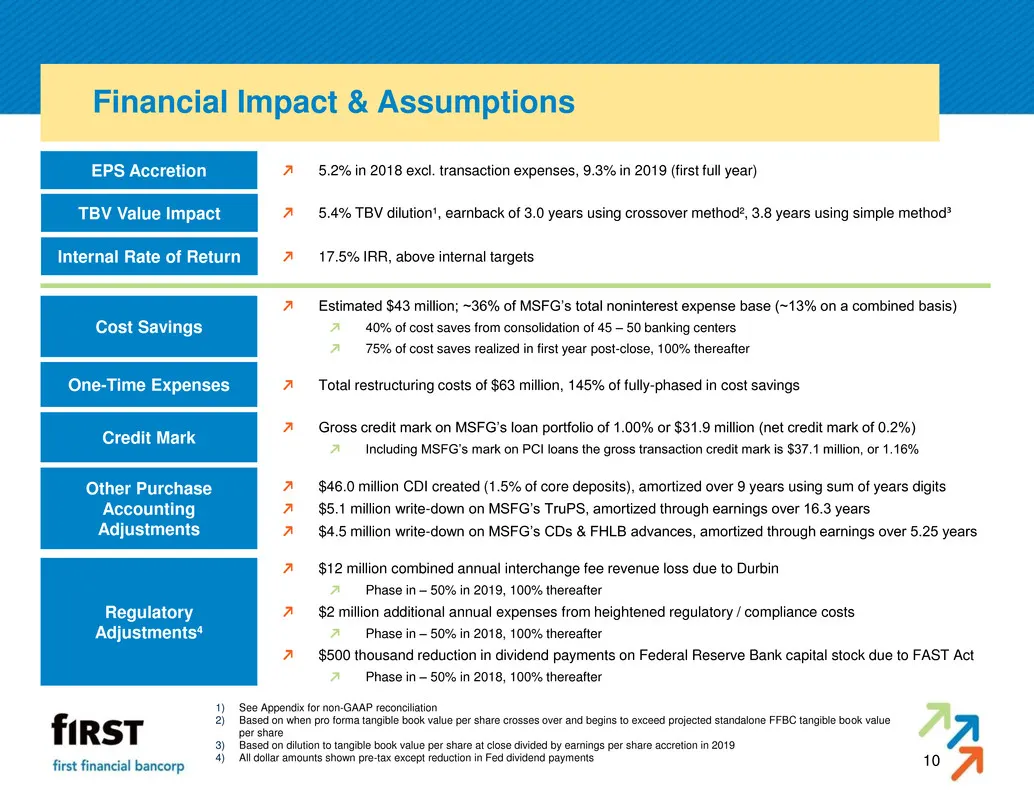
10 Financial Impact & Assumptions Estimated $43 million; ~36% of MSFG’s total noninterest expense base (~13% on a combined basis) 40% of cost saves from consolidation of 45 – 50 banking centers 75% of cost saves realized in first year post-close, 100% thereafter Gross credit mark on MSFG’s loan port
Slide 12: Capital & Profitability
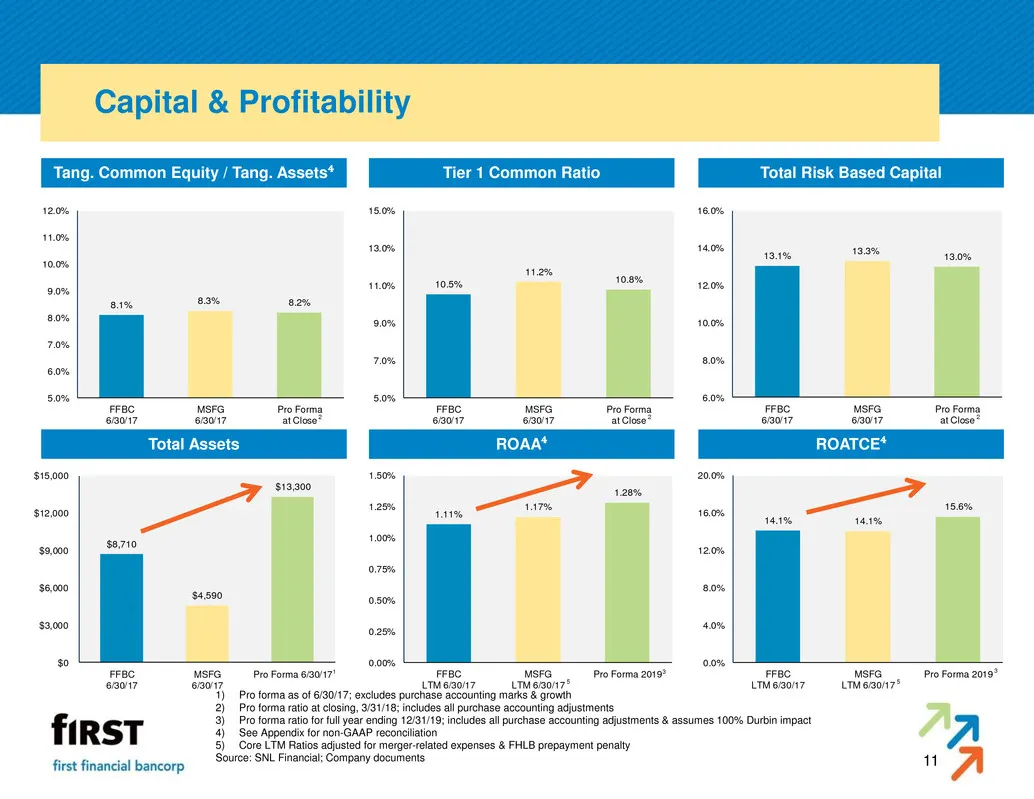
1.11% 1.17% 1.28% 0.00% 0.25% 0.50% 0.75% 1.00% 1.25% 1.50% FFBC LTM 6/30/17 MSFG LTM 6/30/17 Pro Forma 2019 11 Capital & Profitability Total Assets Total Risk Based Capital ROAA⁴ ROATCE⁴ 14.1% 14.1% 15.6% 0.0% 4.0% 8.0% 12.0% 6.0% 20.0% FFBC LTM 6/30/17 MSFG LTM 6/30/17 Pro Forma 2019 Tang. Common
Slide 13: Comprehensive Due Diligence & Preparation
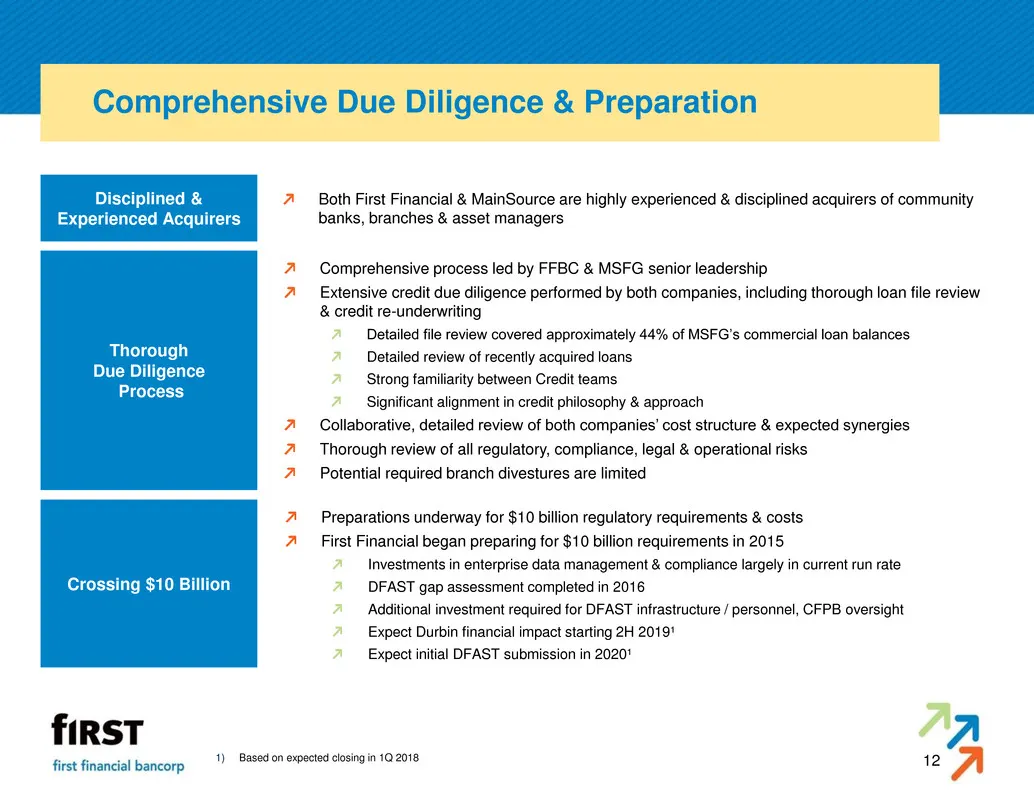
12 Comprehensive Due Diligence & Preparation Disciplined & Experienced Acquirers Thorough Due Diligence Process Crossing $10 Billion Both First Financial & MainSource are highly experienced & disciplined acquirers of community banks, branches & asset managers Comprehensive process led by FFBC & MSFG
Slide 14: Business Integration Opportunity
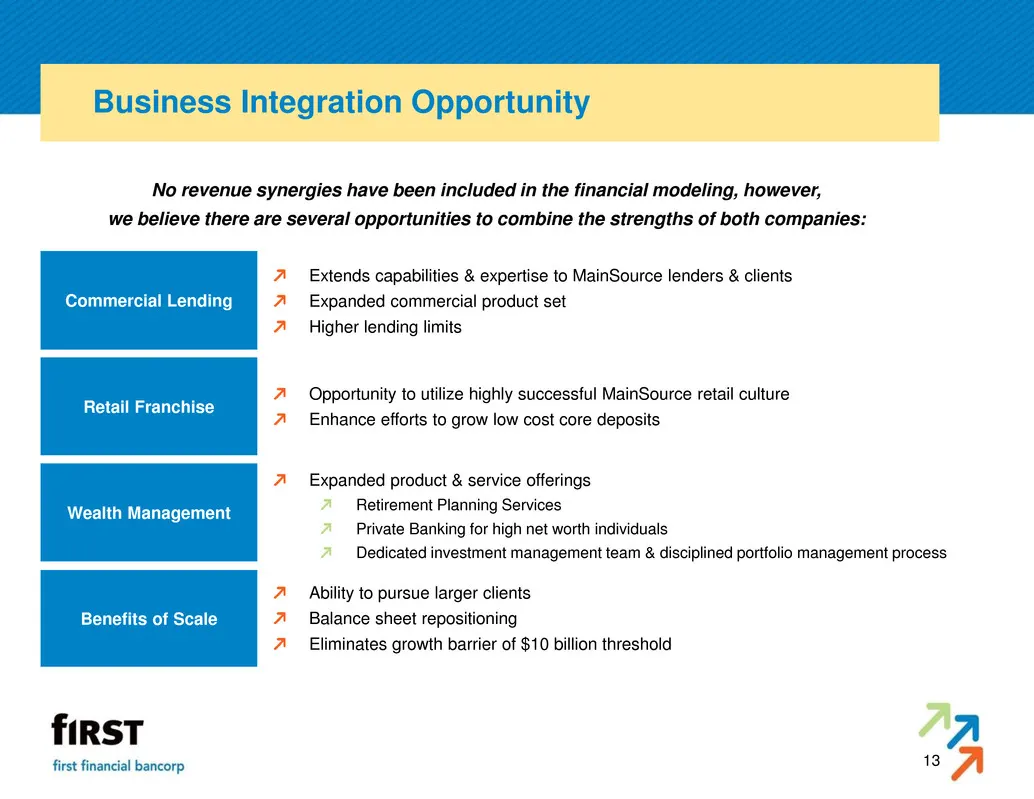
13 Business Integration Opportunity No revenue synergies have been included in the financial modeling, however, we believe there are several opportunities to combine the strengths of both companies: Extends capabilities & expertise to MainSource lenders & clients Expanded commercial product set High

Slide 15: Appendix
15 Appendix
Slide 16: Long-Term Outperformance by Both Institutions
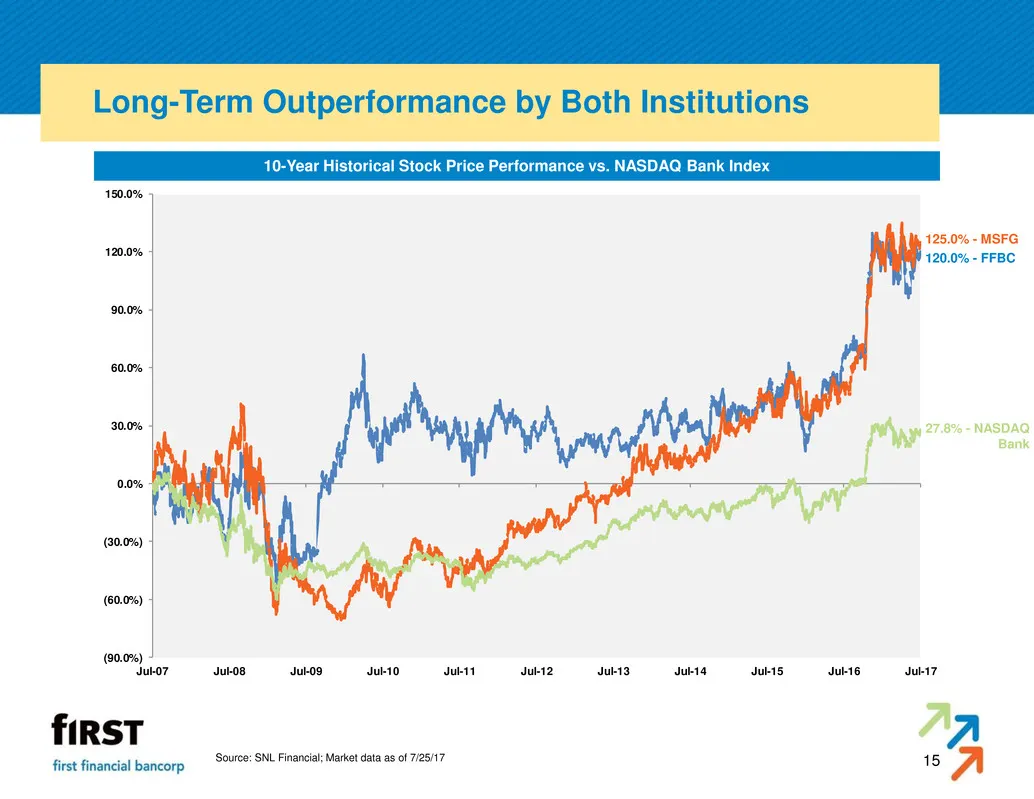
(90.0%) (60.0%) (30.0%) 0.0% 30.0% 60.0% 90.0% 120.0% 150.0% Jul-07 Jul-08 Jul-09 Jul-10 Jul-11 Jul-12 Jul-13 Jul-14 Jul-15 Jul-16 Jul-17 15 Long-Term Outperformance by Both Institutions Source: SNL Financial; Market data as of 7/25/17 10-Year Historical Stock Price Performance vs. NASDAQ Bank Index
Slide 17: Combined Management Structure
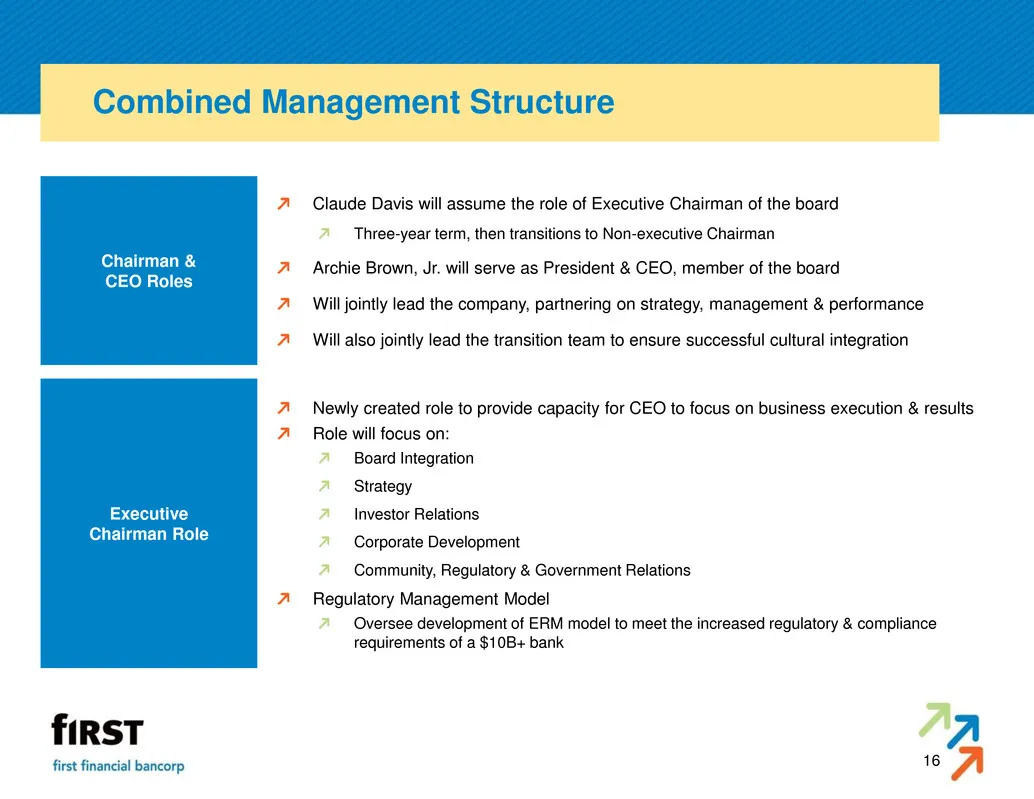
16 Combined Management Structure Claude Davis will assume the role of Executive Chairman of the board Three-year term, then transitions to Non-executive Chairman Archie Brown, Jr. will serve as President & CEO, member of the board Will jointly lead the company, partnering on strategy, management & p
Slide 18: Combined Management Structure
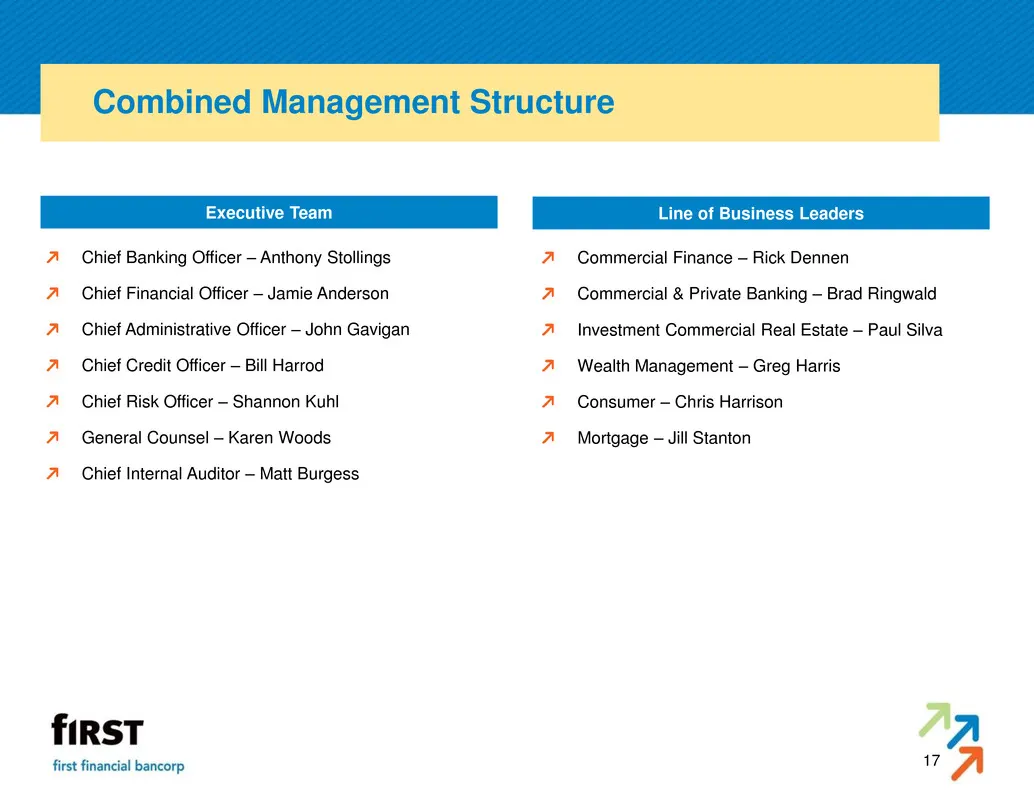
17 Combined Management Structure Chief Banking Officer – Anthony Stollings Chief Financial Officer – Jamie Anderson Chief Administrative Officer – John Gavigan Chief Credit Officer – Bill Harrod Chief Risk Officer – Shannon Kuhl General Counsel – Karen Woods Chief Internal Auditor – Matt Burgess Exe
Slide 19: Non-GAAP Reconciliation
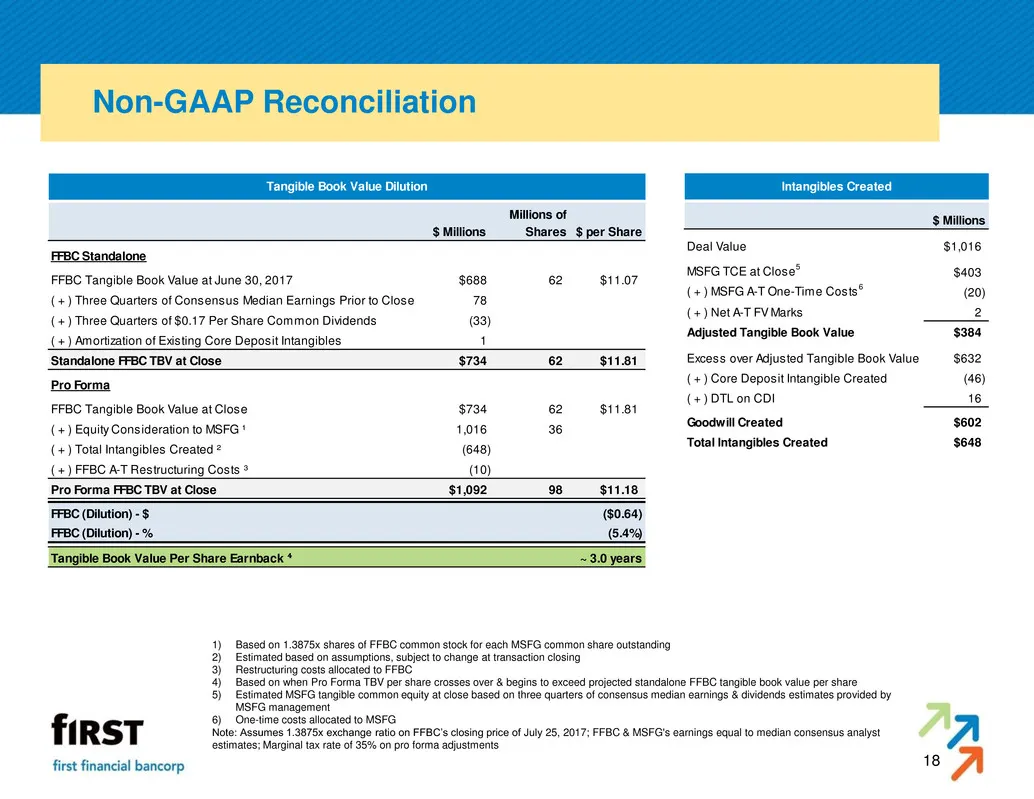
18 Non-GAAP Reconciliation 1) Based on 1.3875x shares of FFBC common stock for each MSFG common share outstanding 2) Estimated based on assumptions, subject to change at transaction closing 3) Restructuring costs allocated to FFBC 4) Based on when Pro Forma TBV per share crosses over & begins to exc
Slide 20: Non-GAAP Reconciliation
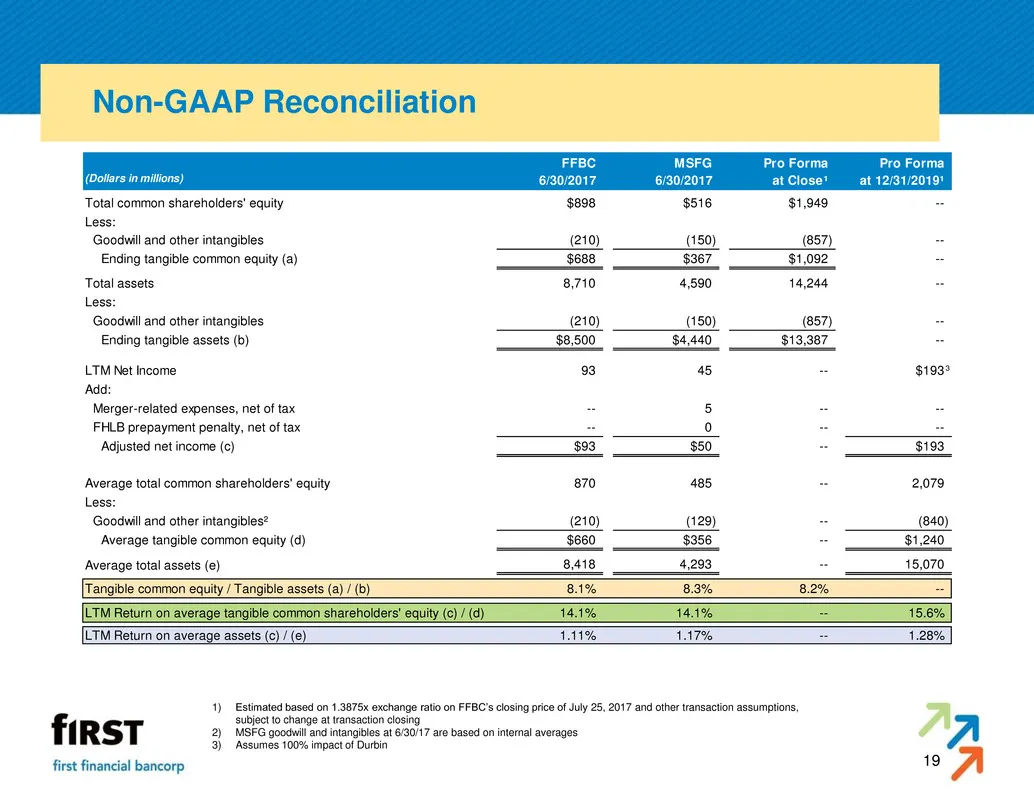
19 Non-GAAP Reconciliation 1) Estimated based on 1.3875x exchange ratio on FFBC’s closing price of July 25, 2017 and other transaction assumptions, subject to change at transaction closing 2) MSFG goodwill and intangibles at 6/30/17 are based on internal averages 3) Assumes 100% impact of Durbin FFB
Slide 21: FFBC 2Q 2017 Highlights
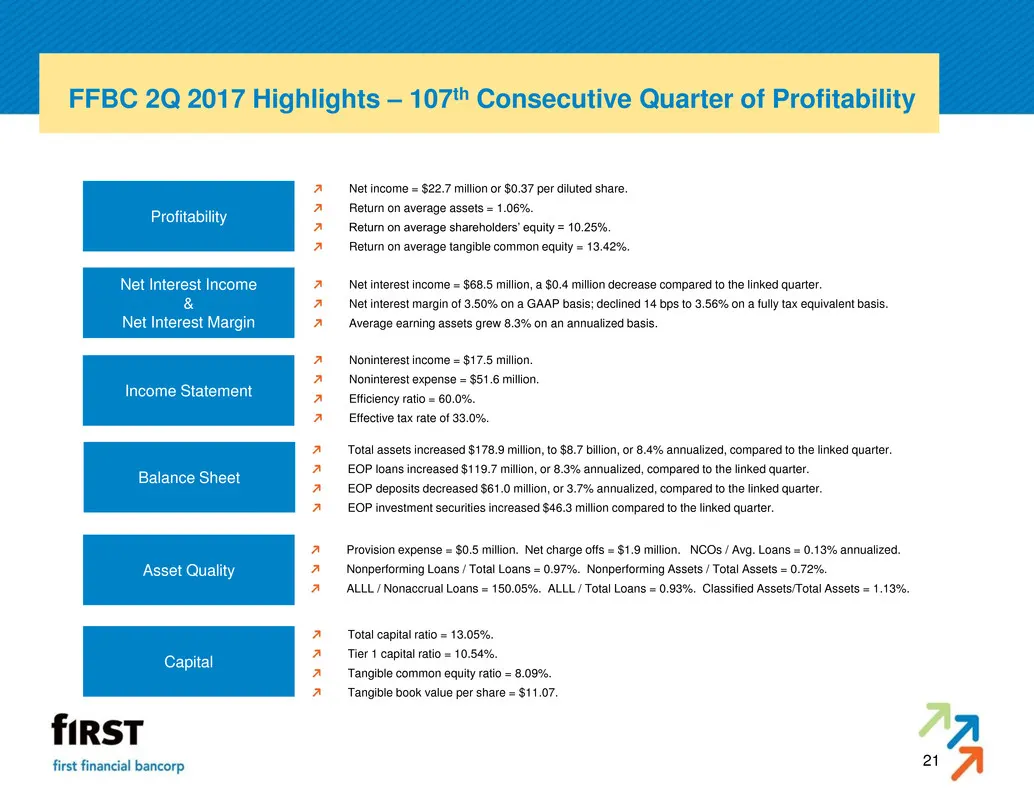
21 FFBC 2Q 2017 Highlights – 107th Consecutive Quarter of Profitability Total assets increased $178.9 million, to $8.7 billion, or 8.4% annualized, compared to the linked quarter. EOP loans increased $119.7 million, or 8.3% annualized, compared to the linked quarter. EOP deposits decreased $61.0 mil
Slide 22: MSFG 2Q 2017 Highlights
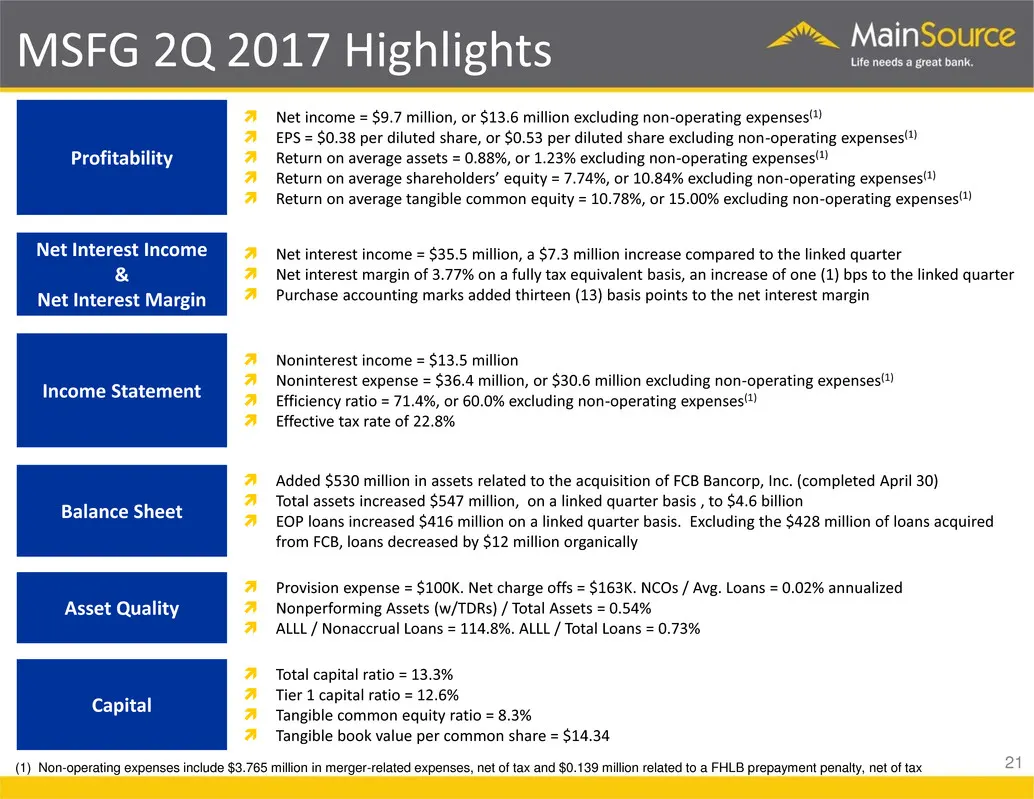
MSFG 2Q 2017 Highlights 21 Profitability Net Interest Income & Net Interest Margin Income Statement Balance Sheet Asset Quality Capital Net income = $9.7 million, or $13.6 million excluding non-operating expenses(1) EPS = $0.38 per diluted share, or $0.53 per diluted share excluding non-operatin
Slide 23: mime
mime NASDAQ GLOBAL SELECT IRST Another ctan an the nath ta csiiccace
Source: SEC EDGAR · 425 filed Jul 31, 2017
More decks from MainSource Financial Group Inc
 Merger or Acquisition (October 2017)25 slides · Oct 31, 2017
 Merger or Acquisition (July 2017)19 slides · Jul 26, 2017
 Shareholder Meeting (May 2017)67 slides · May 3, 2017
 Merger or Acquisition (December 2016)7 slides · Dec 19, 2016
 Investor Presentation (September 2016)34 slides · Sep 22, 2016
 Shareholder Meeting (April 2015)86 slides · Apr 30, 2015