MainSource Financial Group Inc
MainSource Financial — Investor Presentation (September 2016)
34 slides from MainSource Financial's investor presentation, Sep 22, 2016
Slide 1: Disclosure Regarding Forward Looking Statements
Disclosure Regarding Forward Looking Statements 2 This presentation may include comments or information that constitute forward-looking statements (within the meaning of the Private Securities Litigation Reform Act of 1995) based on current expectations that involve a number of risks and uncertainti
Slide 2: Disclosure Regarding Forward Looking Statements
Main Disclosure Regarding Forward Looking Statements Le nats a goat an This presentation may include comments or information that constitute forward-looking statements (within the meaning of the Private Securities Litigation Reform Act of 1995) based on current expectations that involve a number of
Slide 3: Franchise Overview
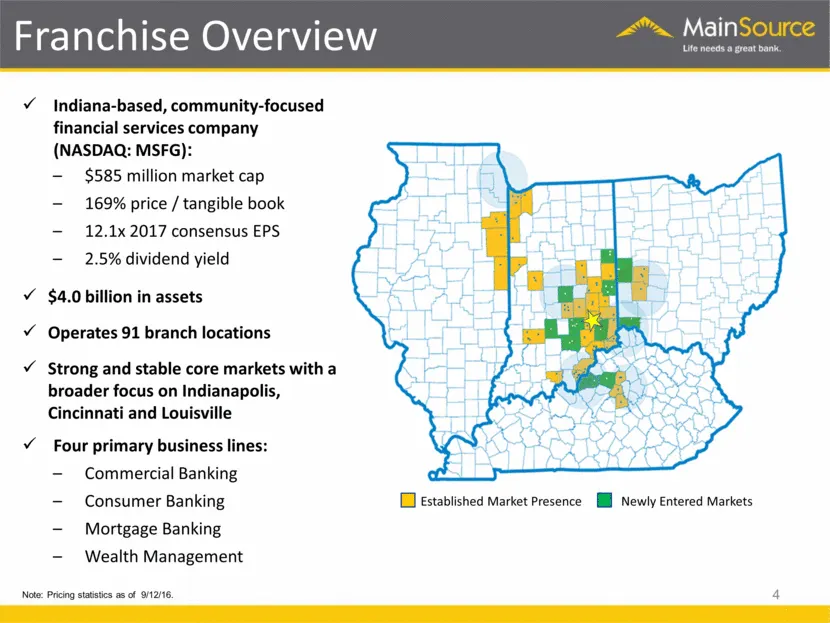
Indiana-based, community-focused financial services company (NASDAQ: MSFG): $585 million market cap 169% price / tangible book 12.1x 2017 consensus EPS 2.5% dividend yield $4.0 billion in assets Operates 91 branch locations Strong and stable core markets with a broader focus on Indianapolis, Cincinn
Slide 4: Experienced Management Team
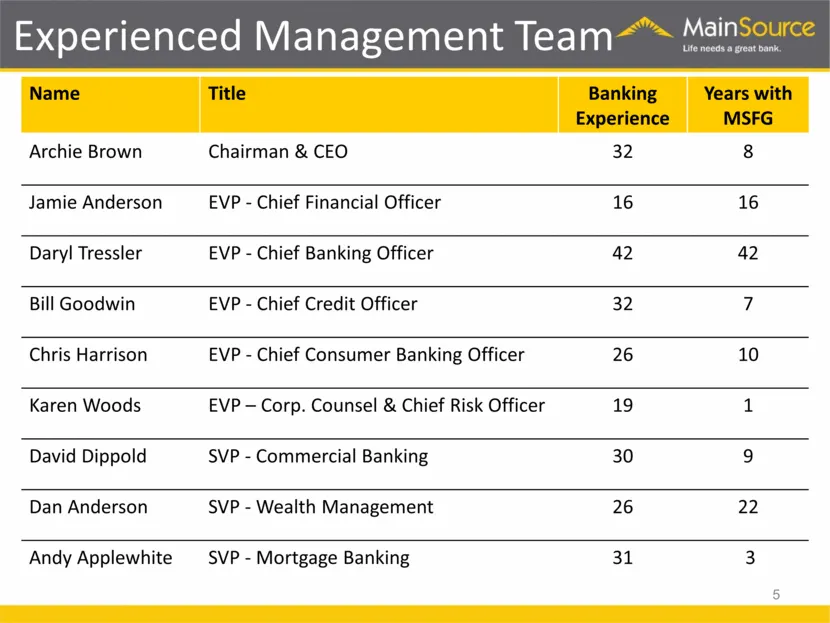
Name Title Banking Experience Years with MSFG Archie Brown Chairman & CEO 32 8 Jamie Anderson EVP - Chief Financial Officer 16 16 Daryl Tressler EVP - Chief Banking Officer 42 42 Bill Goodwin EVP - Chief Credit Officer 32 7 Chris Harrison EVP - Chief Consumer Banking Officer 26 10 Karen Woods EVP –
Slide 5: Strategic Execution Highlights
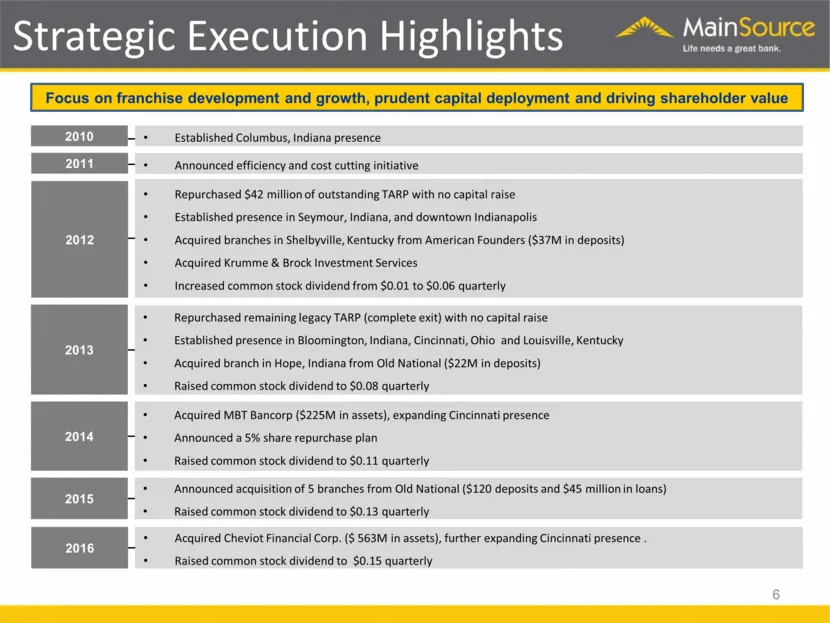
Strategic Execution Highlights 6 Established Columbus, Indiana presence 2010 2011 Announced efficiency and cost cutting initiative 2012 Repurchased $42 million of outstanding TARP with no capital raise Established presence in Seymour, Indiana, and downtown Indianapolis Acquired branches in Shelbyvil
Slide 6: Our Markets
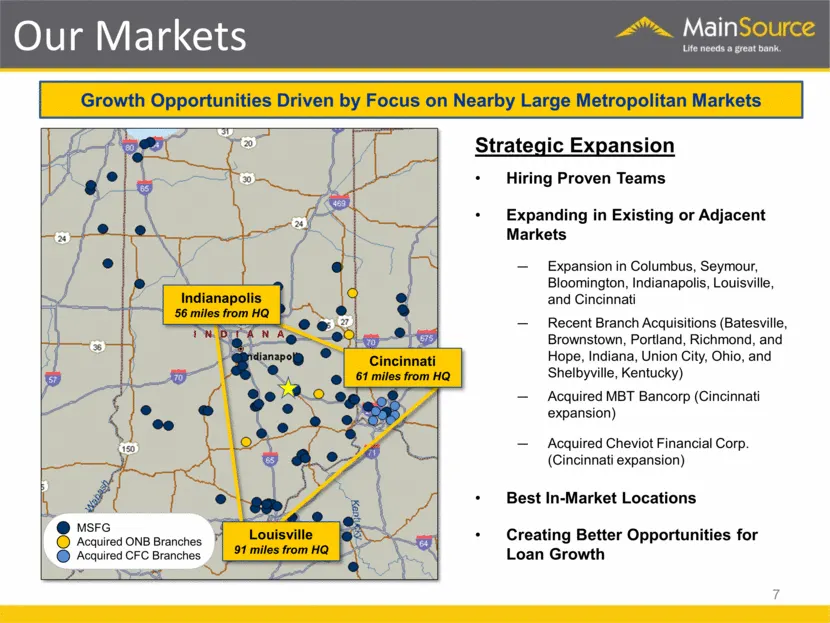
7 Our Markets Strategic Expansion Hiring Proven Teams Expanding in Existing or Adjacent Markets Expansion in Columbus, Seymour, Bloomington, Indianapolis, Louisville, and Cincinnati Recent Branch Acquisitions (Batesville, Brownstown, Portland, Richmond, and Hope, Indiana, Union City, Ohio, and Shelb
Slide 7: Attractive Market Dynamics
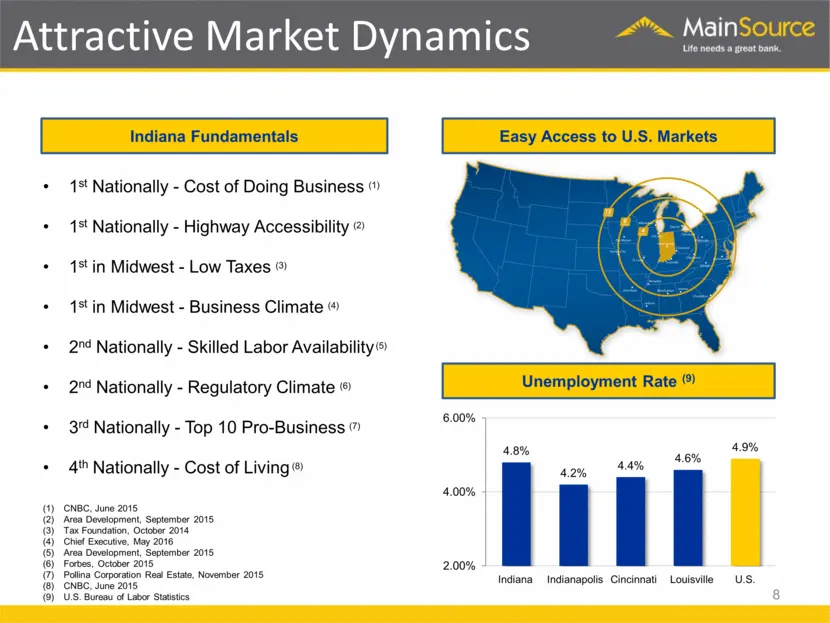
Attractive Market Dynamics 8 Indiana Fundamentals Easy Access to U.S. Markets Unemployment Rate (9) CNBC, June 2015 Area Development, September 2015 Tax Foundation, October 2014 Chief Executive, May 2016 Area Development, September 2015 Forbes, October 2015 Pollina Corporation Real Estate, November
Slide 8: Attractive Market Dynamics
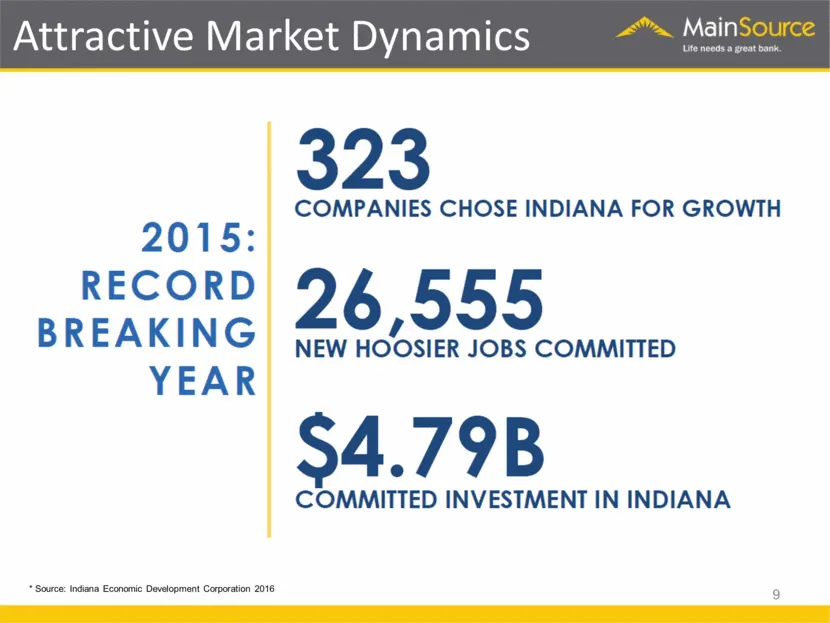
9 Attractive Market Dynamics * Source: Indiana Economic Development Corporation 2016 2015: RECORD BREAKING YEAR 323 COMPANIES CHOSE INDIANA FOR GROWTH 26,555 NEW HOOSIER JOBS COMMITTED $4.79B COMMITTED INVESTMENT IN INDIANA 9
Slide 9: Attractive Market Dynamics
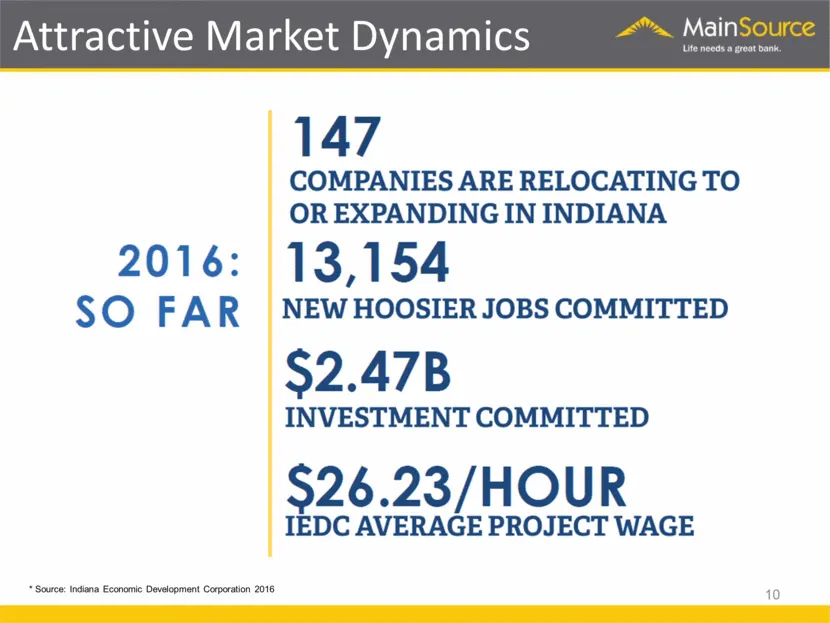
10 Attractive Market Dynamics * Source: Indiana Economic Development Corporation 2016 2016: SO FAR 147 COMPANIES ARE RELOCATING TO OR EXPANDING IN INDIANA 13,154 NEW HOOSIER JOBS COMMITTED $2.47B INVESTMENT COMMITTED $26.23/HOUR IEDC AVERAGE PROJECT WAGE 10
Slide 10: Our Strategy
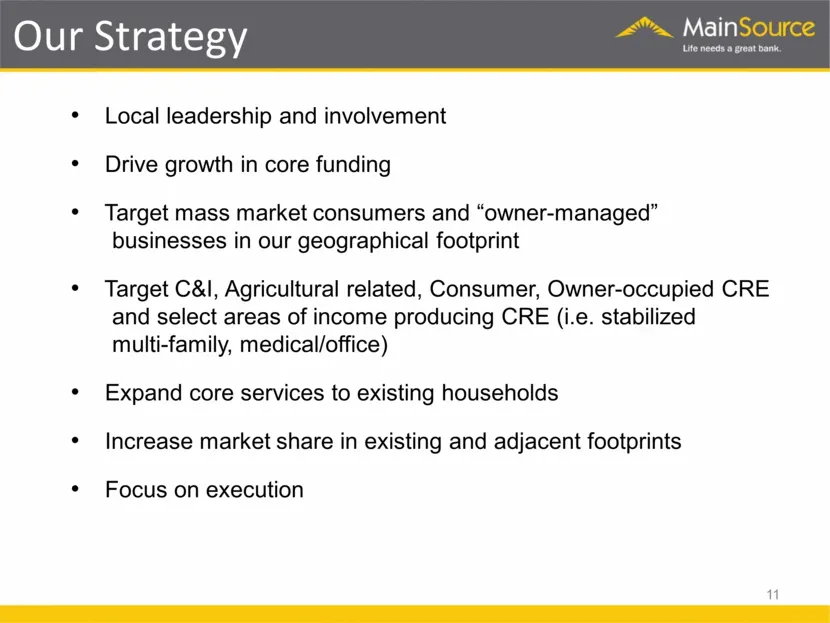
Local leadership and involvement Drive growth in core funding Target mass market consumers and “owner-managed” businesses in our geographical footprint Target C&I, Agricultural related, Consumer, Owner-occupied CRE and select areas of income producing CRE (i.e. stabilized multi-family, medical/offic
Slide 11: Our Strategy
Our Strategy ¢ Local leadership and involvement ¢ Drive growth in core funding ¢ Target mass market consumers and “owner-managed” businesses in our geographical footprint * Target C&l, Agricultural related, Consumer, Owner-occupied CRE and select areas of income producing CRE (i.e. stabilized multi-
Slide 12: 2nd Quarter 2016 Summary
2nd Quarter 2016 Summary 13 Earnings of $6.1 million, or $0.27 per share, and an ROAA of 0.67% Merger charge of $6.4 million related to Cheviot acquisition Organic Loan Growth of $36 million, or 7% annualized Credit Quality remained strong with NCOs of -0.03% and NPAs at 0.58% of assets Strong fee i
Slide 13: Historical Financial Highlights
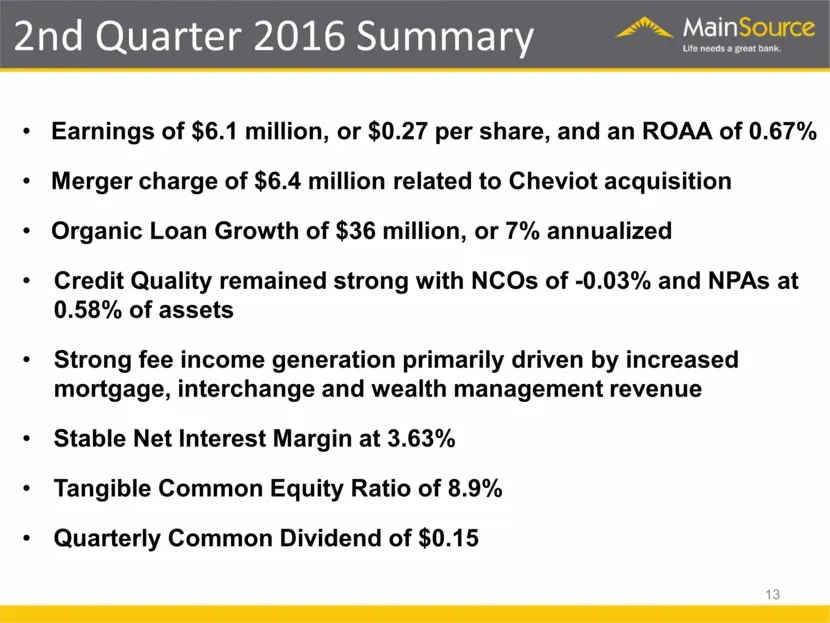
14 Historical Financial Highlights ($000s, except per share) 2013 2014 2015 YTD (6/30/16) Income Statement: Net Interest Income $91,300 $94,208 $102,725 $54,570 Net Income $25,693 $28,996 $35,542 $14,883 Earnings Per Share $1.26 $1.39 $1.62 $0.66 Return of Average Assets 0.95% 0.99% 1.10% 0.85% Retu
Slide 14: Total Assets and Loans
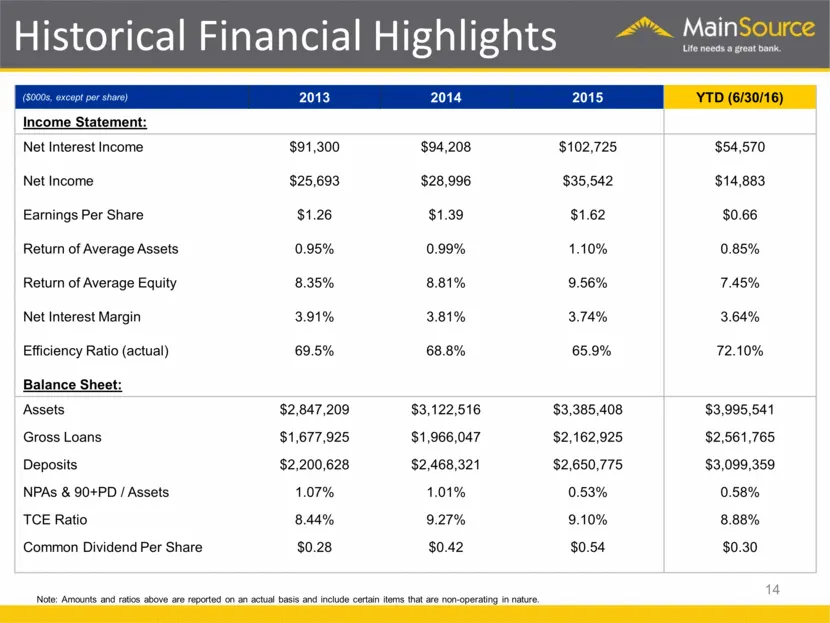
Total Assets and Loans 15 Organic Loan Growth of 7% Annualized in 2Q 2016
Slide 15: Diversified Loan Portfolio
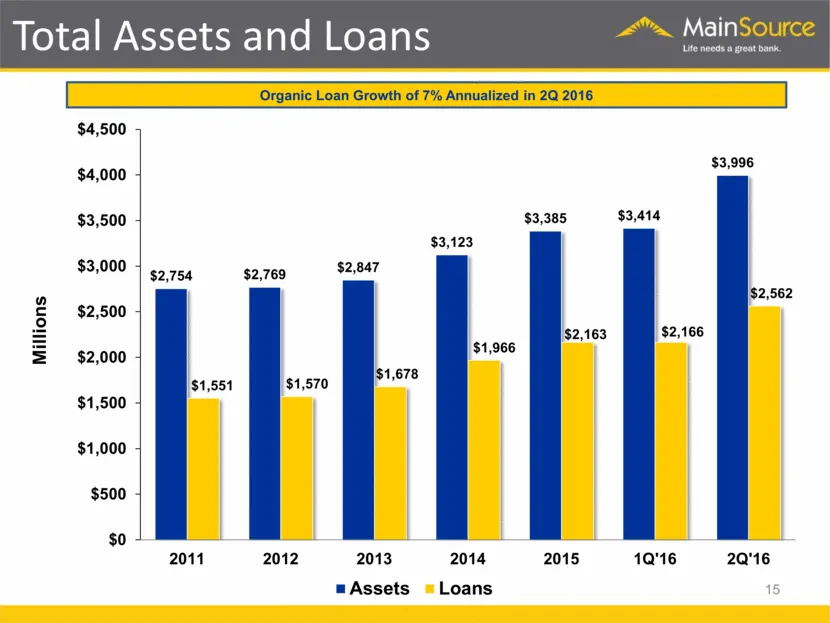
Diversified Loan Portfolio $2.6 billion Yield: 4.30% CRE: Retail = $147 1-4 Family = $73 Office/Medical = $96 Industrial/Warehouse = $163 Multi-Family = $72 Construction & Development = $83 Other = $110 16 Commercial Real Estate Portfolio ($M) Total Loans ($M) As of June 30, 2016 $982 million C&I: $
Slide 16: Strong Credit Quality
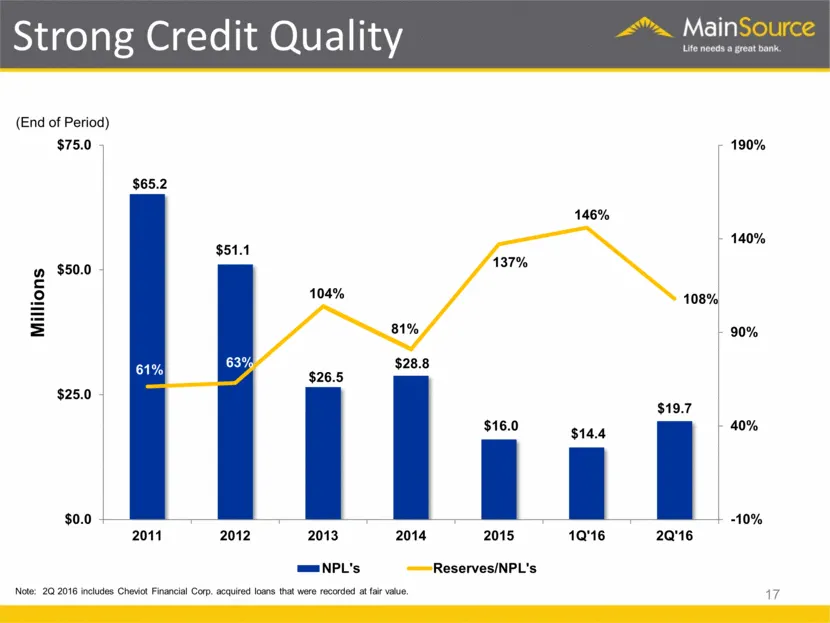
Strong Credit Quality 17 (End of Period) Millions 137% Note: 2Q 2016 includes Cheviot Financial Corp. acquired loans that were recorded at fair value.
Slide 17: Conservative Investment Portfolio
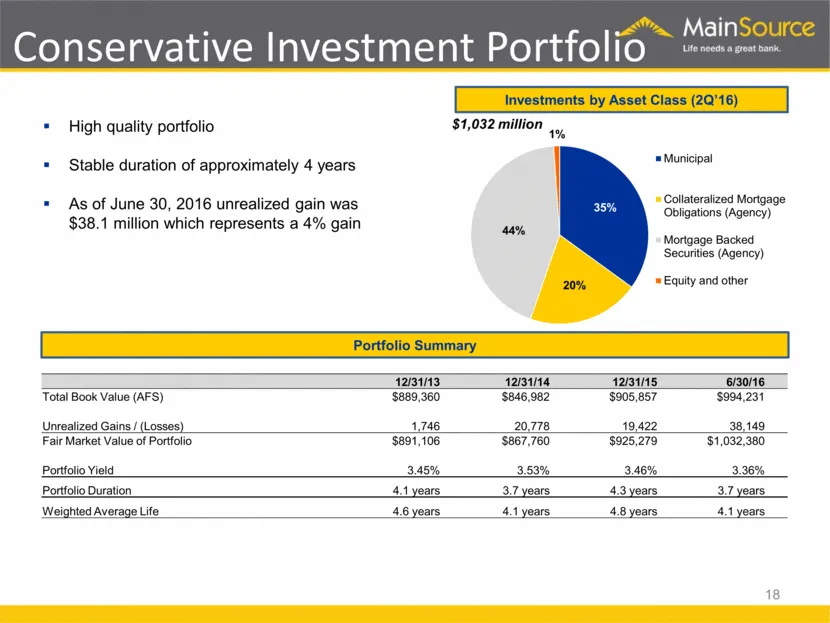
Conservative Investment Portfolio 18 Investments by Asset Class (2Q’16) Portfolio Summary High quality portfolio Stable duration of approximately 4 years As of June 30, 2016 unrealized gain was $38.1 million which represents a 4% gain 12/31/13 12/31/14 12/31/15 6/30/16 Total Book Value (AFS) $889,36
Slide 18: Growing Core Funding
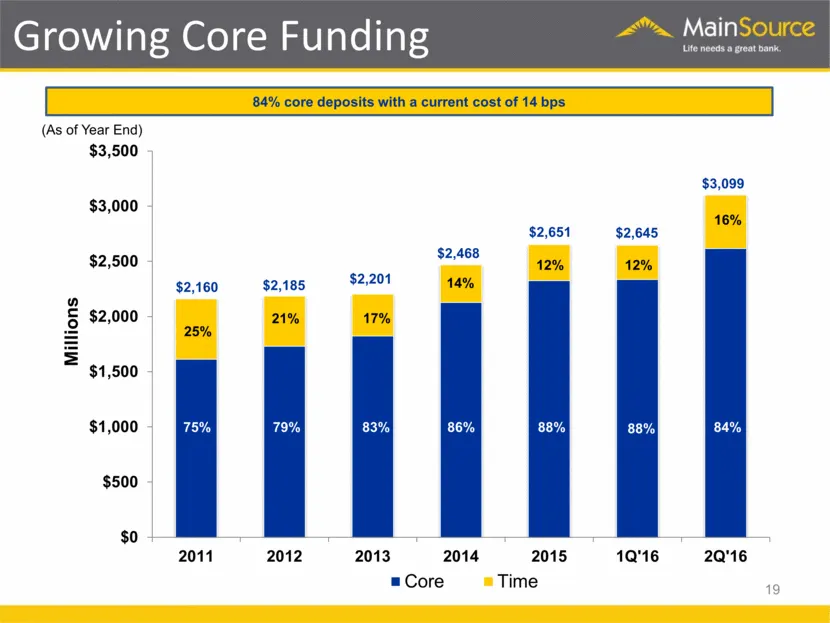
Growing Core Funding (As of Year End) 12% 12% 25% 21% 17% 83% 19 14% 86% 84% core deposits with a current cost of 14 bps 16% 88% $3,099 $2,651 $2,160 $2,185 $2,201 $0 $500 $1,000 $1,500 $2,000 $2,500 $3,000 $3,500 2011 2012 2013 2014 2015 1Q'16 2Q'16 Millions Core Time 88% 68% 75% 79% $2,468 84% $2,
Slide 19: Non-Interest Bearing DDA
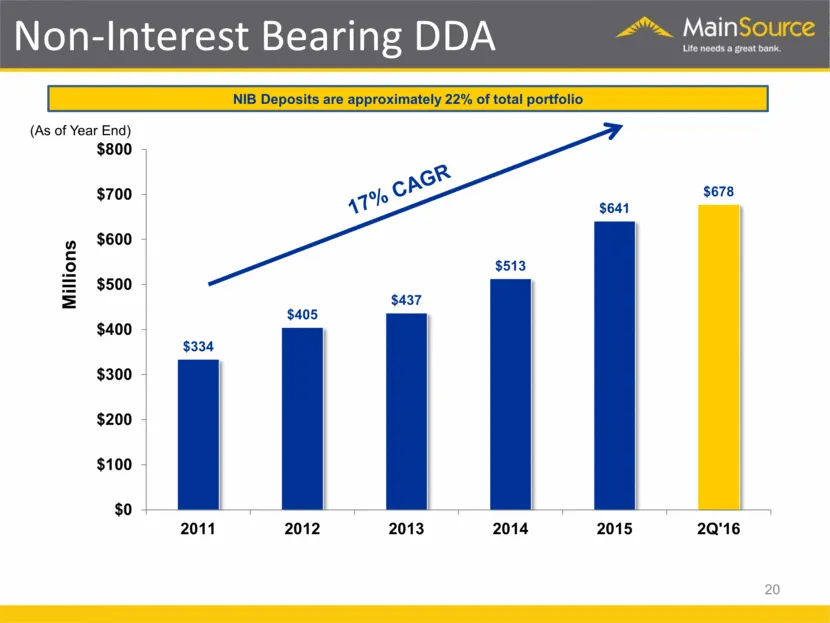
Non-Interest Bearing DDA Millions 20 NIB Deposits are approximately 22% of total portfolio (As of Year End) 17% CAGR $334 $405 $437 $513 $641 $678 $0 $100 $200 $300 $400 $500 $600 $700 $800 2011 2012 2013 2014 2015 2Q'16
Slide 20: Operating Earnings/Growth
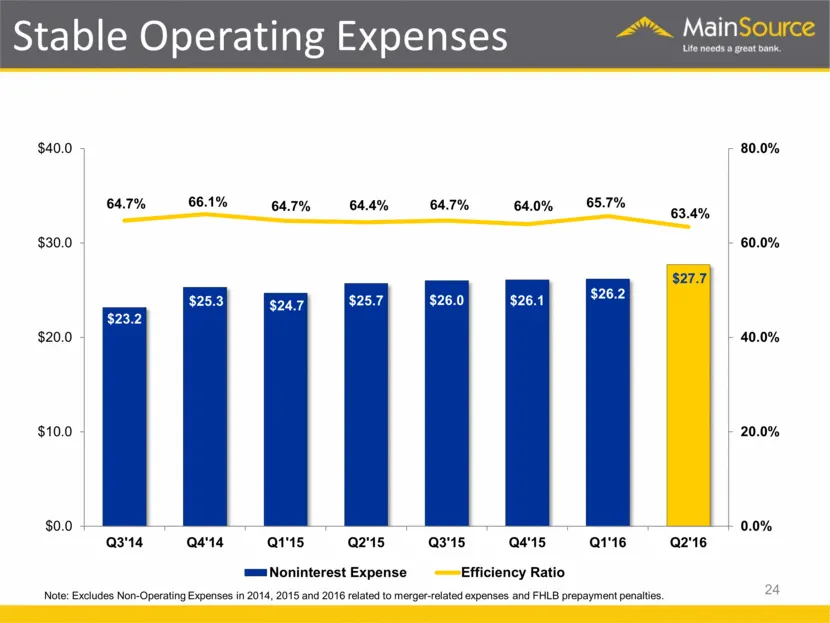
Operating Earnings/Growth Millions 21 * 2016 earnings represent YTD June, 2016 actual plus consensus estimate for second half of 2016. Excludes certain non-operating items. 12% CAGR
Slide 21: Net Interest Income
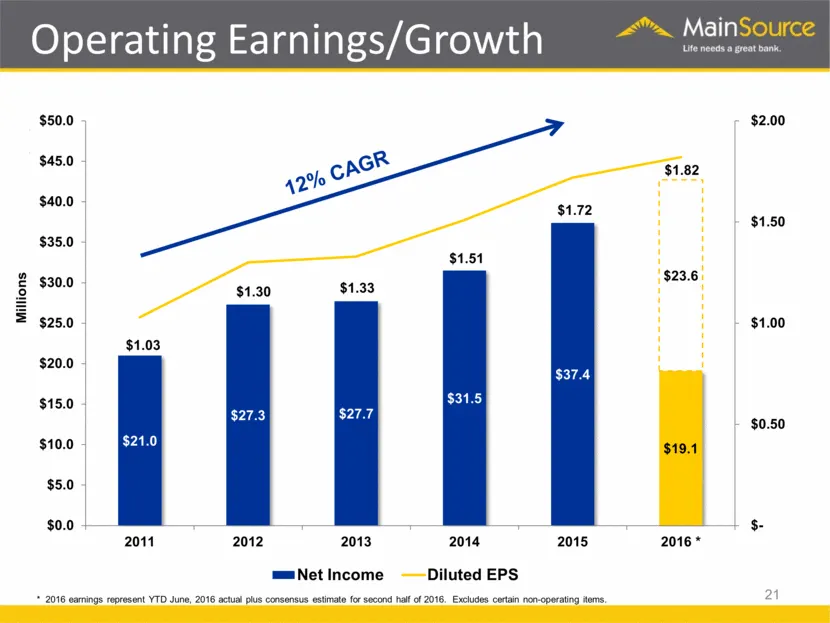
Net Interest Income Millions 22
Slide 22: Core Fee Income
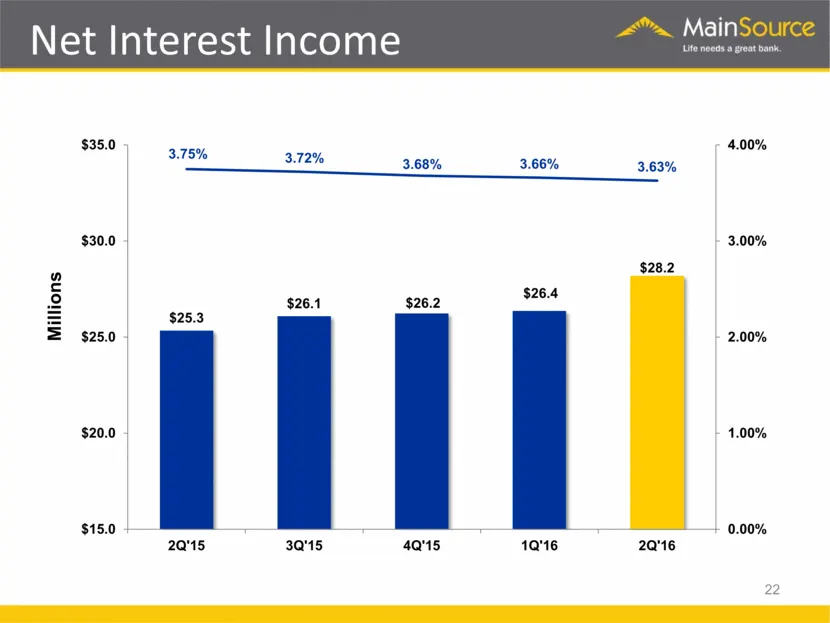
Core Fee Income Note: Includes service charges, interchange income, mortgage banking income, and wealth management fees. 23 Fee Income is 31% of Total Revenue in 2016
Slide 23: Stable Operating Expenses
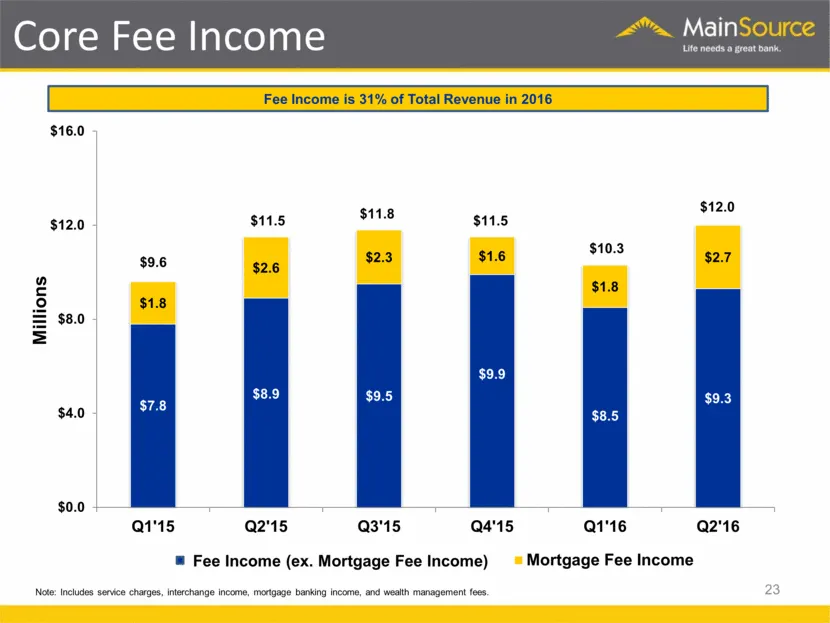
$25.4 $27.6 $30.0 $30.0 $32.2 $27.6 $25.4 $23.5 $19.7 24 $32.1 Stable Operating Expenses Note: Excludes Non-Operating Expenses in 2014, 2015 and 2016 related to merger-related expenses and FHLB prepayment penalties.
Slide 24: Well-Capitalized
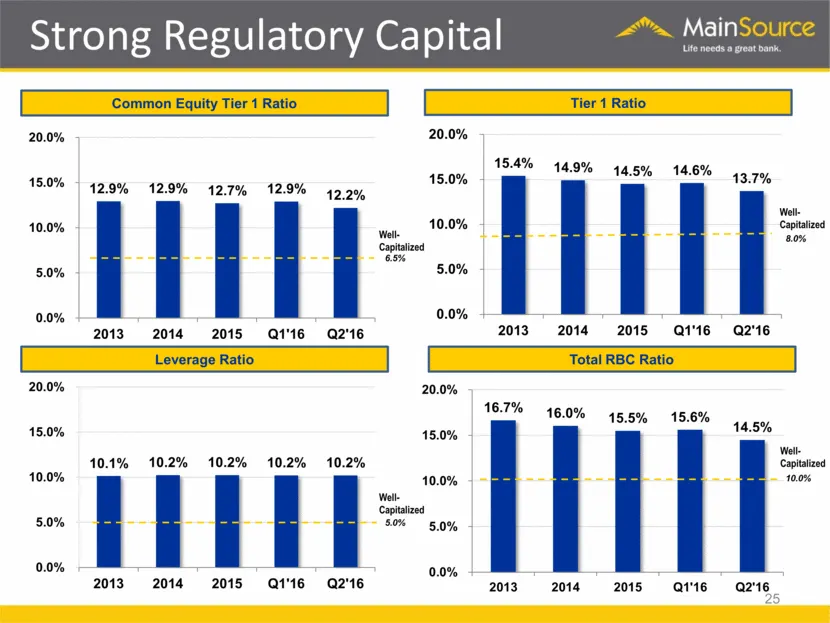
Well-Capitalized 25 Strong Regulatory Capital Leverage Ratio Tier 1 Ratio Total RBC Ratio Common Equity Tier 1 Ratio Well-Capitalized Well-Capitalized Well-Capitalized 10.0% 8.0% 5.0% 6.5% 10.1% 10.2% 10.2% 10.2% 10.2% 0.0% 5.0% 10.0% 15.0% 20.0% 2013 2014 2015 Q1'16 Q2'16 15.4% 14.9% 14.5% 14.6% 13
Slide 25: Capital Management
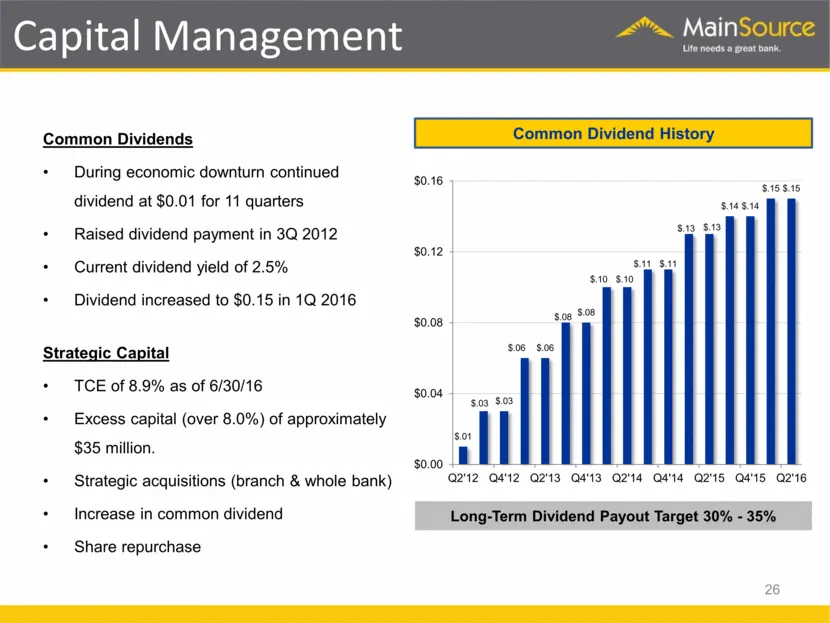
Capital Management 26 Long-Term Dividend Payout Target 30% - 35% Common Dividend History Common Dividends During economic downturn continued dividend at $0.01 for 11 quarters Raised dividend payment in 3Q 2012 Current dividend yield of 2.5% Dividend increased to $0.15 in 1Q 2016 Strategic Capital TC
Slide 26: Capital Management
Capital Management Main Ute needs a great bank Common Dividends + During economic downturn continued dividend at $0.01 for 11 quarters + Raised dividend payment in 3Q 2012 + — Current dividend yield of 2.5% + Dividend increased to $0.15 in 1Q 2016 Strategic Capital + TCE of 8.9% as of 6/30/16 + Exce
Slide 27: Strategic Priorities
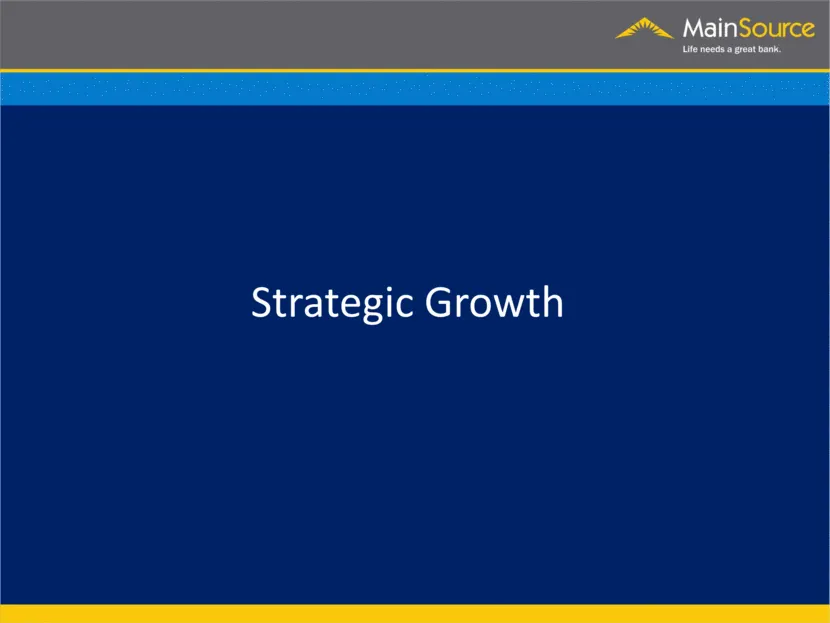
Strategic Priorities 28 Focus on quality loan growth Maintain asset quality Expense control and operating efficiency Successfully execute expansion strategies Strategic M&A Grow earnings and drive shareholder value
Slide 28: Expansion Strategy
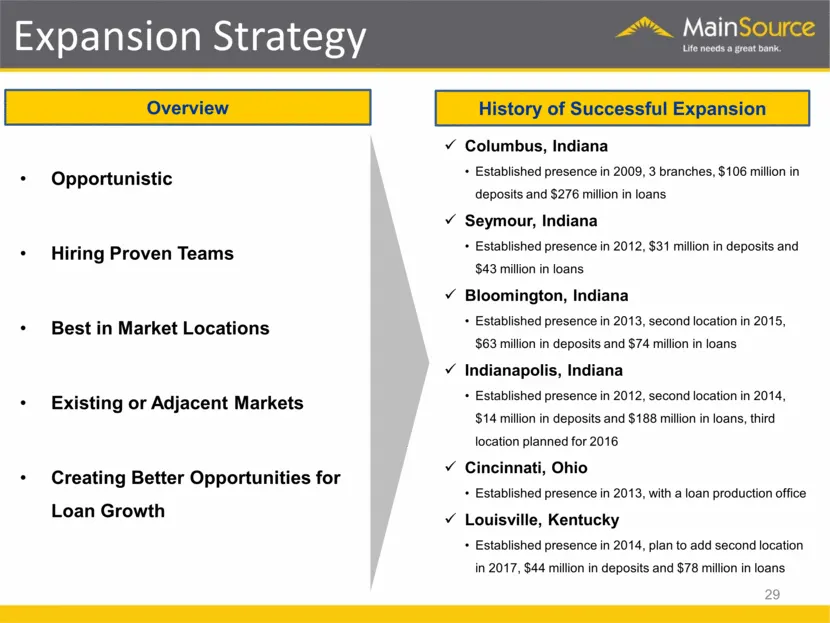
Opportunistic Hiring Proven Teams Best in Market Locations Existing or Adjacent Markets Creating Better Opportunities for Loan Growth Expansion Strategy 29 Overview History of Successful Expansion Columbus, Indiana Established presence in 2009, 3 branches, $106 million in deposits and $276 million i
Slide 29: Merger & Acquisition Strategy
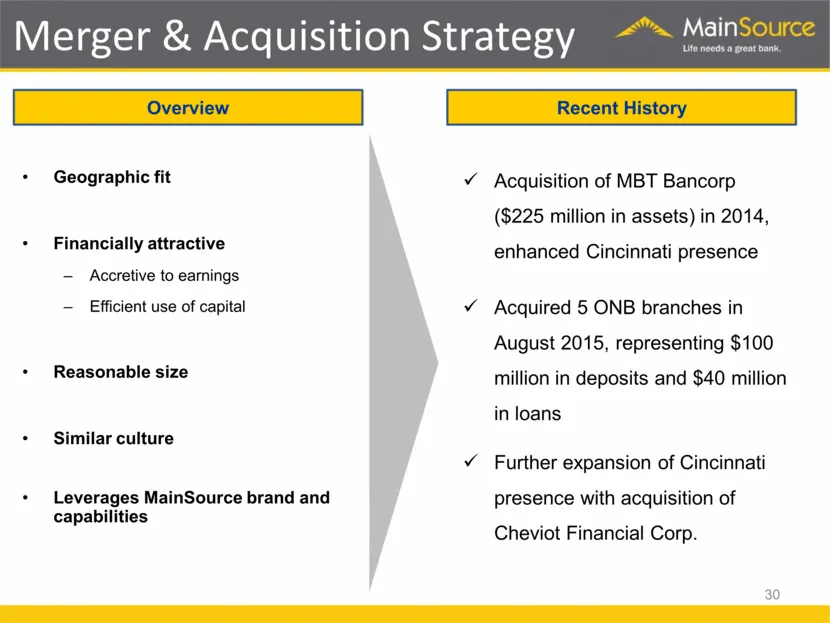
30 Geographic fit Financially attractive Accretive to earnings Efficient use of capital Reasonable size Similar culture Leverages MainSource brand and capabilities Merger & Acquisition Strategy Acquisition of MBT Bancorp ($225 million in assets) in 2014, enhanced Cincinnati presence Acquired 5 ONB b
Slide 30: Merger & Acquisition Strategy
r & Acquisitio + Geographic fit Y Acquisition of MBT Bancorp ($225 million in assets) in 2014, * Financially attractive enhanced Cincinnati presence — Accretive to earnings — Efficient use of capital v Acquired 5 ONB branches in August 2015, representing $100 + Reasonable size million in deposits an
Slide 31: Attractive Valuation
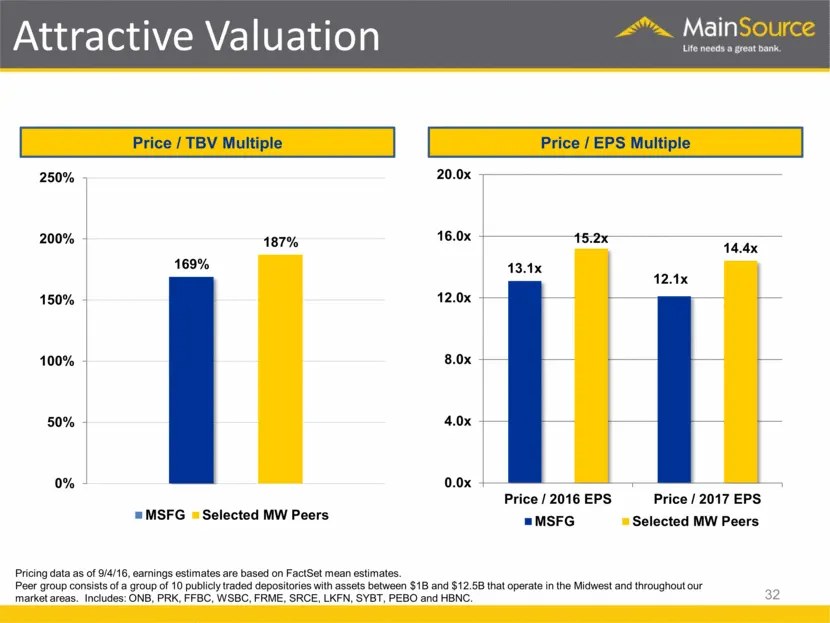
32 Attractive Valuation Price / TBV Multiple Price / EPS Multiple Pricing data as of 9/4/16, earnings estimates are based on FactSet mean estimates. Peer group consists of a group of 10 publicly traded depositories with assets between $1B and $12.5B that operate in the Midwest and throughout our mar
Slide 32: Investment Highlights
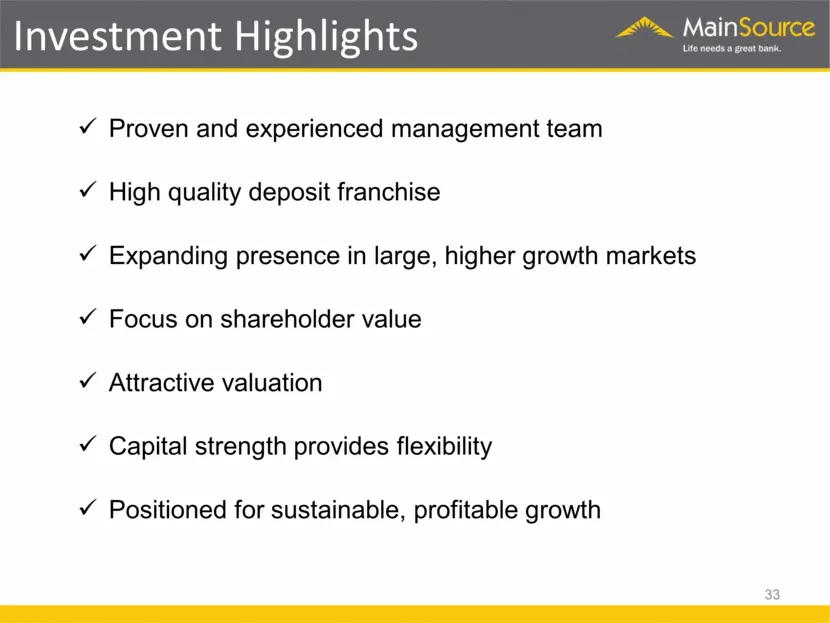
Proven and experienced management team High quality deposit franchise Expanding presence in large, higher growth markets Focus on shareholder value Attractive valuation Capital strength provides flexibility Positioned for sustainable, profitable growth Investment Highlights 33
Slide 33: MainSource Financial Group
MainSource FINANCIAL GROUP Meeting the financial needs of our costomers... for life

Slide 34: MainSource Financial Group
Ue, a MainSource FINANCIAL GROU
Source: SEC EDGAR · 8-K filed Sep 22, 2016
More decks from MainSource Financial Group Inc
 Merger or Acquisition (October 2017)25 slides · Oct 31, 2017
 Merger or Acquisition (July 2017)23 slides · Jul 31, 2017
 Merger or Acquisition (July 2017)19 slides · Jul 26, 2017
 Shareholder Meeting (May 2017)67 slides · May 3, 2017
 Merger or Acquisition (December 2016)7 slides · Dec 19, 2016
 Shareholder Meeting (April 2015)86 slides · Apr 30, 2015