AssetMark Financial Holdings Inc
AssetMark Financial — Investor Presentation (August 2020)
36 slides from AssetMark Financial's investor presentation, Aug 27, 2020
Slide 1: Investor Presentation August 27-28, 2020
Investor Presentation August 27-28, 2020 Exhibit 99.1
Slide 2: Forward looking statements and non-GAAP financial measures
Forward looking statements and non-GAAP financial measures Forward-Looking Statements This presentation contains forward-looking statements within the meaning of the Private Securities Litigation Act of 1995 including statements regarding our future financial and operating performance, which involve
Slide 3: Contents
Contents Opportunity Highlights Market Overview Company Overview Financial Overview Appendix
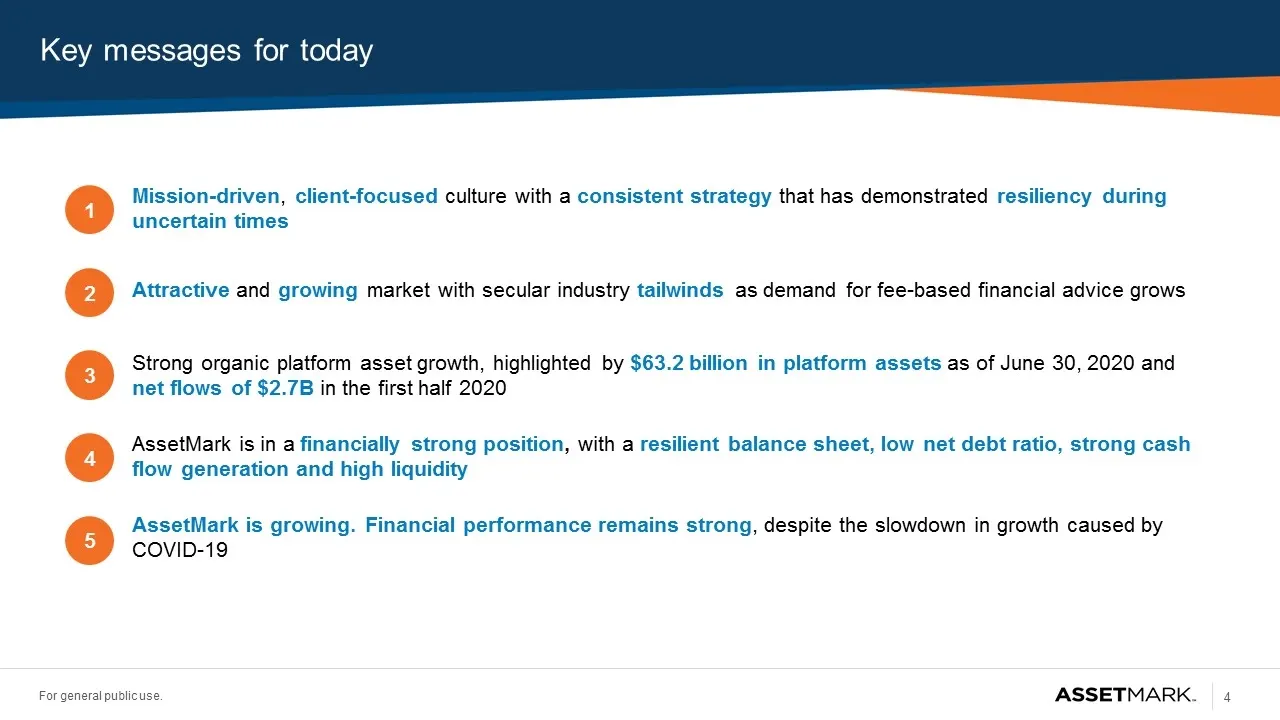
Slide 4: Key messages for today
Key messages for today 1 2 Mission-driven, client-focused culture with a consistent strategy that has demonstrated resiliency during uncertain times 3 4 Attractive and growing market with secular industry tailwinds as demand for fee-based financial advice grows 5 Strong organic platform asset growth
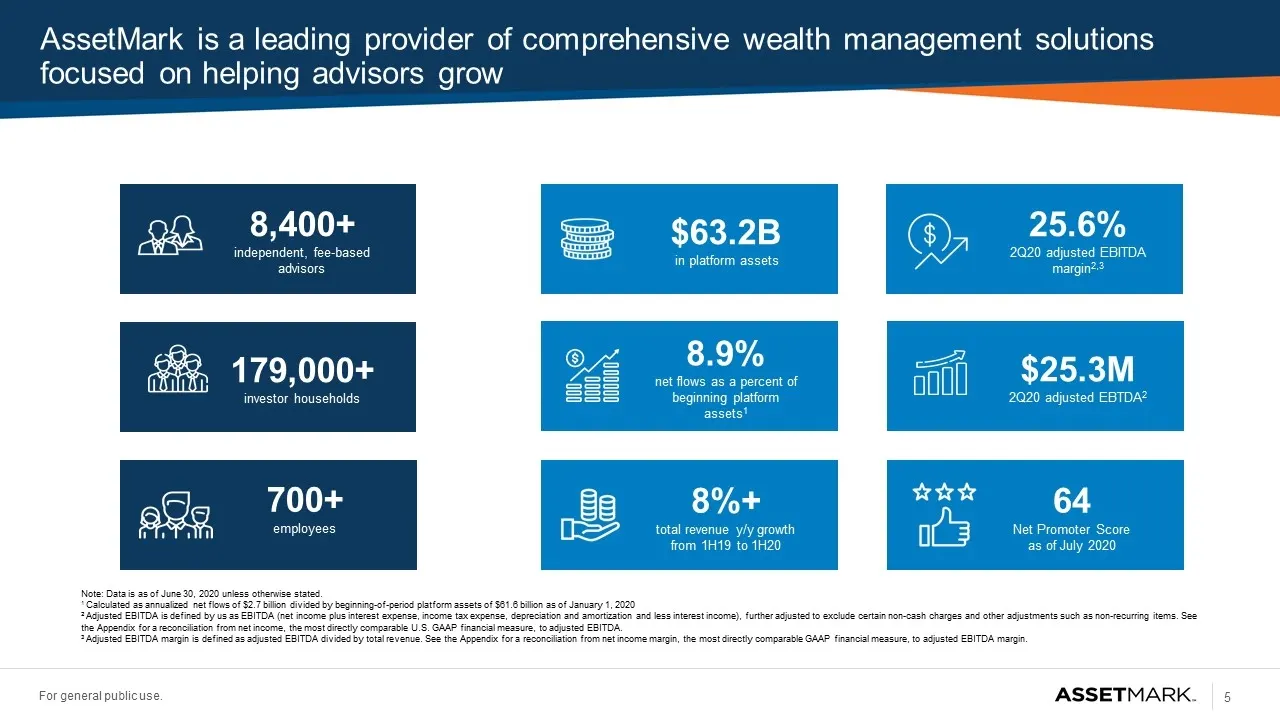
Slide 5: AssetMark is a leading provider of comprehensive wealth management solutions focused on helping advisors grow
AssetMark is a leading provider of comprehensive wealth management solutions focused on helping advisors grow Note: Data is as of June 30, 2020 unless otherwise stated. 1 Calculated as annualized net flows of $2.7 billion divided by beginning-of-period platform assets of $61.6 billion as of January
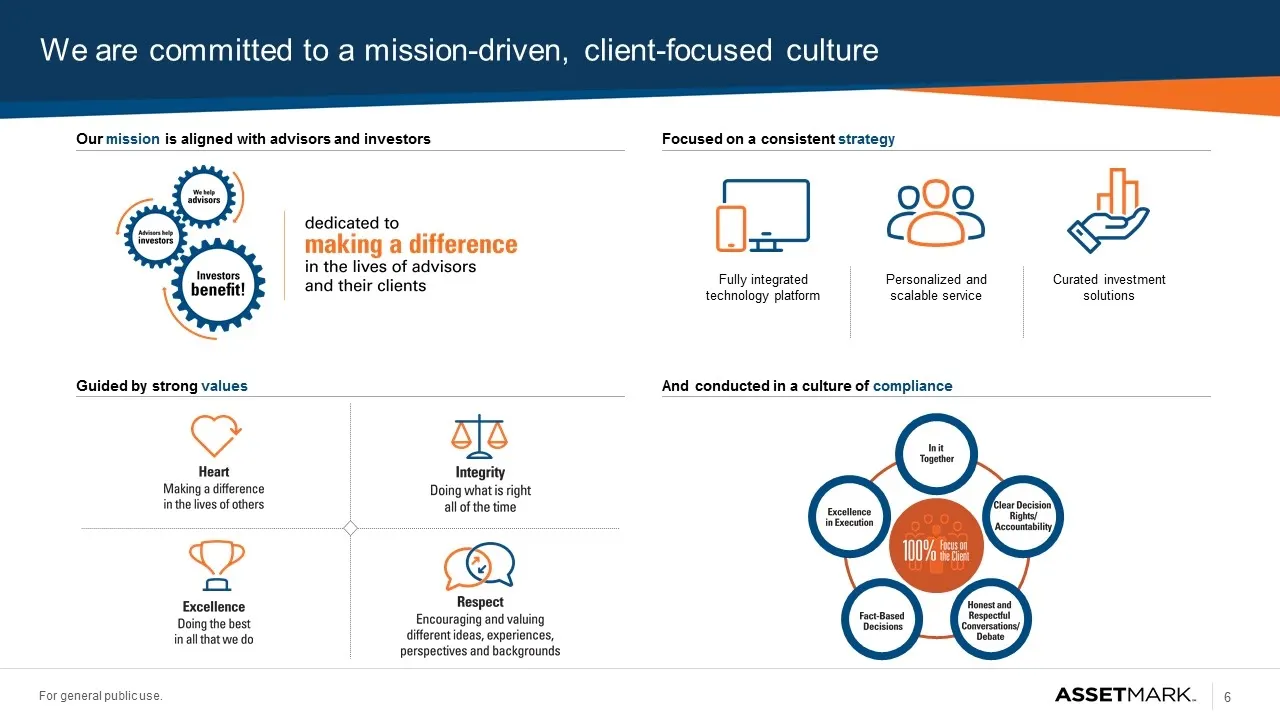
Slide 6: We are committed to a mission-driven, client-focused culture
We are committed to a mission-driven, client-focused culture Our mission is aligned with advisors and investors Focused on a consistent strategy Guided by strong values And conducted in a culture of compliance Fully integrated technology platform Personalized and scalable service Curated investment
Slide 7: Contents
Opportunity Highlights Market Overview Company Overview Financial Overview Appendix Contents
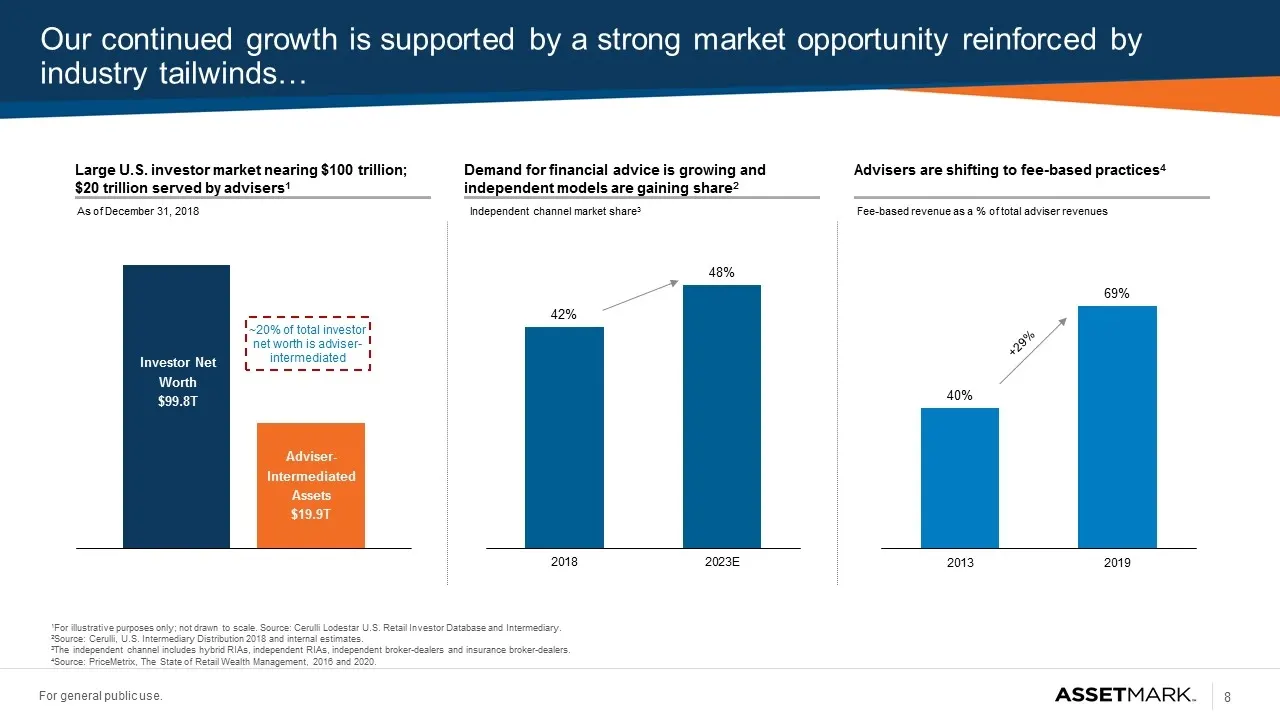
Slide 8: Our continued growth is supported by a strong market opportunity reinforced by industry tailwinds
Our continued growth is supported by a strong market opportunity reinforced by industry tailwinds… Large U.S. investor market nearing $100 trillion; $20 trillion served by advisers1 Demand for financial advice is growing and independent models are gaining share2 Advisers are shifting to fee-based pr
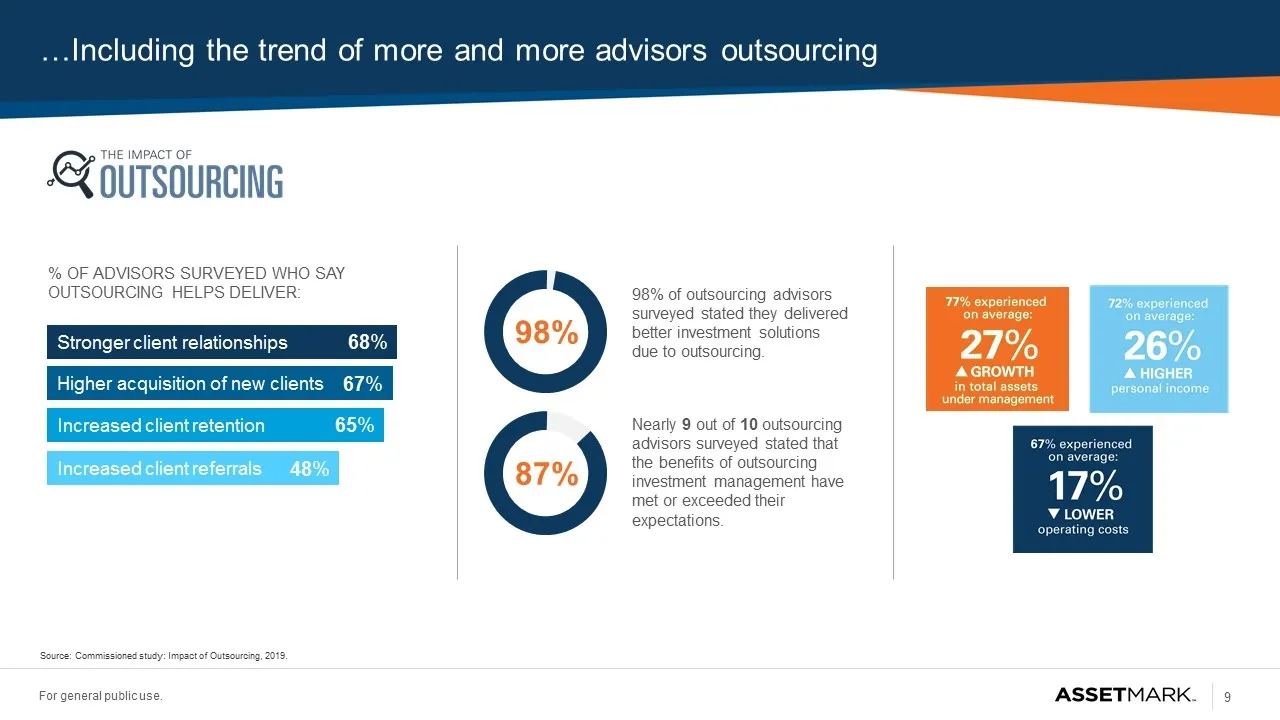
Slide 9: Including the trend of more and more advisors outsourcing
…Including the trend of more and more advisors outsourcing Source: Commissioned study: Impact of Outsourcing, 2019. Stronger client relationships Higher acquisition of new clients Increased client retention Increased client referrals 48% 65% 67% 68% 98% 87% 98% of outsourcing advisors surveyed state
Slide 10: Contents
Contents Opportunity Highlights Market Overview Company Overview Financial Overview Appendix
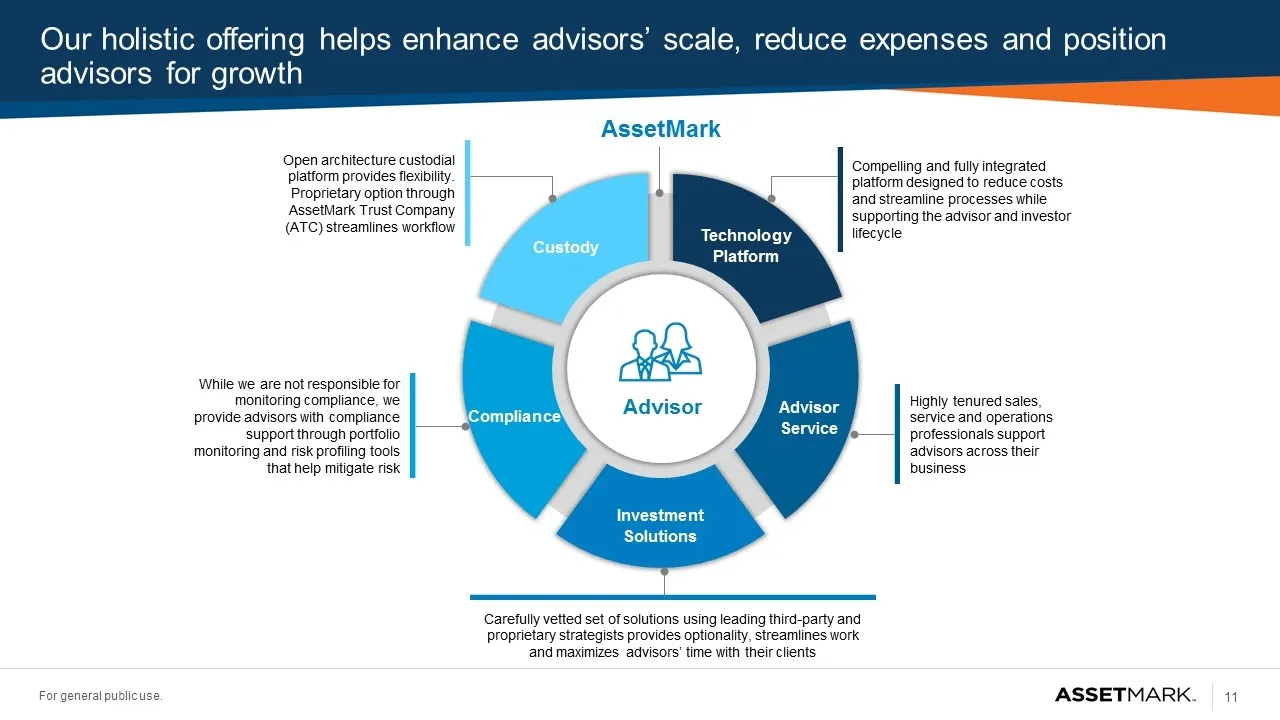
Slide 11: Our holistic offering helps enhance advisors' scale, reduce expenses and position advisors for growth
Our holistic offering helps enhance advisors’ scale, reduce expenses and position advisors for growth AssetMark Compelling and fully integrated platform designed to reduce costs and streamline processes while supporting the advisor and investor lifecycle Technology Platform Advisor Service Investmen
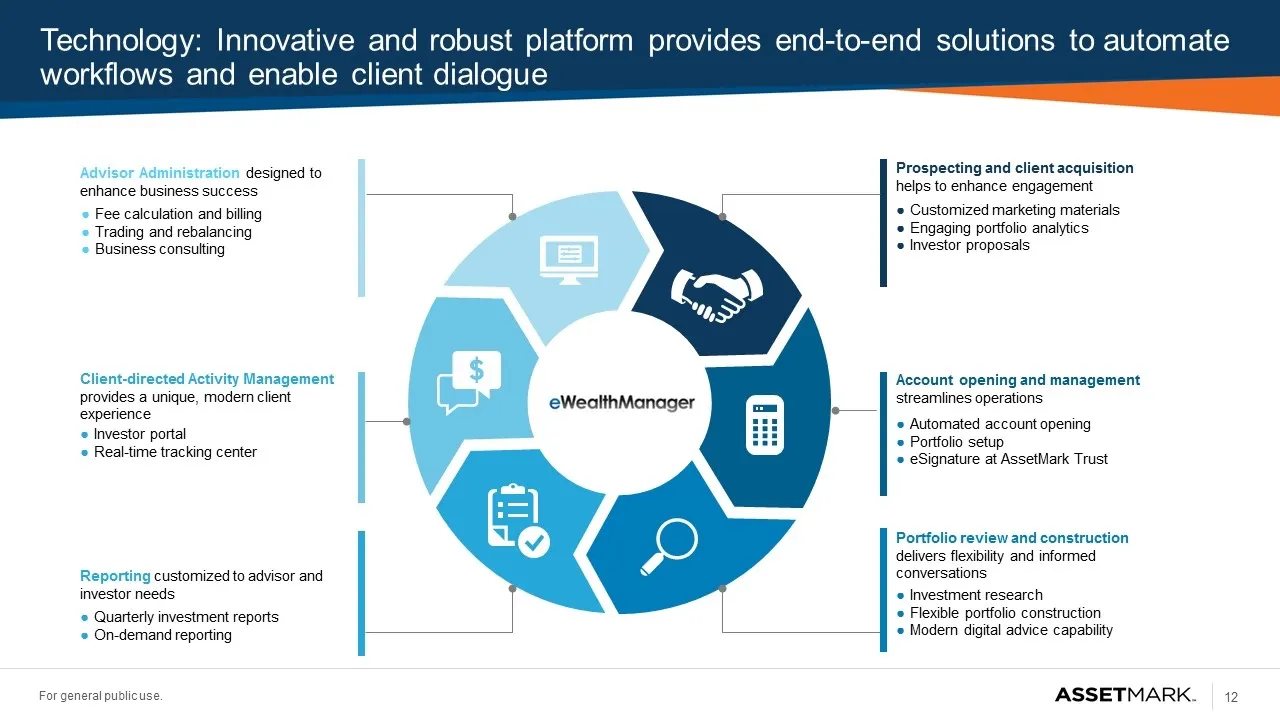
Slide 12: Technology: Innovative and robust platform provides end-to-end solutions
Technology: Innovative and robust platform provides end-to-end solutions to automate workflows and enable client dialogue Reporting customized to advisor and investor needs Quarterly investment reports On-demand reporting Client-directed Activity Management provides a unique, modern client experienc
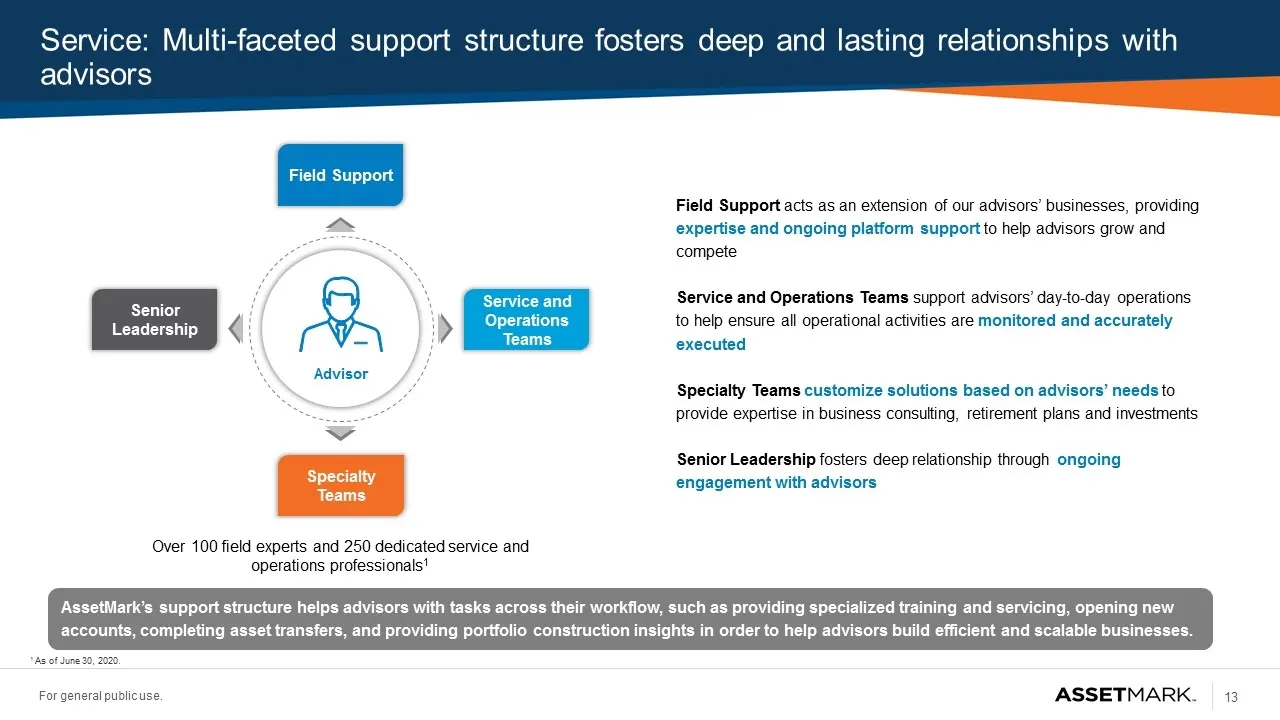
Slide 13: Field Support acts as an extension of our advisors' businesses
Field Support acts as an extension of our advisors’ businesses, providing expertise and ongoing platform support to help advisors grow and compete Service and Operations Teams support advisors’ day-to-day operations to help ensure all operational activities are monitored and accurately executed Spec
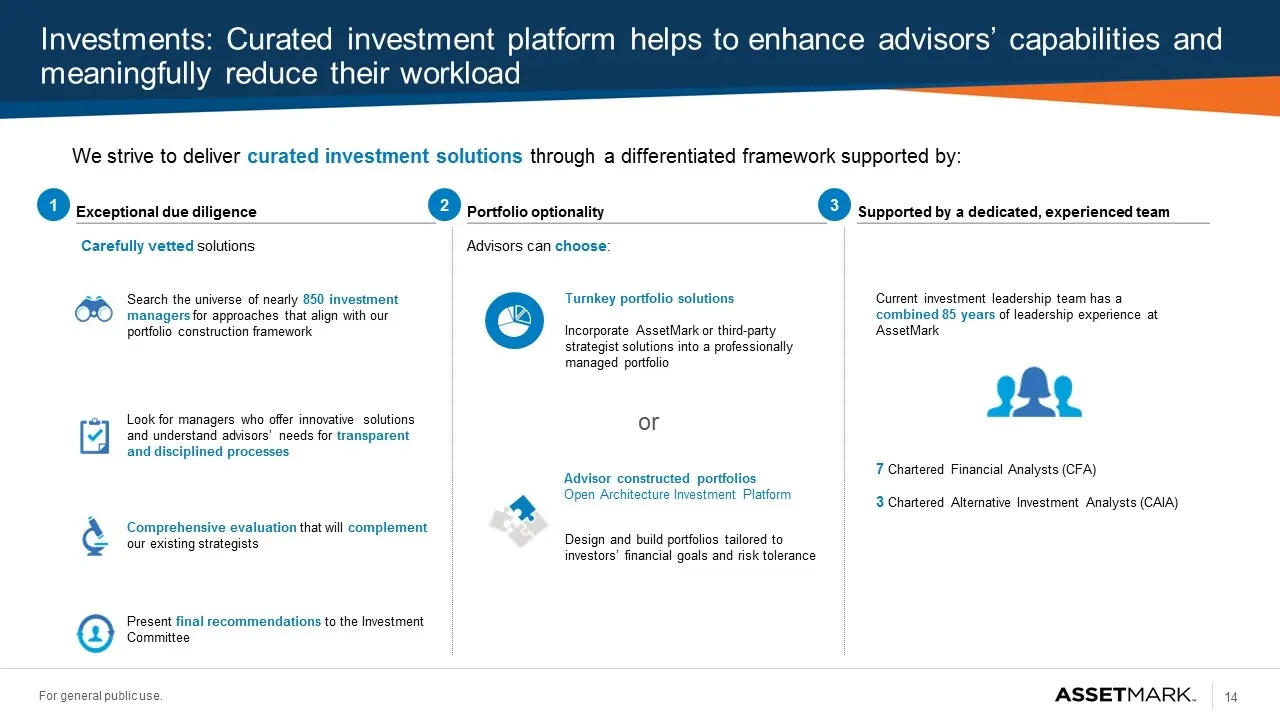
Slide 14: Investments: Curated investment platform helps to enhance advisors' capabilities
Investments: Curated investment platform helps to enhance advisors’ capabilities and meaningfully reduce their workload Exceptional due diligence Portfolio optionality Supported by a dedicated, experienced team Carefully vetted solutions Current investment leadership team has a combined 85 years of
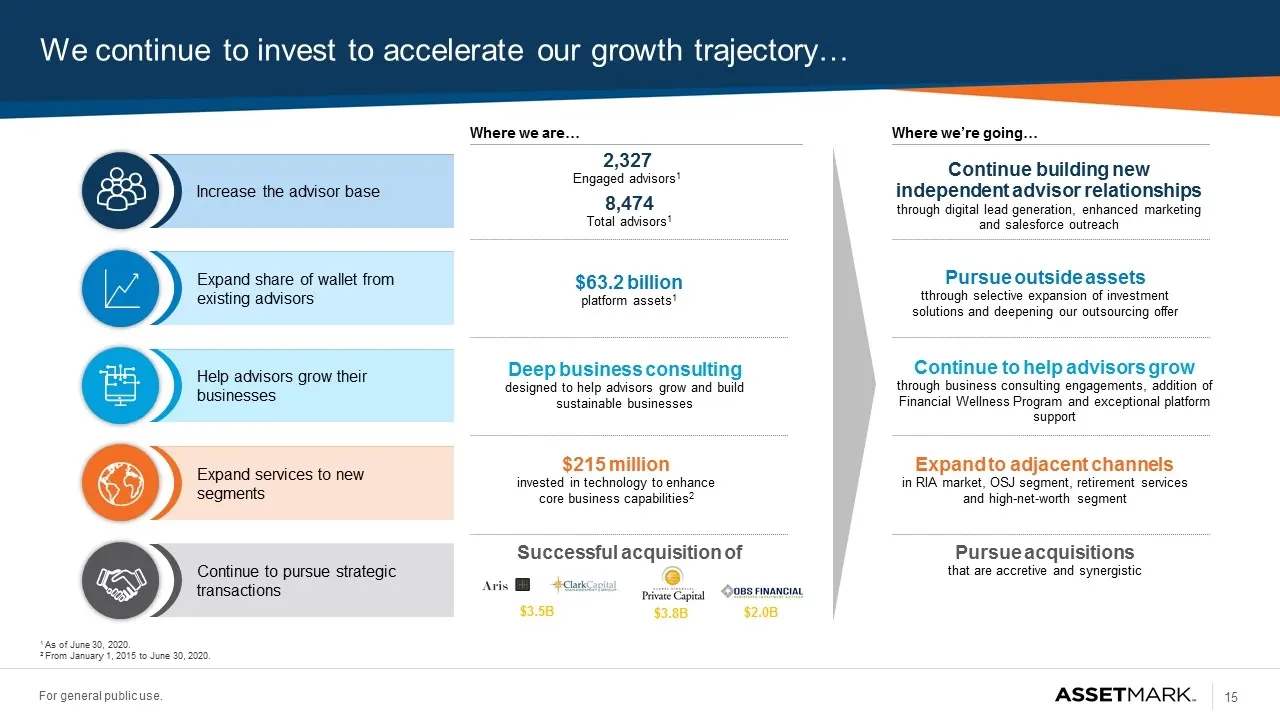
Slide 15: We continue to invest to accelerate our growth trajectory
We continue to invest to accelerate our growth trajectory… 1 As of June 30, 2020. 2 From January 1, 2015 to June 30, 2020. Expand services to new segments Help advisors grow their businesses Expand share of wallet from existing advisors Increase the advisor base Where we are… Where we’re going… 8,47
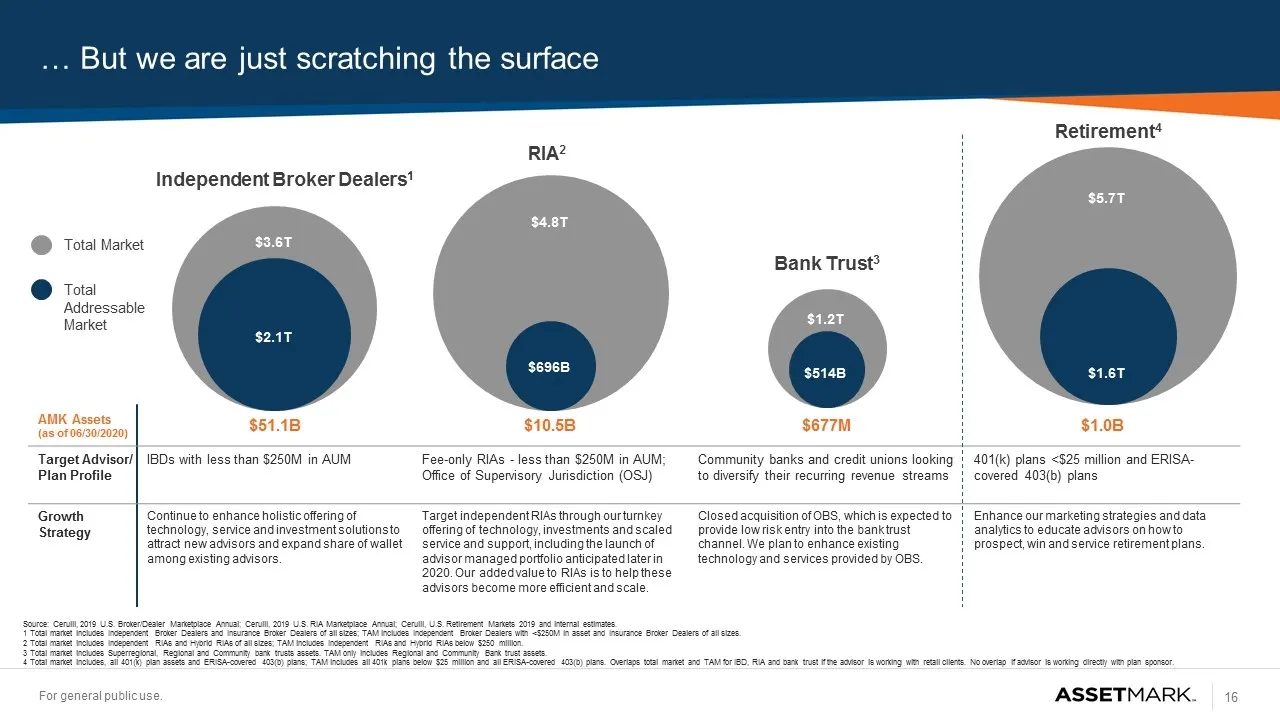
Slide 16: Target advisor segments and growth strategy
$5.7T $1.6T $4.8T $696B AMK Assets (as of 06/30/2020) $51.1B $10.5B $677M $1.0B Target Advisor/ Plan Profile IBDs with less than $250M in AUM Fee-only RIAs - less than $250M in AUM; Office of Supervisory Jurisdiction (OSJ) Community banks and credit unions looking to diversify their recurring revenu
Slide 17: Strong, dedicated management team with extensive industry experience
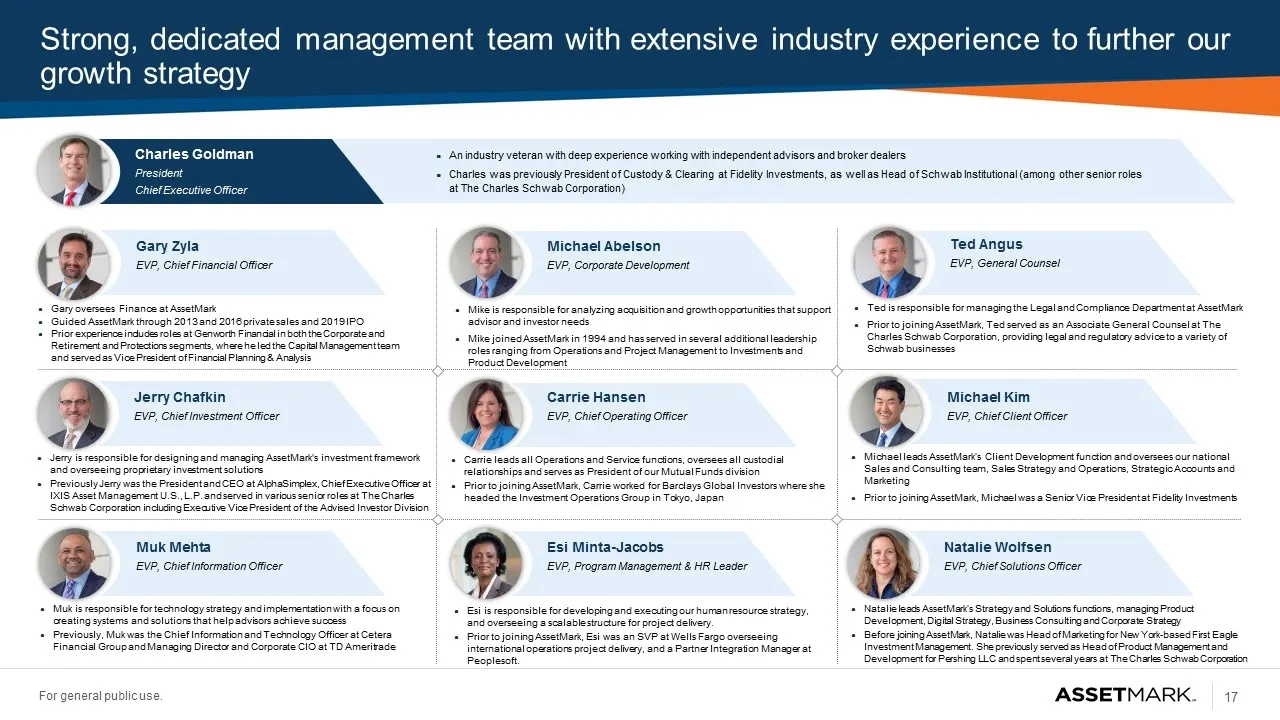
Charles Goldman President Chief Executive Officer Strong, dedicated management team with extensive industry experience to further our growth strategy Gary oversees Finance at AssetMark Guided AssetMark through 2013 and 2016 private sales and 2019 IPO Prior experience includes roles at Genworth Finan
Slide 18: Contents
Contents Opportunity Highlights Market Overview Company Overview Financial Overview Appendix
Slide 19: AssetMark is in a position of financial strength
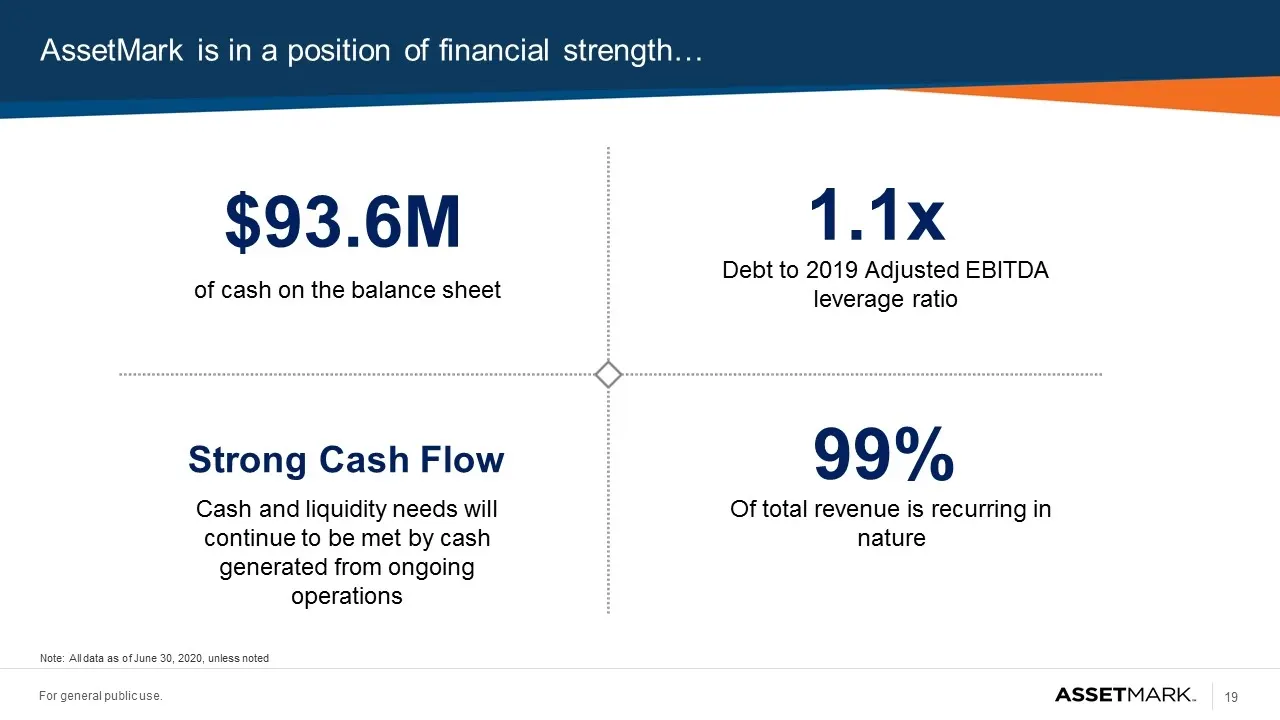
AssetMark is in a position of financial strength… Note: All data as of June 30, 2020, unless noted $93.6M of cash on the balance sheet 1.1x Debt to 2019 Adjusted EBITDA leverage ratio 99% Of total revenue is recurring in nature Strong Cash Flow Cash and liquidity needs will continue to be met by cas
Slide 20: ... and continues to grow, despite challenging times
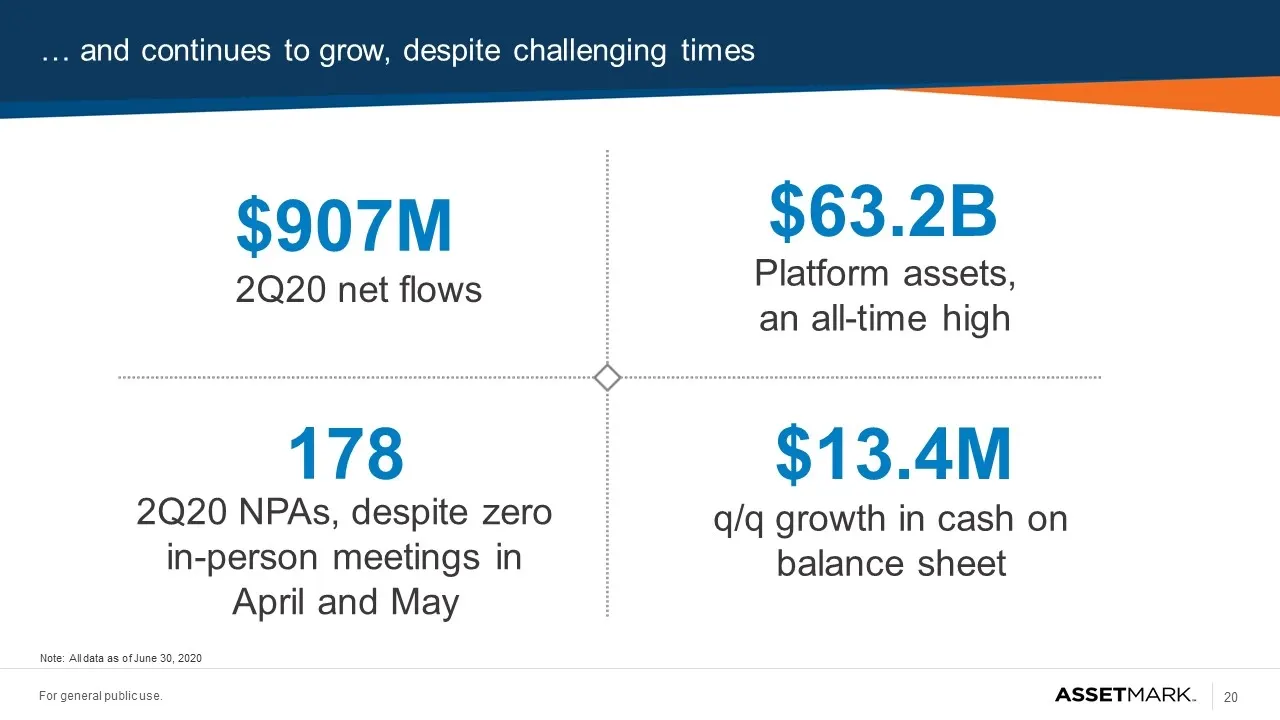
… and continues to grow, despite challenging times $907M 2Q20 net flows $63.2B Platform assets, an all-time high $13.4M q/q growth in cash on balance sheet 178 2Q20 NPAs, despite zero in-person meetings in April and May Note: All data as of June 30, 2020
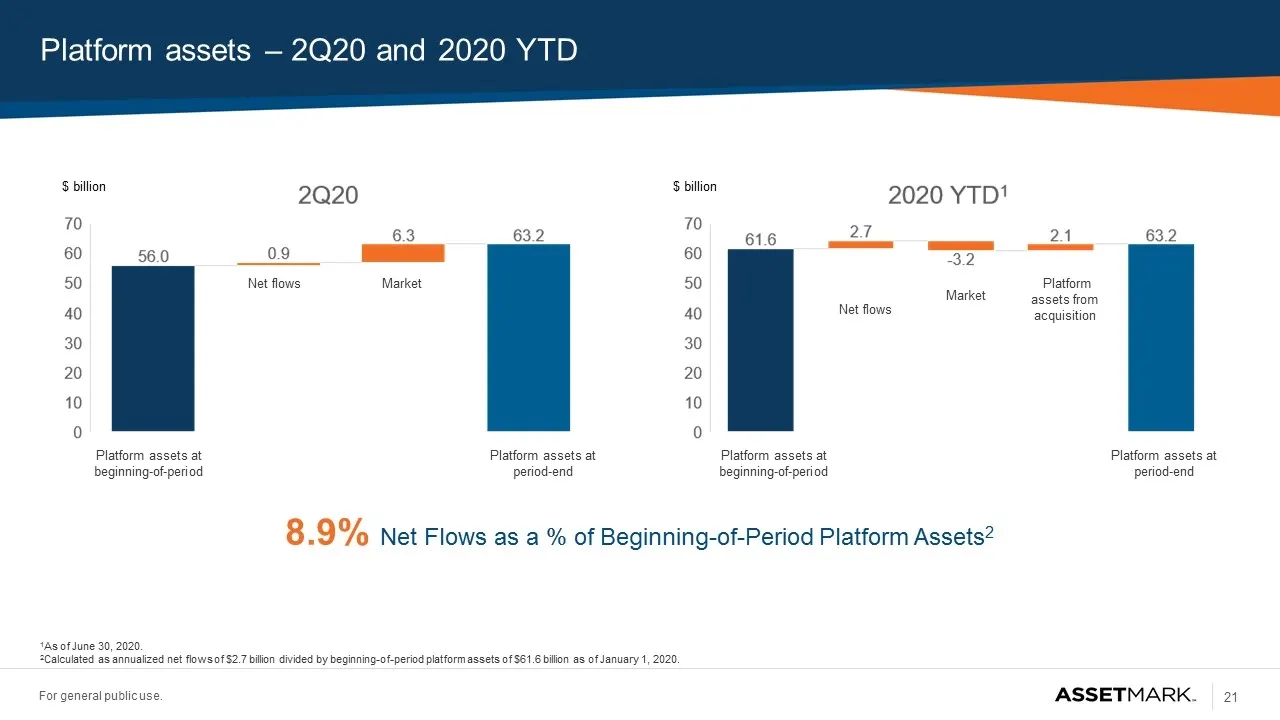
Slide 21: Platform assets – 2Q20 and 2020 YTD
Platform assets – 2Q20 and 2020 YTD $ billion 8.9% Net Flows as a % of Beginning-of-Period Platform Assets2 $ billion Platform assets at beginning-of-period Net flows Market Platform assets at period-end Platform assets at beginning-of-period Net flows Market Platform assets from acquisition Platfor
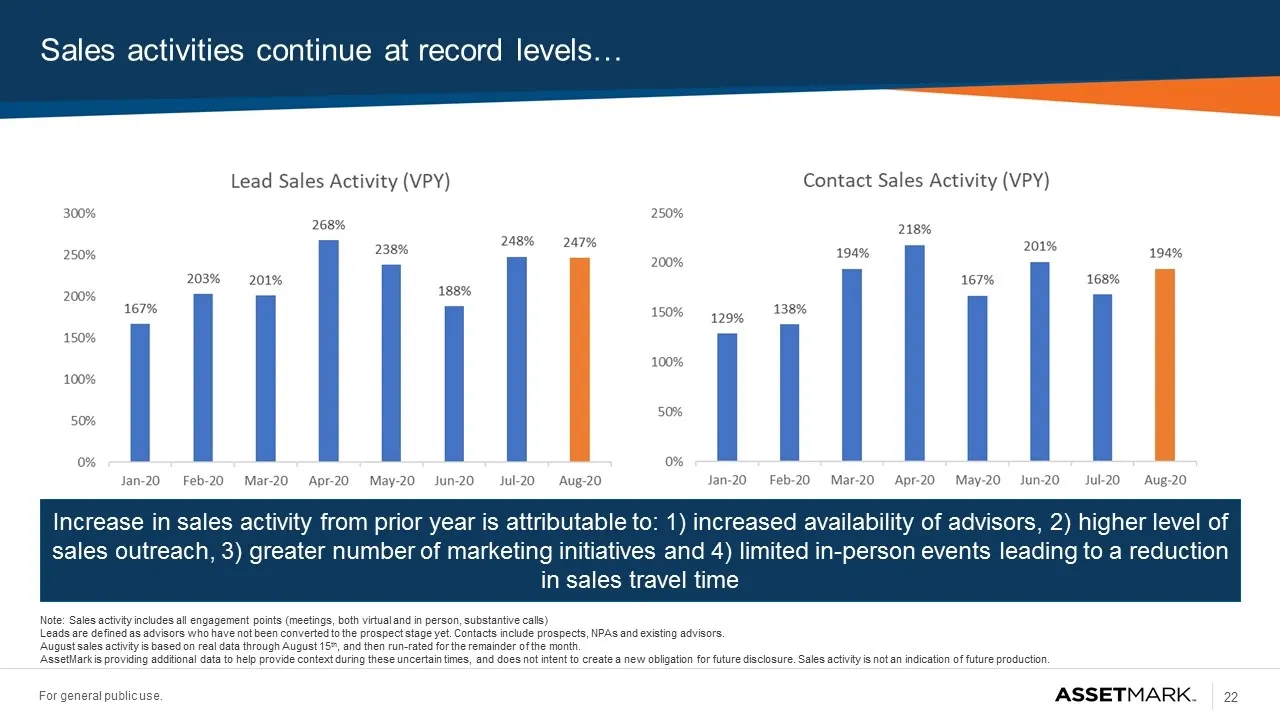
Slide 22: Sales activities continue at record levels
Sales activities continue at record levels… Increase in sales activity from prior year is attributable to: 1) increased availability of advisors, 2) higher level of sales outreach, 3) greater number of marketing initiatives and 4) limited in-person events leading to a reduction in sales travel time
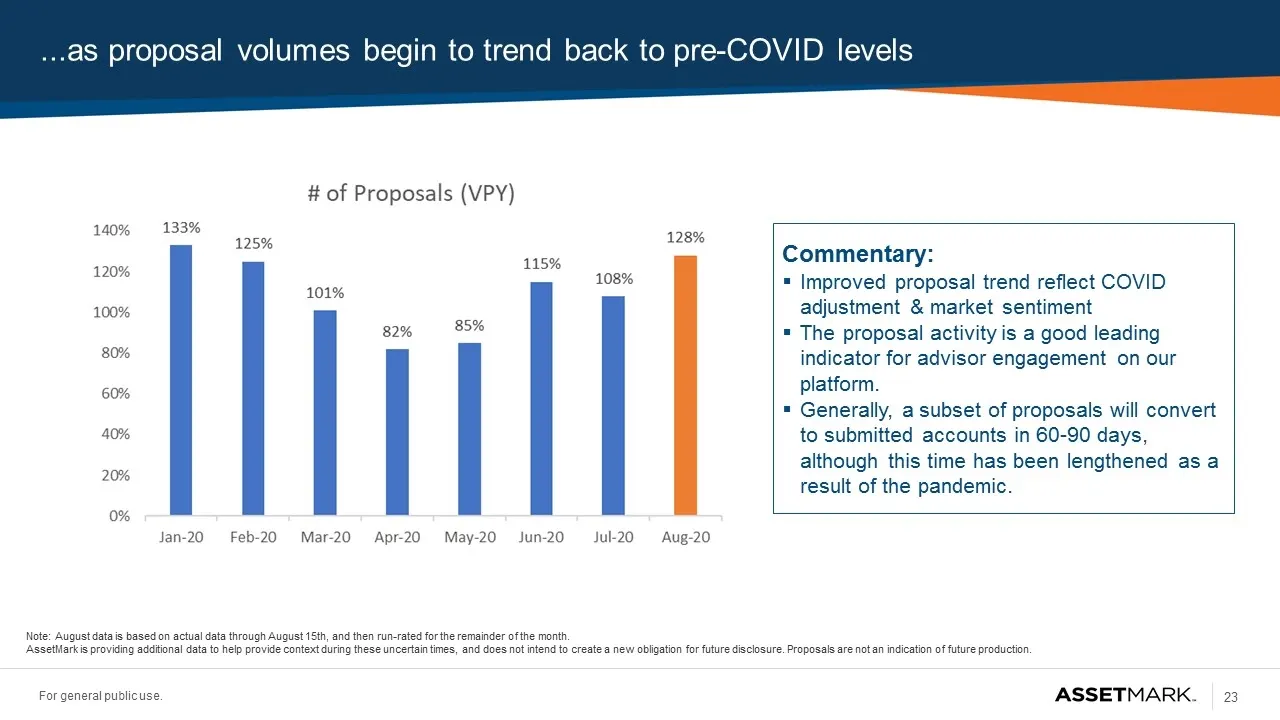
Slide 23: Commentary: Improved proposal trend reflect COVID adjustment & market sentiment
Commentary: Improved proposal trend reflect COVID adjustment & market sentiment The proposal activity is a good leading indicator for advisor engagement on our platform. Generally, a subset of proposals will convert to submitted accounts in 60-90 days, although this time has been lengthened as a res
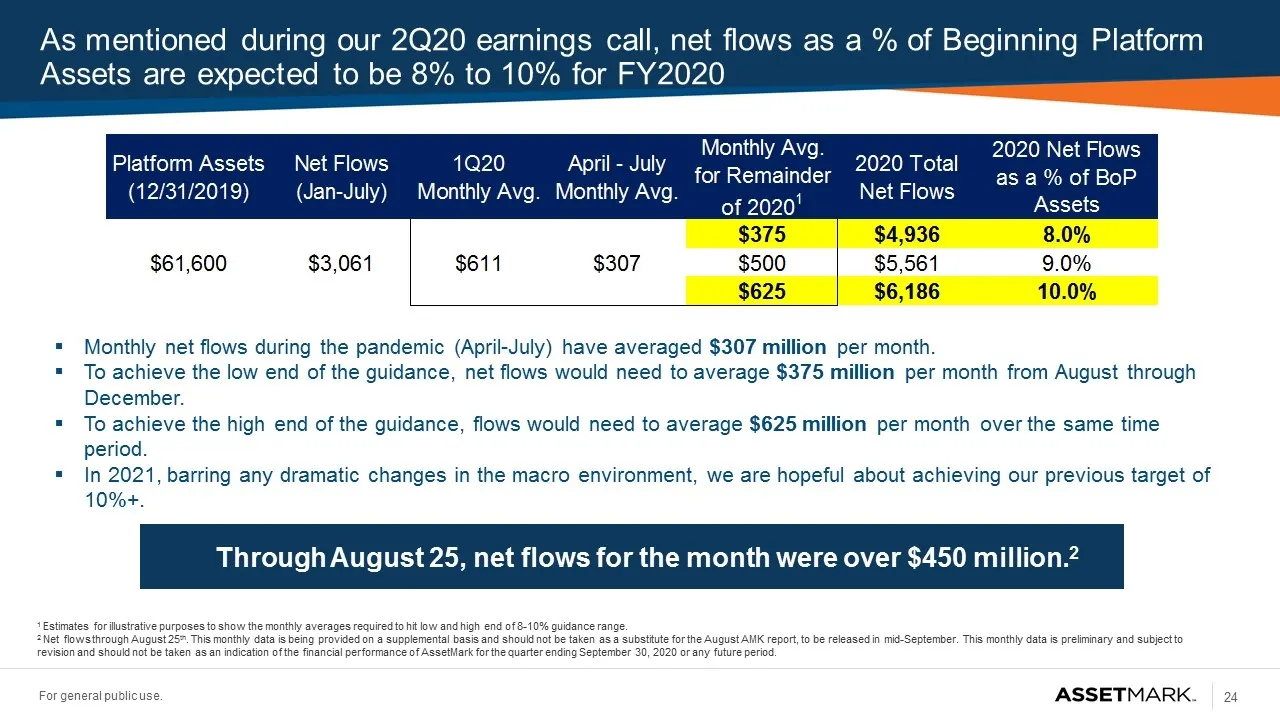
Slide 24: Net flows as a % of beginning platform assets expected 8% to 10% for FY2020
As mentioned during our 2Q20 earnings call, net flows as a % of Beginning Platform Assets are expected to be 8% to 10% for FY2020 Monthly net flows during the pandemic (April-July) have averaged $307 million per month. To achieve the low end of the guidance, net flows would need to average $375 mill
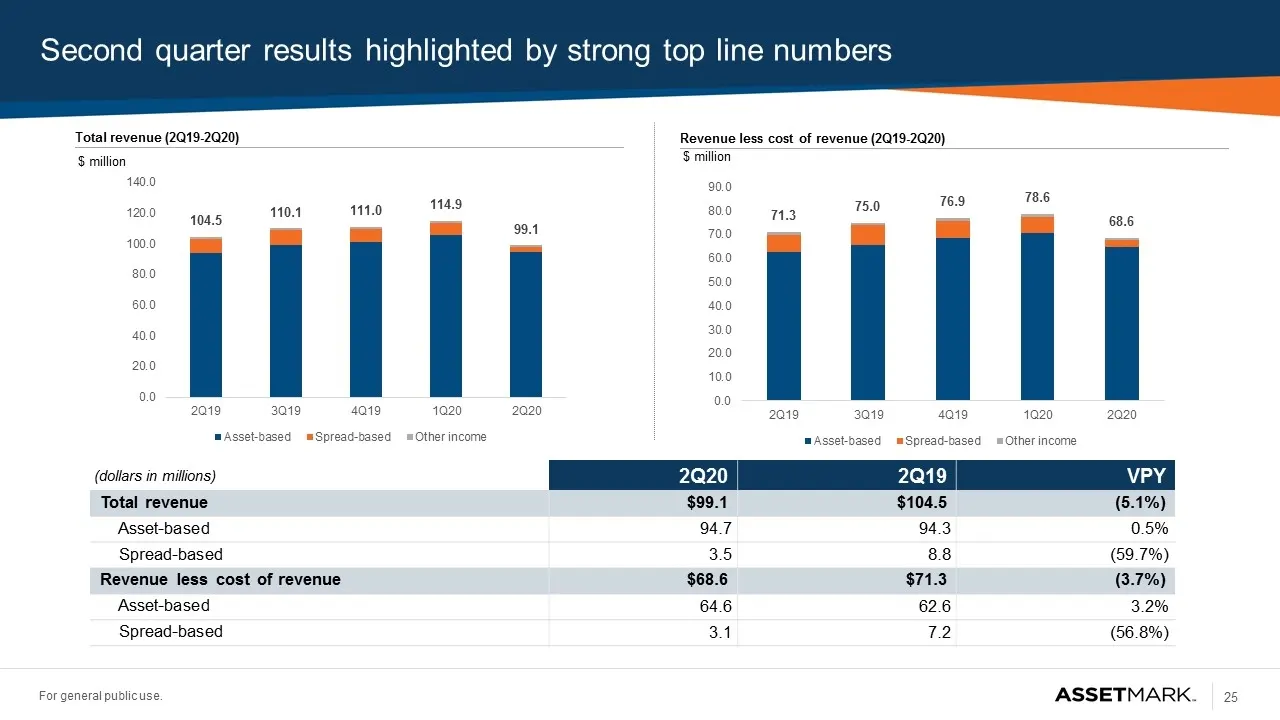
Slide 25: Second quarter results highlighted by strong top line numbers
Second quarter results highlighted by strong top line numbers (dollars in millions) 2Q20 2Q19 VPY Total revenue $99.1 $104.5 (5.1%) Asset-based 94.7 94.3 0.5% Spread-based 3.5 8.8 (59.7%) Revenue less cost of revenue $68.6 $71.3 (3.7%) Asset-based 64.6 62.6 3.2% Spread-based 3.1 7.2 (56.8%) Total re
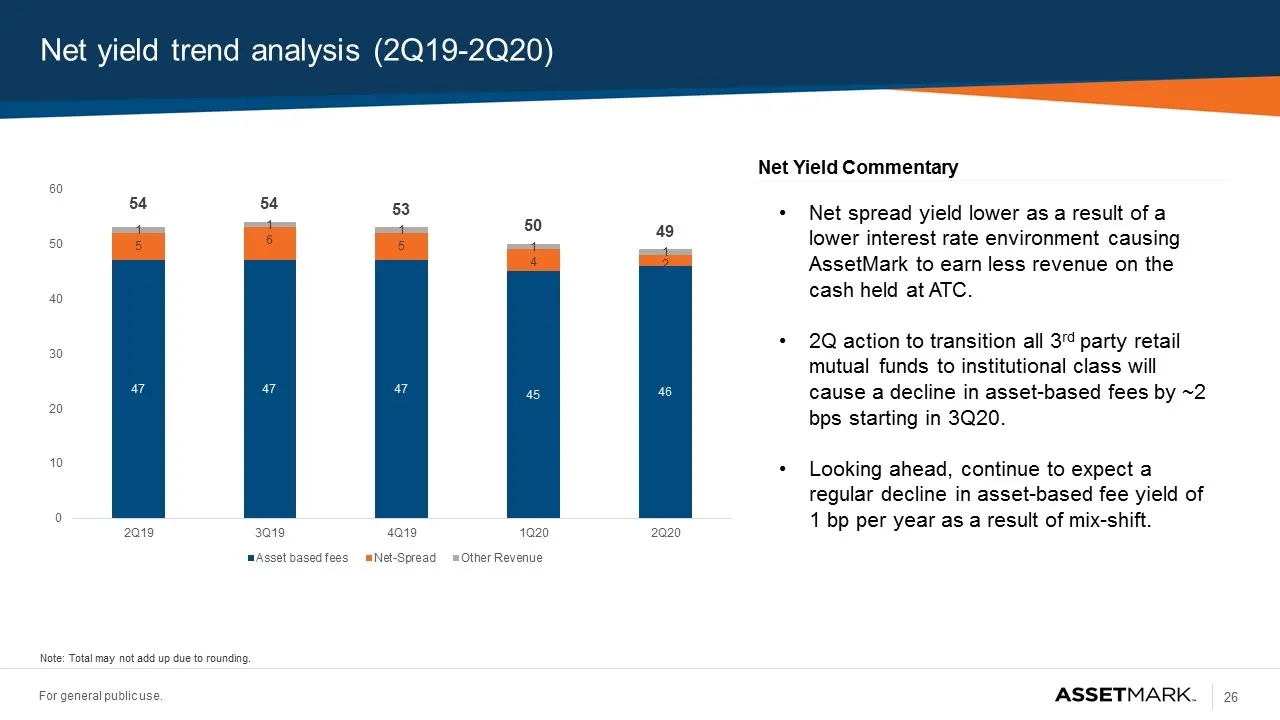
Slide 26: Net yield trend analysis (2Q19-2Q20)
Net yield trend analysis (2Q19-2Q20) Net Yield Commentary Net spread yield lower as a result of a lower interest rate environment causing AssetMark to earn less revenue on the cash held at ATC. 2Q action to transition all 3rd party retail mutual funds to institutional class will cause a decline in a
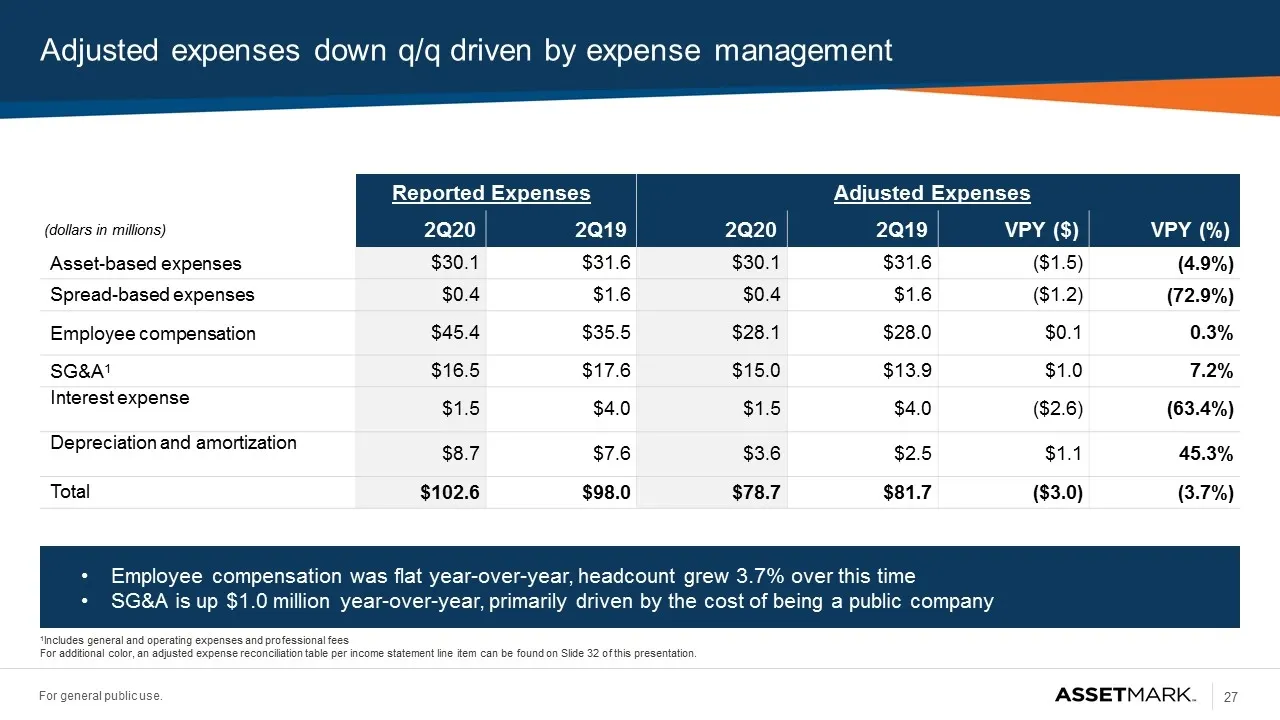
Slide 27: Adjusted expenses down q/q driven by expense management
Adjusted expenses down q/q driven by expense management Reported Expenses Adjusted Expenses (dollars in millions) 2Q20 2Q19 2Q20 2Q19 VPY ($) VPY (%) Asset-based expenses $30.1 $31.6 $30.1 $31.6 ($1.5) (4.9%) Spread-based expenses $0.4 $1.6 $0.4 $1.6 ($1.2) (72.9%) Employee compensation $45.4 $35.5
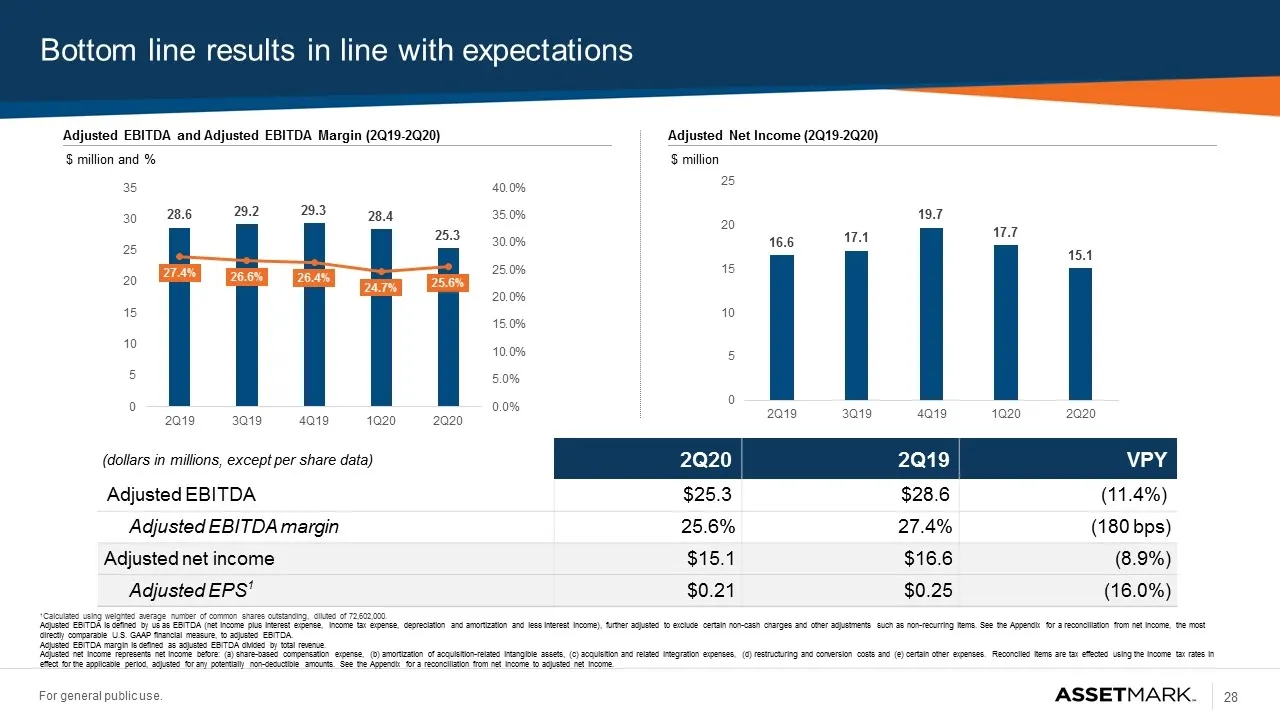
Slide 28: Bottom line results in line with expectations
Bottom line results in line with expectations (dollars in millions, except per share data) 2Q20 2Q19 VPY Adjusted EBITDA $25.3 $28.6 (11.4%) Adjusted EBITDA margin 25.6% 27.4% (180 bps) Adjusted net income $15.1 $16.6 (8.9%) Adjusted EPS1 $0.21 $0.25 (16.0%) 1Calculated using weighted average number
Slide 29: Outlook for the remainder of 2020
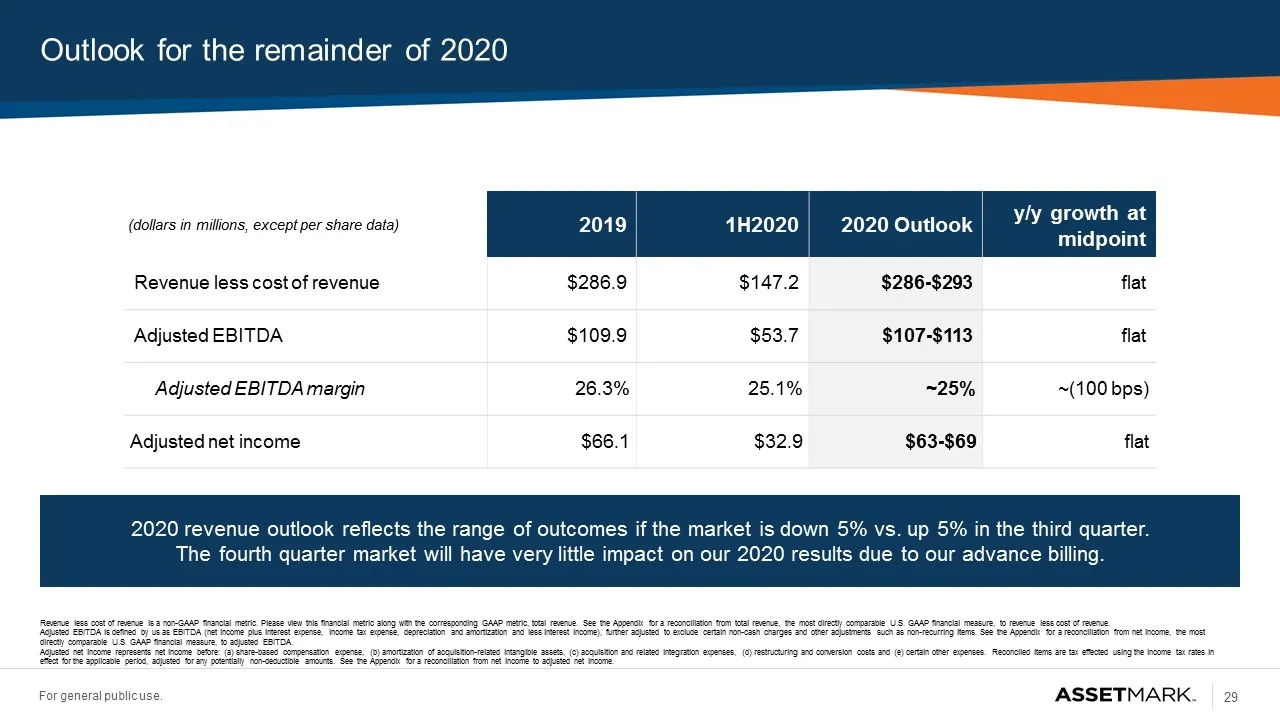
Outlook for the remainder of 2020 (dollars in millions, except per share data) 2019 1H2020 2020 Outlook y/y growth at midpoint Revenue less cost of revenue $286.9 $147.2 $286-$293 flat Adjusted EBITDA $109.9 $53.7 $107-$113 flat Adjusted EBITDA margin 26.3% 25.1% ~25% ~(100 bps) Adjusted net income
Slide 30: Contents
Contents Opportunity Highlights Market Overview Company Overview Financial Overview Appendix
Slide 31: 2Q20 net yield calculation
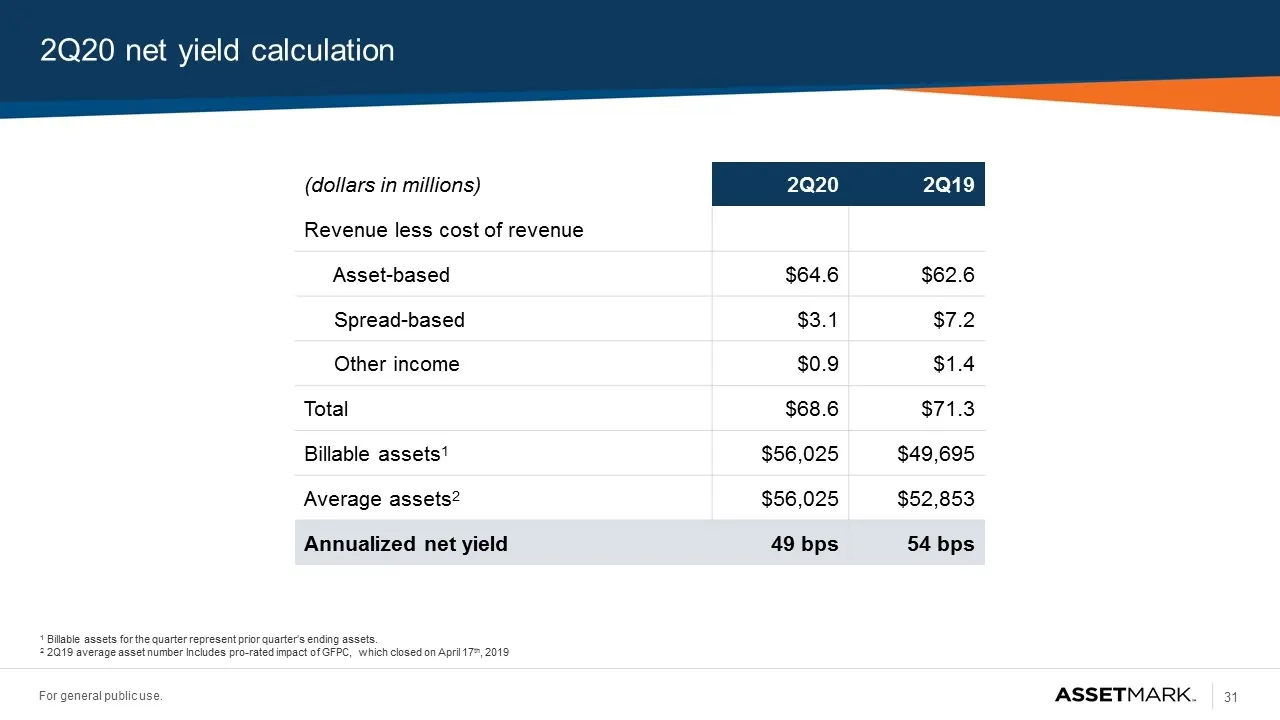
2Q20 net yield calculation 1 Billable assets for the quarter represent prior quarter’s ending assets. 2 2Q19 average asset number Includes pro-rated impact of GFPC, which closed on April 17th, 2019 (dollars in millions) 2Q20 2Q19 Revenue less cost of revenue Asset-based $64.6 $62.6 Spread-based $3.1
Slide 32: Adjusted expense reconciliation
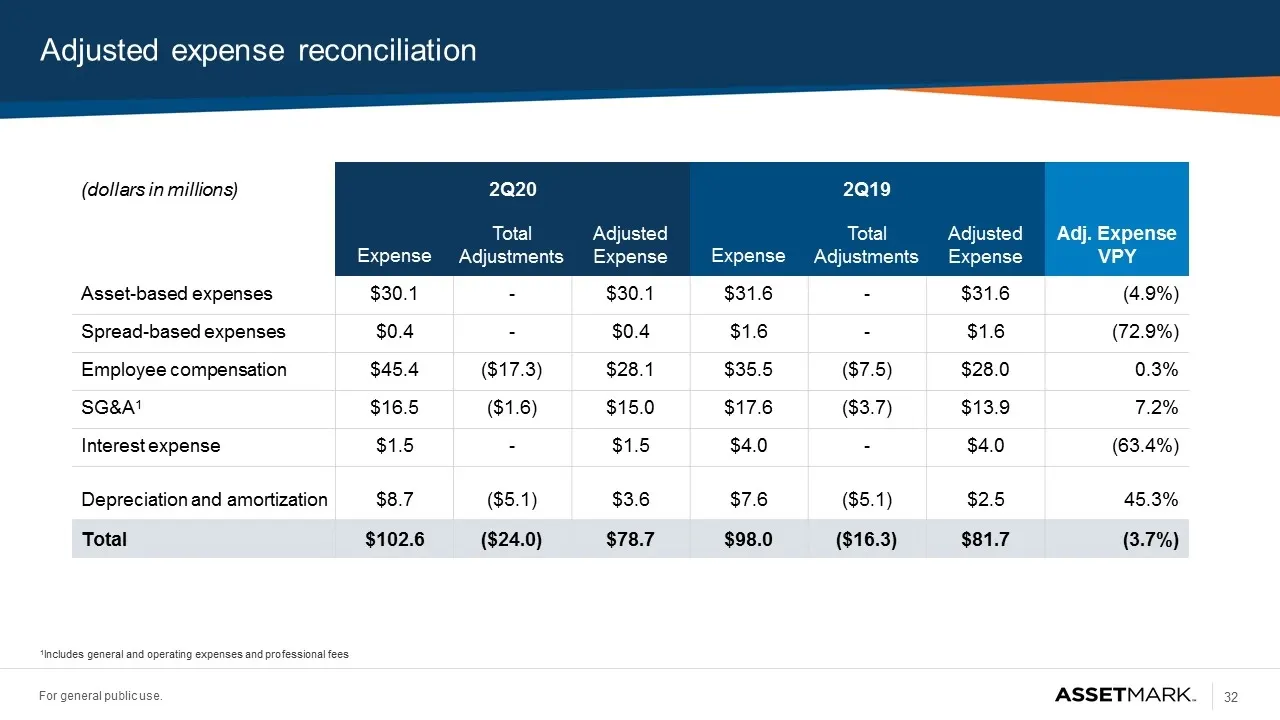
Adjusted expense reconciliation (dollars in millions) 2Q20 2Q19 Adj. Expense VPY Expense Total Adjustments Adjusted Expense Expense Total Adjustments Adjusted Expense Asset-based expenses $30.1 - $30.1 $31.6 - $31.6 (4.9%) Spread-based expenses $0.4 - $0.4 $1.6 - $1.6 (72.9%) Employee compensation $
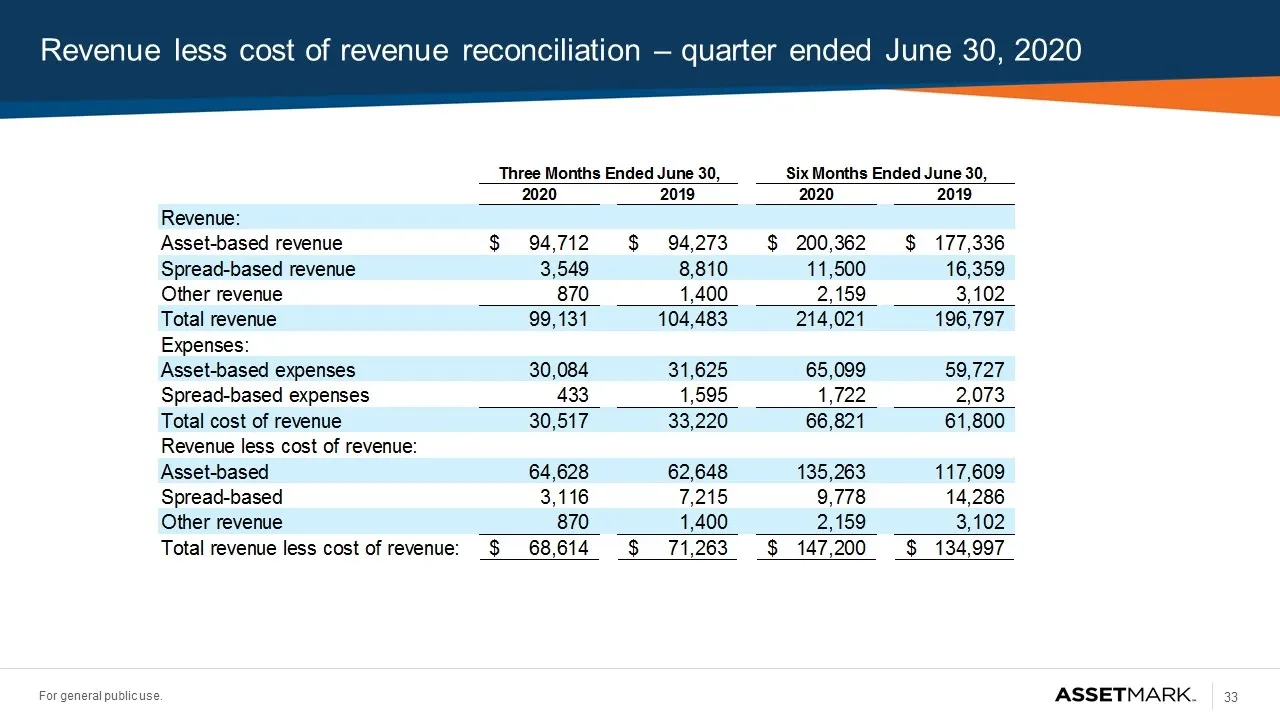
Slide 33: Revenue less cost of revenue reconciliation – quarter ended June 30, 2020
Revenue less cost of revenue reconciliation – quarter ended June 30, 2020 Three Months ended June 30 2020 2019 Six months Ended June 30 2020 2019 Revenue:Asset-based revenue 94,712$ 94,273$ 200,362$ 177,336$ Spread-based revenue 3,549 8,810 11,500 16,359 Other revenue 870 1,400 2,159 3,102 Total rev
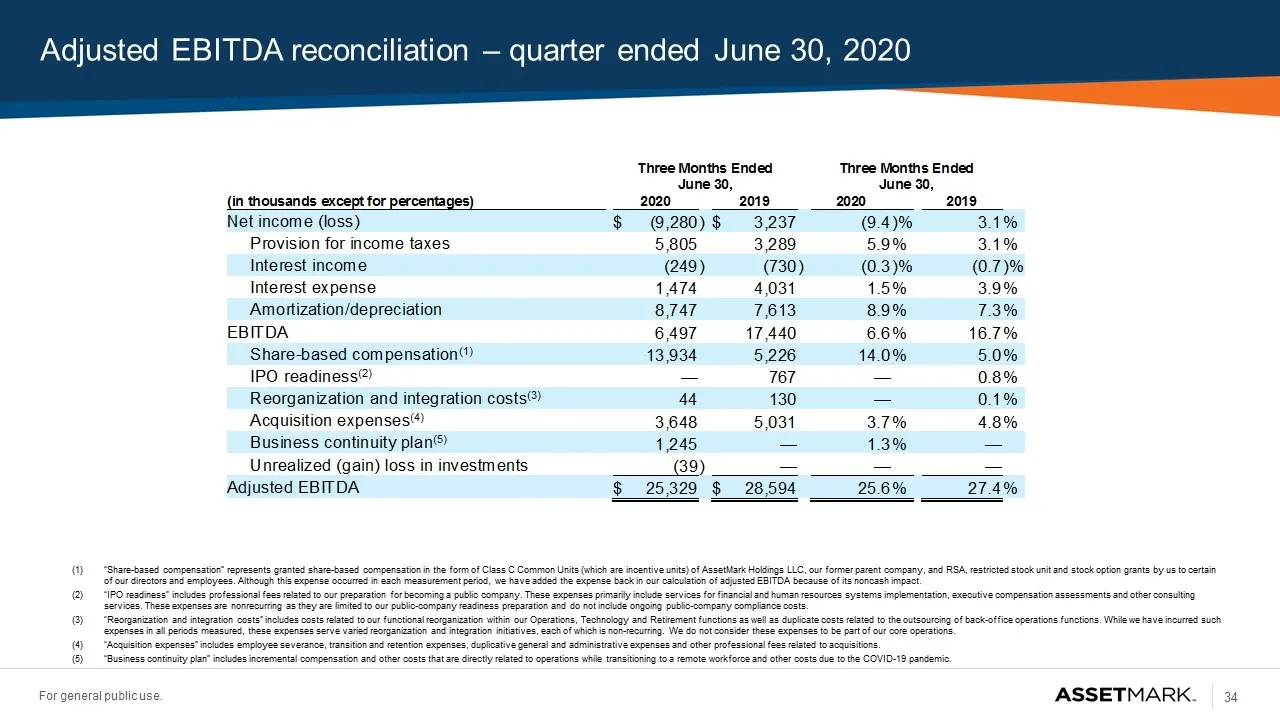
Slide 34: Adjusted EBITDA reconciliation – quarter ended June 30, 2020
Adjusted EBITDA reconciliation – quarter ended June 30, 2020 (1)“Share-based compensation” represents granted share-based compensation in the form of Class C Common Units (which are incentive units) of AssetMark Holdings LLC, our former parent company, and RSA, restricted stock unit and stock option
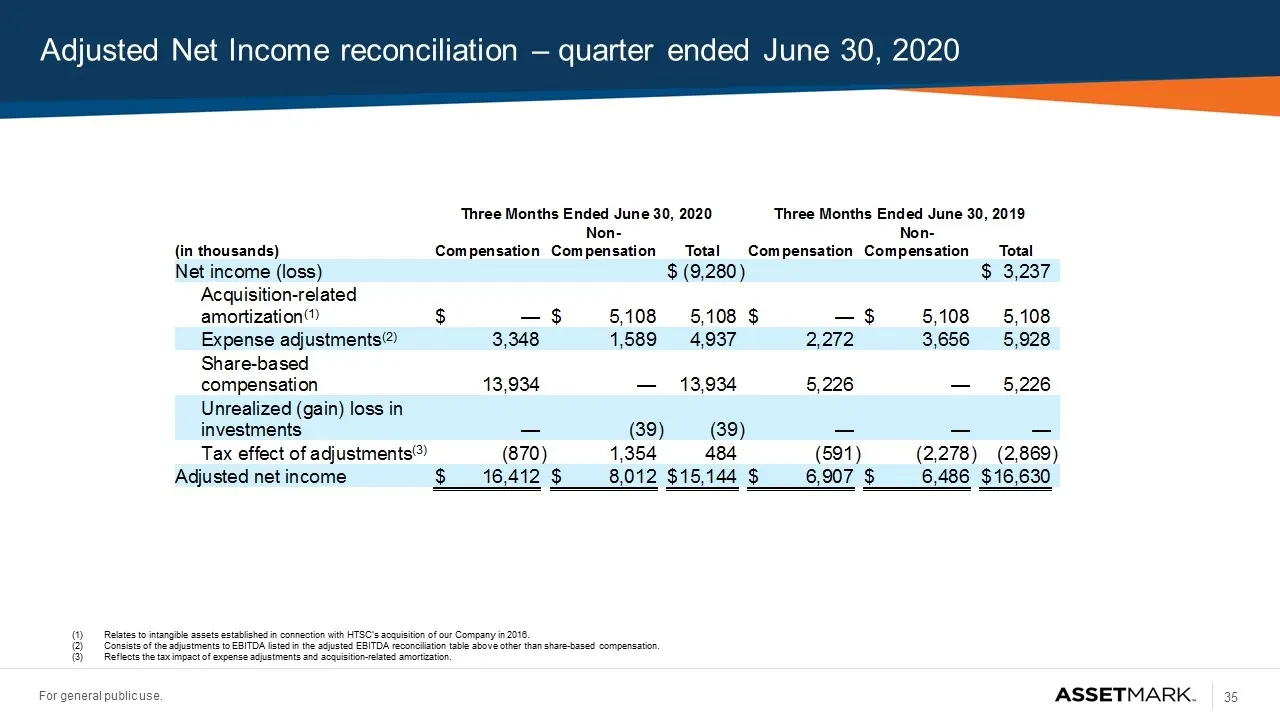
Slide 35: Adjusted Net Income reconciliation – quarter ended June 30, 2020
Adjusted Net Income reconciliation – quarter ended June 30, 2020 (1)Relates to intangible assets established in connection with HTSC’s acquisition of our Company in 2016. (2)Consists of the adjustments to EBITDA listed in the adjusted EBITDA reconciliation table above other than share-based compensa
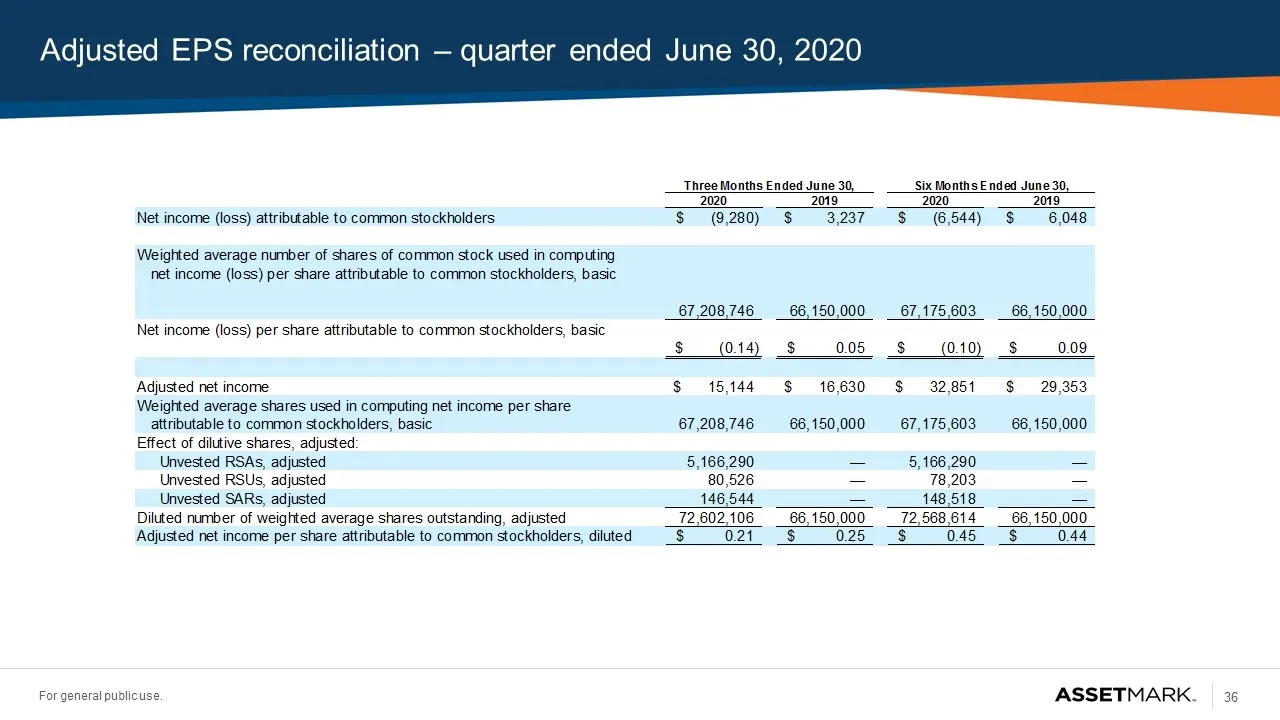
Slide 36: Adjusted EPS reconciliation – quarter ended June 30, 2020
Adjusted EPS reconciliation – quarter ended June 30, 2020 Three months ended June 30, 2020 2019 Six months ended June 30, 2020 2019 Net income (loss) attributable to common stockholders(9,280)$ 3,237$ (6,544)$ 6,048$ Weighted average number of shares of common stock used in computing net income (los
Source: SEC EDGAR · 8-K filed Aug 27, 2020
More decks from AssetMark Financial Holdings Inc
 Conference Presentation (April 2026)18 slides · April 2026
 EA Webinar (April 2026)15 slides · April 2026
 AssetMark GOLDFORUM 202626 slides · March 2026
 Investor Presentation (March 2026)26 slides · March 2026
 AssetMark Platinum Summit 20247 slides · 2024
 Investor Presentation (December 2023)31 slides · Dec 1, 2023