MainSource Financial Group Inc
MainSource Financial — Investor Presentation (February 2012)
31 slides from MainSource Financial's investor presentation, Feb 15, 2012

Slide 1: Meeting the financial needs of our customers...for life!
b 1 Meeting the financial needs of our customers...for life!
Slide 2: Disclosure Regarding Forward Looking Statements
We will achieve our vision by: Disclosure Regarding Forward Looking Statements This presentation may include forward-looking statements regarding, among other things, MainSource’s business strategy, financial position and prospects, dividend policy, business results, strategic initiatives, credit qu
Slide 3: Franchise Overview
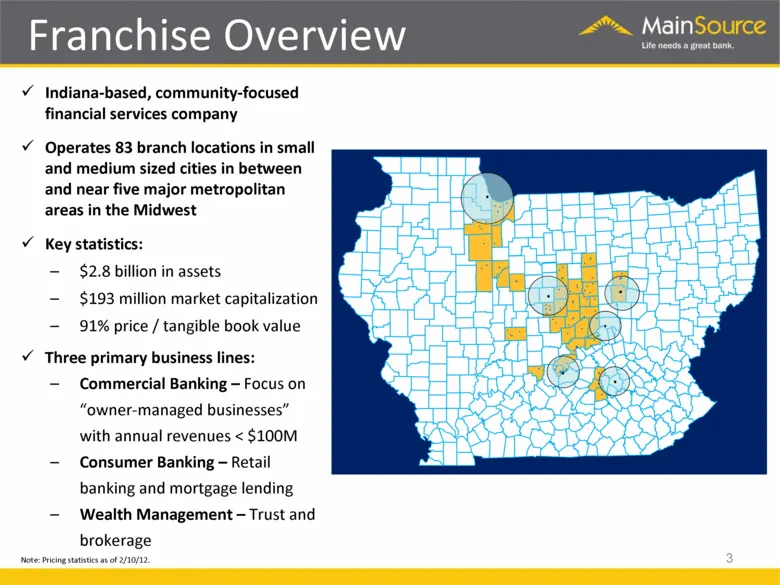
Indiana-based, community-focused financial services company Operates 83 branch locations in small and medium sized cities in between and near five major metropolitan areas in the Midwest Key statistics: $2.8 billion in assets $193 million market capitalization 91% price / tangible book value Three p
Slide 4: High Quality People
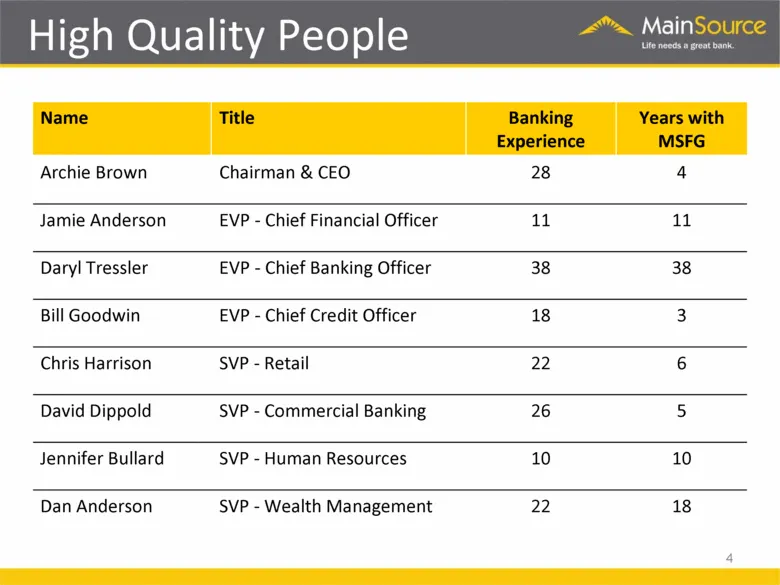
Name Title Banking Experience Years with MSFG Archie Brown Chairman & CEO 28 4 Jamie Anderson EVP - Chief Financial Officer 11 11 Daryl Tressler EVP - Chief Banking Officer 38 38 Bill Goodwin EVP - Chief Credit Officer 18 3 Chris Harrison SVP - Retail 22 6 David Dippold SVP - Commercial Banking 26 5
Slide 5: Core Strategy
Local leadership and involvement Drive growth in core checking accounts and checking related services Target mass market consumers and “owner-managed” businesses in our geographical footprint Expand core services to existing households Increase market share in existing and adjacent footprints Focus
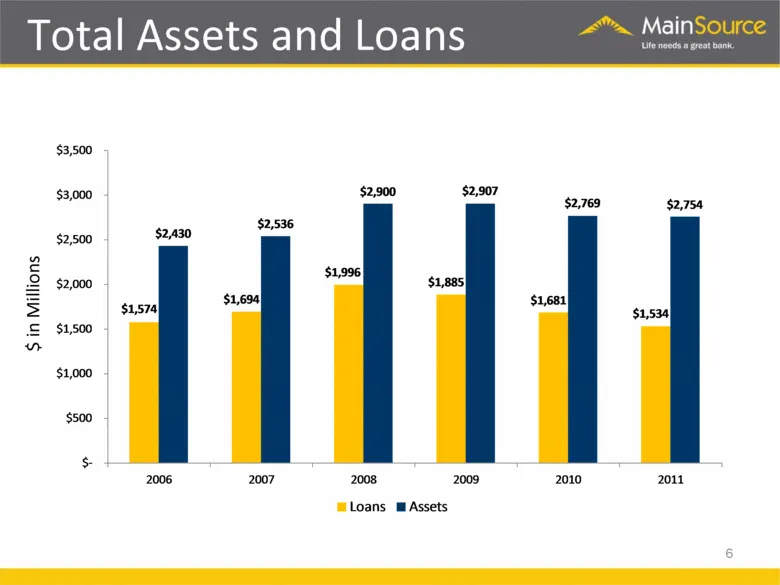
Slide 6: Total Assets and Loans
$ in Millions 6 Total Assets and Loans $1,574 $1,694 $1,996 $1,885 $1,681 $1,534 $2,430 $2,536 $2,900 $2,907 $2,769 $2,754 $- $500 $1,000 $1,500 $2,000 $2,500 $3,000 $3,500 2006 2007 2008 2009 2010 2011 Loans Assets
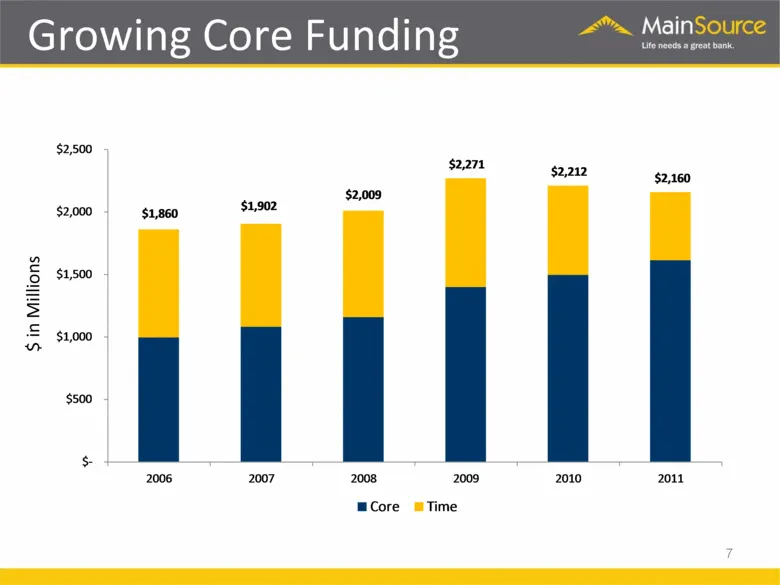
Slide 7: Growing Core Funding
$ in Millions 7 Growing Core Funding $1,860 $1,902 $2,009 $2,271 $2,212 $2,160 $- $500 $1,000 $1,500 $2,000 $2,500 2006 2007 2008 2009 2010 2011 Core Time
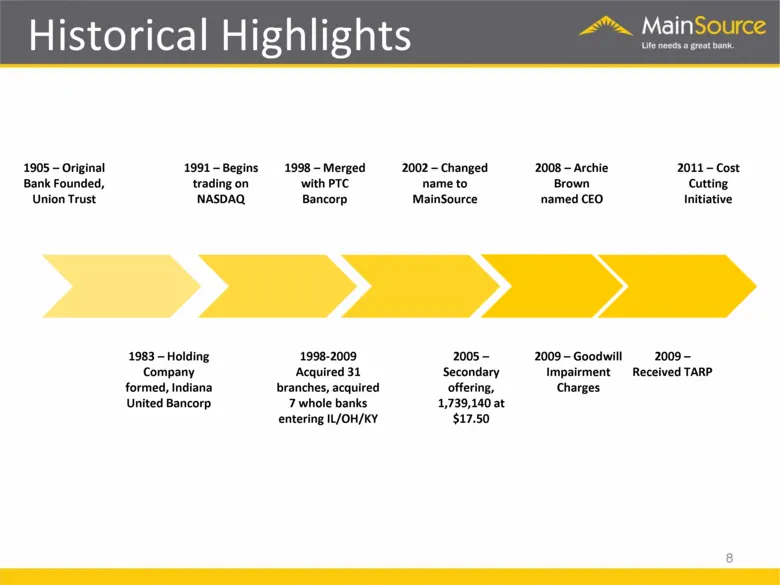
Slide 8: Historical Highlights
8 Historical Highlights 1905 – Original Bank Founded, Union Trust 1983 – Holding Company formed, Indiana United Bancorp 1991 – Begins trading on NASDAQ 1998 – Merged with PTC Bancorp 1998-2009 Acquired 31 branches, acquired 7 whole banks entering IL/OH/KY 2002 – Changed name to MainSource 2005 – Sec
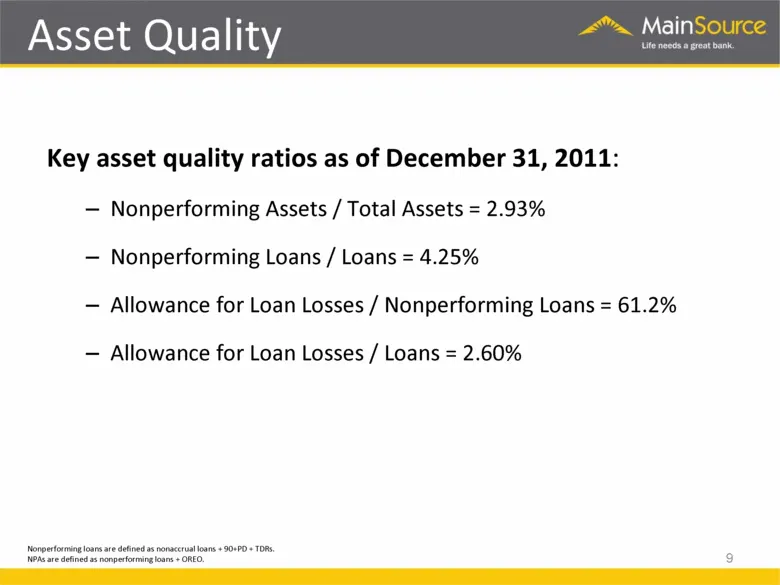
Slide 9: Asset Quality
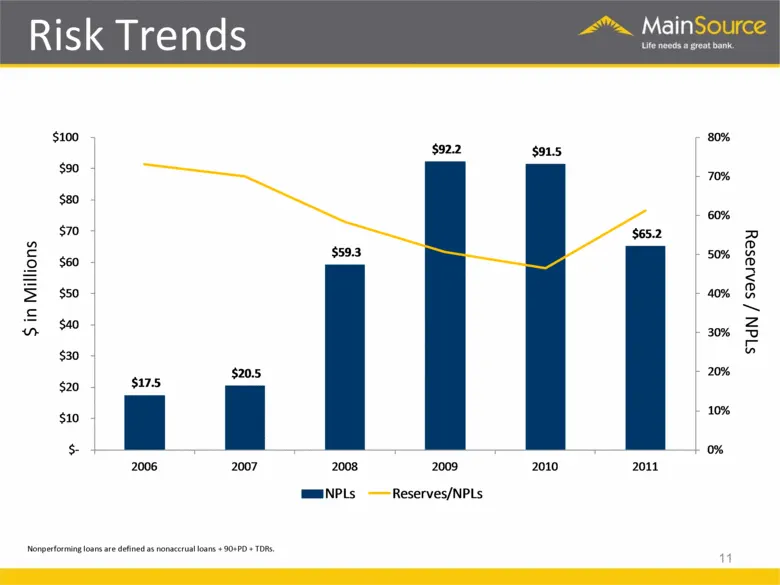
Key asset quality ratios as of December 31, 2011: Nonperforming Assets / Total Assets = 2.93% Nonperforming Loans / Loans = 4.25% Allowance for Loan Losses / Nonperforming Loans = 61.2% Allowance for Loan Losses / Loans = 2.60% Nonperforming loans are defined as nonaccrual loans + 90+PD + TDRs. NPAs
Slide 10: Loan Portfolio
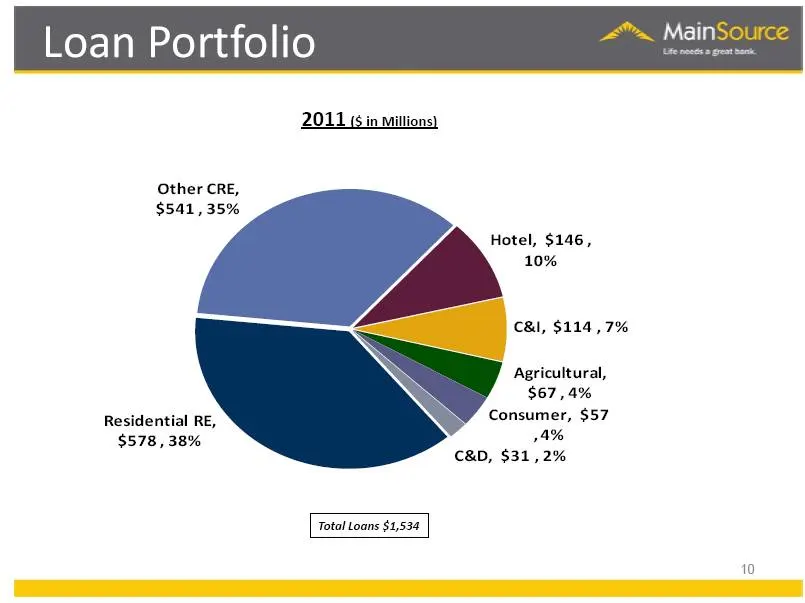
10 Loan Portfolio Total Loans $1,534 2011 ($ in Millions) Residential RE, $578 , 38% Other CRE, $541 , 35% Hotel, $146 , 10% C&I, $114 , 7% Agricultural, $67 , 4% Consumer, $57 , 4% C&D, $31 , 2%
Slide 11: Reserves / NPLs Risk Trends
$ in Millions 11 Reserves / NPLs Risk Trends Nonperforming loans are defined as nonaccrual loans + 90+PD + TDRs. $17.5 $20.5 $59.3 $92.2 $91.5 $65.2 0% 10% 20% 30% 40% 50% 60% 70% 80% $- $10 $20 $30 $40 $50 $60 $70 $80 $90 $100 2006 2007 2008 2009 2010 2011 NPLs Reserves/NPLs
Slide 12: New Non-Accrual Loans
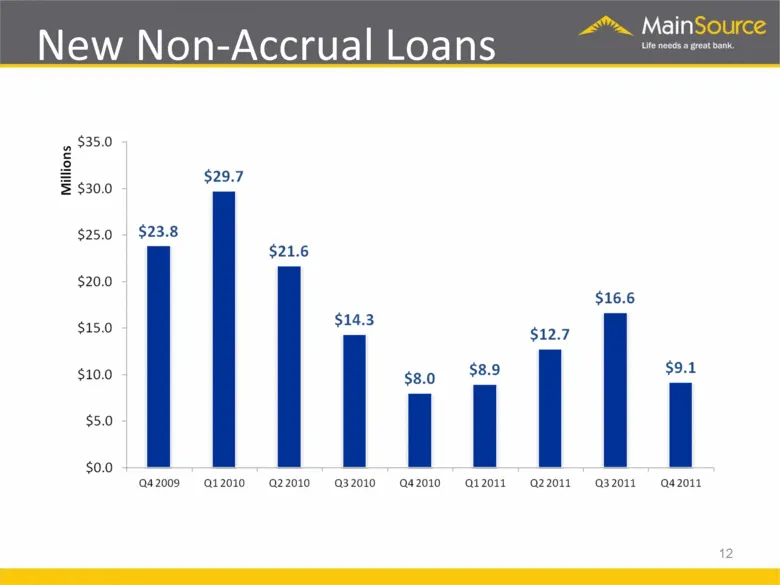
New Non-Accrual Loans 12 Millions $35.0 $30.0 $25.0 $15.0 $10.0 $5.0 $0.0 $23.8 $29.7 $21.6 $14.3 $8.0 $8.9 $12.7 $16.6 $9.1 Q4 2009 Q1 2010 Q2 2010 Q3 2010 Q4 2010 Q1 2011 Q2 2011 Q3 2011 Q4 2011
Slide 13: Net Charge-Offs by Type
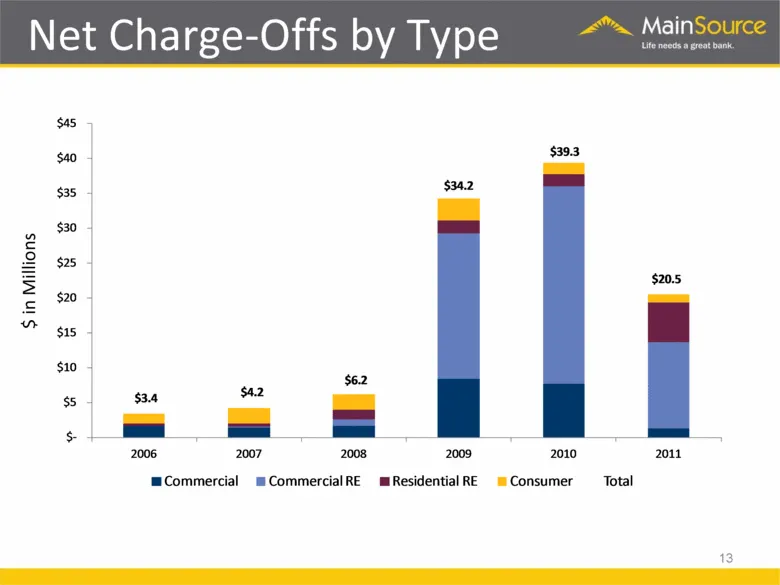
$ in Millions 13 Net Charge-Offs by Type $3.4 $4.2 $6.2 $34.2 $39.3 $20.5 $- $5 $10 $15 $20 $25 $30 $35 $40 $45 2006 2007 2008 2009 2010 2011 Commercial Commercial RE Residential RE Consumer Total
Slide 14: Provision & Net Charge-Offs
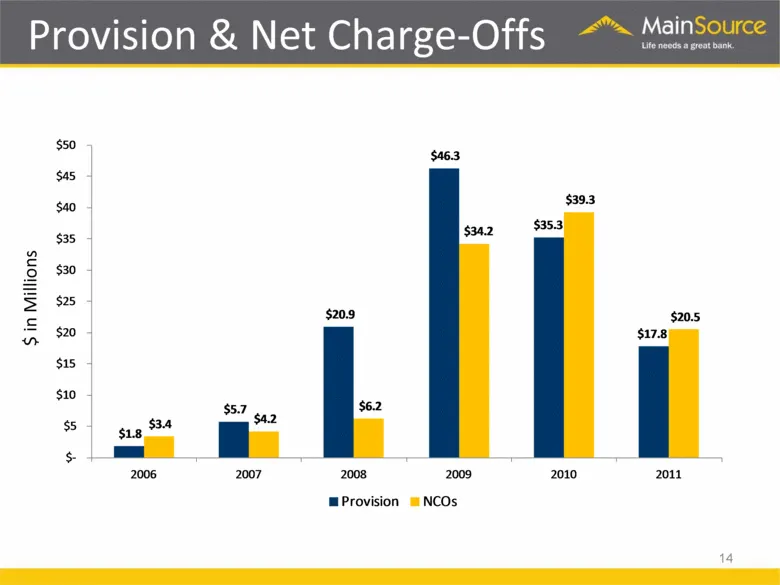
$ in Millions 14 Provision & Net Charge-Offs $1.8 $5.7 $20.9 $46.3 $35.3 $17.8 $3.4 $4.2 $6.2 $34.2 $39.3 $20.5 $- $5 $10 $15 $20 $25 $30 $35 $40 $45 $50 2006 2007 2008 2009 2010 2011 Provision NCOs
Slide 15: Credit Process
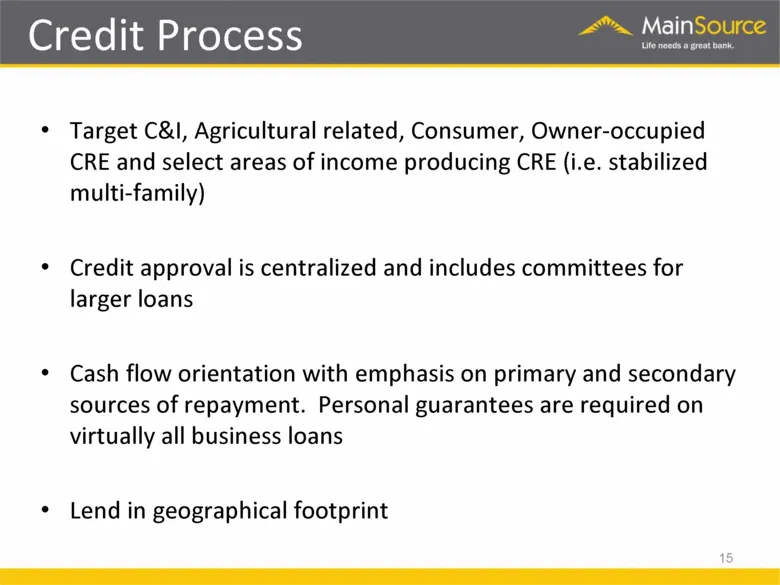
Target C&I, Agricultural related, Consumer, Owner-occupied CRE and select areas of income producing CRE (i.e. stabilized multi-family) Credit approval is centralized and includes committees for larger loans Cash flow orientation with emphasis on primary and secondary sources of repayment. Personal g
Slide 16: Credit culture overhaul since 2008
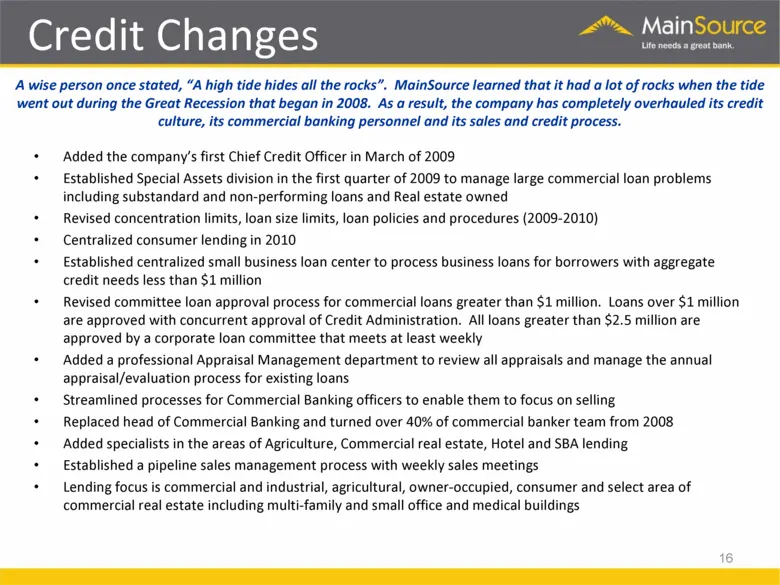
A wise person once stated, “A high tide hides all the rocks”. MainSource learned that it had a lot of rocks when the tide went out during the Great Recession that began in 2008. As a result, the company has completely overhauled its credit culture, its commercial banking personnel and its sales and
Slide 17: Adversely Classified Assets
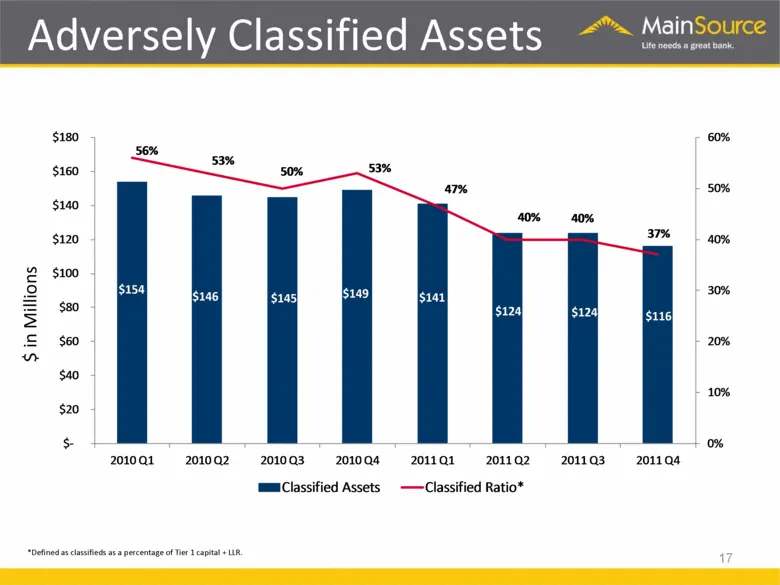
*Defined as classifieds as a percentage of Tier 1 capital + LLR. $ in Millions 17 Adversely Classified Assets $154 $146 $145 $149 $141 $124 $124 $116 56% 53% 50% 53% 47% 40% 40% 37% 0% 10% 20% 30% 40% 50% 60% $- $20 $40 $60 $80 $100 $120 $140 $160 $180 2010 Q1 2010 Q2 2010 Q3 2010 Q4 2011 Q1 2011 Q2
Slide 18: Core Earnings
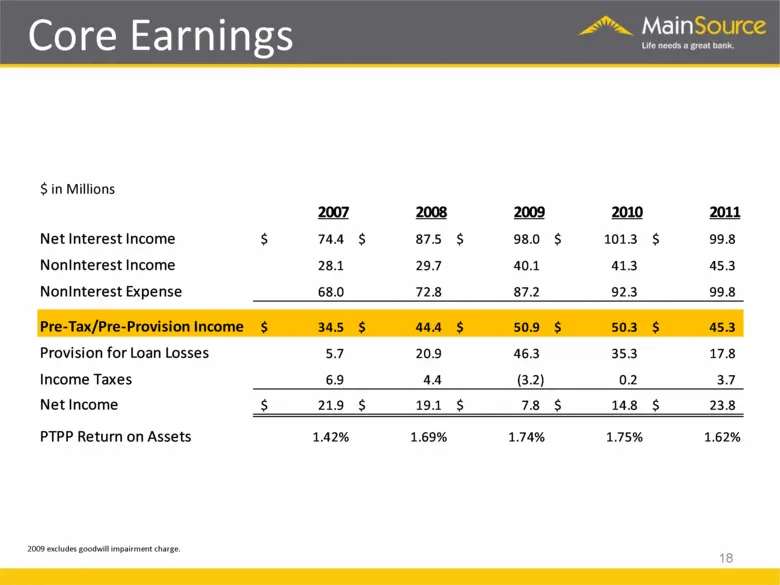
$ in Millions 2009 excludes goodwill impairment charge. 18 Core Earnings 2007 2008 2009 2010 2011 Net Interest Income 74.4 $ 87.5 $ 98.0 $ 101.3 $ 99.8 $ NonInterest Income 28.1 29.7 40.1 41.3 45.3 NonInterest Expense 68.0 72.8 87.2 92.3 99.8 Pre-Tax/Pre-Provision Income 34.5 $ 44.4 $ 50.9 $ 50.3 $
Slide 19: Net Interest Margin
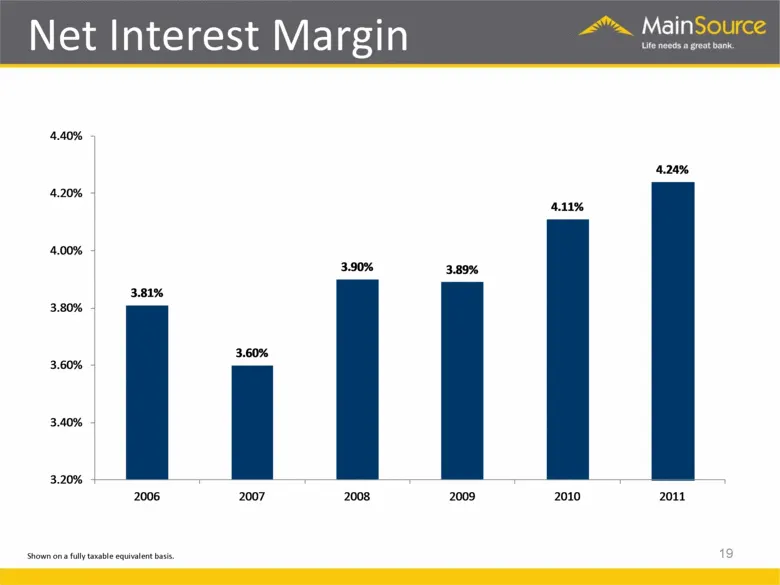
Shown on a fully taxable equivalent basis. 19 Net Interest Margin 3.81% 3.60% 3.90% 3.89% 4.11% 4.24% 3.20% 3.40% 3.60% 3.80% 4.00% 4.20% 4.40% 2006 2007 2008 2009 2010 2011
Slide 20: Growing TCE
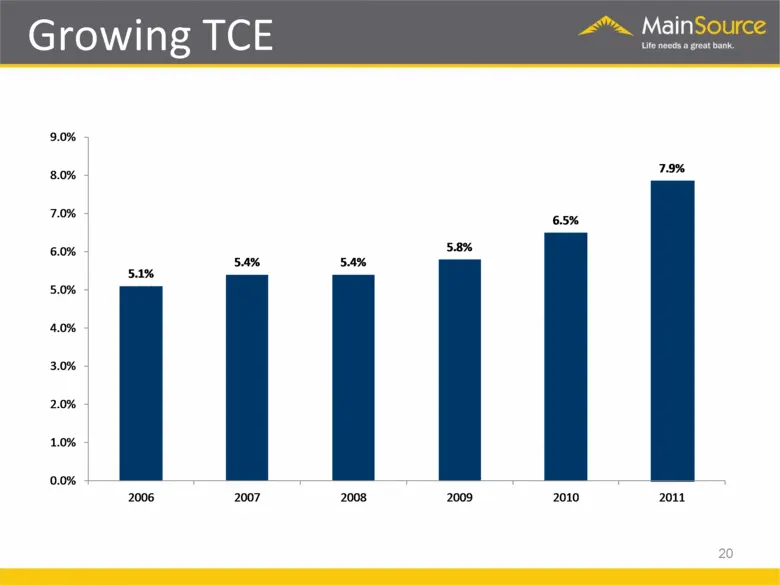
20 Growing TCE 5.1% 5.4% 5.4% 5.8% 6.5% 7.9% 0.0% 1.0% 2.0% 3.0% 4.0% 5.0% 6.0% 7.0% 8.0% 9.0% 2006 2007 2008 2009 2010 2011
Slide 21: Strong Regulatory Capital
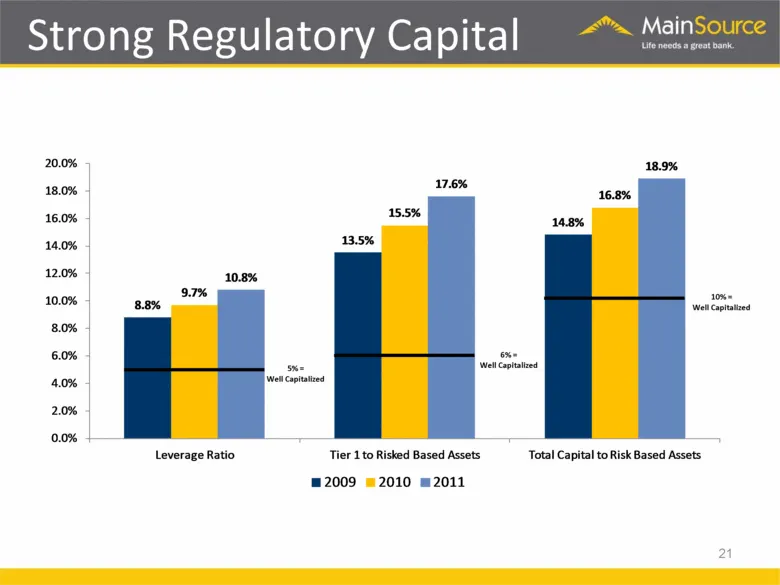
5% = Well Capitalized 6% = Well Capitalized 10% = Well Capitalized 21 Strong Regulatory Capital 8.8% 13.5% 14.8% 9.7% 15.5% 16.8% 10.8% 17.6% 18.9% 0.0% 2.0% 4.0% 6.0% 8.0% 10.0% 12.0% 14.0% 16.0% 18.0% 20.0% Leverage Ratio Tier 1 to Risked Based Assets Total Capital to Risk Based Assets 2009 2010 2
Slide 22: 2011 earnings and fourth quarter highlights
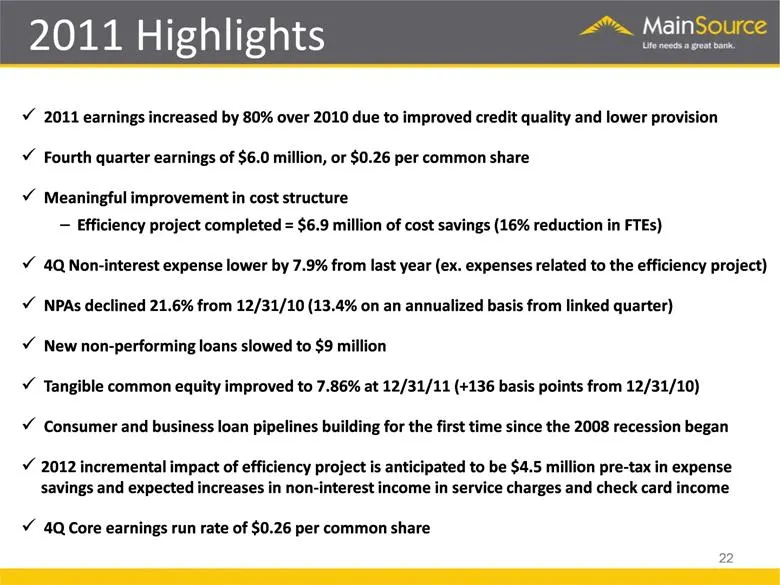
2011 earnings increased by 80% over 2010 due to improved credit quality and lower provision Fourth quarter earnings of $6.0 million, or $0.26 per common share Meaningful improvement in cost structure Efficiency project completed = $6.9 million of cost savings (16% reduction in FTEs) 4Q Non-interest
Slide 23: 2012 Strategic Priorities
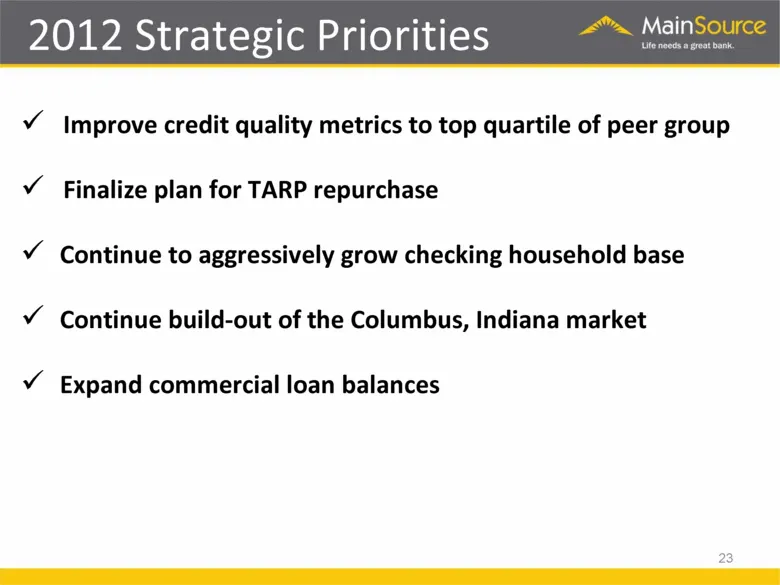
Improve credit quality metrics to top quartile of peer group Finalize plan for TARP repurchase Continue to aggressively grow checking household base Continue build-out of the Columbus, Indiana market Expand commercial loan balances 23 2012 Strategic Priorities
Slide 24: Strategic Priorities: Checking Household Growth
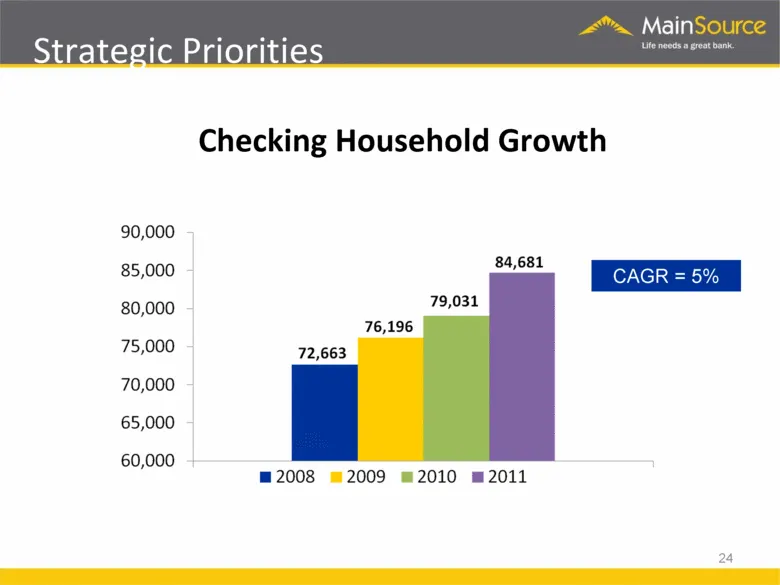
Strategic Priorities Checking Household Growth CAGR = 5% 24
Slide 25: Strategic Priorities: Service per Household Growth
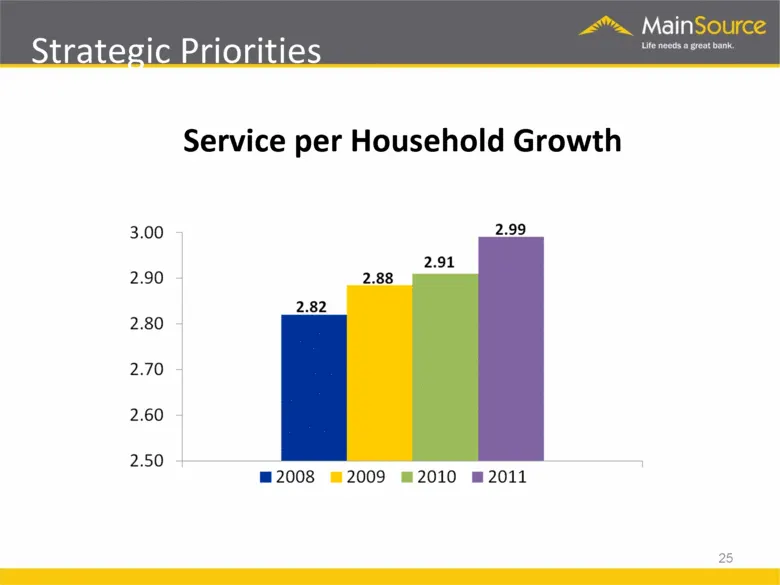
Strategic Priorities Service per Household Growth 25
Slide 26: Investment Thesis
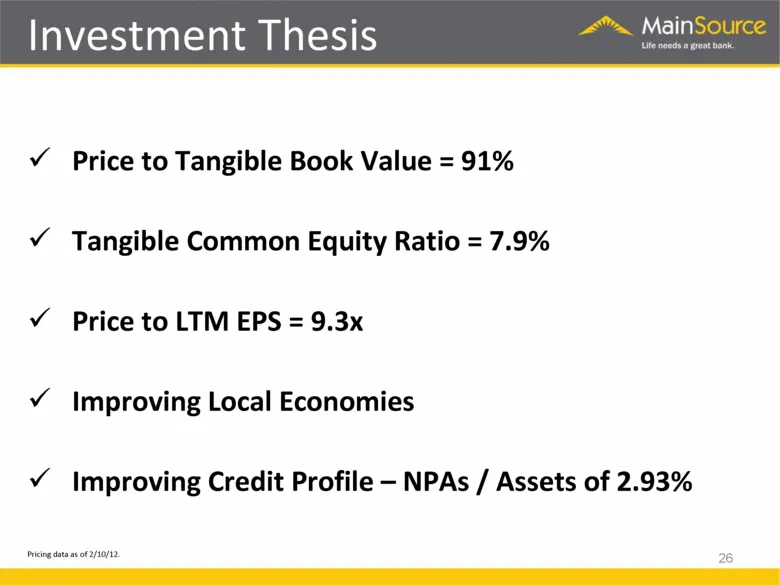
Price to Tangible Book Value = 91% Tangible Common Equity Ratio = 7.9% Price to LTM EPS = 9.3x Improving Local Economies Improving Credit Profile – NPAs / Assets of 2.93% Pricing data as of 2/10/12. 26 Investment Thesis
Slide 27: MainSource
2%_ MainSource - = SEs
Slide 28: Consistent Profitability
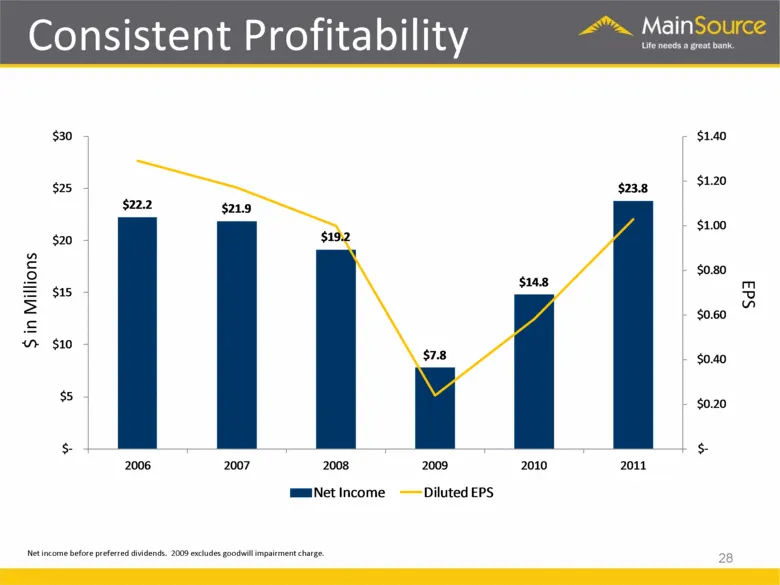
Net income before preferred dividends. 2009 excludes goodwill impairment charge. $ in Millions 28 EPS Consistent Profitability $22.2 $21.9 $19.2 $7.8 $14.8 $23.8 $ - $0.20 $0.40 $0.60 $0.80 $1.00 $1.20 $1.40 $ - $5 $10 $15 $20 $25 $30 2006 2007 2008 2009 2010 2011 Net Income Diluted EPS
Slide 29: Per Share Earnings Momentum
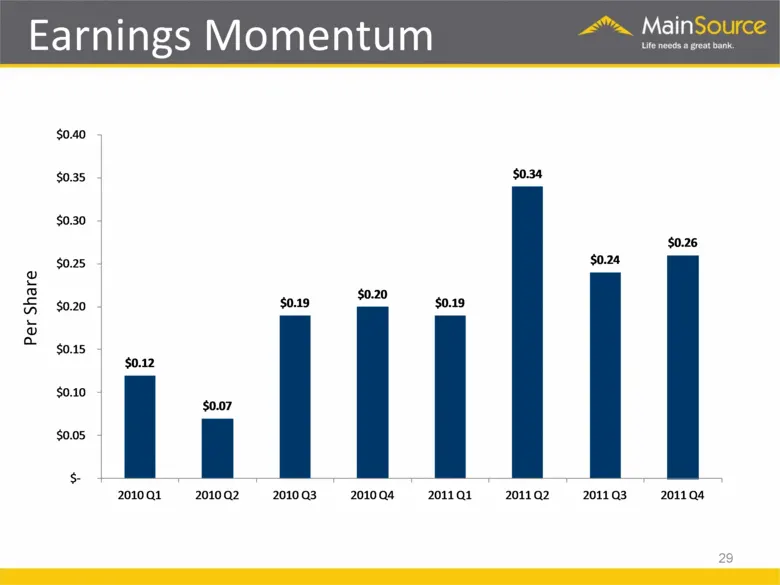
Per Share 29 Earnings Momentum $0.12 $0.07 $0.19 $0.20 $0.19 $0.34 $0.24 $0.26 $ - $0.05 $0.10 $0.15 $0.20 $0.25 $0.30 $0.35 $0.40 2010 Q1 2010 Q2 2010 Q3 2010 Q4 2011 Q1 2011 Q2 2011 Q3 2011 Q4
Slide 30: Investment Highlights
High quality deposit franchise Positive asset quality trends Proven and experienced management team Focus on shareholder value Attractive valuation 30 Investment Highlights
Slide 31: MainSource Financial Group
<M, MainSource FINANCIAL GROUP
Source: SEC EDGAR · 8-K filed Feb 15, 2012
More decks from MainSource Financial Group Inc
 Merger or Acquisition (October 2017)25 slides · Oct 31, 2017
 Merger or Acquisition (July 2017)23 slides · Jul 31, 2017
 Merger or Acquisition (July 2017)19 slides · Jul 26, 2017
 Shareholder Meeting (May 2017)67 slides · May 3, 2017
 Merger or Acquisition (December 2016)7 slides · Dec 19, 2016
 Investor Presentation (September 2016)34 slides · Sep 22, 2016