Cal Dive International — Q4 2008 Earnings Presentation
15 slides from Cal Dive International's earnings presentation, Feb 18, 2009

Slide 1: Cal Dive International 4th Quarter 2008 Earnings Conference Call
INTERNATIONAL Cal Dive International 4‘ Quarter 2008 Barnings C Conference Call February. 18, 200 :
Slide 2: Forward-Looking Statements
Forward-Looking Statements This presentation may include “forward-looking” statements that are generally identifiable through our use of words such as “believe,” “expect,” “anticipate,” “intend,” “plan,” “estimate,” “project” and similar expressions and include any statements that we make regarding
Slide 3: Presentation Outline
Presentation Outline @> Summary of 2008 Results @> Backlog @> Discussion of Financial Results @> Non-GAAP Reconciliations > Questions and Answers >» Cu Dive HTML
Slide 4: Summary of 4Q Results
Summary of 4Q Results > Record 4‘ quarter results @> Strong demand in U.S. GoM following hurricanes Gustav and Ike @> Backlog @> Outlook > Ca Dive Se
Slide 5: Backlog
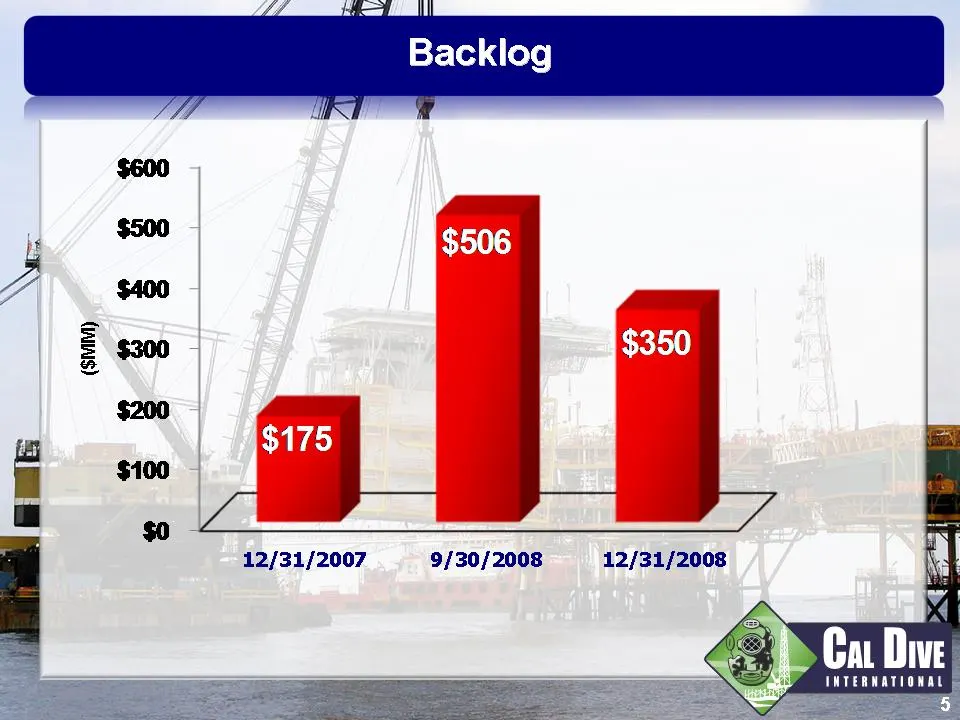
Backlog B50 J 12/31/2007 9/30/2008 12/31/2008 y; x] INTERNATIONAL
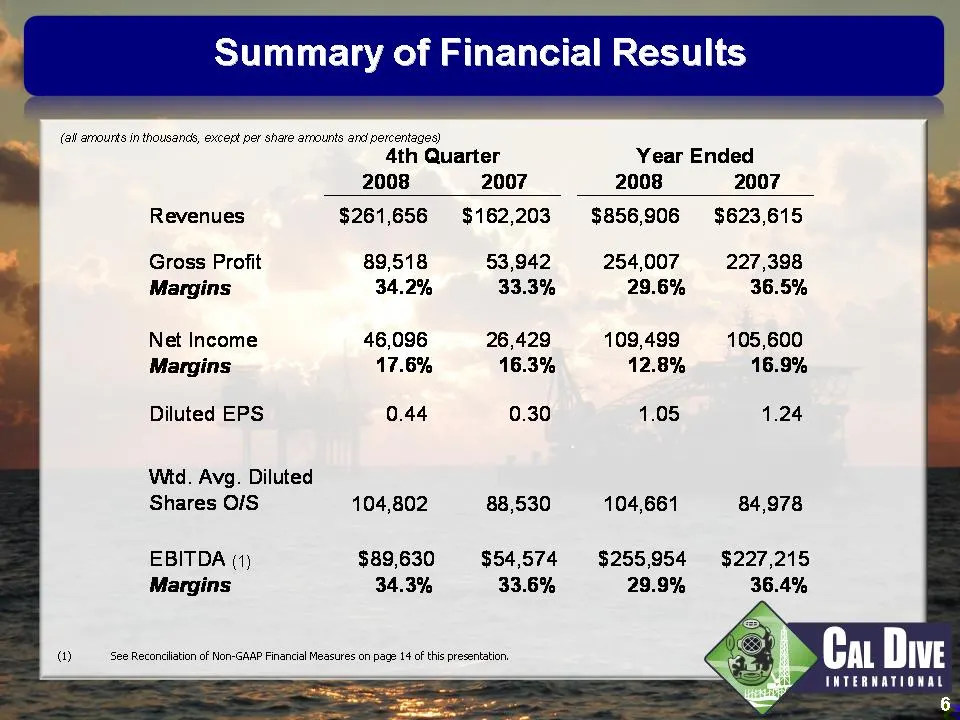
Slide 6: Summary of Financial Results
Summary of Financial Results (ail arrourts in thousands, except per share amounts and percentages) a 4th Quarter Year Ended 2008 2007 2008 2007 Revenues $261,656 $162,203 $856,906 $623,615 Gross Profit 89,518 53,942 254,007 227,398 Margins 34.2% 33.3% 29.6% 36.5% Net Income 46,096 26,429 109,499 105
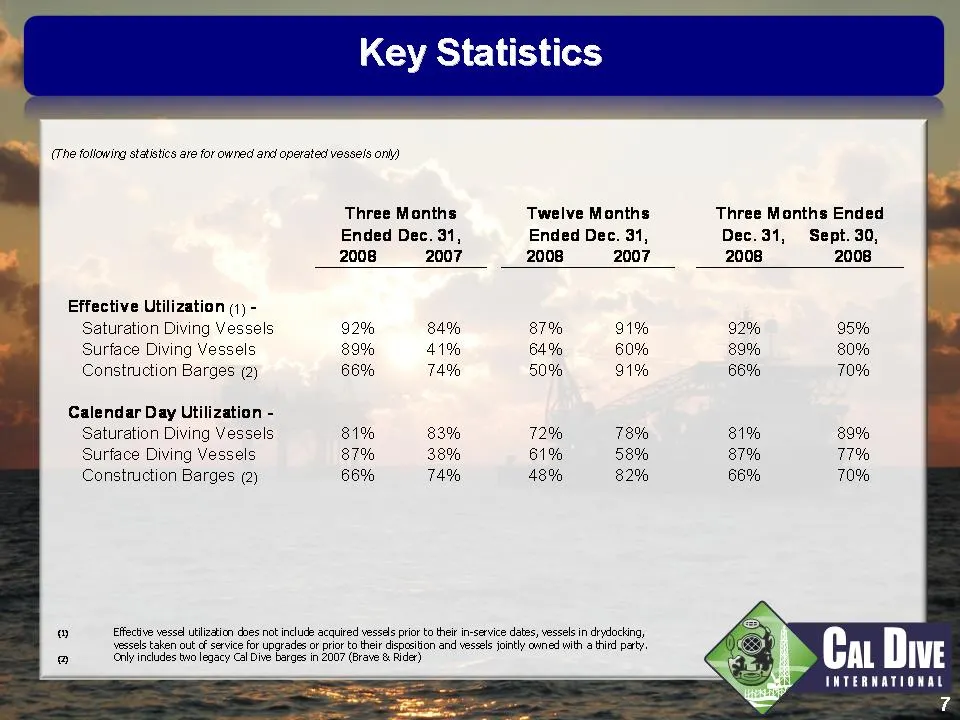
Slide 7: Key Statistics
Key Statistics Ye (The foliowing statistics are for owned and operated vessels only) Three Months Twelve Months Three Months Ended Ended Dec. 31, Ended Dec. 31, Dec.31, Sept. 30, 2008 2007 2008 2007 2008 2008 Effective Utilization (1) - D) Saturation Diving Vessels 92% 84% 87% 91% 92% 95% | Surface
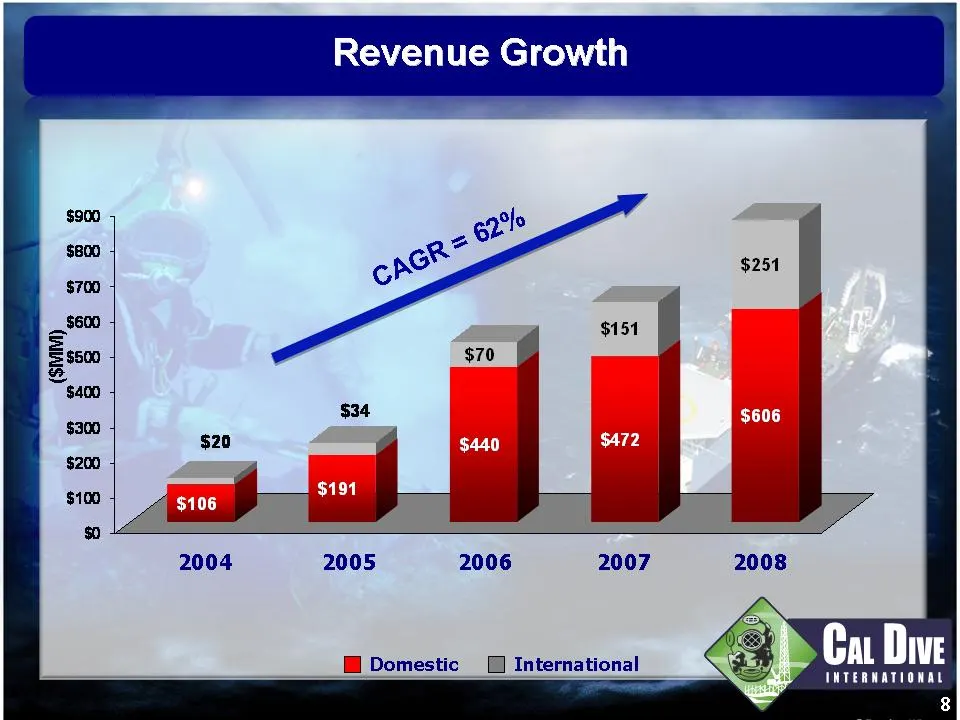
Slide 8: Revenue Growth
Revenue Growth q ; 2005 2006 2007 2008 HM Domestic fj International < - Ca Dive INTERNATIONAL 8
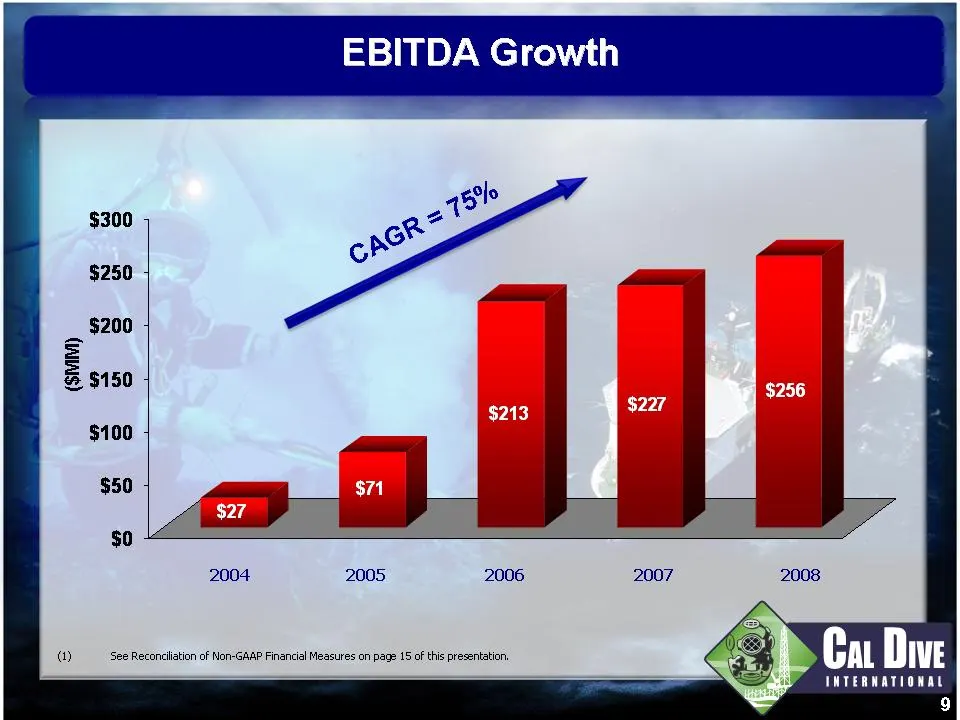
Slide 9: EBITDA Growth
EBITDA Growth () ae
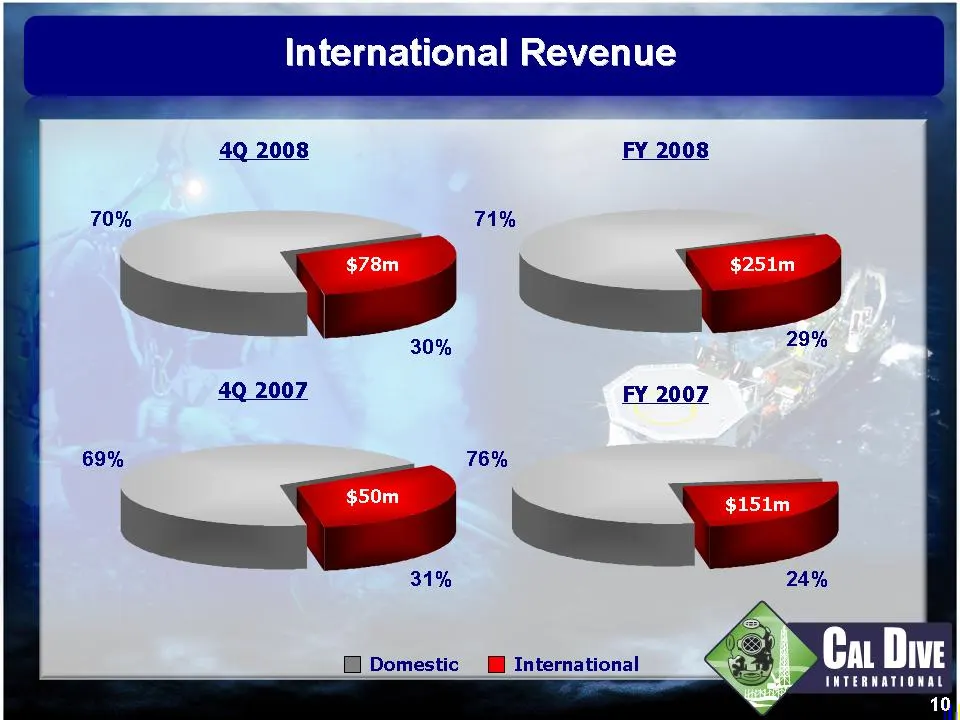
Slide 10: International Revenue
International Revenue i Domestic fj International_ : Ca Dive INTERNATIONAL 10
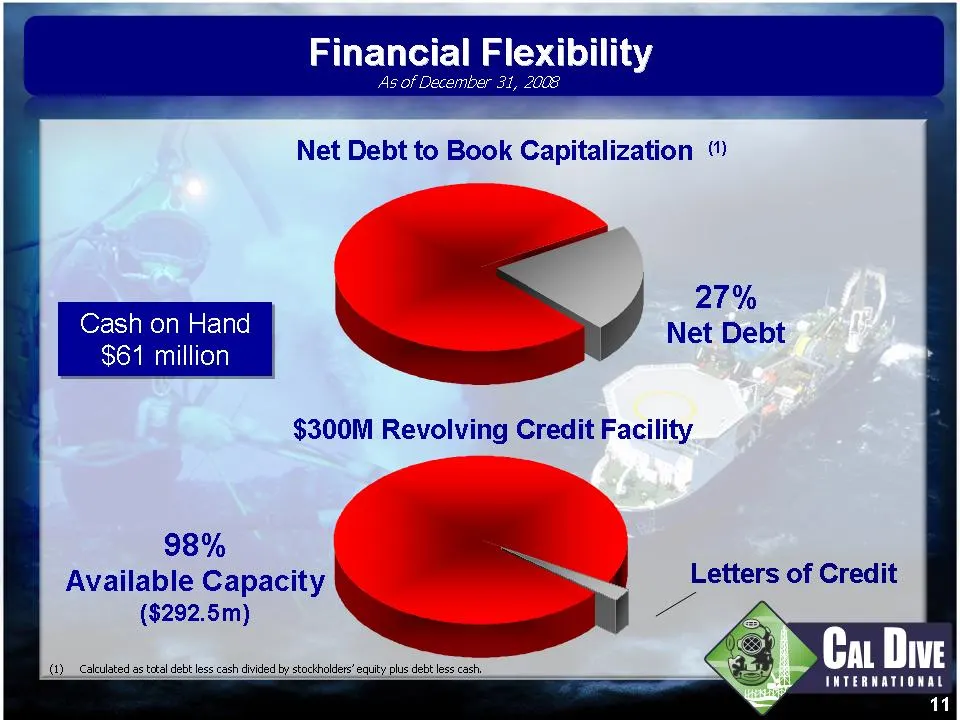
Slide 11: Letters of Credit
Letters of Credit INTERNATIONAL 1 (1) _Coleulated as total debt less cash divided by stockholders’ equty plus debt less cash.
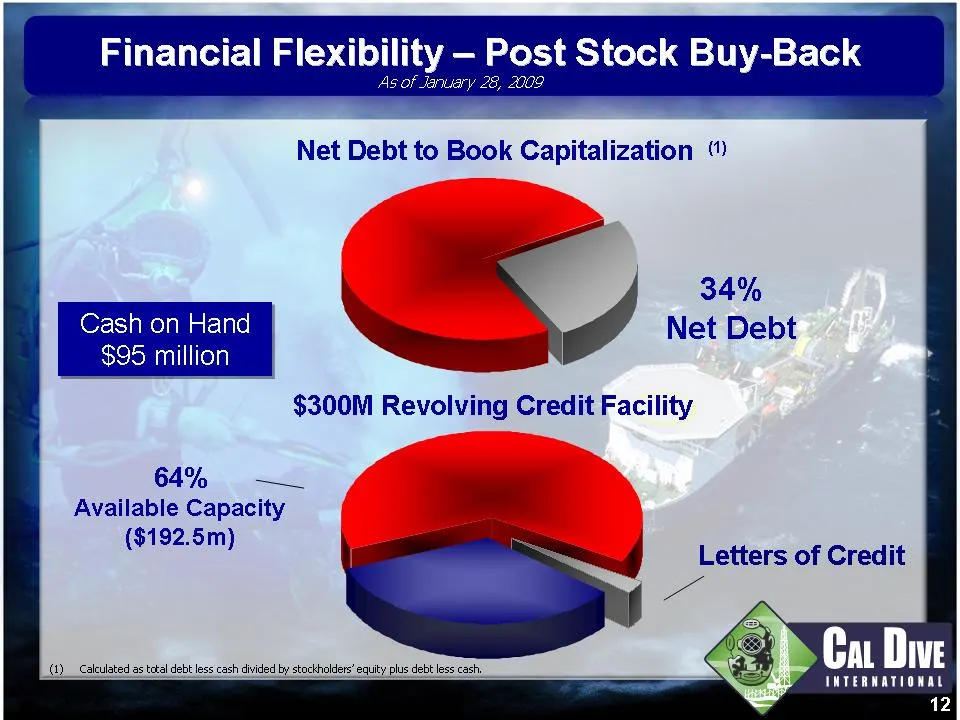
Slide 12: Financial Flexibility - Post Stock Buy-Back
Financial Flexibility -— Post Stock Buy-Back Net Debt to Book Capitalization “ $300M Revolving Credit Facility 64% —_ Available Capacity ($192.5m) ee ag Letters of Credit Ca Dive INTERNATIONAL 12
Slide 13: > Cu Dive
7 > Cu Dive TMTERMATIONAL 13
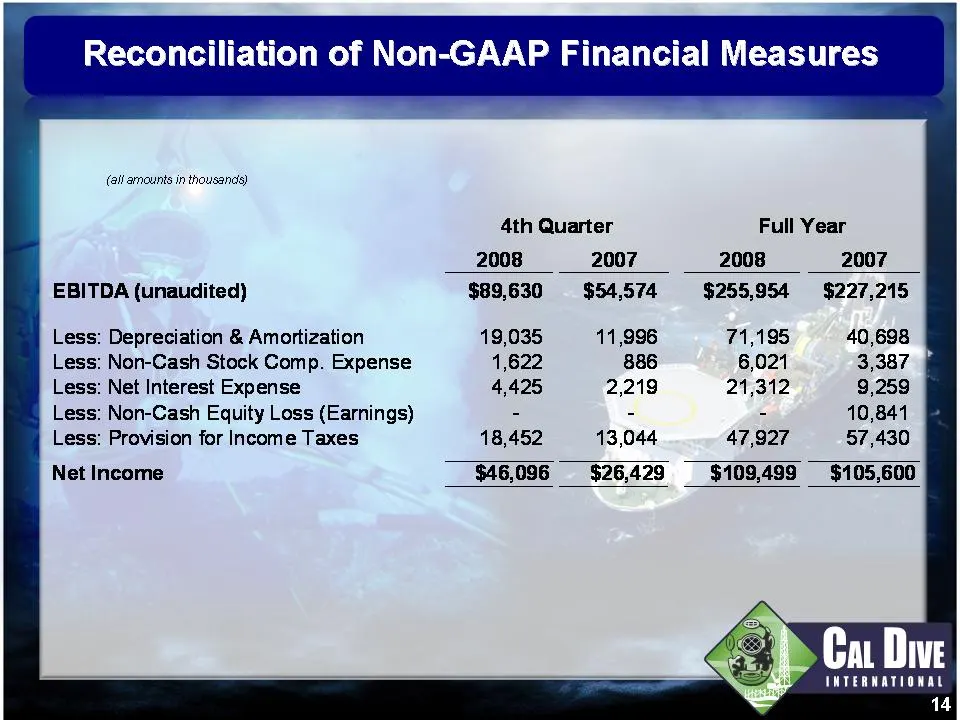
Slide 14: EBITDA Reconciliation (Quarter and Full Year)
(all arnounts in thousands) } EBITDA (unaudited) Less: Depreciation & Amortization Less: Non-Cash Stock Comp. Expense Less: Net Interest Expense § Less: Non-Cash Equity Loss (Earnings) Less: Provision for Income Taxes Net Income 4th Quarter 2008 2007 Full Year 2008 2007 $89,630 $54,574 19,035 11,996
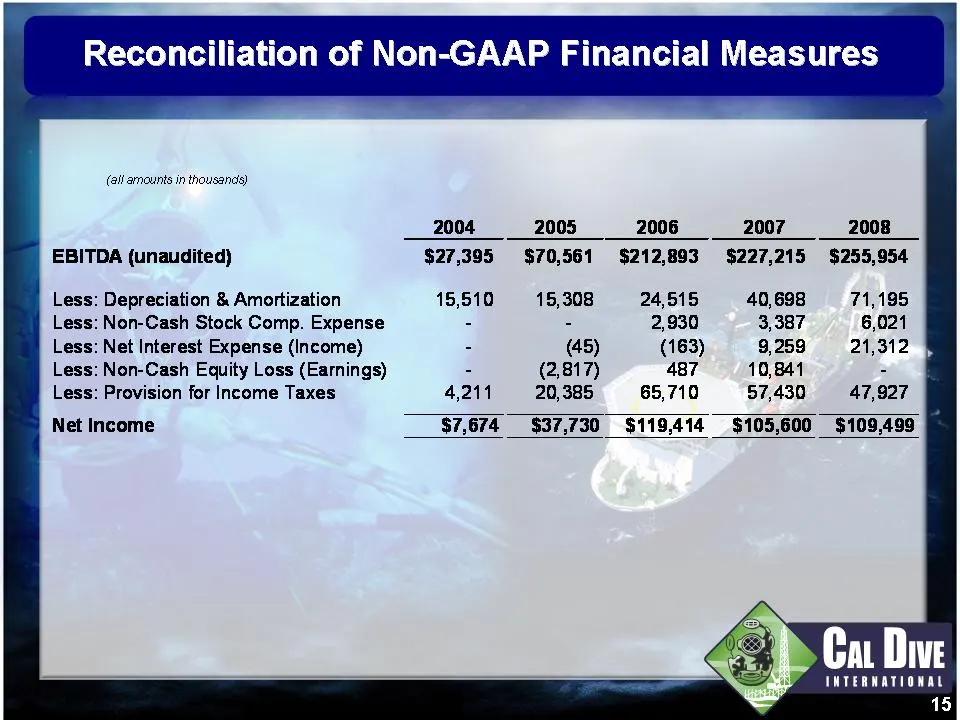
Slide 15: EBITDA Reconciliation (2004-2008)
(all arnounts in thousands) | EBITDA (unaudited) Less: Depreciation & Amortization Less: Non-Cash Stock Comp. Expense Less: Net Interest Expense (Income) Less: Non-Cash Equity Loss (Earnings) Less: Provision for Income Taxes » Net Income 2004 2005 2006 2007 2008 $27,395 15,510 4,211 $70,561 $212,893
Source: SEC EDGAR · 8-K filed Feb 18, 2009
More decks from Cal Dive International Inc
 Q3 2014 Earnings Presentation12 slides · Nov 6, 2014
 Q2 2014 Earnings Presentation12 slides · Aug 11, 2014
 Q1 2014 Earnings Presentation12 slides · May 9, 2014
 Q4 2013 Earnings Presentation11 slides · Mar 5, 2014
 Q3 2013 Earnings Presentation11 slides · Nov 7, 2013
 Q2 2013 Earnings Presentation11 slides · Aug 8, 2013