Gas Natural — American Gas Association Financial Forum 2011
17 slides from Gas Natural's conference presentation, May 13, 2011
Slide 1: American Gas Association Financial Forum
NYSE Amex: EGAS American Gas Association Financial Forum May 16, 2011 Kevin J. Degenstein, President & COO Thomas J. Smith, Vice President, CFO & Director Exhibit 99.1
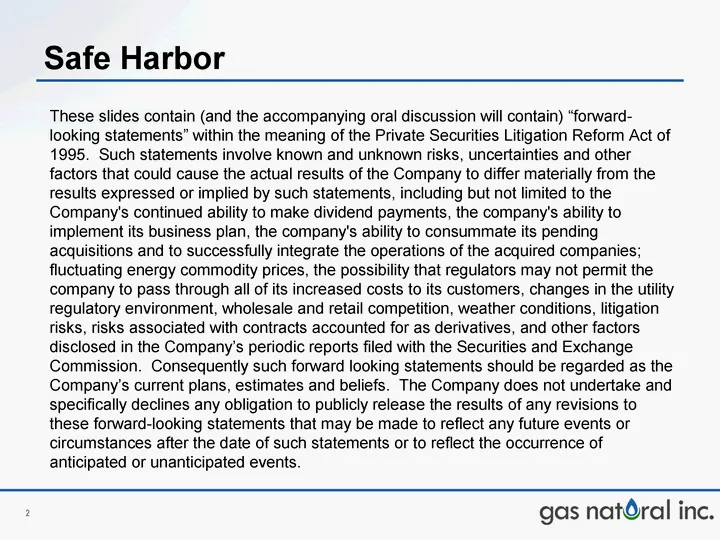
Slide 2: Safe Harbor
Safe Harbor These slides contain (and the accompanying oral discussion will contain) "forward- looking statements" within the meaning of the Private Securities Litigation Reform Act of 1995. Such statements involve known and unknown risks, uncertainties and other factors that could cause the actual
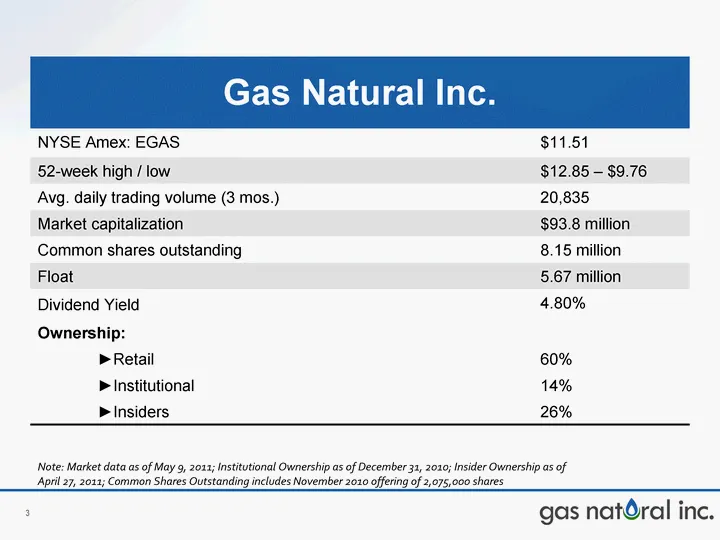
Slide 3: Gas Natural Inc. (NYSE Amex: EGAS)
Gas Natural Inc. Gas Natural Inc. NYSE Amex: EGAS $11.51 52-week high / low $12.85 - $9.76 Avg. daily trading volume (3 mos.) 20,835 Market capitalization $93.8 million Common shares outstanding 8.15 million Float 5.67 million Dividend Yield 4.80% Ownership: ^Retail 60% ^Institutional 14% ^Insiders
Slide 4: Gas Natural Inc. (NYSE Amex: EGAS)
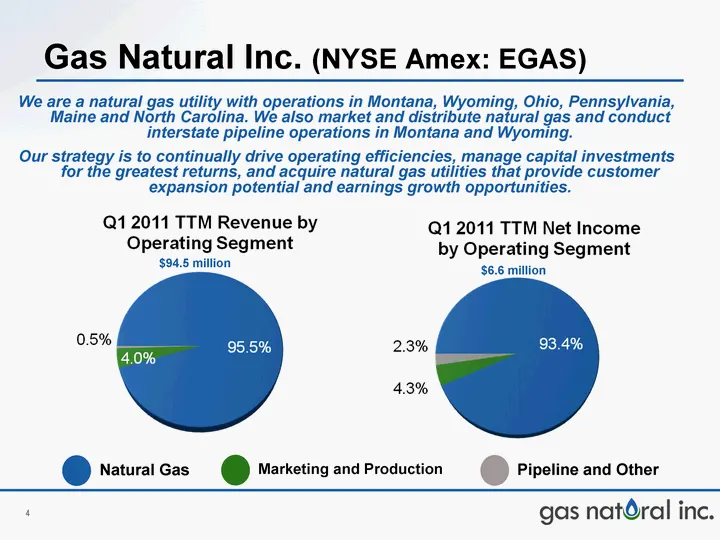
Gas Natural Inc. (NYSE Amex: EGAS) We are a natural gas utility with operations in Montana, Wyoming, Ohio, Pennsylvania, Maine and North Carolina. We also market and distribute natural gas and conduct interstate pipeline operations in Montana and Wyoming. Our strategy is to continually drive operati
Slide 5: Business Strategy
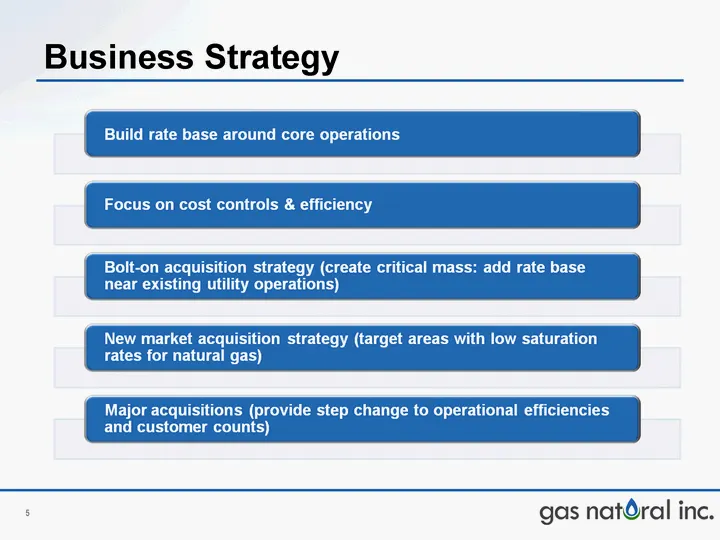
Business Strategy Build rate base around core operations Focus on cost controls & efficiency Bolt-on acquisition strategy (create critical mass: add rate base near existing utility operations) New market acquisition strategy (target areas with low saturation rates for natural gas) Major acquisitions
Slide 6: Operations Overview
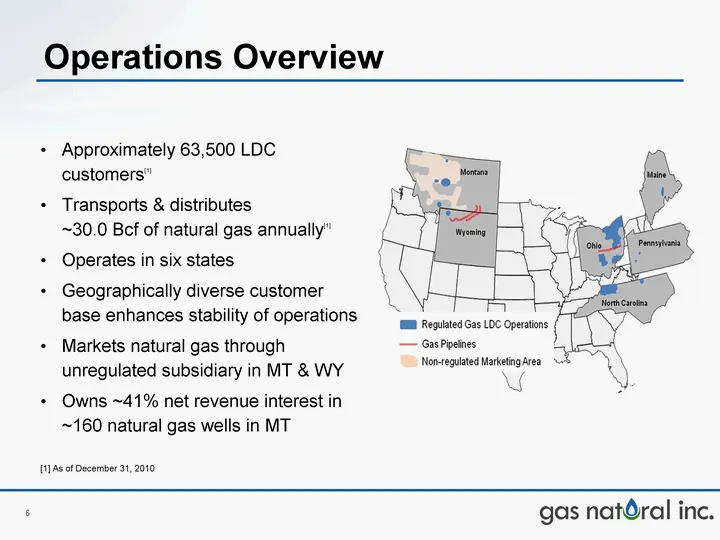
Operations Overview Approximately 63,500 LDC customers[1] Transports & distributes ~30.0 Bcf of natural gas annually[1] Operates in six states Geographically diverse customer base enhances stability of operations Markets natural gas through unregulated subsidiary in MT & WY Owns ~41% net revenue int
Slide 7: Natural Gas Expansion
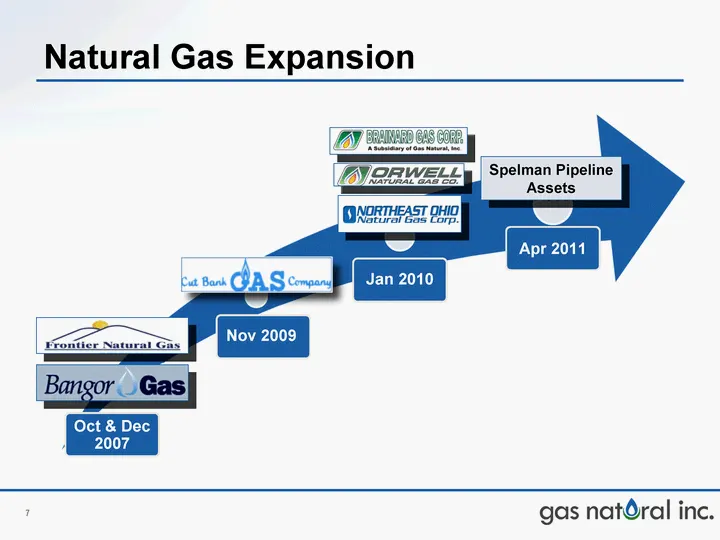
Natural Gas Expansion Oct & Dec 2007 Nov 2009 Jan 2010 Spelman Pipeline Assets Apr 2011
Slide 8: Natural Gas Operations
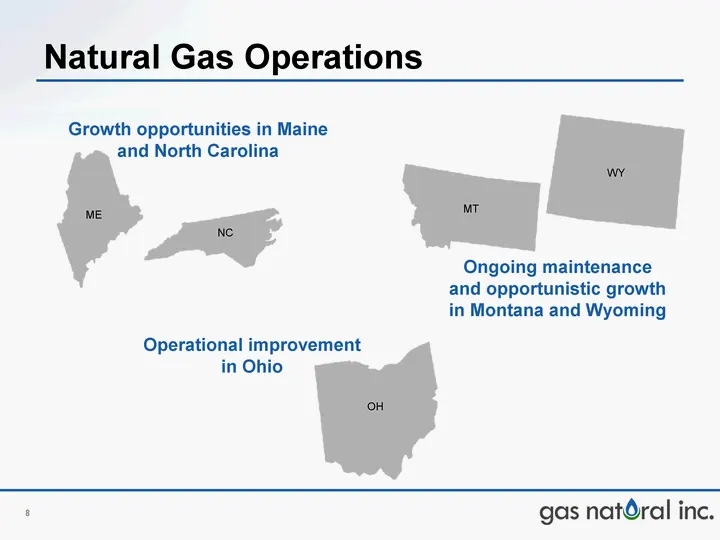
Natural Gas Operations Ongoing maintenance and opportunistic growth in Montana and Wyoming Growth opportunities in Maine and North Carolina Operational improvement in Ohio ME WY MT OH NC
Slide 9: Marketing & Production Resources
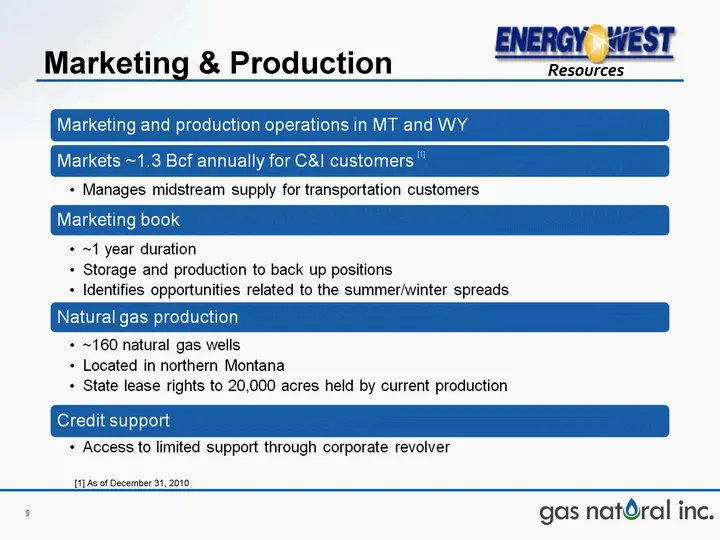
Marketing & Production Resources [1] As of December 31, 2010
Slide 10: Pipeline Operations
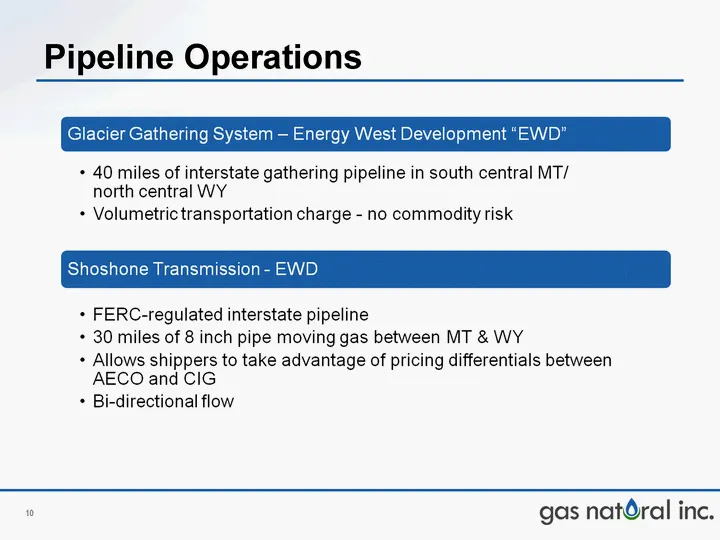
Pipeline Operations Glacier Gathering System — Energy West Development “EWD” + 40 miles of interstate gathering pipeline in south central MT/ north central WY + Volumetric transportation charge - no commodity risk Shoshone Transmission - EWI + FERC-regulated interstate pipeline * 30 miles of 8 inch
Slide 11: Financial Highlights
gas natral inc. Financial Highlights
Slide 12: Increasing Operating Income
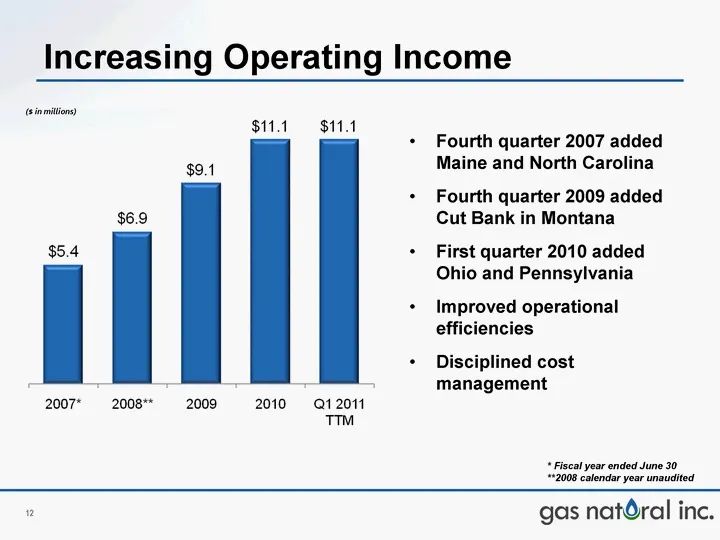
Increasing Operating Income ($ in millions) Fourth quarter 2007 added Maine and North Carolina Fourth quarter 2009 added Cut Bank in Montana First quarter 2010 added Ohio and Pennsylvania Improved operational efficiencies Disciplined cost management * Fiscal year ended June 30 **2008 calendar year u
Slide 13: Net Income from Continuing Ops
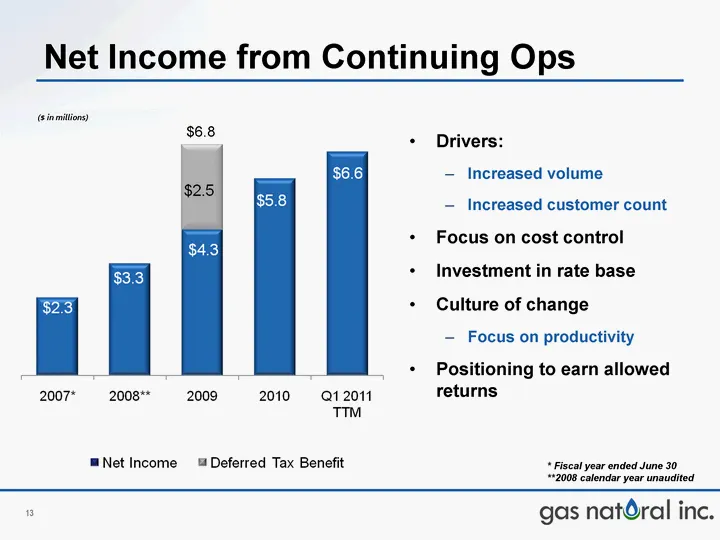
Net Income from Continuing Ops Drivers: Increased volume Increased customer count Focus on cost control Investment in rate base Culture of change Focus on productivity Positioning to earn allowed returns ($ in millions) $6.8 * Fiscal year ended June 30 **2008 calendar year unaudited
Slide 14: Cash Dividends Paid by Calendar Year
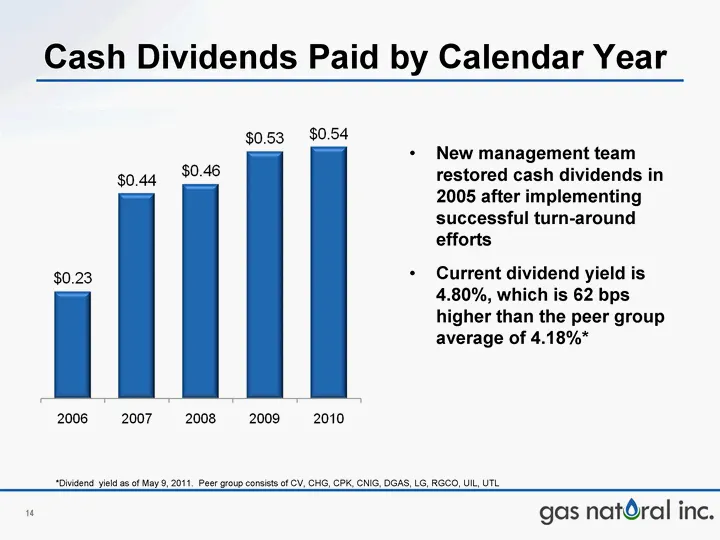
Cash Dividends Paid by Calendar Year New management team restored cash dividends in 2005 after implementing successful turn-around efforts Current dividend yield is 4.80%, which is 62 bps higher than the peer group average of 4.18%* *Dividend yield as of May 9, 2011. Peer group consists of CV, CHG,
Slide 15: Capex: Investing in Growth
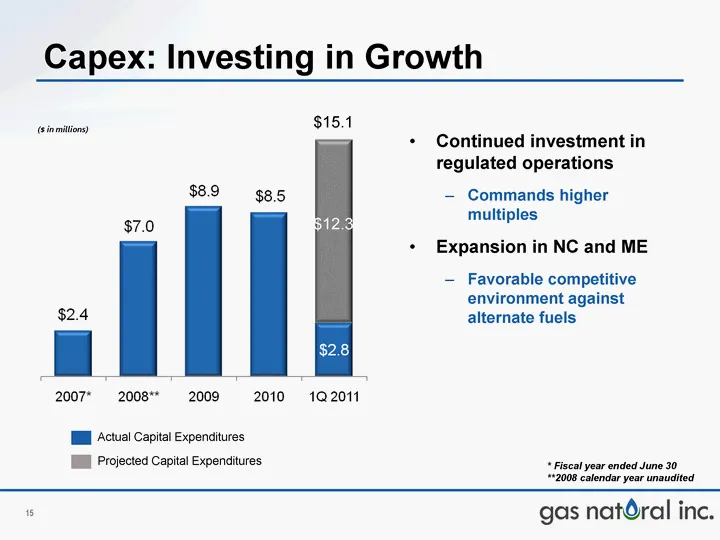
Capex: Investing in Growth ($ in millions) Continued investment in regulated operations Commands higher multiples Expansion in NC and ME Favorable competitive environment against alternate fuels * Fiscal year ended June 30 **2008 calendar year unaudited $12.3 Actual Capital Expenditures Projected Ca
Slide 16: Company Highlights
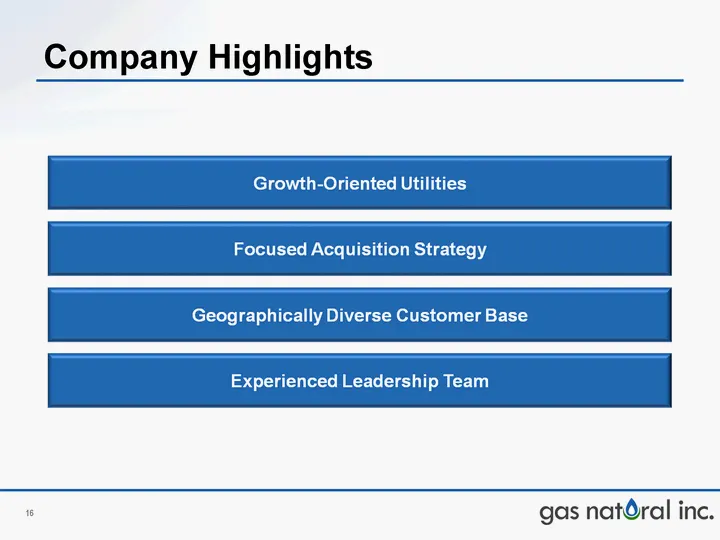
Company Highlights Growth-Oriented Utilities Focused Acquisition Strategy Geographically Diverse Customer Base Experienced Leadership Team gas natOral inc.
Slide 17: American Gas Association Financial Forum
NYSE Amex: EGAS May 16, 2011 American Gas Association Financial Forum Kevin J. Degenstein, President & COO Thomas J. Smith, Vice President, CFO & Director
Source: SEC EDGAR · 8-K filed May 13, 2011