NorthStar Realty Finance — Investor Presentation (February 2013)
29 slides from NorthStar Realty Finance's investor presentation, Feb 15, 2013
Slide 1: Corporate Presentation February 2013
Corporate Presentation February 2013
Slide 2: Safe Harbor
1 Safe Harbor This presentation contains forward-looking statements, within the meaning of the Private Securities Litigation Reform Act of 1995, including statements about future results, projected yields, rates of return and performance, projected cash available for distribution, projected cash fro
Slide 3: Company Overview
2 Diversified commercial real estate investment and asset management company with $7 billion of commercial real estate assets under management Internally managed REIT; interests aligned with shareholders Broad, scalable and sophisticated investment platform (over 120 direct employees) New York City
Slide 4: Established Commercial Real Estate Platform
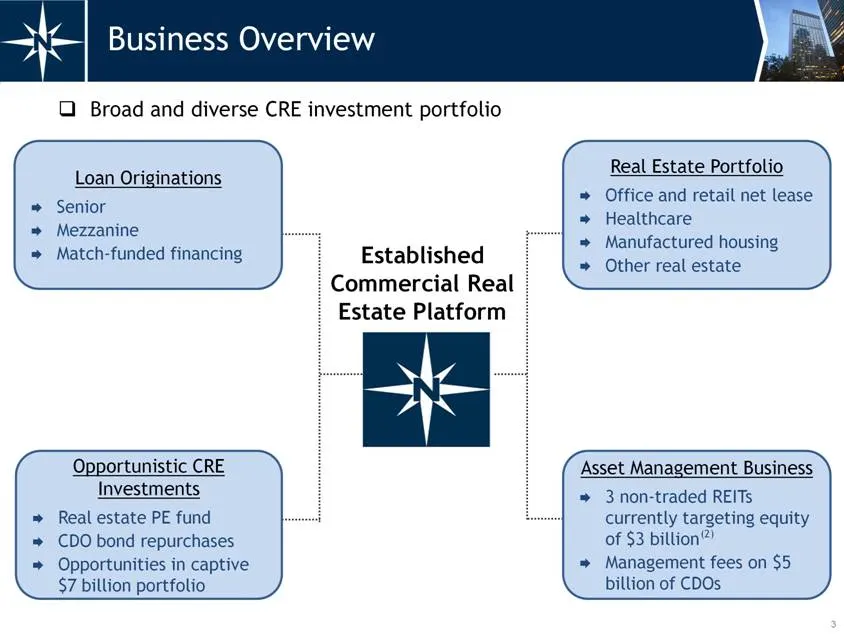
Established Commercial Real Estate Platform 3 Business Overview Broad and diverse CRE investment portfolio Loan Originations Senior Mezzanine Match-funded financing Asset Management Business 3 non-traded REITs currently targeting equity of $3 billion Management fees on $5 billion of CDOs Opportunist
Slide 5: 2012 Investments
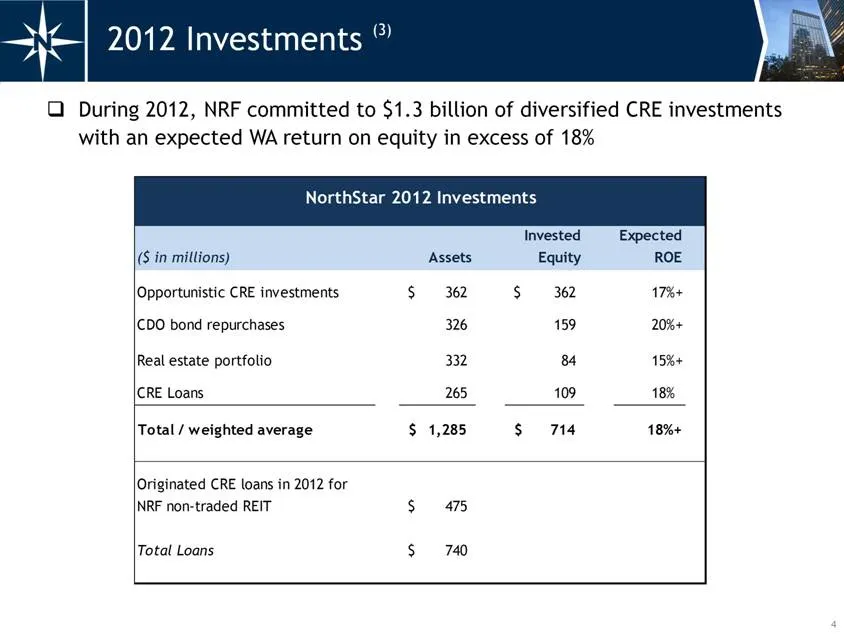
4 2012 Investments (3) During 2012, NRF committed to $1.3 billion of diversified CRE investments with an expected WA return on equity in excess of 18% NorthStar 2012 Investments ($ in millions) Assets Invested Equity Expected ROE Opportunistic CRE investments 362 $ 362 $ 17% + CDO bond repurchases 3
Slide 6: 2013 Projected Cash Available for Distribution
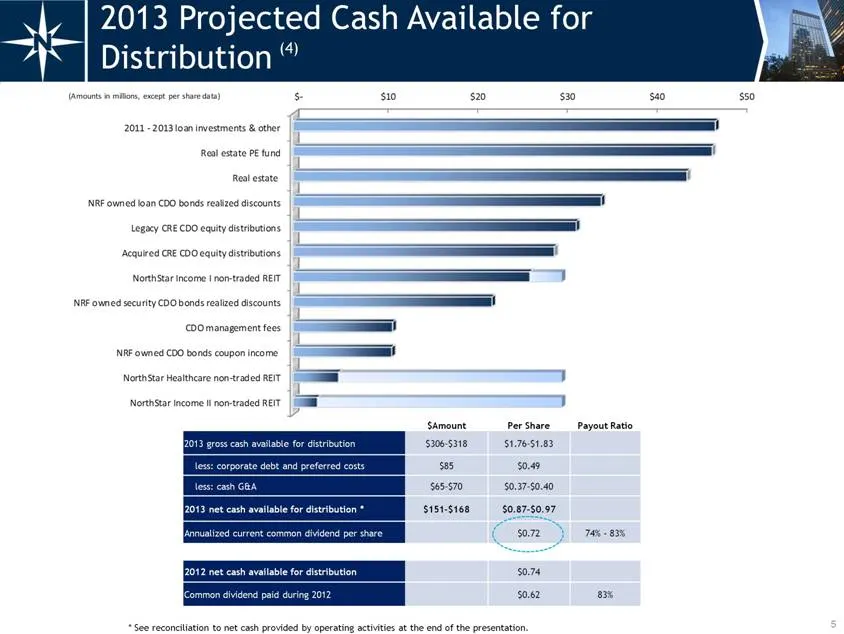
5 2013 Projected Cash Available for Distribution (4) $Amount Per Share Payout Ratio 2013 gross cash available for distribution $306–$318 $1.76–$1.83 less: corporate debt and preferred costs $85 $0.49 less: cash G&A $65–$70 $0.37–$0.40 2013 net cash available for distribution * $151–$168 $0.87–$0.97
Slide 7: 2013 Cash Available for Distribution per Share / Hypothetical Dividend Yield Analysis
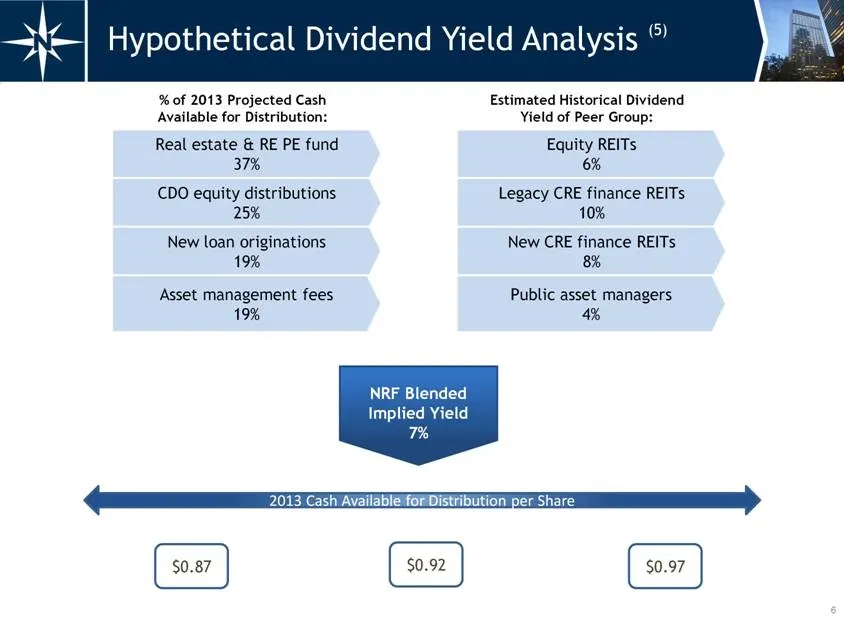
2013 Cash Available for Distribution per Share 6 Hypothetical Dividend Yield Analysis (5) $0.92 $0.87 $0.97 % of 2013 Projected Cash Available for Distribution: Estimated Historical Dividend Yield of Peer Group: CDO equity distributions 25% New loan originations 19% Asset management fees 19% Real es
Slide 8: Asset Overview
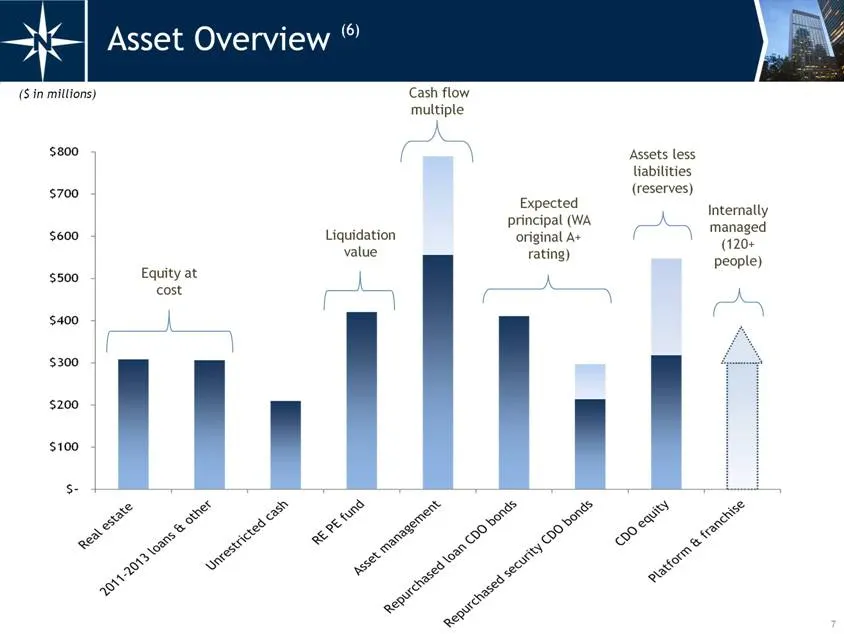
7 Asset Overview (6) ($ in millions) Expected principal (WA original A+ rating) Assets less liabilities (reserves) Equity at cost Liquidation value Cash flow multiple Internally managed (120+ people) $- $100 $200 $300 $400 $500 $600 $700 $800
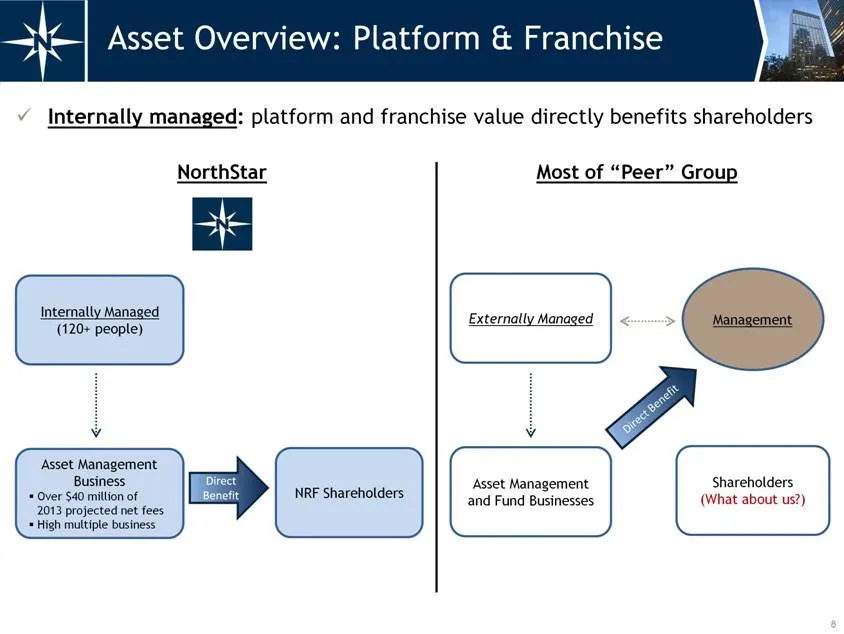
Slide 9: Internally managed: platform and franchise value directly benefits shareholders
Internally managed: platform and franchise value directly benefits shareholders 8 Asset Overview: Platform & Franchise Internally Managed (120+ people) Asset Management Business Over $40 million of 2013 projected net fees High multiple business Direct Benefit NRF Shareholders Externally Managed Asse
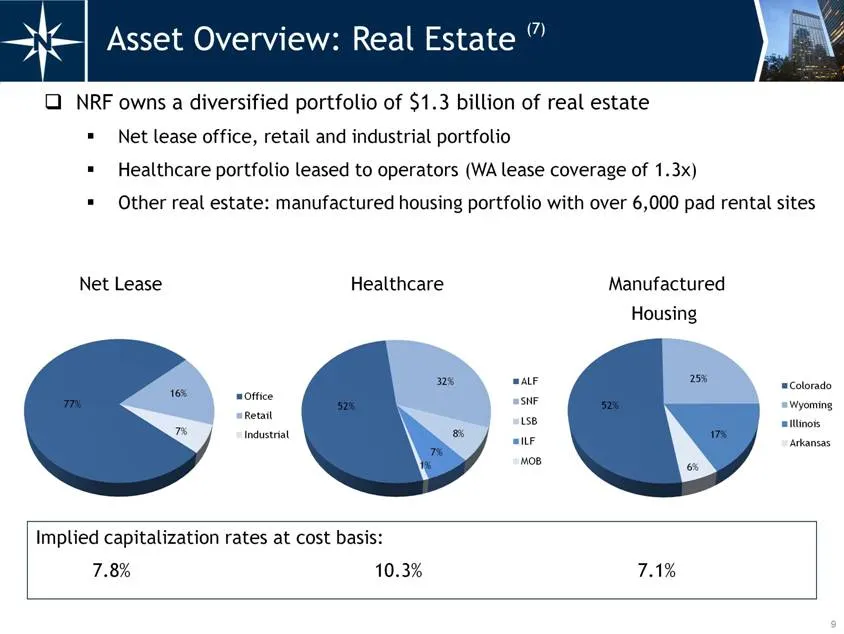
Slide 10: Asset Overview: Real Estate
9 Asset Overview: Real Estate (7) NRF owns a diversified portfolio of $1.3 billion of real estate Net lease office, retail and industrial portfolio Healthcare portfolio leased to operators (WA lease coverage of 1.3x) Other real estate: manufactured housing portfolio with over 6,000 pad rental sites
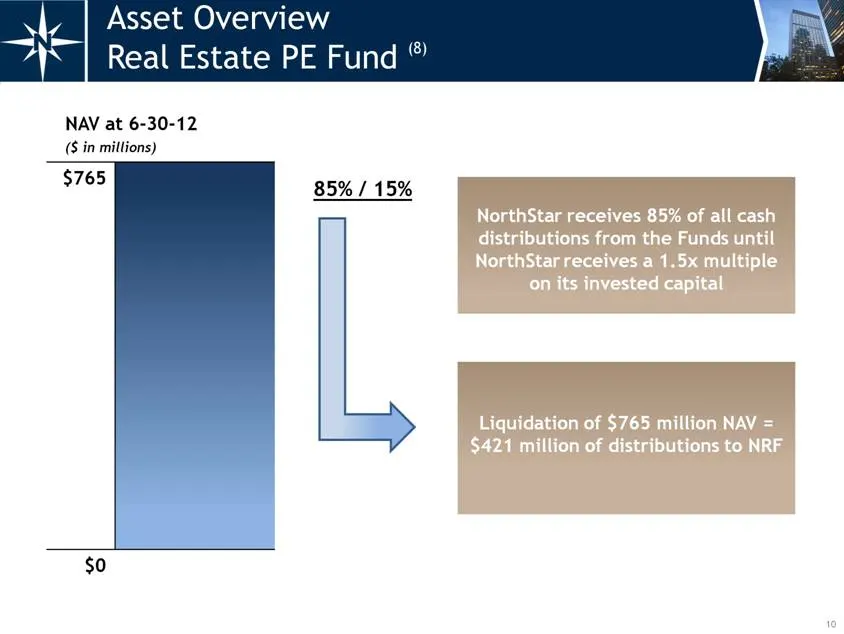
Slide 11: Asset Overview: Real Estate PE Fund
10 Asset Overview Real Estate PE Fund (8) NAV at 6-30-12 ($ in millions) $765 $0 85% / 15% NorthStar receives 85% of all cash distributions from the Funds until NorthStar receives a 1.5x multiple on its invested capital Liquidation of $765 million NAV = $421 million of distributions to NRF
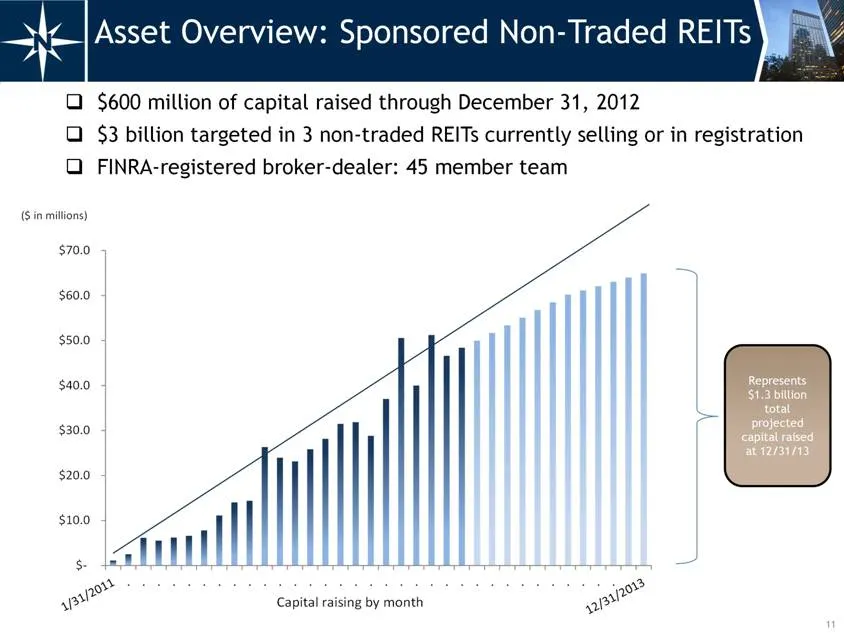
Slide 12: Asset Overview: Sponsored Non-Traded REITs
11 $600 million of capital raised through December 31, 2012 $3 billion targeted in 3 non-traded REITs currently selling or in registration FINRA-registered broker-dealer: 45 member team Asset Overview: Sponsored Non-Traded REITs Represents $1.3 billion total projected capital raised at 12/31/13 $- $
Slide 13: Asset Overview: CDO Bonds Repurchased
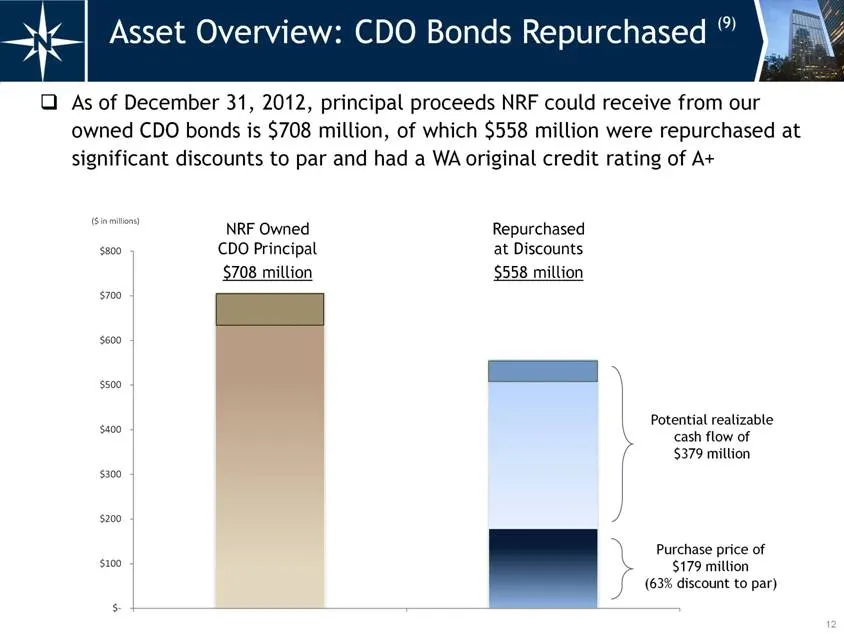
12 As of December 31, 2012, principal proceeds NRF could receive from our owned CDO bonds is $708 million, of which $558 million were repurchased at significant discounts to par and had a WA original credit rating of A+ Potential realizable cash flow of $379 million Purchase price of $179 million (6
Slide 14: Asset Overview: CDO Equity
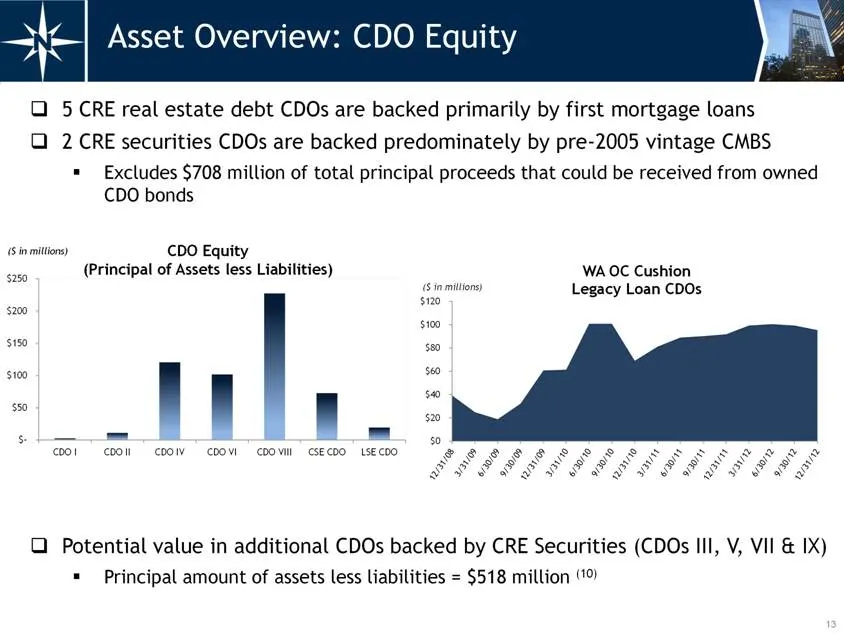
13 Asset Overview: CDO Equity 5 CRE real estate debt CDOs are backed primarily by first mortgage loans 2 CRE securities CDOs are backed predominately by pre-2005 vintage CMBS Excludes $708 million of total principal proceeds that could be received from owned CDO bonds Potential value in additional C
Slide 15: Corporate Capital Structure
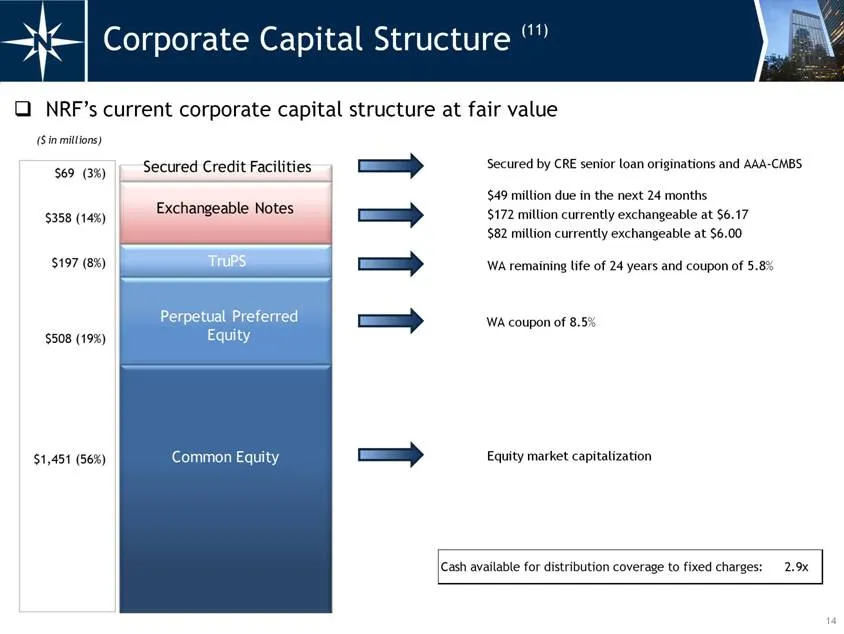
WA coupon of 8.5% WA remaining life of 24 years and coupon of 5.8% Equity market capitalization NRF’s current corporate capital structure at fair value 14 Corporate Capital Structure (11) $49 million due in the next 24 months $172 million currently exchangeable at $6.17 $82 million currently exchang
Slide 16: Total Return Analysis: Legacy CRE Finance REITs
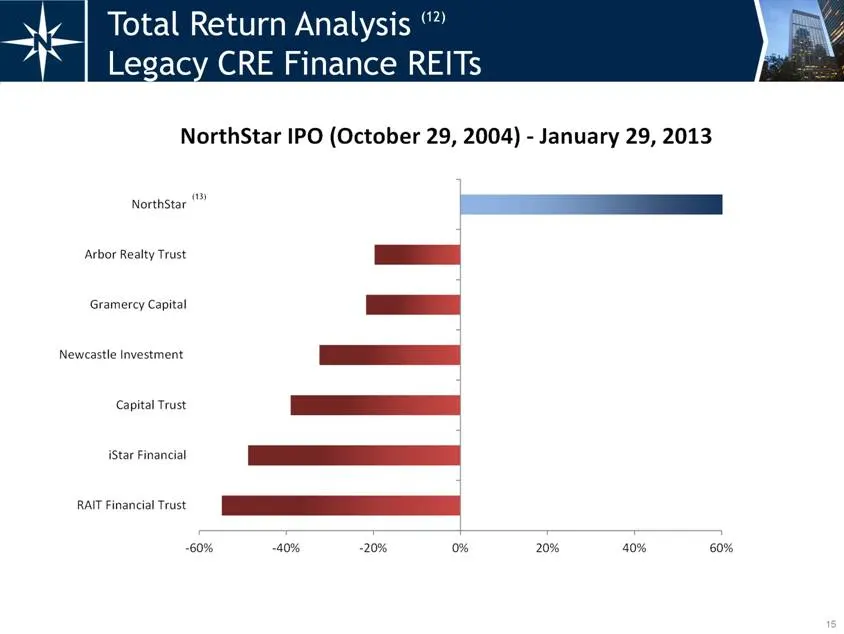
15 Total Return Analysis (12) Legacy CRE Finance REITs (13) -60% -40% -20% 0% 20% 40% 60% RAIT Financial Trust iStar Financial Capital Trust Newcastle Investment Gramercy Capital Arbor Realty Trust NorthStar NorthStar IPO (October 29, 2004) - January 29, 2013
Slide 17: Total Return Analysis: New CRE Finance REITs
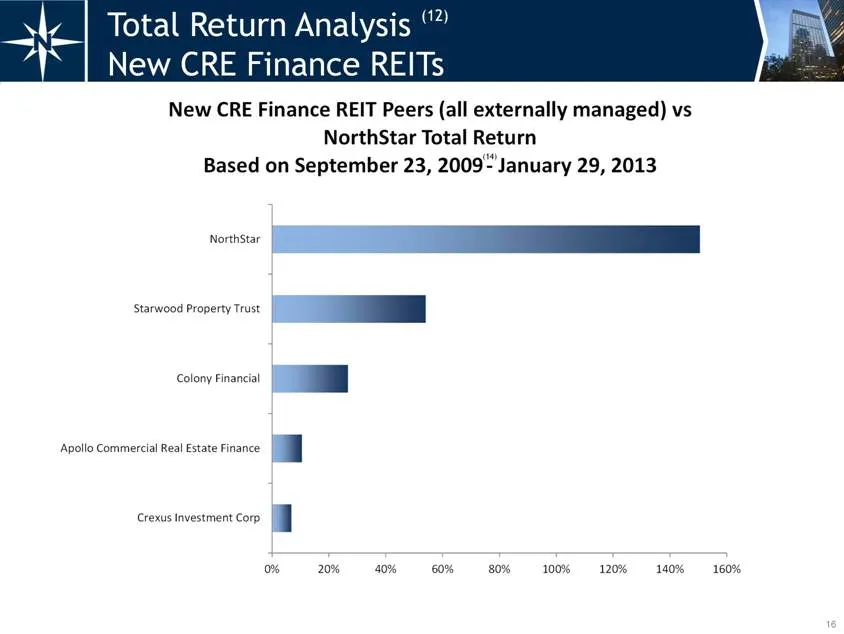
16 Total Return Analysis (12) New CRE Finance REITs (14) 0% 20% 40% 60% 80% 100% 120% 140% 160% Crexus Investment Corp Apollo Commercial Real Estate Finance Colony Financial Starwood Property Trust NorthStar New CRE Finance REIT Peers (all externally managed) vs NorthStar Total Return Based on Septe
Slide 18: Seasoned Executive Team
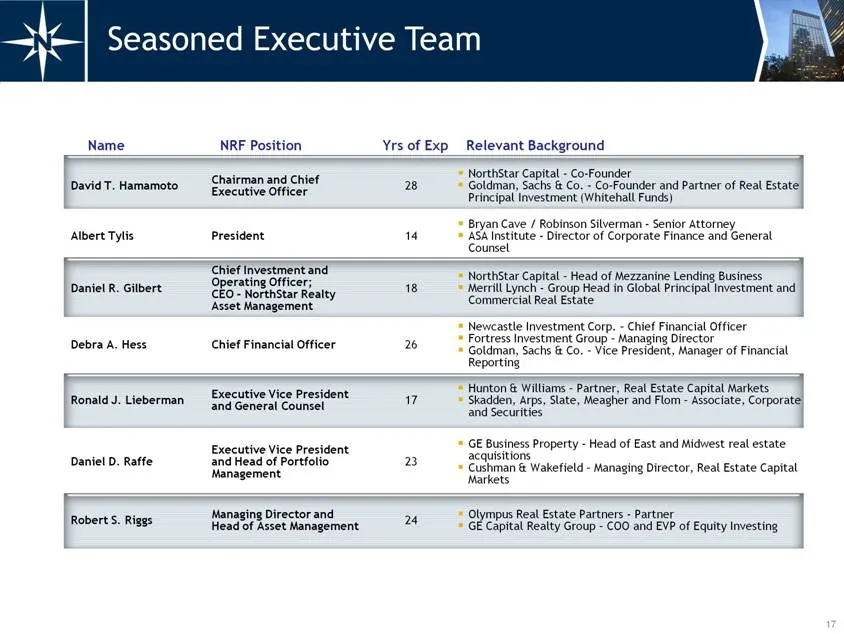
17 Seasoned Executive Team Name NRF Position Yrs of Exp Relevant Background David T. Hamamoto Chairman and Chief Executive Officer 28 NorthStar Capital - Co-Founder Goldman, Sachs & Co. - Co-Founder and Partner of Real Estate Principal Investment (Whitehall Funds) Albert Tylis President 14 Bryan Cav
Slide 19: Appendix
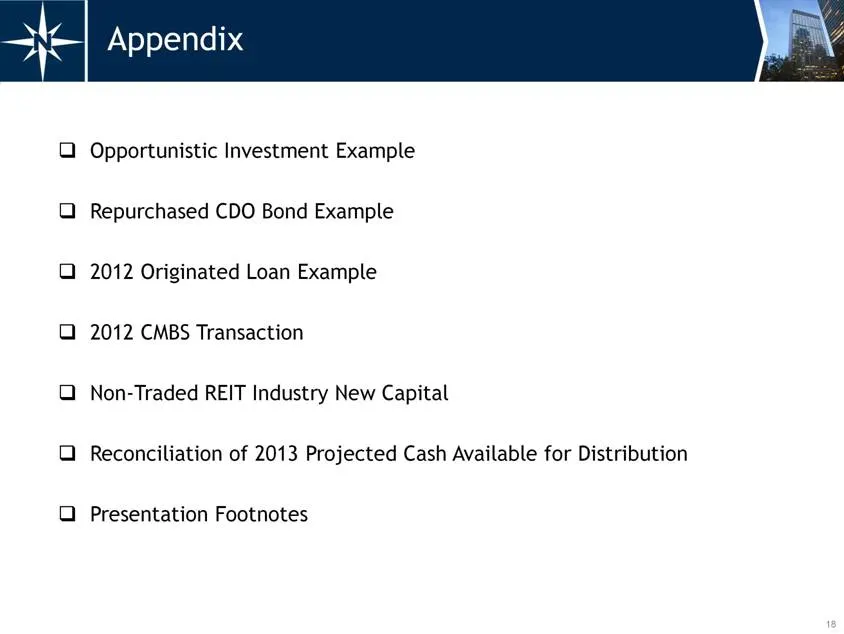
18 Appendix Opportunistic Investment Example Repurchased CDO Bond Example 2012 Originated Loan Example 2012 CMBS Transaction Non-Traded REIT Industry New Capital Reconciliation of 2013 Projected Cash Available for Distribution Presentation Footnotes
Slide 20: Opportunistic Investment Example
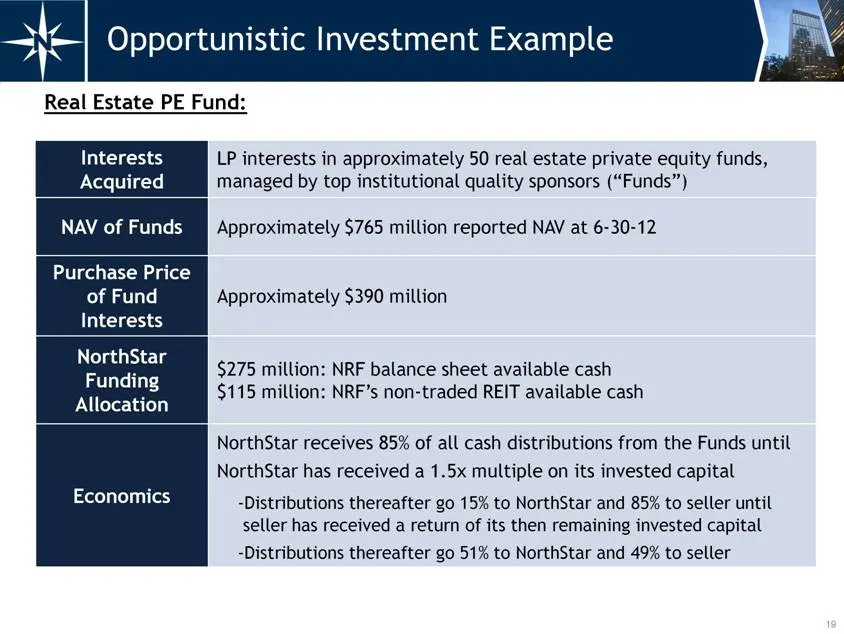
19 Opportunistic Investment Example Interests Acquired LP interests in approximately 50 real estate private equity funds, managed by top institutional quality sponsors (“Funds”) NAV of Funds Approximately $765 million reported NAV at 6-30-12 Purchase Price of Fund Interests Approximately $390 millio
Slide 21: Repurchased CDO Bond Example
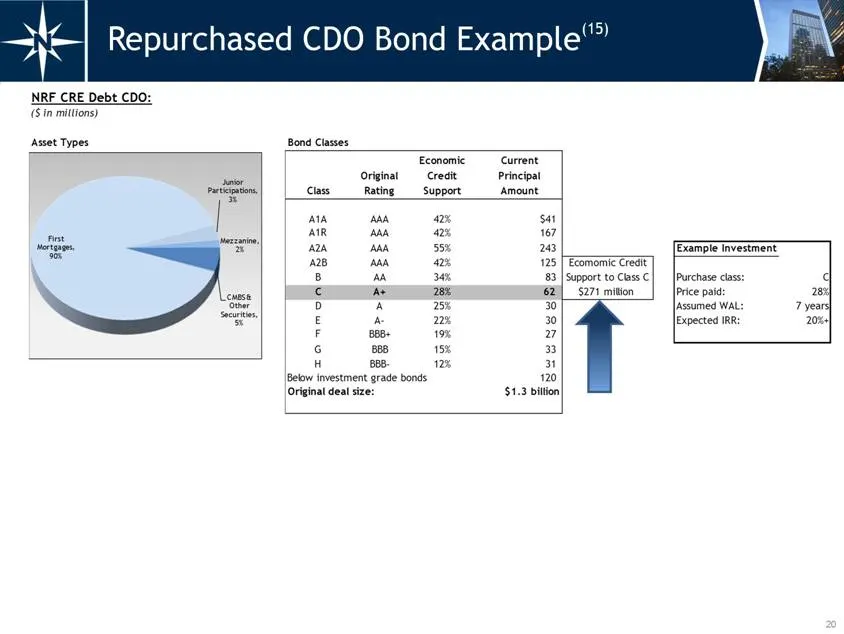
20 Repurchased CDO Bond Example(15) NRF CRE Debt CDO: ($ in millions) Asset Types Bond Classes Class Original Rating Economic Credit Support Current Principal Amount A1A AAA 42% $41 A1R AAA 42% 167 A2A AAA 55% 243 Example Investment A2B AAA 42% 125 Ecomomic Credit B AA 34% 83 Support to Class C Purc
Slide 22: 2012 Originated Loan Example
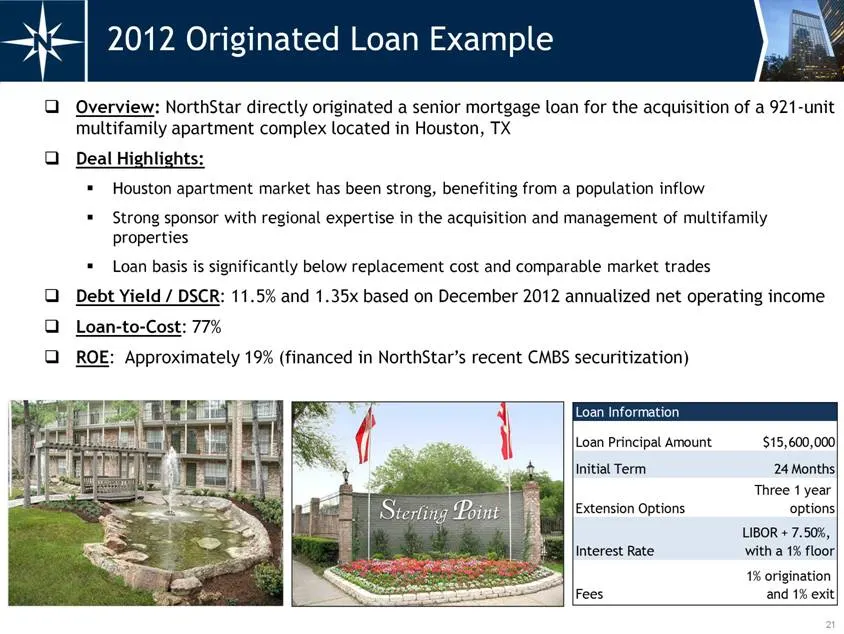
21 2012 Originated Loan Example Overview: NorthStar directly originated a senior mortgage loan for the acquisition of a 921-unit multifamily apartment complex located in Houston, TX Deal Highlights: Houston apartment market has been strong, benefiting from a population inflow Strong sponsor with reg
Slide 23: 2012 CMBS Transaction
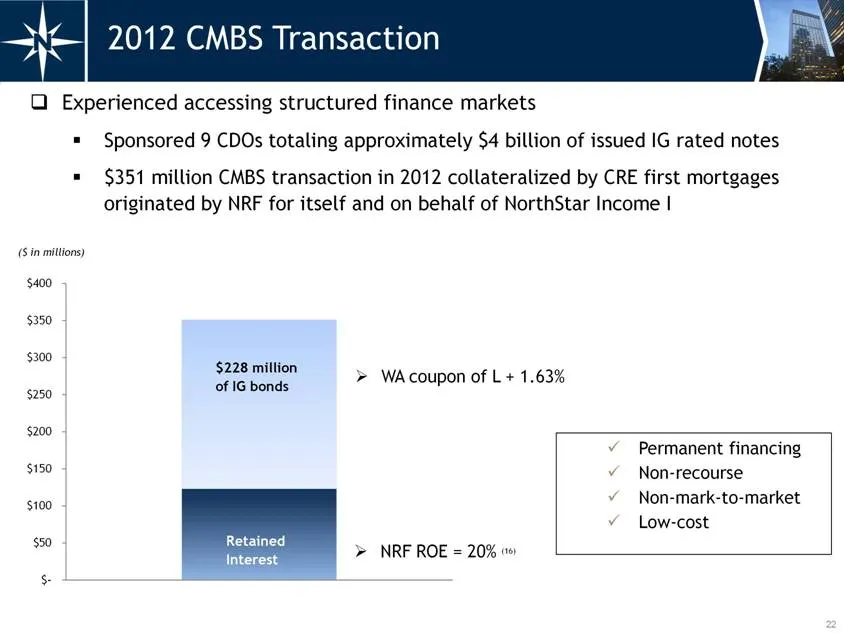
22 2012 CMBS Transaction Experienced accessing structured finance markets Sponsored 9 CDOs totaling approximately $4 billion of issued IG rated notes $351 million CMBS transaction in 2012 collateralized by CRE first mortgages originated by NRF for itself and on behalf of NorthStar Income I $228 mill
Slide 24: Non-Traded REIT Industry New Capital
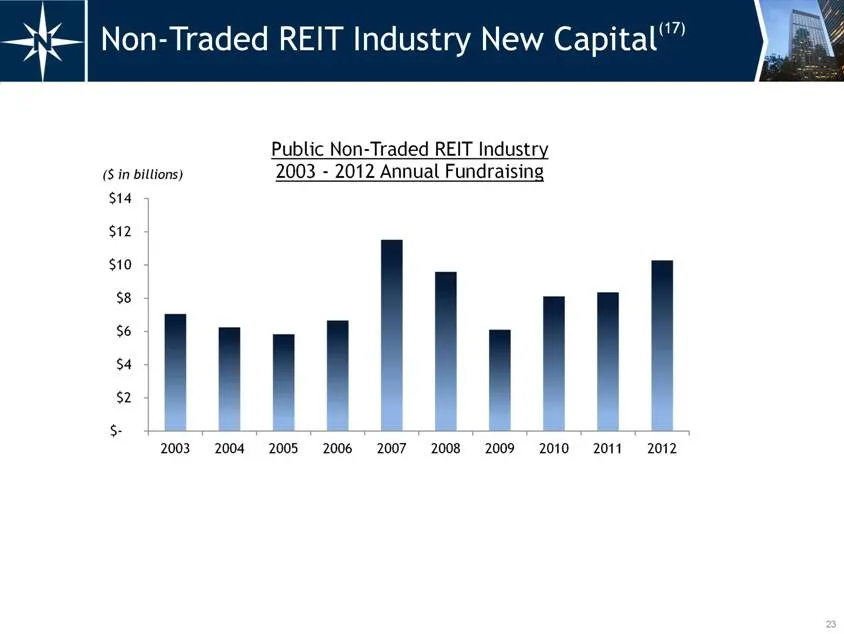
23 Non-Traded REIT Industry New Capital(17) $- $2 $4 $6 $8 $10 $12 $14 2003 2004 2005 2006 2007 2008 2009 2010 2011 2012 Public Non - Traded REIT Industry 2003 - 2012 Annual Fundraising ($ in billions)
Slide 25: Reconciliation of 2013 Projected Cash Available for Distribution
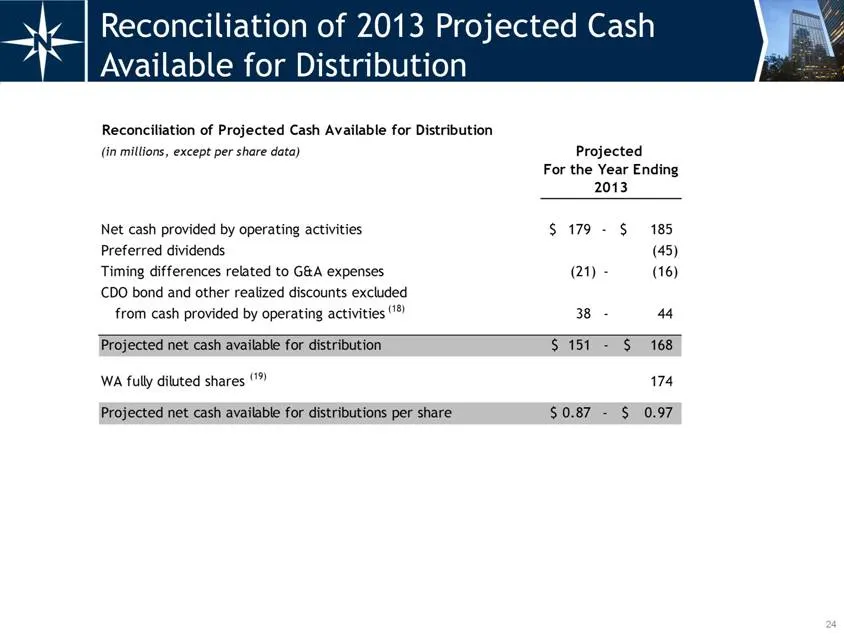
24 Reconciliation of 2013 Projected Cash Available for Distribution Reconciliation of Projected Cash Available for Distribution (in millions, except per share data) Projected For the Year Ending 2013 Net cash provided by operating activities 179 $ - 185 $ Preferred dividends (45) Timing differences
Slide 26: Presentation Footnotes
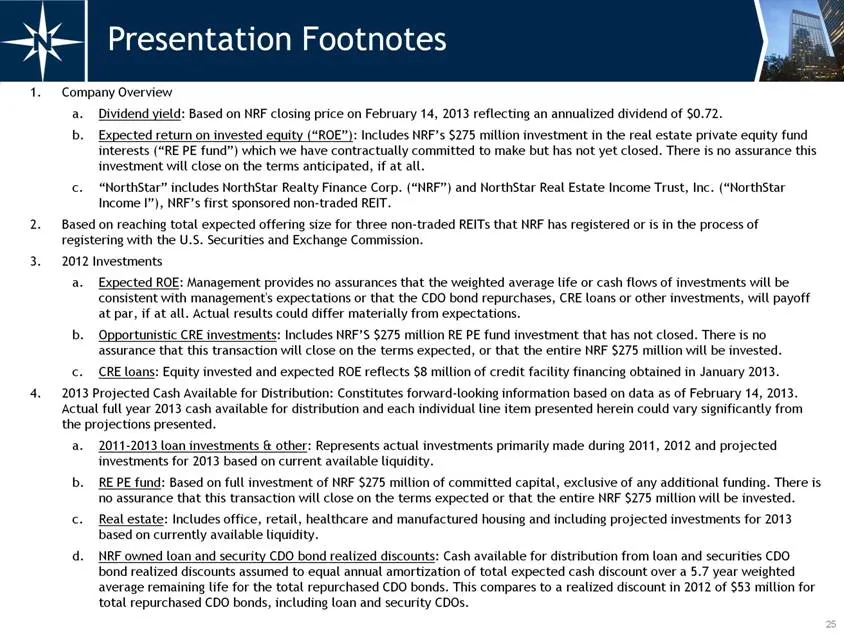
25 Presentation Footnotes Company Overview Dividend yield: Based on NRF closing price on February 14, 2013 reflecting an annualized dividend of $0.72. Expected return on invested equity (“ROE”): Includes NRF’s $275 million investment in the real estate private equity fund interests (“RE PE fund”) wh
Slide 27: Presentation Footnotes (continued)
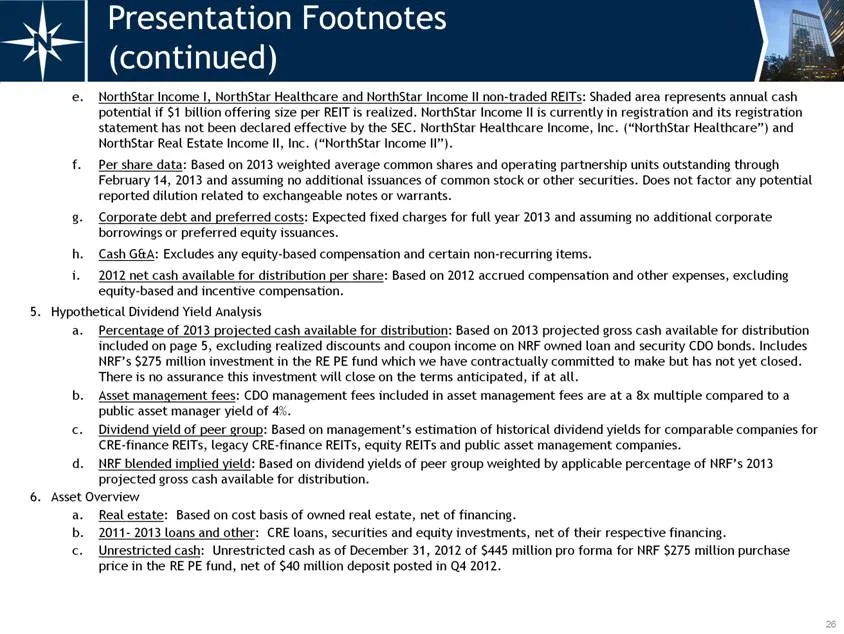
26 Presentation Footnotes (continued) NorthStar Income I, NorthStar Healthcare and NorthStar Income II non-traded REITs: Shaded area represents annual cash potential if $1 billion offering size per REIT is realized. NorthStar Income II is currently in registration and its registration statement has
Slide 28: Presentation Footnotes (continued)
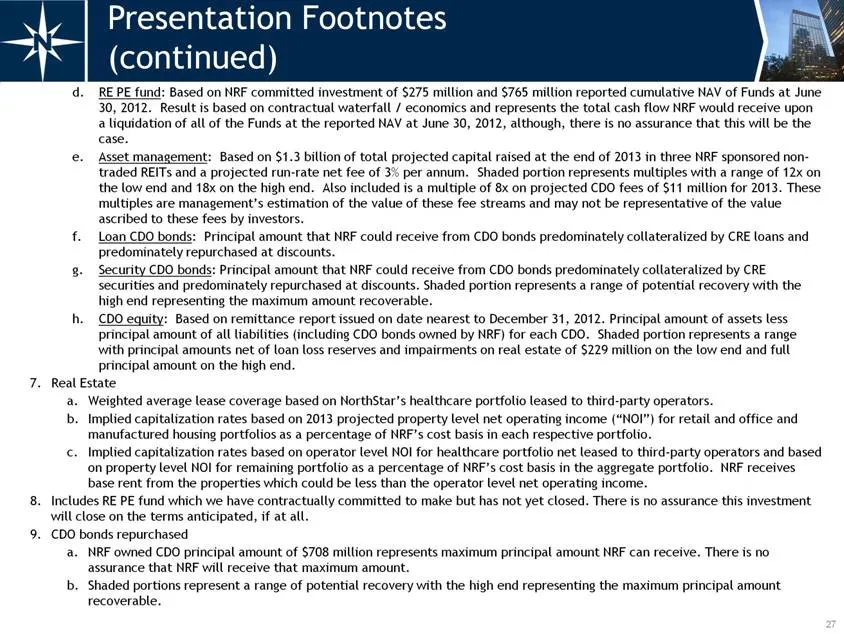
27 Presentation Footnotes (continued) RE PE fund: Based on NRF committed investment of $275 million and $765 million reported cumulative NAV of Funds at June 30, 2012. Result is based on contractual waterfall / economics and represents the total cash flow NRF would receive upon a liquidation of all
Slide 29: Presentation Footnotes (continued)
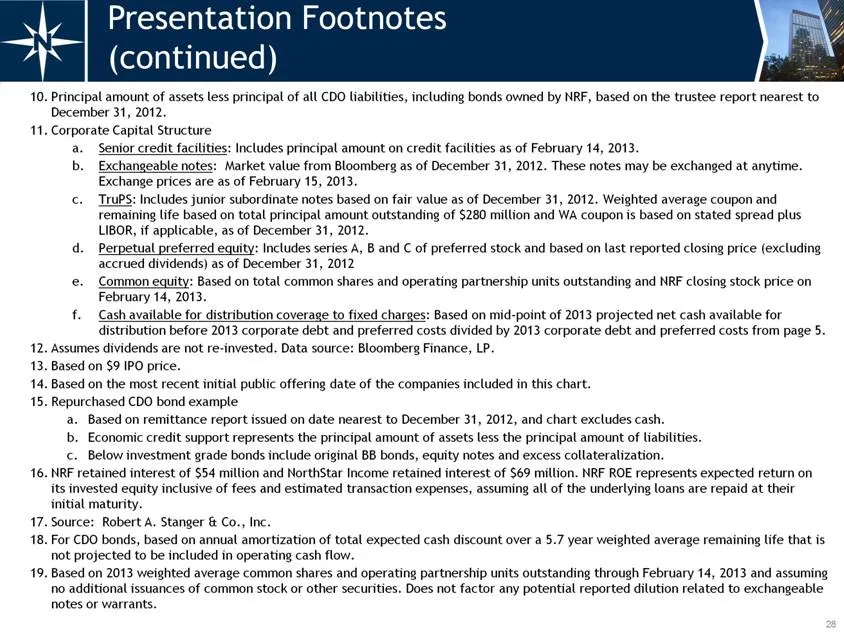
28 Presentation Footnotes (continued) Principal amount of assets less principal of all CDO liabilities, including bonds owned by NRF, based on the trustee report nearest to December 31, 2012. Corporate Capital Structure Senior credit facilities: Includes principal amount on credit facilities as of F
Source: SEC EDGAR · 8-K filed Feb 15, 2013
More decks from NorthStar Realty Finance Corp
 Merger or Acquisition (July 2016)5 slides · Jul 29, 2016
 Merger or Acquisition (June 2016)31 slides · Jun 7, 2016
 Merger or Acquisition (June 2016)27 slides · Jun 3, 2016
 Merger or Acquisition (February 2015)23 slides · Feb 26, 2015
 Investor Presentation (January 2015)14 slides · Jan 13, 2015
 Investor Presentation (August 2014)28 slides · Aug 11, 2014