NorthStar Realty Finance — Investor Presentation (August 2014)
28 slides from NorthStar Realty Finance's investor presentation, Aug 11, 2014
Slide 1: Investor Presentation August 2014
Investor Presentation August 2014 399 Park Avenue, 18th Floor, New York, NY 10022 | 212.547.2600 | nrfc.com
Slide 2: Safe Harbor
1 Safe Harbor This presentation contains certain “forward-looking statements” within the meaning of the Private Securities Litigation Reform Act of 1995, Section 27A of the Securities Act of 1933, as amended, or Securities Act, and Section 21E of the Securities Exchange Act of 1934, as amended, or E
Slide 3: Overview of NorthStar Realty Finance
Overview of NorthStar Realty Finance(1) 2 NorthStar Realty Finance (NYSE: NRF) is a premier diversified commercial real estate investment company that is organized as a REIT and is managed by NorthStar Asset Management Group Inc. (NYSE: NSAM), a global asset management firm Proven track record of in
Slide 4: NRF Consistent Outperformance
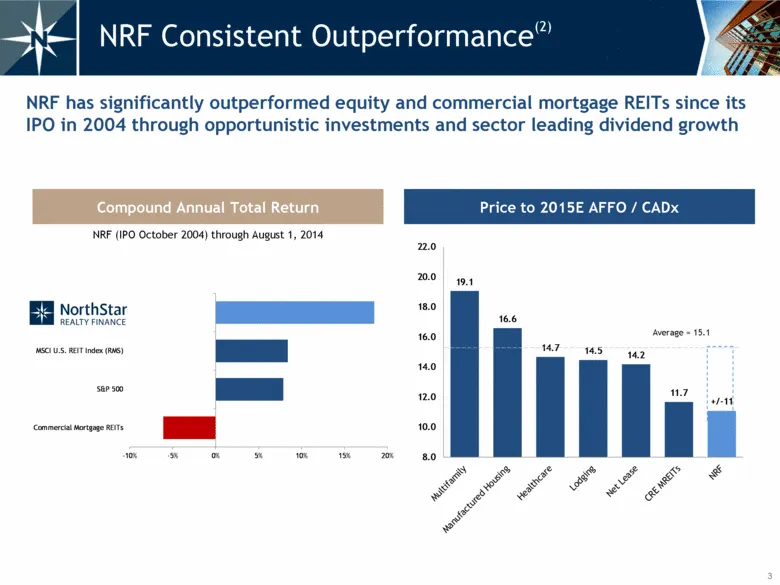
3 NRF Consistent Outperformance(2) Price to 2015E AFFO / CADx Compound Annual Total Return NRF has significantly outperformed equity and commercial mortgage REITs since its IPO in 2004 through opportunistic investments and sector leading dividend growth . NRF (IPO October 2004) through August 1, 201
Slide 5: Overview of NorthStar Realty Finance
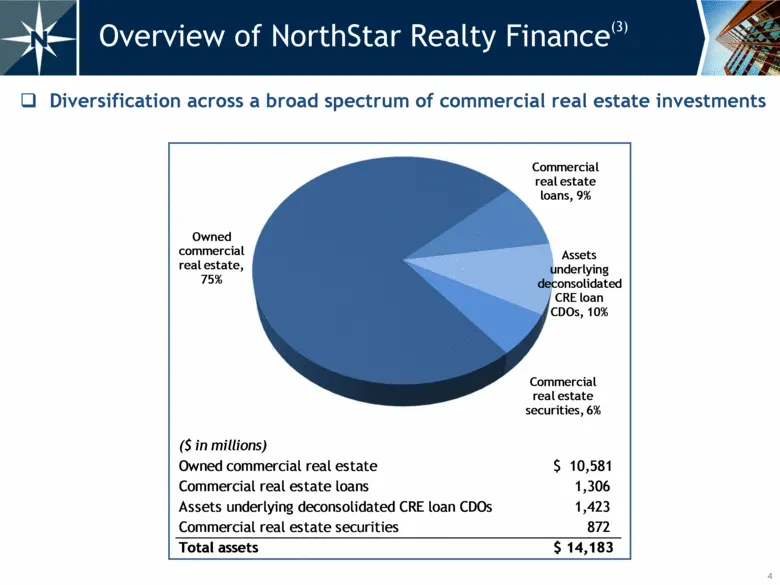
Overview of NorthStar Realty Finance(3) 4 Diversification across a broad spectrum of commercial real estate investments ($ in millions) Owned commercial real estate $ 10,581 Commercial real estate loans 1,306 Assets underlying deconsolidated CRE loan CDOs 1,423 Commercial real estate securities 872
Slide 6: NRF Q3 & Q4 2014 Annualized Projected CAD
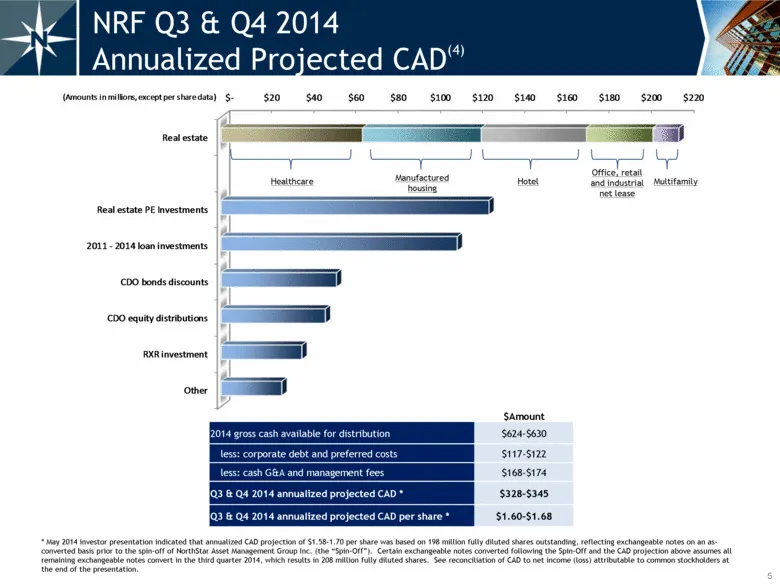
NRF Q3 & Q4 2014 Annualized Projected CAD(4) * May 2014 investor presentation indicated that annualized CAD projection of $1.58-1.70 per share was based on 198 million fully diluted shares outstanding, reflecting exchangeable notes on an as-converted basis prior to the spin-off of NorthStar Asset Ma
Slide 7: NRF Hypothetical Yield
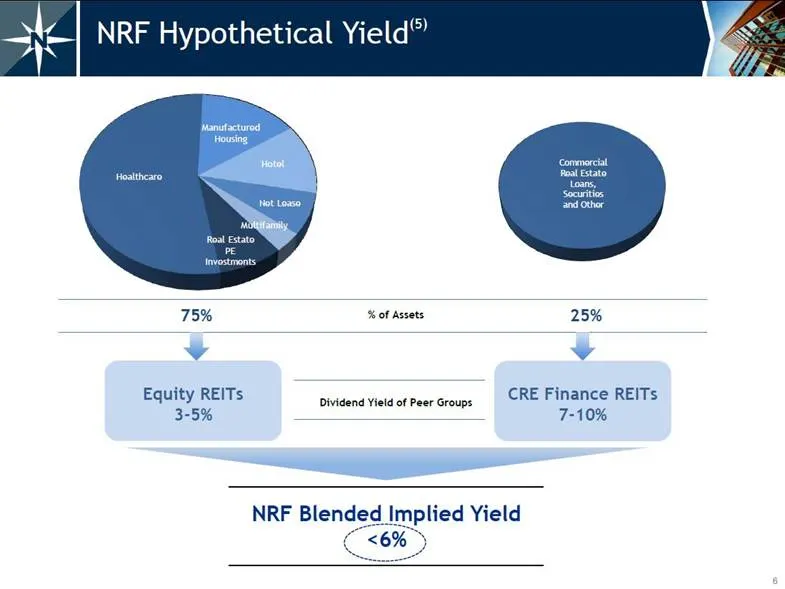
6 NRF Hypothetical Yield(5) % of Assets NRF Blended Implied Yield <6% Dividend Yield of Peer Groups Commercial Real Estate Loans, Securities and Other Healthcare Manufactured Housing Hotel Net Lease Multifamily Real Estate PE Investments
Slide 8: 2014 NRF Investments
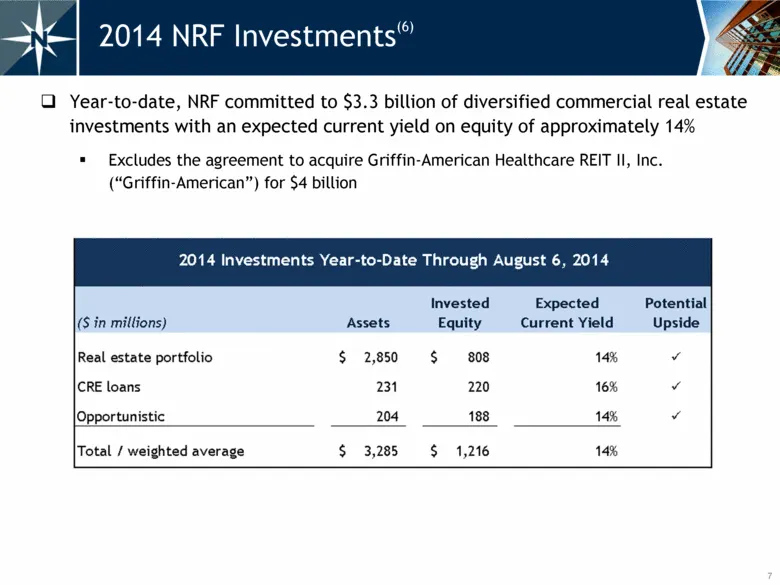
7 2014 NRF Investments(6) Year-to-date, NRF committed to $3.3 billion of diversified commercial real estate investments with an expected current yield on equity of approximately 14% Excludes the agreement to acquire Griffin-American Healthcare REIT II, Inc. (“Griffin-American”) for $4 billion
Slide 9: NRF Real Estate Portfolio – Healthcare
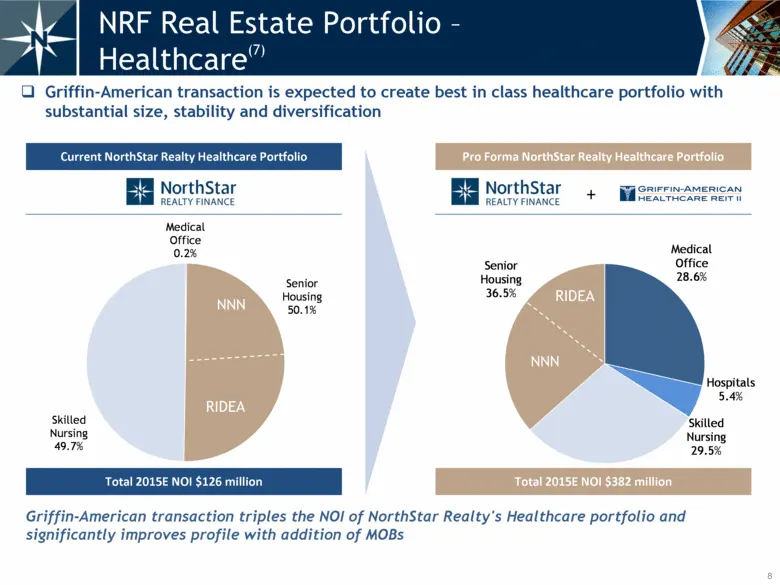
8 NRF Real Estate Portfolio – Healthcare(7) Pro Forma NorthStar Realty Healthcare Portfolio Current NorthStar Realty Healthcare Portfolio + Griffin-American transaction is expected to create best in class healthcare portfolio with substantial size, stability and diversification Griffin-American tran
Slide 10: NRF Real Estate Portfolio – Healthcare
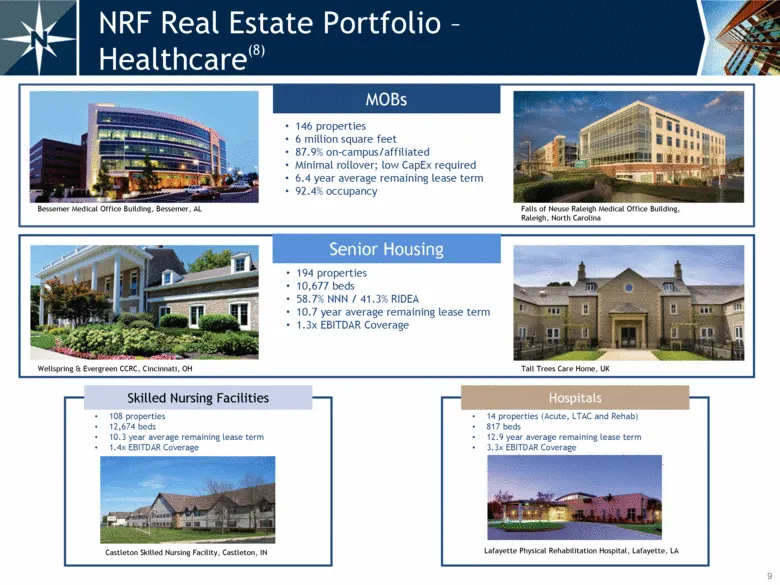
9 NRF Real Estate Portfolio – Healthcare(8) 146 properties 6 million square feet 87.9% on-campus/affiliated Minimal rollover; low CapEx required 6.4 year average remaining lease term 92.4% occupancy 194 properties 10,677 beds 58.7% NNN / 41.3% RIDEA 10.7 year average remaining lease term 1.3x EBITDA
Slide 11: NRF Real Estate Portfolio – Healthcare
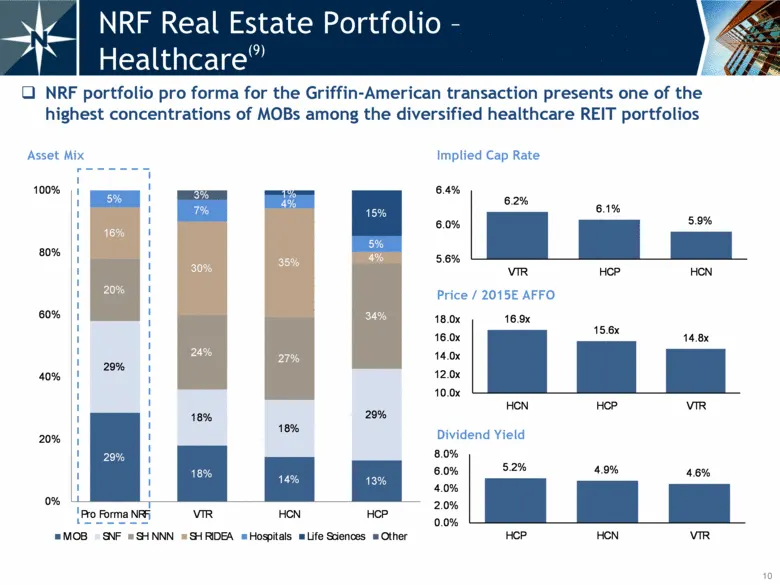
10 NRF Real Estate Portfolio – Healthcare(9) NRF portfolio pro forma for the Griffin-American transaction presents one of the highest concentrations of MOBs among the diversified healthcare REIT portfolios Asset Mix Implied Cap Rate Price / 2015E AFFO Dividend Yield 29% 18% 14% 13% 29% 18% 18% 29% 2
Slide 12: NRF Real Estate Portfolio – Manufactured Housing
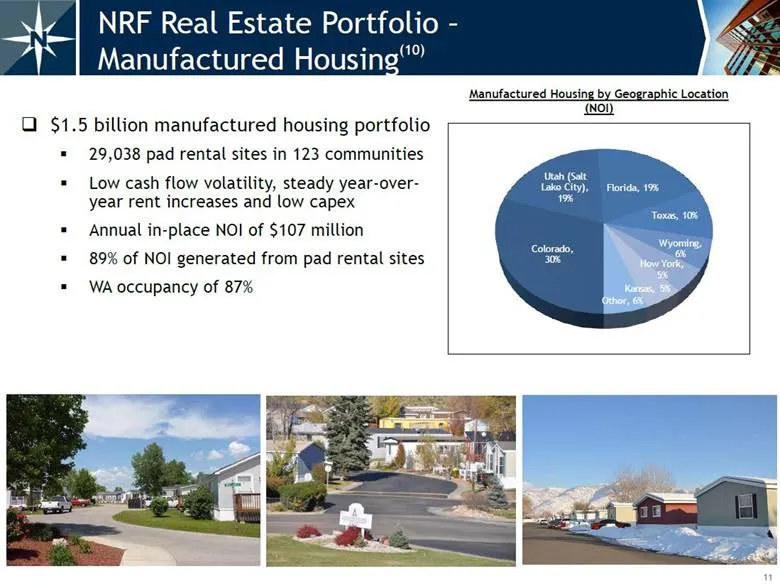
11 $1.5 billion manufactured housing portfolio 29,038 pad rental sites in 123 communities Low cash flow volatility, steady year-over-year rent increases and low capex Annual in-place NOI of $107 million 89% of NOI generated from pad rental sites WA occupancy of 87% NRF Real Estate Portfolio – Manufa
Slide 13: NRF Real Estate Portfolio – Hotel
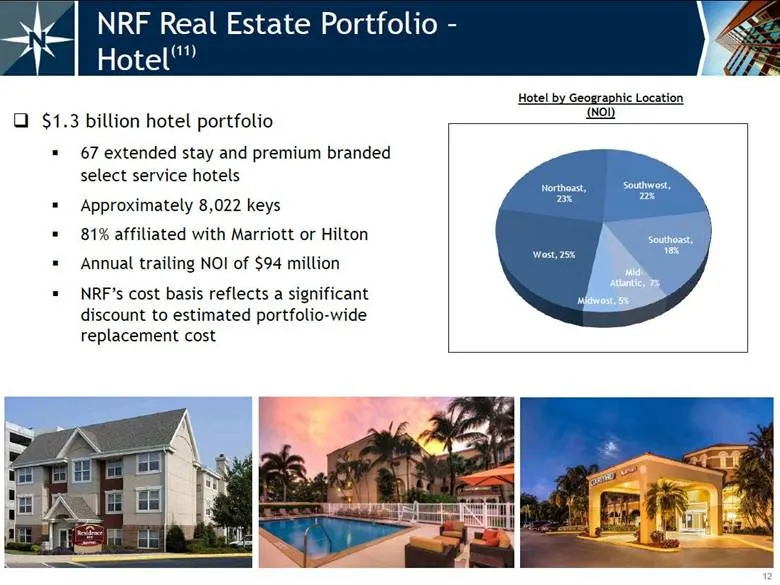
12 $1.3 billion hotel portfolio 67 extended stay and premium branded select service hotels Approximately 8,022 keys 81% affiliated with Marriott or Hilton Annual trailing NOI of $94 million NRF’s cost basis reflects a significant discount to estimated portfolio-wide replacement cost NRF Real Estate
Slide 14: NRF Real Estate Portfolio – Other
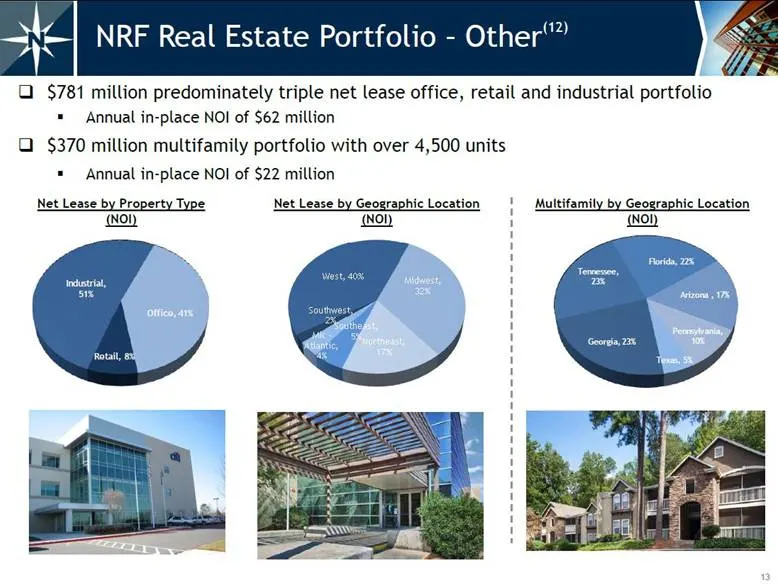
13 NRF Real Estate Portfolio – Other(12) $781 million predominately triple net lease office, retail and industrial portfolio Annual in-place NOI of $62 million $370 million multifamily portfolio with over 4,500 units Annual in-place NOI of $22 million Net Lease by Property Type (NOI) Net Lease by Ge
Slide 15: NRF New Loan Originations
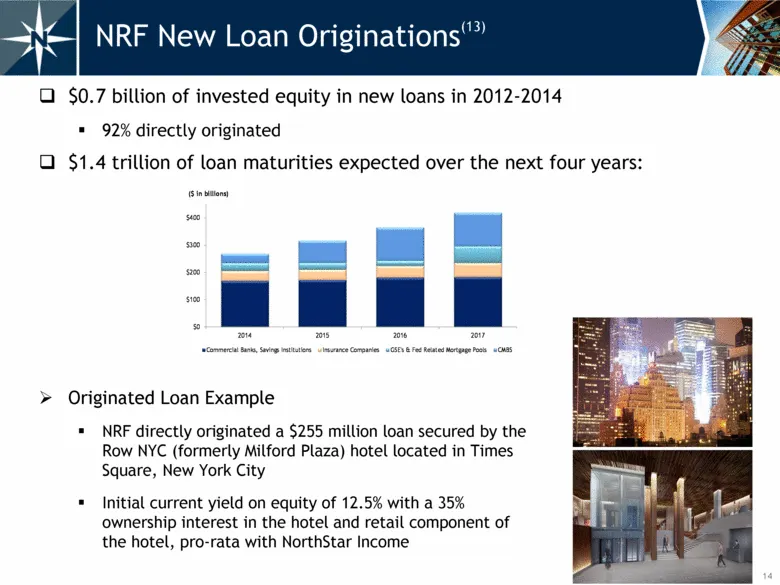
14 NRF New Loan Originations(13) $0.7 billion of invested equity in new loans in 2012-2014 92% directly originated $1.4 trillion of loan maturities expected over the next four years: Originated Loan Example NRF directly originated a $255 million loan secured by the Row NYC (formerly Milford Plaza) h
Slide 16: RXR Investment
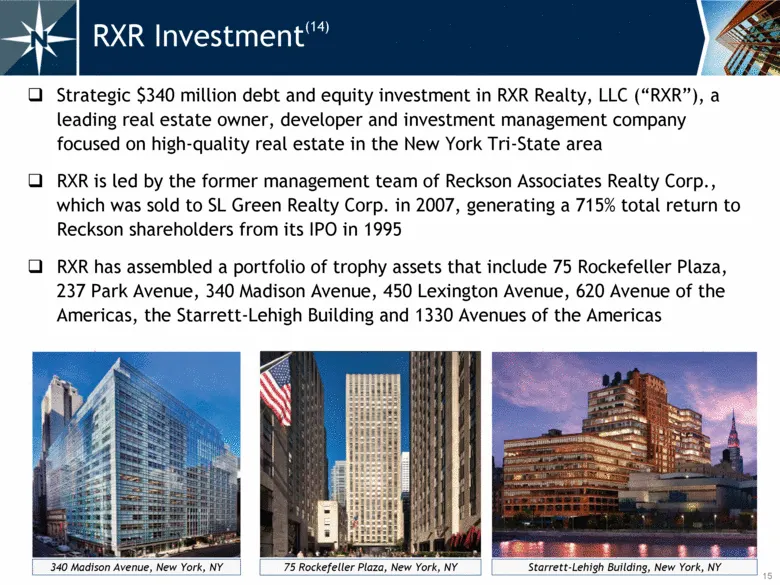
15 RXR Investment(14) Strategic $340 million debt and equity investment in RXR Realty, LLC (“RXR”), a leading real estate owner, developer and investment management company focused on high-quality real estate in the New York Tri-State area RXR is led by the former management team of Reckson Associat
Slide 17: Aerium Investment / European Investments
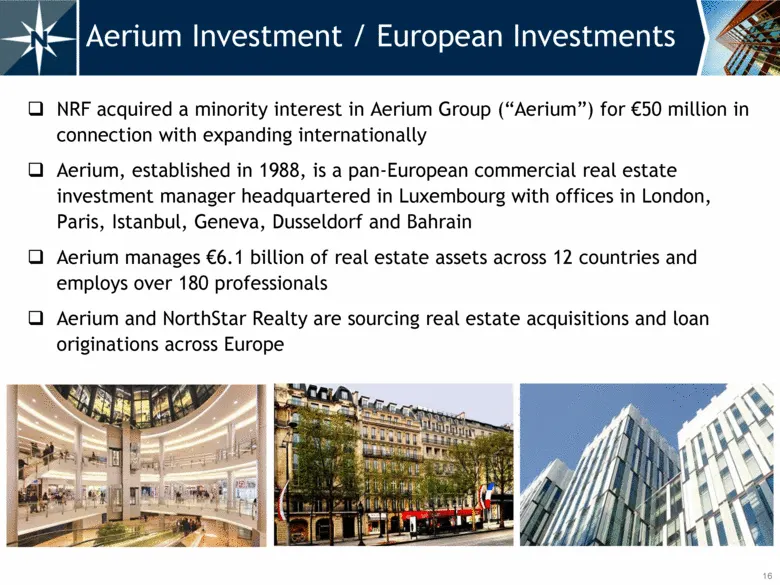
16 Aerium Investment / European Investments NRF acquired a minority interest in Aerium Group (“Aerium”) for €50 million in connection with expanding internationally Aerium, established in 1988, is a pan-European commercial real estate investment manager headquartered in Luxembourg with offices in Lo
Slide 18: NRF Real Estate PE Investments
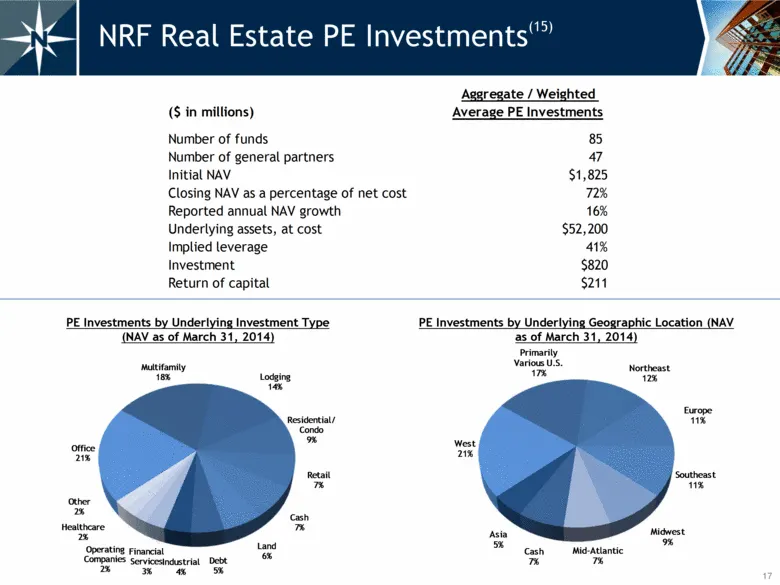
17 NRF Real Estate PE Investments(15) PE Investments by Underlying Geographic Location (NAV as of March 31, 2014) PE Investments by Underlying Investment Type (NAV as of March 31, 2014) West 21% Primarily Various U.S. 17% Northeast 12% Europe 11% Southeast 11% Midwest 9% Mid - Atlantic 7% Cash 7% As
Slide 19: NRF CDO Bonds Repurchased
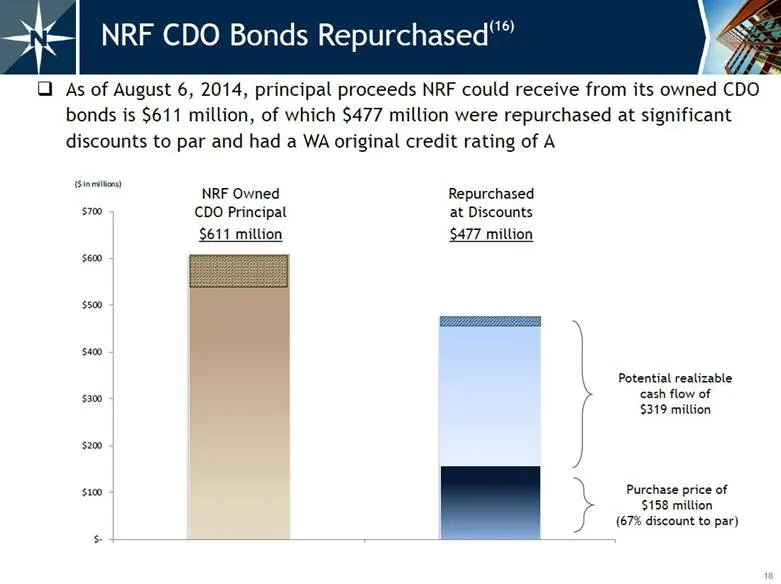
18 As of August 6, 2014, principal proceeds NRF could receive from its owned CDO bonds is $611 million, of which $477 million were repurchased at significant discounts to par and had a WA original credit rating of A Potential realizable cash flow of $319 million Purchase price of $158 million (67% d
Slide 20: Management Team
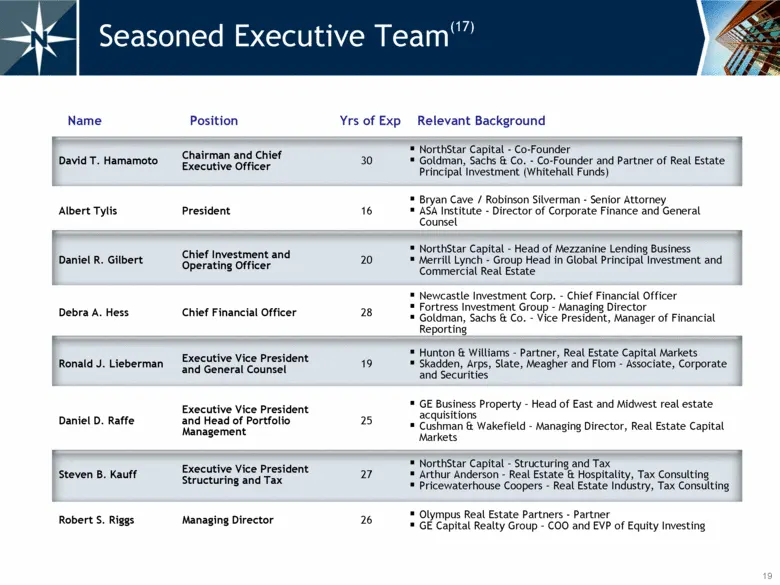
19 Name Position Yrs of Exp Relevant Background David T. Hamamoto Chairman and Chief Executive Officer 30 NorthStar Capital - Co-Founder Goldman, Sachs & Co. - Co-Founder and Partner of Real Estate Principal Investment (Whitehall Funds) Albert Tylis President 16 Bryan Cave / Robinson Silverman - Sen
Slide 21: Appendix
20 Appendix PE Investment Examples Reconciliation of NRF Q3 & Q4 2014 Annualized Projected Cash Available for Distribution Presentation Endnotes
Slide 22: PE Investments Example
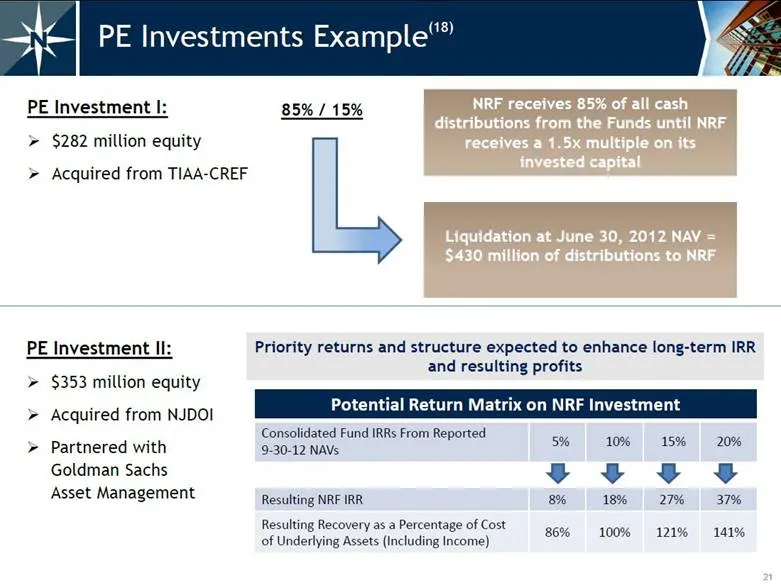
21 PE Investments Example(18) PE Investment I: $282 million equity Acquired from TIAA-CREF Potential Return Matrix on NRF Investment Consolidated Fund IRRs From Reported 9-30-12 NAVs 5% 10% 15% 20% Resulting NRF IRR 8% 18% 27% 37% Resulting Recovery as a Percentage of Cost of Underlying Assets (Incl
Slide 23: Reconciliation of NRF Q3 & Q4 2014 Annualized Projected CAD
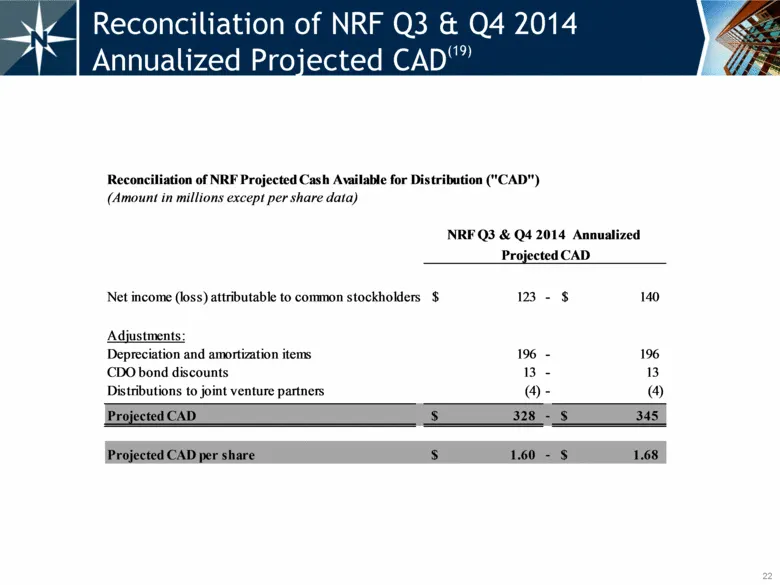
22 Reconciliation of NRF Q3 & Q4 2014 Annualized Projected CAD(19) Reconciliation of NRF Projected Cash Available for Distribution ("CAD") (Amount in millions except per share data) NRF Q3 & Q4 2014 Annualized Projected CAD Net income (loss) attributable to common stockholders 123 $ - 140 $ Adjustme
Slide 24: Presentation Endnotes
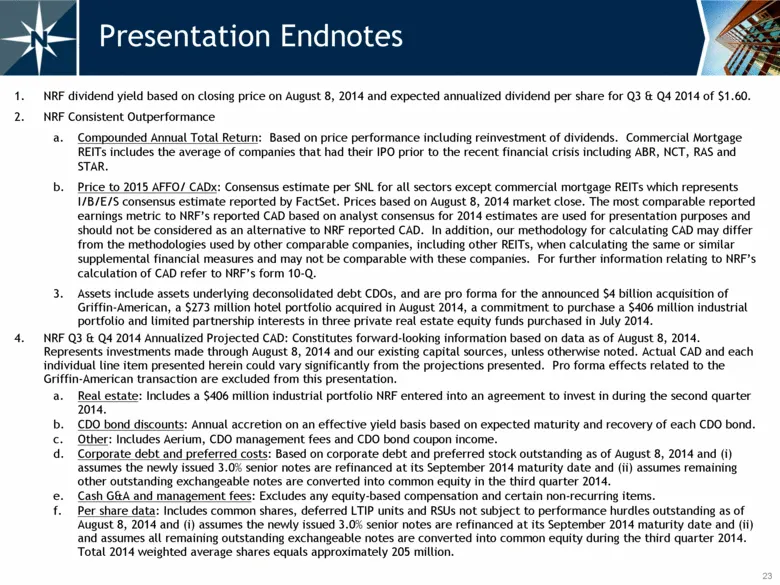
23 Presentation Endnotes NRF dividend yield based on closing price on August 8, 2014 and expected annualized dividend per share for Q3 & Q4 2014 of $1.60. NRF Consistent Outperformance Compounded Annual Total Return: Based on price performance including reinvestment of dividends. Commercial Mortgage
Slide 25: Assets are as of June 30, 2014 pro forma for the announced $4 billion
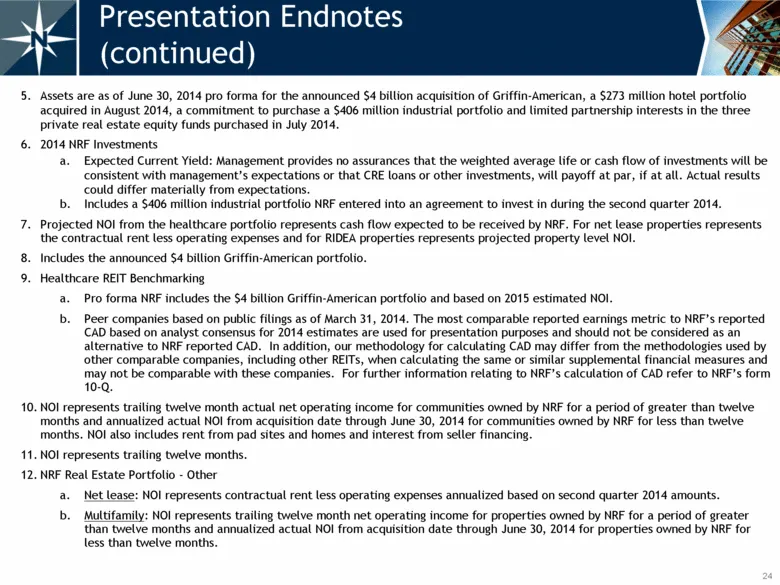
24 Assets are as of June 30, 2014 pro forma for the announced $4 billion acquisition of Griffin-American, a $273 million hotel portfolio acquired in August 2014, a commitment to purchase a $406 million industrial portfolio and limited partnership interests in the three private real estate equity fun
Slide 26: New Loan Originations
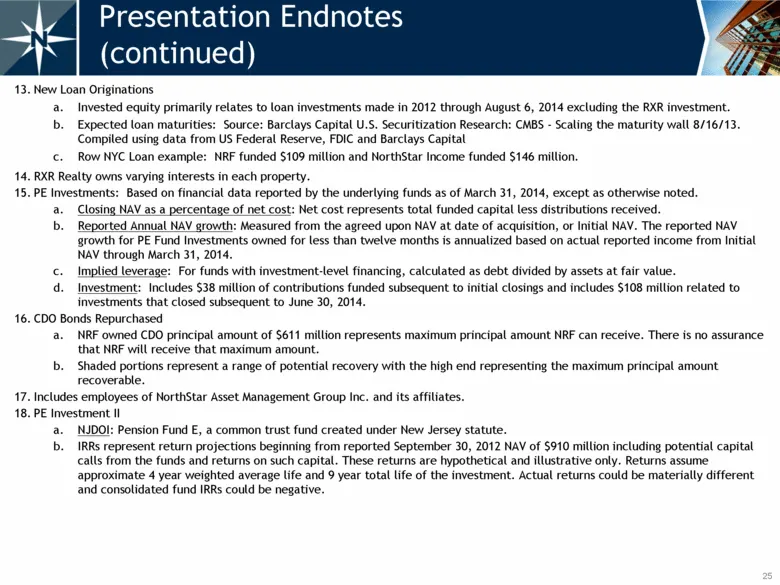
25 New Loan Originations Invested equity primarily relates to loan investments made in 2012 through August 6, 2014 excluding the RXR investment. Expected loan maturities: Source: Barclays Capital U.S. Securitization Research: CMBS - Scaling the maturity wall 8/16/13. Compiled using data from US Fede
Slide 27: Reconciliation of NRF Projected Q3 & Q4 2014 Annualized Projected CAD
26 Reconciliation of NRF Projected Q3 & Q4 2014 Annualized Projected CAD CDO bond discounts: For CAD, discount on CDO bonds are accreted on an effective yield basis based on expected maturity and recovery of each CDO bond. Depreciation and amortization items: Projected 2014 CAD includes depreciation
Slide 28: Park Avenue, 18th Floor, New York, NY 10022 | 212.547.2600 | nrfc.com
27 399 Park Avenue, 18th Floor, New York, NY 10022 | 212.547.2600 | nrfc.com
Source: SEC EDGAR · 8-K filed Aug 11, 2014
More decks from NorthStar Realty Finance Corp
 Merger or Acquisition (July 2016)5 slides · Jul 29, 2016
 Merger or Acquisition (June 2016)31 slides · Jun 7, 2016
 Merger or Acquisition (June 2016)27 slides · Jun 3, 2016
 Merger or Acquisition (February 2015)23 slides · Feb 26, 2015
 Investor Presentation (January 2015)14 slides · Jan 13, 2015
 Merger or Acquisition (August 2014)12 slides · Aug 5, 2014