NorthStar Realty Finance — Merger or Acquisition (February 2015)
23 slides from NorthStar Realty Finance's merger presentation, Feb 26, 2015
Slide 1: European Spin-off Overview
European Spin-off Overview February 2015 399 Park Avenue, 18th Floor, New York, NY 10022 | 212.547.2600 | NRFC.com
Slide 2: Safe Harbor
1 Safe Harbor This presentation contains certain “forward-looking statements,” within the meaning of the Private Securities Litigation Reform Act of 1995, Section 27A of the Securities Act of 1933, as amended and Section 21E of the Securities Exchange Act of 1934, as amended, including statements ab
Slide 3: Table of Contents
I. Executive Summary II. Europe Market Opportunity III. Transaction Summary IV. Portfolio Overview V. NorthStar Realty Finance Table of Contents
Slide 4: Executive Summary – Creating a Europe-Focused REIT
I. Executive Summary – Creating a Europe-Focused REIT . NorthStar Realty Finance Corp. (“NorthStar Realty”, “NRF” or the “Company”) is a diversified, publicly traded U.S. REIT with total assets of approximately $18.5 billion (1) . NorthStar Realty invests in a variety of property types in the U.S. a
Slide 5: Europe Market Opportunity – Yield Spreads
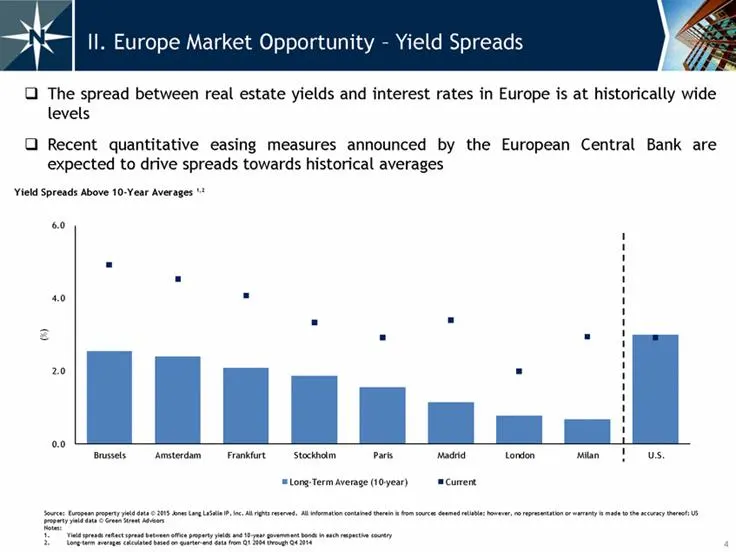
NREIT-2ndtier-bue-bar4 II. Europe Market Opportunity – Yield Spreads .The spread between real estate yields and interest rates in Europe is at historically wide levels .Recent quantitative easing measures announced by the European Central Bank are expected to drive spreads towards historical average
Slide 6: The Real Estate Cycle - U.K. & Europe
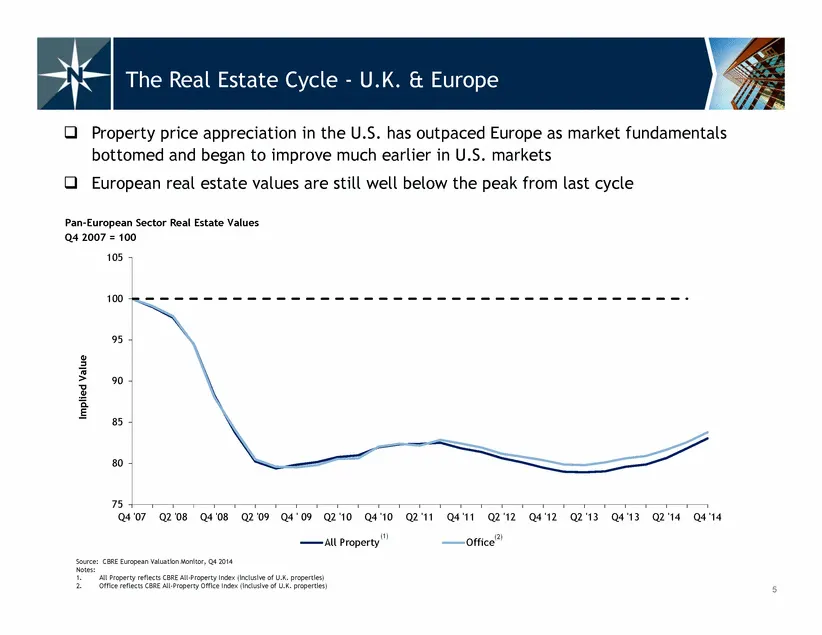
75 80 85 90 95 100 105 Q4 '07 Q2 '08 Q4 '08 Q2 '09 Q4 ' 09 Q2 '10 Q4 '10 Q2 '11 Q4 '11 Q2 '12 Q4 '12 Q2 '13 Q4 '13 Q2 '14 Q4 '14 Implied Value All Property Office . Property price appreciation in the U.S. has outpaced Europe as market fundamentals bottomed and began to improve much earlier in U.S. m
Slide 7: Strong Public Market Signal
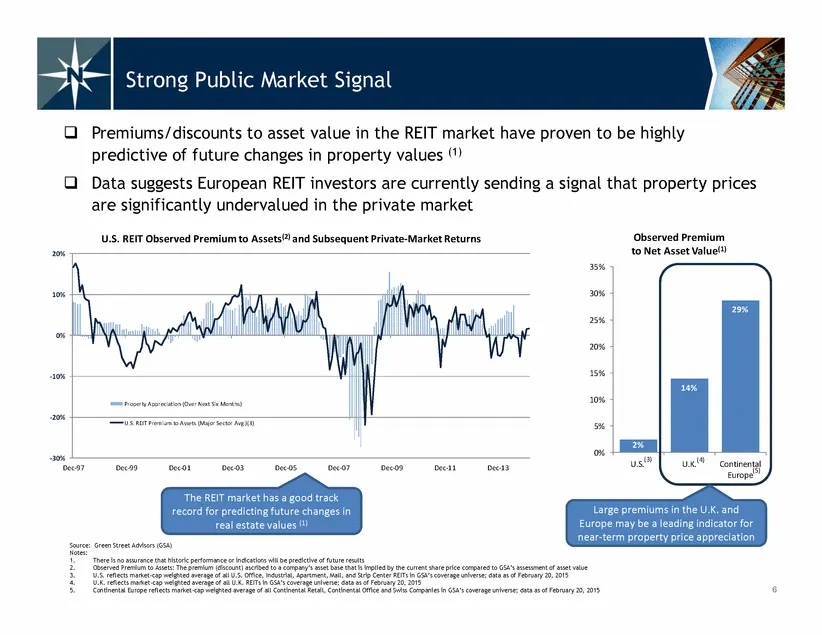
-30% -20% -10% 0% 10% 20% Dec-97 Dec-99 Dec-01 Dec-03 Dec-05 Dec-07 Dec-09 Dec-11 Dec-13 U.S. REIT Observed Premium to Assets(2) and Subsequent Private-Market Returns Property Appreciation (Over Next Six Months) U.S. REIT Premium to Assets (Major Sector Avg.)(3) 2% 14% 29% 0% 5% 10% 15% 20% 25% 30%
Slide 8: Our Competitive Advantages
7 Our Competitive Advantages . We believe NorthStar Realty Europe will enjoy competitive advantages over competing European investment vehicles and will be uniquely positioned to benefit from the ongoing recovery in the European real estate market . Superior access to capital via U.S. equity markets
Slide 9: III. Transaction Summary
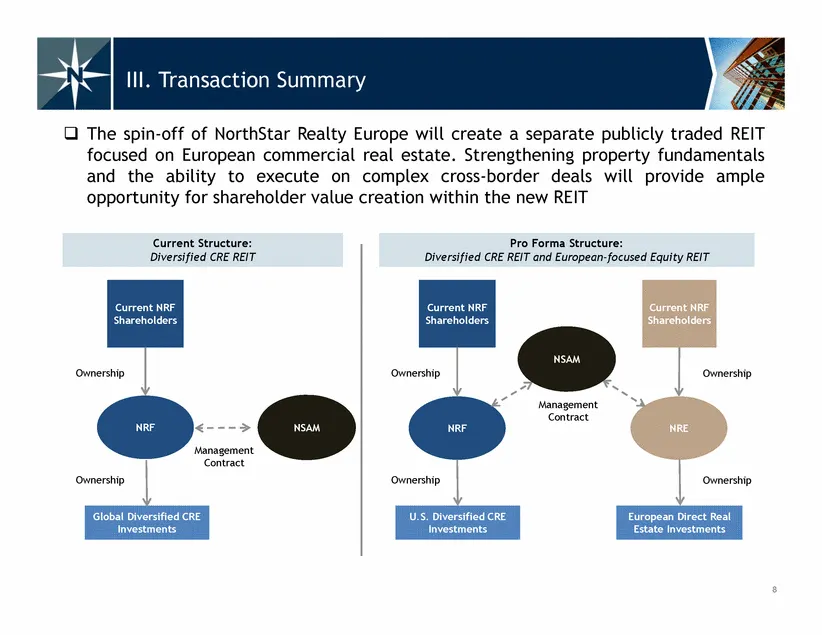
8 III. Transaction Summary . The spin-off of NorthStar Realty Europe will create a separate publicly traded REIT focused on European commercial real estate. Strengthening property fundamentals and the ability to execute on complex cross-border deals will provide ample opportunity for shareholder val
Slide 10: Transaction Summary (cont’d)
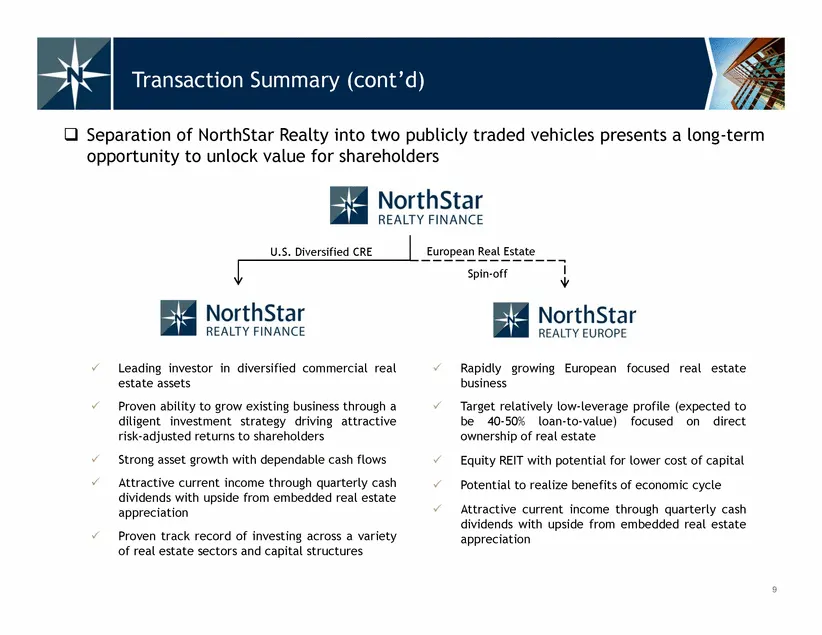
9 Transaction Summary (cont’d) . Leading investor in diversified commercial real estate assets . Proven ability to grow existing business through a diligent investment strategy driving attractive risk-adjusted returns to shareholders . Strong asset growth with dependable cash flows . Attractive curr
Slide 11: Transaction Rationale
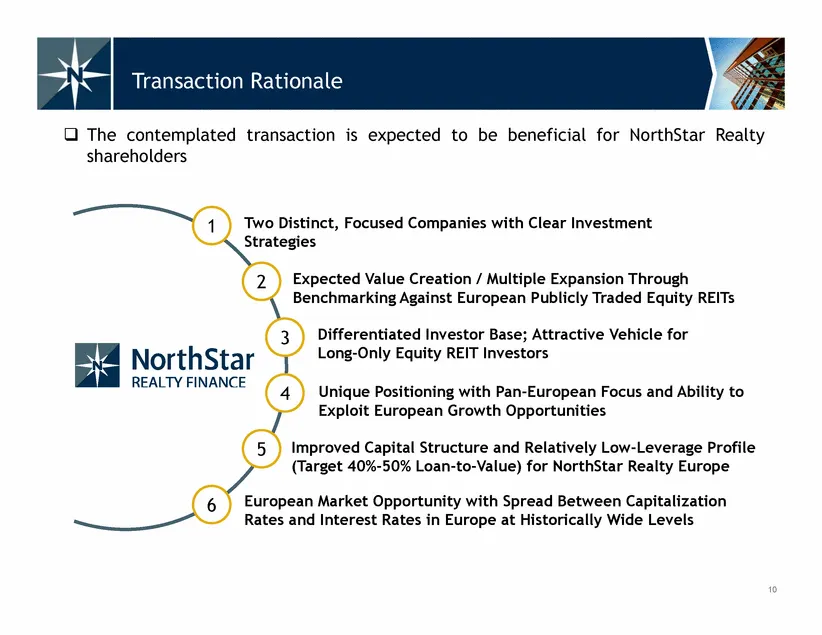
10 Transaction Rationale Two Distinct, Focused Companies with Clear Investment Strategies Expected Value Creation / Multiple Expansion Through Benchmarking Against European Publicly Traded Equity REITs Differentiated Investor Base; Attractive Vehicle for Long-Only Equity REIT Investors Unique Positi
Slide 12: Transaction Detail
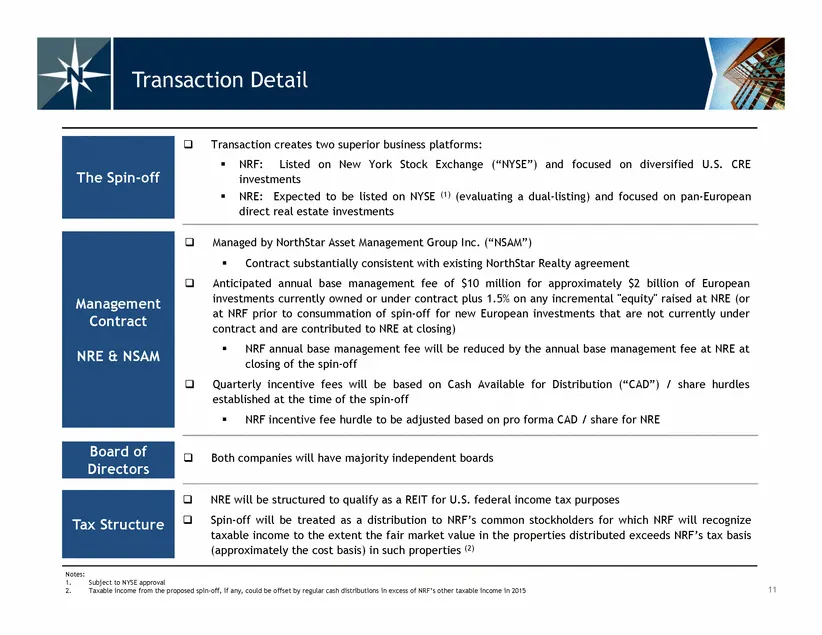
. Managed by NorthStar Asset Management Group Inc. (“NSAM”) . Contract substantially consistent with existing NorthStar Realty agreement . Anticipated annual base management fee of $10 million for approximately $2 billion of European investments currently owned or under contract plus 1.5% on any inc
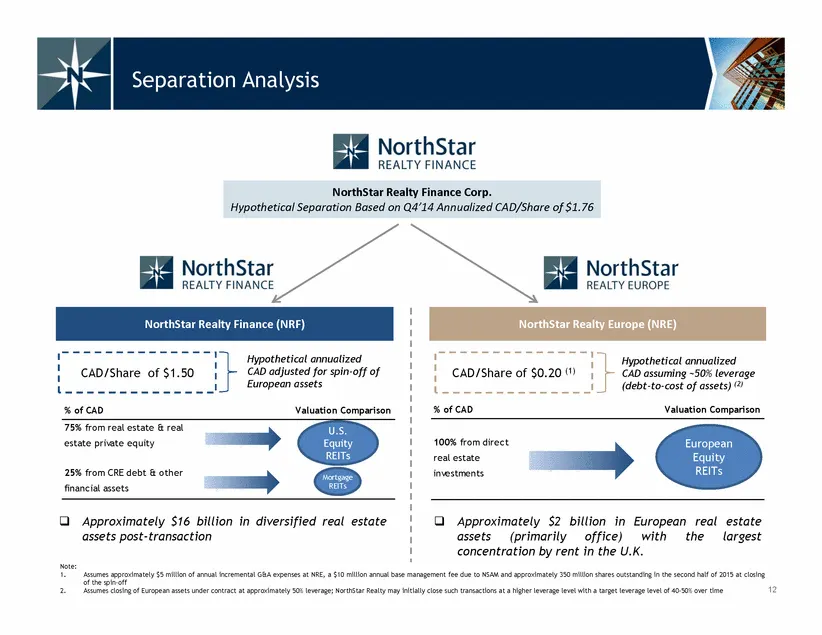
Slide 13: Separation Analysis / Valuation Comparison
% of CAD Valuation Comparison 75% from real estate & real estate private equity 25% from CRE debt & other financial assets % of CAD Valuation Comparison 100% from direct real estate investments NorthStar Realty Europe (NRE) NorthStar Realty Finance Corp. Hypothetical Separation Based on Q4’14 Annual
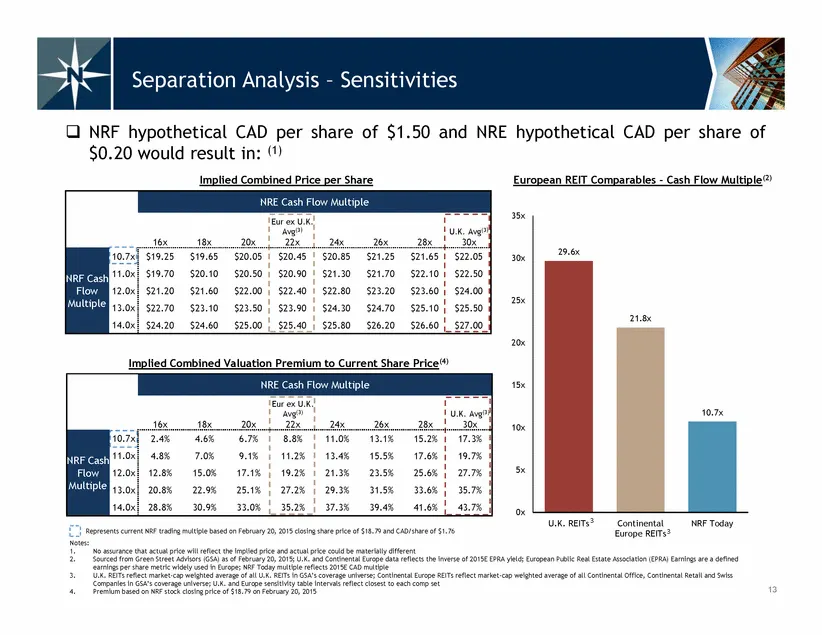
Slide 14: NRE Cash Flow Multiple Sensitivity
29.6x 21.8x 10.7x 0x 5x 10x 15x 20x 25x 30x 35x U.K. REITs Continental Europe REITs NRF Today 13 NRE Cash Flow Multiple 16x 18x 20x Eur ex U.K. Avg(3) 22x 24x 26x 28x U.K. Avg(3) 30x NRF Cash Flow Multiple 10.7x 2.4% 4.6% 6.7% 8.8% 11.0% 13.1% 15.2% 17.3% 11.0x 4.8% 7.0% 9.1% 11.2% 13.4% 15.5% 17.6%
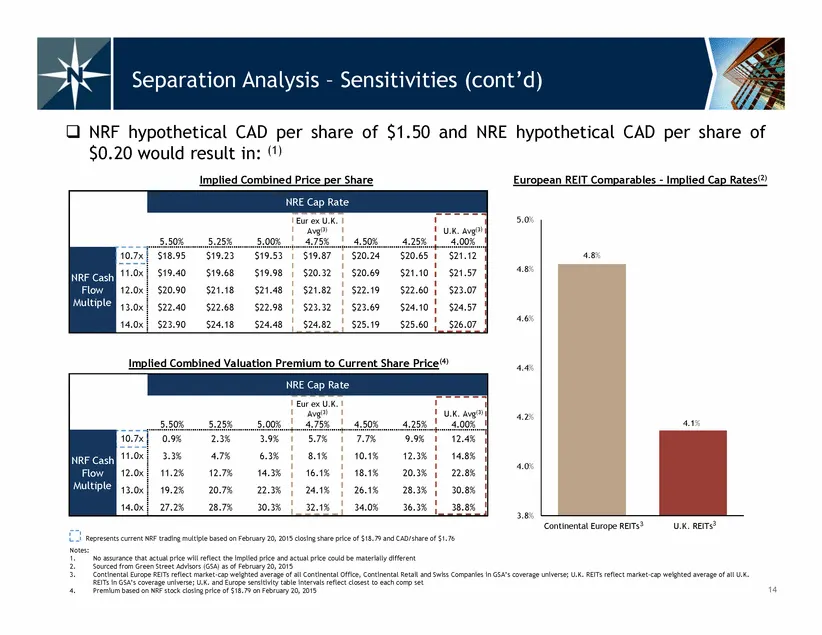
Slide 15: NRE Cap Rate Sensitivity
4.8% 4.1% 3.8% 4.0% 4.2% 4.4% 4.6% 4.8% 5.0% Continental Europe REITs U.K. REITs 14 NRE Cap Rate 5.50% 5.25% 5.00% Eur ex U.K. Avg(3) 4.75% 4.50% 4.25% U.K. Avg(3) 4.00% NRF Cash Flow Multiple 10.7x $18.95 $19.23 $19.53 $19.87 $20.24 $20.65 $21.12 11.0x $19.40 $19.68 $19.98 $20.32 $20.69 $21.10 $21.
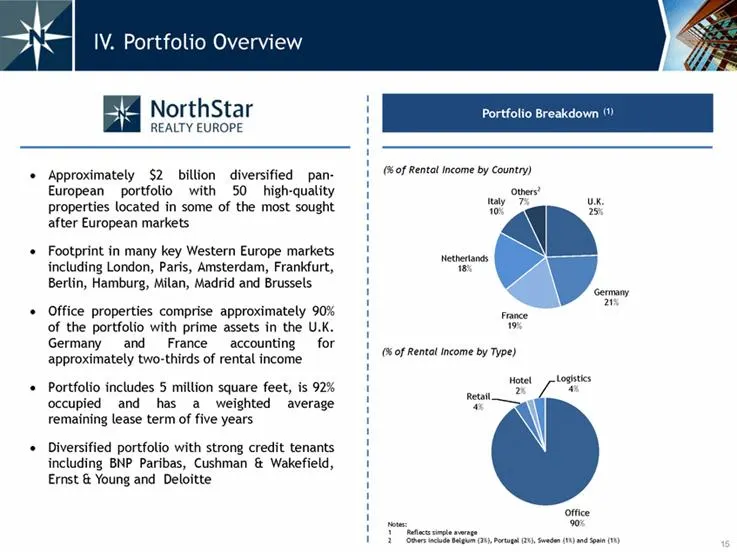
Slide 16: IV. Portfolio Overview
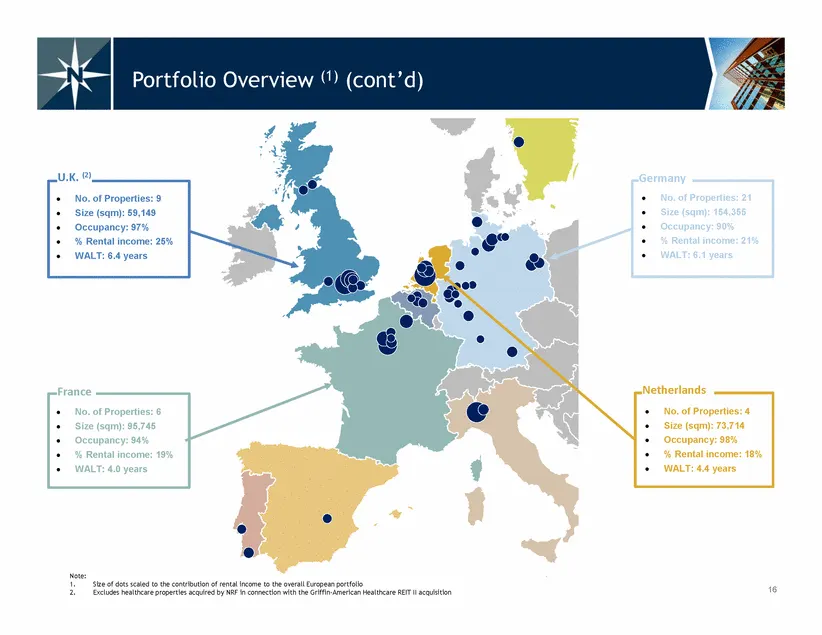
NREIT-2ndtier-bue-bar.Approximately $2 billion diversified pan- European portfolio with 50 high-quality properties located in some of the most sought after European markets .Footprint in many key Western Europe markets including London, Paris, Amsterdam, Frankfurt, Berlin, Hamburg, Milan, Madrid and
Slide 17: Portfolio Overview (cont’d)
16 Note: 1. Size of dots scaled to the contribution of rental income to the overall European portfolio 2. Excludes healthcare properties acquired by NRF in connection with the Griffin-American Healthcare REIT II acquisition . No. of Properties: 9 . Size (sqm): 59,149 . Occupancy: 97% . % Rental inco
Slide 18: Select European Investments
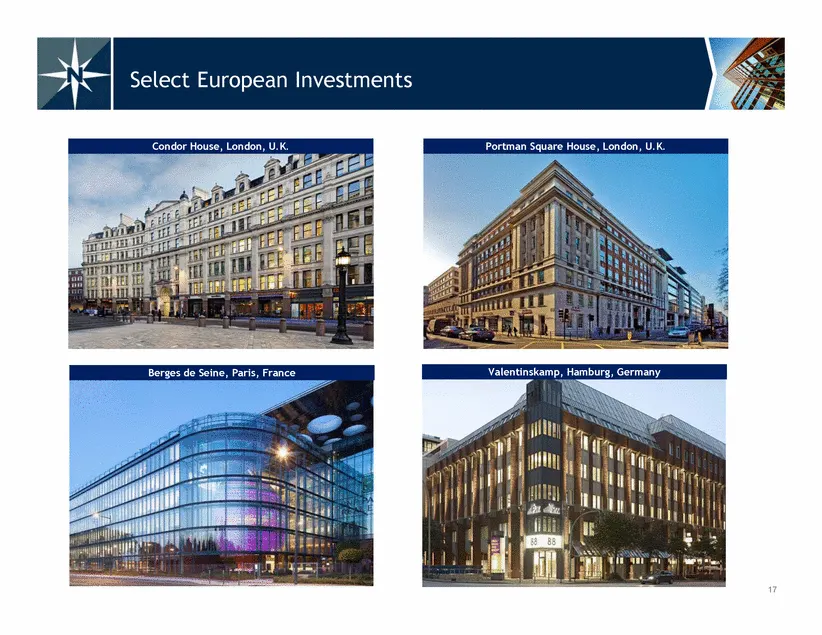
17 Select European Investments Condor House, London, U.K. Berges de Seine, Paris, France Portman Square House, London, U.K. Valentinskamp, Hamburg, Germany
Slide 19: Select European Investments (cont’d)
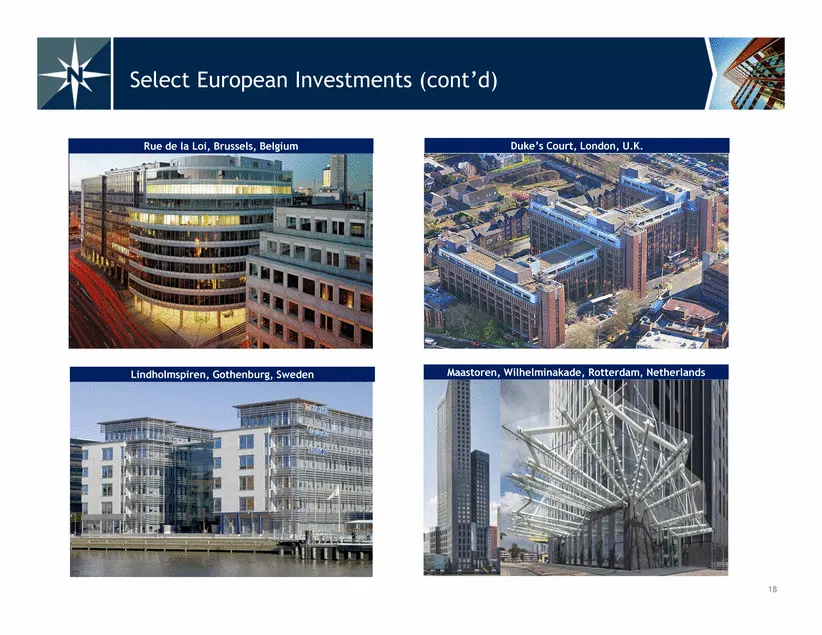
18 Select European Investments (cont’d) Rue de la Loi, Brussels, Belgium Duke’s Court, London, U.K. Lindholmspiren, Gothenburg, Sweden Maastoren, Wilhelminakade, Rotterdam, Netherlands
Slide 20: NorthStar Realty Finance overview
. NorthStar Realty Finance is a diversified U.S. REIT with total assets of approximately $18.5 billion (1) . The Company invests in a variety of property types in the U.S. and Europe . The largest investment concentrations are in healthcare, hotels, office (primarily in Europe), manufactured home co
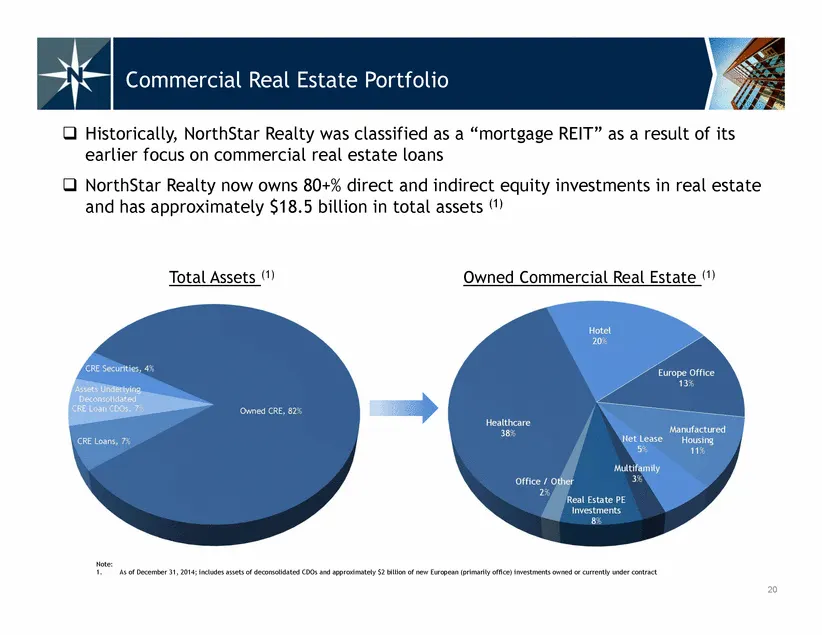
Slide 21: Commercial Real Estate Portfolio Total Assets
20 . Historically, NorthStar Realty was classified as a “mortgage REIT” as a result of its earlier focus on commercial real estate loans . NorthStar Realty now owns 80+% direct and indirect equity investments in real estate and has approximately $18.5 billion in total assets (1) Commercial Real Esta
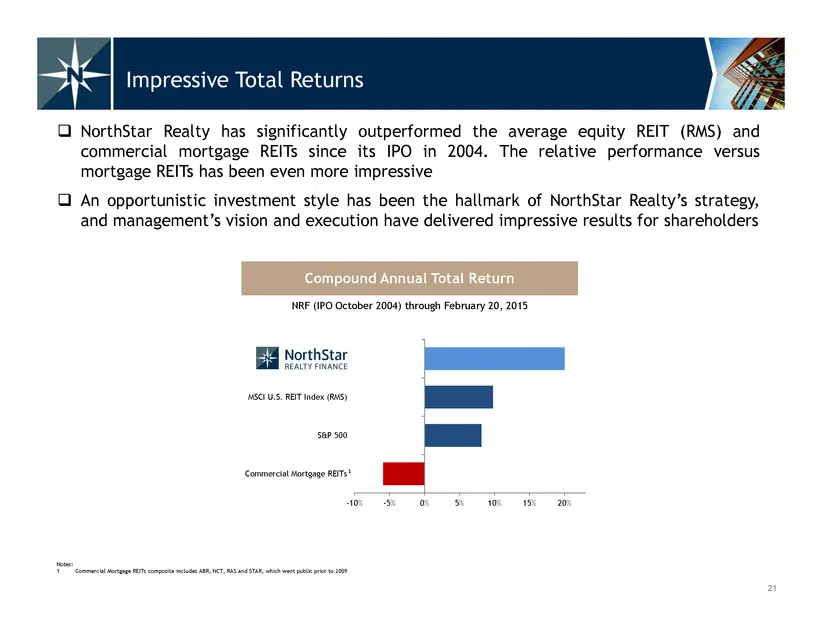
Slide 22: Impressive Total Returns
-10% -5% 0% 5% 10% 15% 20% Commercial Mortgage REITs S&P 500 MSCI U.S. REIT Index (RMS) Compound Annual Total Return 21 Notes: 1 Commercial Mortgage REITs composite includes ABR, NCT, RAS and STAR, which went public prior to 2009 1 NRF (IPO October 2004) through February 20, 2015 . NorthStar Realty
Slide 23: Park Avenue, 18th Floor, New York, NY 10022 | 212.547.2600 | NRFC.com
22 399 Park Avenue, 18th Floor, New York, NY 10022 | 212.547.2600 | NRFC.com
Source: SEC EDGAR · 8-K filed Feb 26, 2015
More decks from NorthStar Realty Finance Corp
 Merger or Acquisition (July 2016)5 slides · Jul 29, 2016
 Merger or Acquisition (June 2016)31 slides · Jun 7, 2016
 Merger or Acquisition (June 2016)27 slides · Jun 3, 2016
 Investor Presentation (January 2015)14 slides · Jan 13, 2015
 Investor Presentation (August 2014)28 slides · Aug 11, 2014
 Merger or Acquisition (August 2014)12 slides · Aug 5, 2014