Cal Dive International — Q4 2010 Earnings Presentation
12 slides from Cal Dive International's earnings presentation, Mar 2, 2011
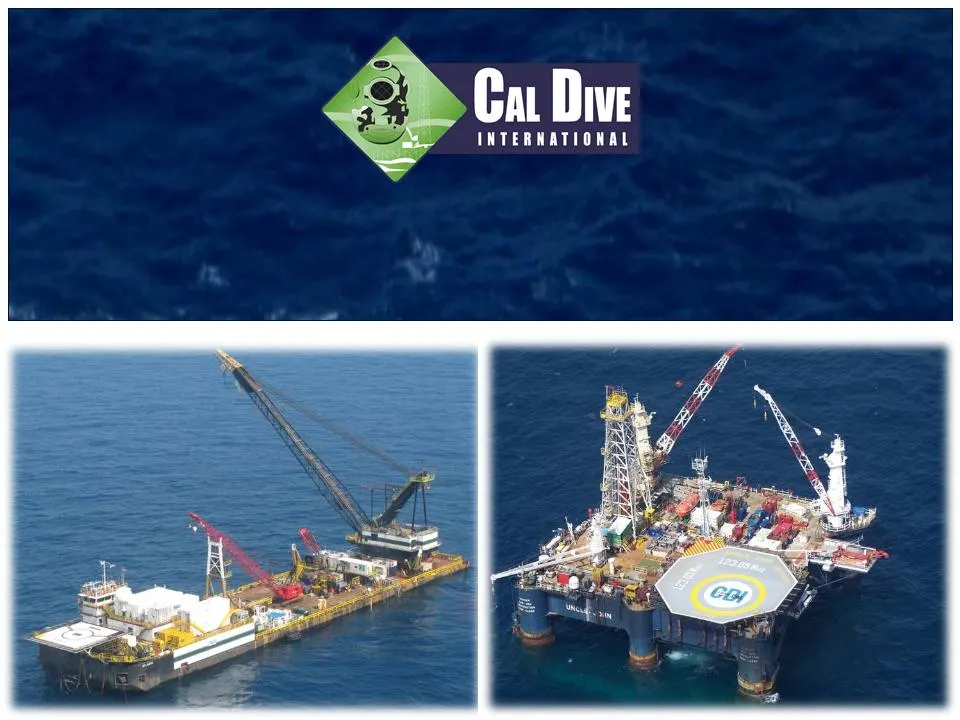
Slide 1: Cal Dive International 4th Quarter 2010 Earnings Conference Call
Cal Dive International 4 th Quarter 2010 Earnings Conference Call

Slide 2: Forward-Looking Statements
Forward-Looking Statements This presentation may include “forward-looking” statements that are generally identifiable through our use of words such as “believe,” “expect,” “anticipate,” “intend,” “plan,” “estimate,” “project” and similar expressions and include any statements that we make regarding
Slide 3: Presentation Outline
Presentation Outline Summary of 4Q 2010 Results Backlog Discussion of Financial Results Non-GAAP Reconciliations Questions & Answers

Slide 4: Summary of 4Q Results
Summary of 4Q Results Higher utilization levels compared to 4Q 09 but fewer large construction projects. Solid backlog at end of 2010. No outstanding borrowings under revolver at year-end. Debt to EBITDA at 2x.
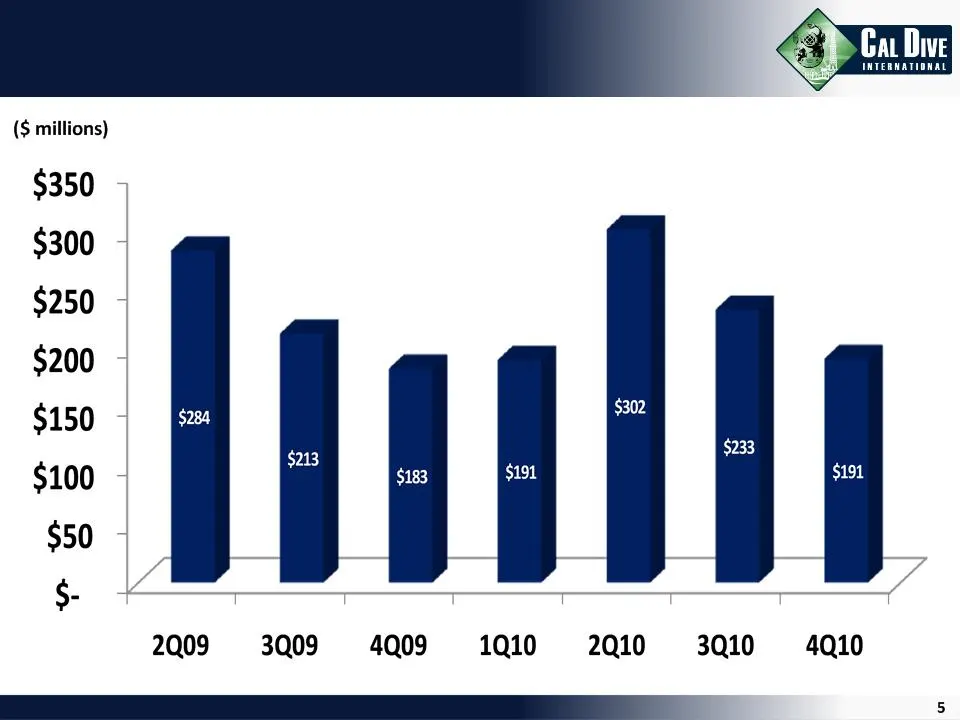
Slide 5: Backlog ($ millions)
ee ox (S millions) $350 5 $300 $250 - $200 $150 $a ; - - $100 | $213 . Pe om $233 $50 - . ee 5

Slide 6: Financial Results
Financial Results (all amounts in thousands, except per share amounts and percentages) Three Months Twelve Months Ended December 31, Ended December 31, 2010 2009 2010 2009 $161,040 $147,396 $536,468 $829,362 23,673 36,188 62,442 215,885 Margins 15% 25% 12% 26% Net Income (Loss) ($2,382) $2,840 ($315
Slide 7: Utilization
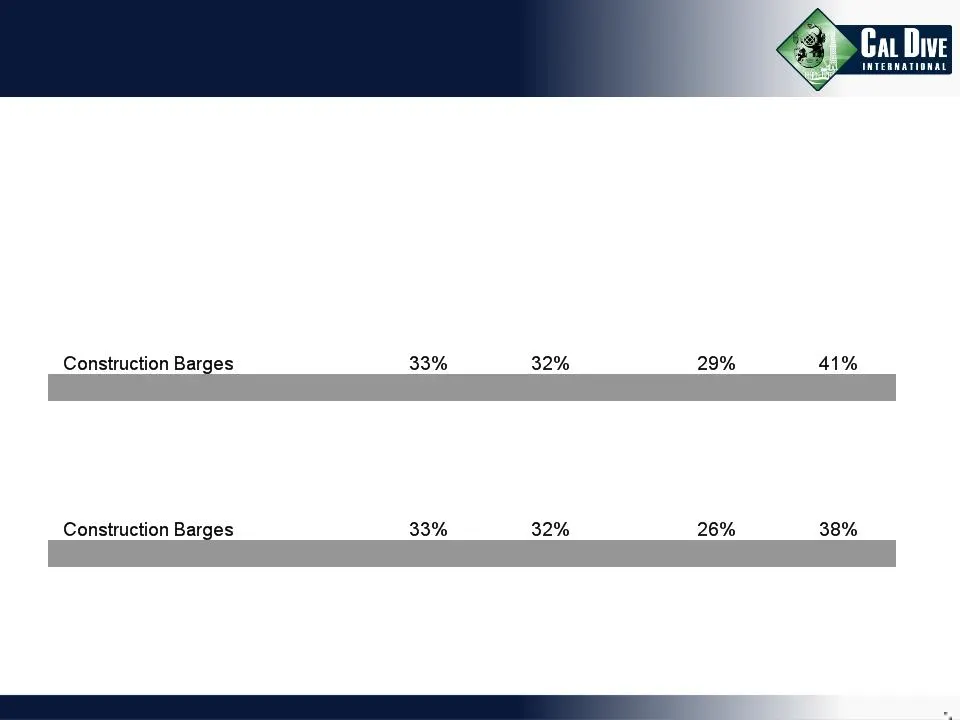
Utilization Three Months Twelve Months Ended December 31, Ended December 31, 2010 2009 2010 2009 Effective Utilization (1) - Saturation Diving Vessels 66% 58% 65% 79% Surface Diving Vessels 46% 34% 51% 57% Total Fleet 47% 40% 47% 57% Calendar Day Utilization - Saturation Diving Vessels 64% 57% 61% 6
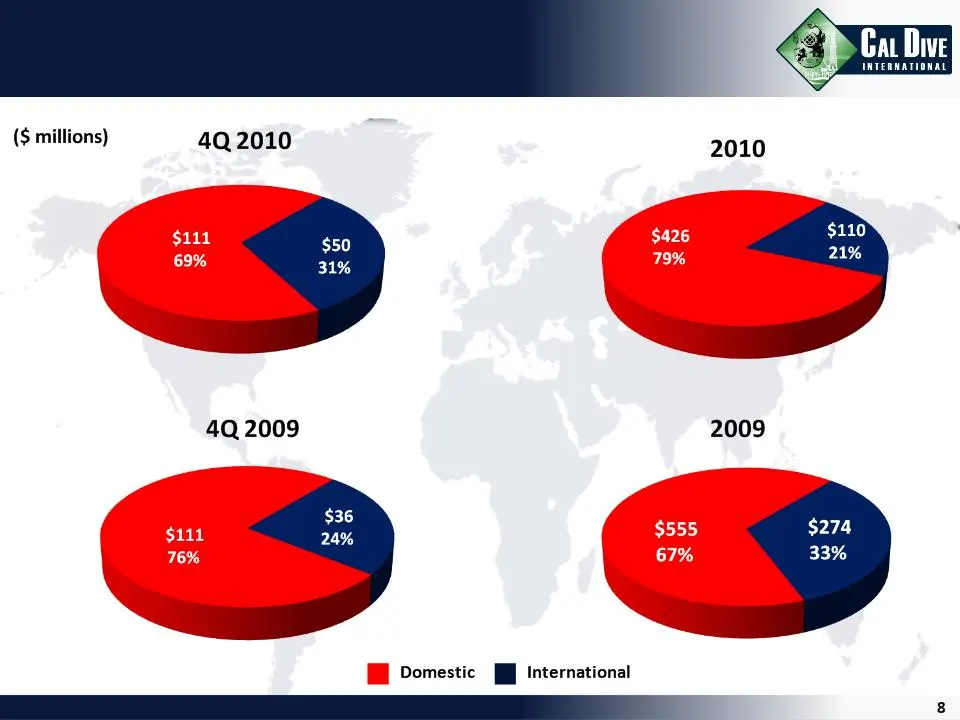
Slide 8: Domestic and International Revenue ($ millions)
Ca Di INTERMATIONAL ($ millions) 4Q 2010 2010 4Q 2009 2009 $36 24% Domestic [J International
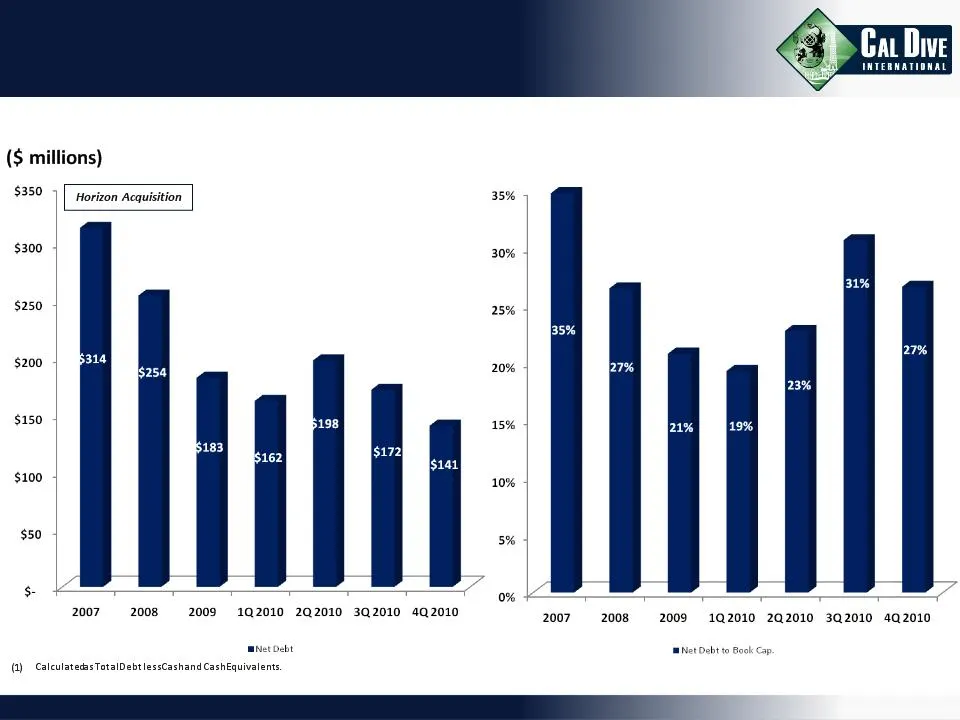
Slide 9: Debt Levels, Net Debt Levels, Net Debt to Book Cap.
Debt Levels Net Debt Levels (1) Net Debt to Book Cap. % (2) (2) Calculated as Net Debt divided by Stockholders’ Equity plus Net Debt.
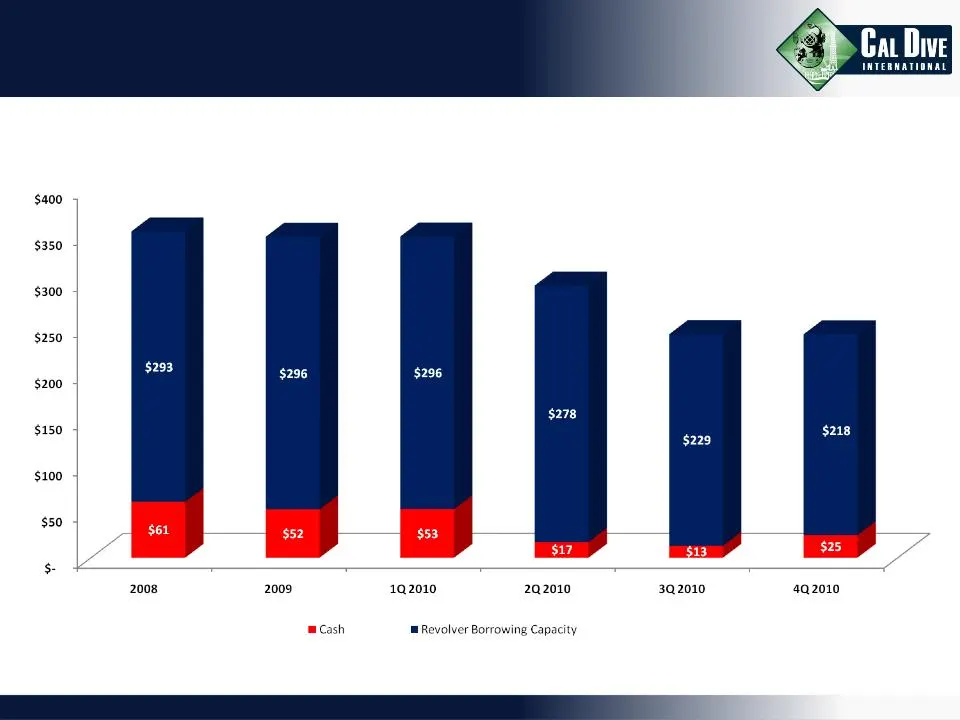
Slide 10: Liquidity Position
Liquidity Liquidity Position $348 $354 ($ millions) $243 $349 $295 $242 (1) Pro forma impact of amendment to credit facility. (2) Unborrowed revolver borrowing capacity calculated based on max allowed Debt to EBITDA ratio and maximum revolver capacity of $300 million less LC's outstanding.
Slide 11: arr
: _ arr ¥ a ~ ‘ bs oF sept ; * + 43, Ta — ee Ca Dive INTERMATIONAL
Slide 12: EBITDA Reconciliations
EBITDA Reconciliations ( all amounts in thousands ) Three Months Twelve Months Ended December 31, Ended December 31, 2010 2009 2010 2009 EBITDA (unaudited) $27,683 $34,178 $79,867 $216,453 Less: Depreciation & Amortization 17,008 18,469 68,961 76,313 Less: Non-Cash Stock Comp. Expense 2,061 1,943 7,
Source: SEC EDGAR · 8-K filed Mar 2, 2011
More decks from Cal Dive International Inc
 Q3 2014 Earnings Presentation12 slides · Nov 6, 2014
 Q2 2014 Earnings Presentation12 slides · Aug 11, 2014
 Q1 2014 Earnings Presentation12 slides · May 9, 2014
 Q4 2013 Earnings Presentation11 slides · Mar 5, 2014
 Q3 2013 Earnings Presentation11 slides · Nov 7, 2013
 Q2 2013 Earnings Presentation11 slides · Aug 8, 2013