Consumers Energy Company · NYSE:CMS/PB
Consumers Energy — EEI 47th Annual Financial Conference 2012
30 slides from Consumers Energy's conference presentation, Nov 9, 2012
Slide 1: EEI 47th Annual Financial Conference, November 2012
Exhibit 99.1 EEI 47th November Zeeland Foote Lake Winds Hydro 2007 Annual 2012 2012 1918Financial Conference
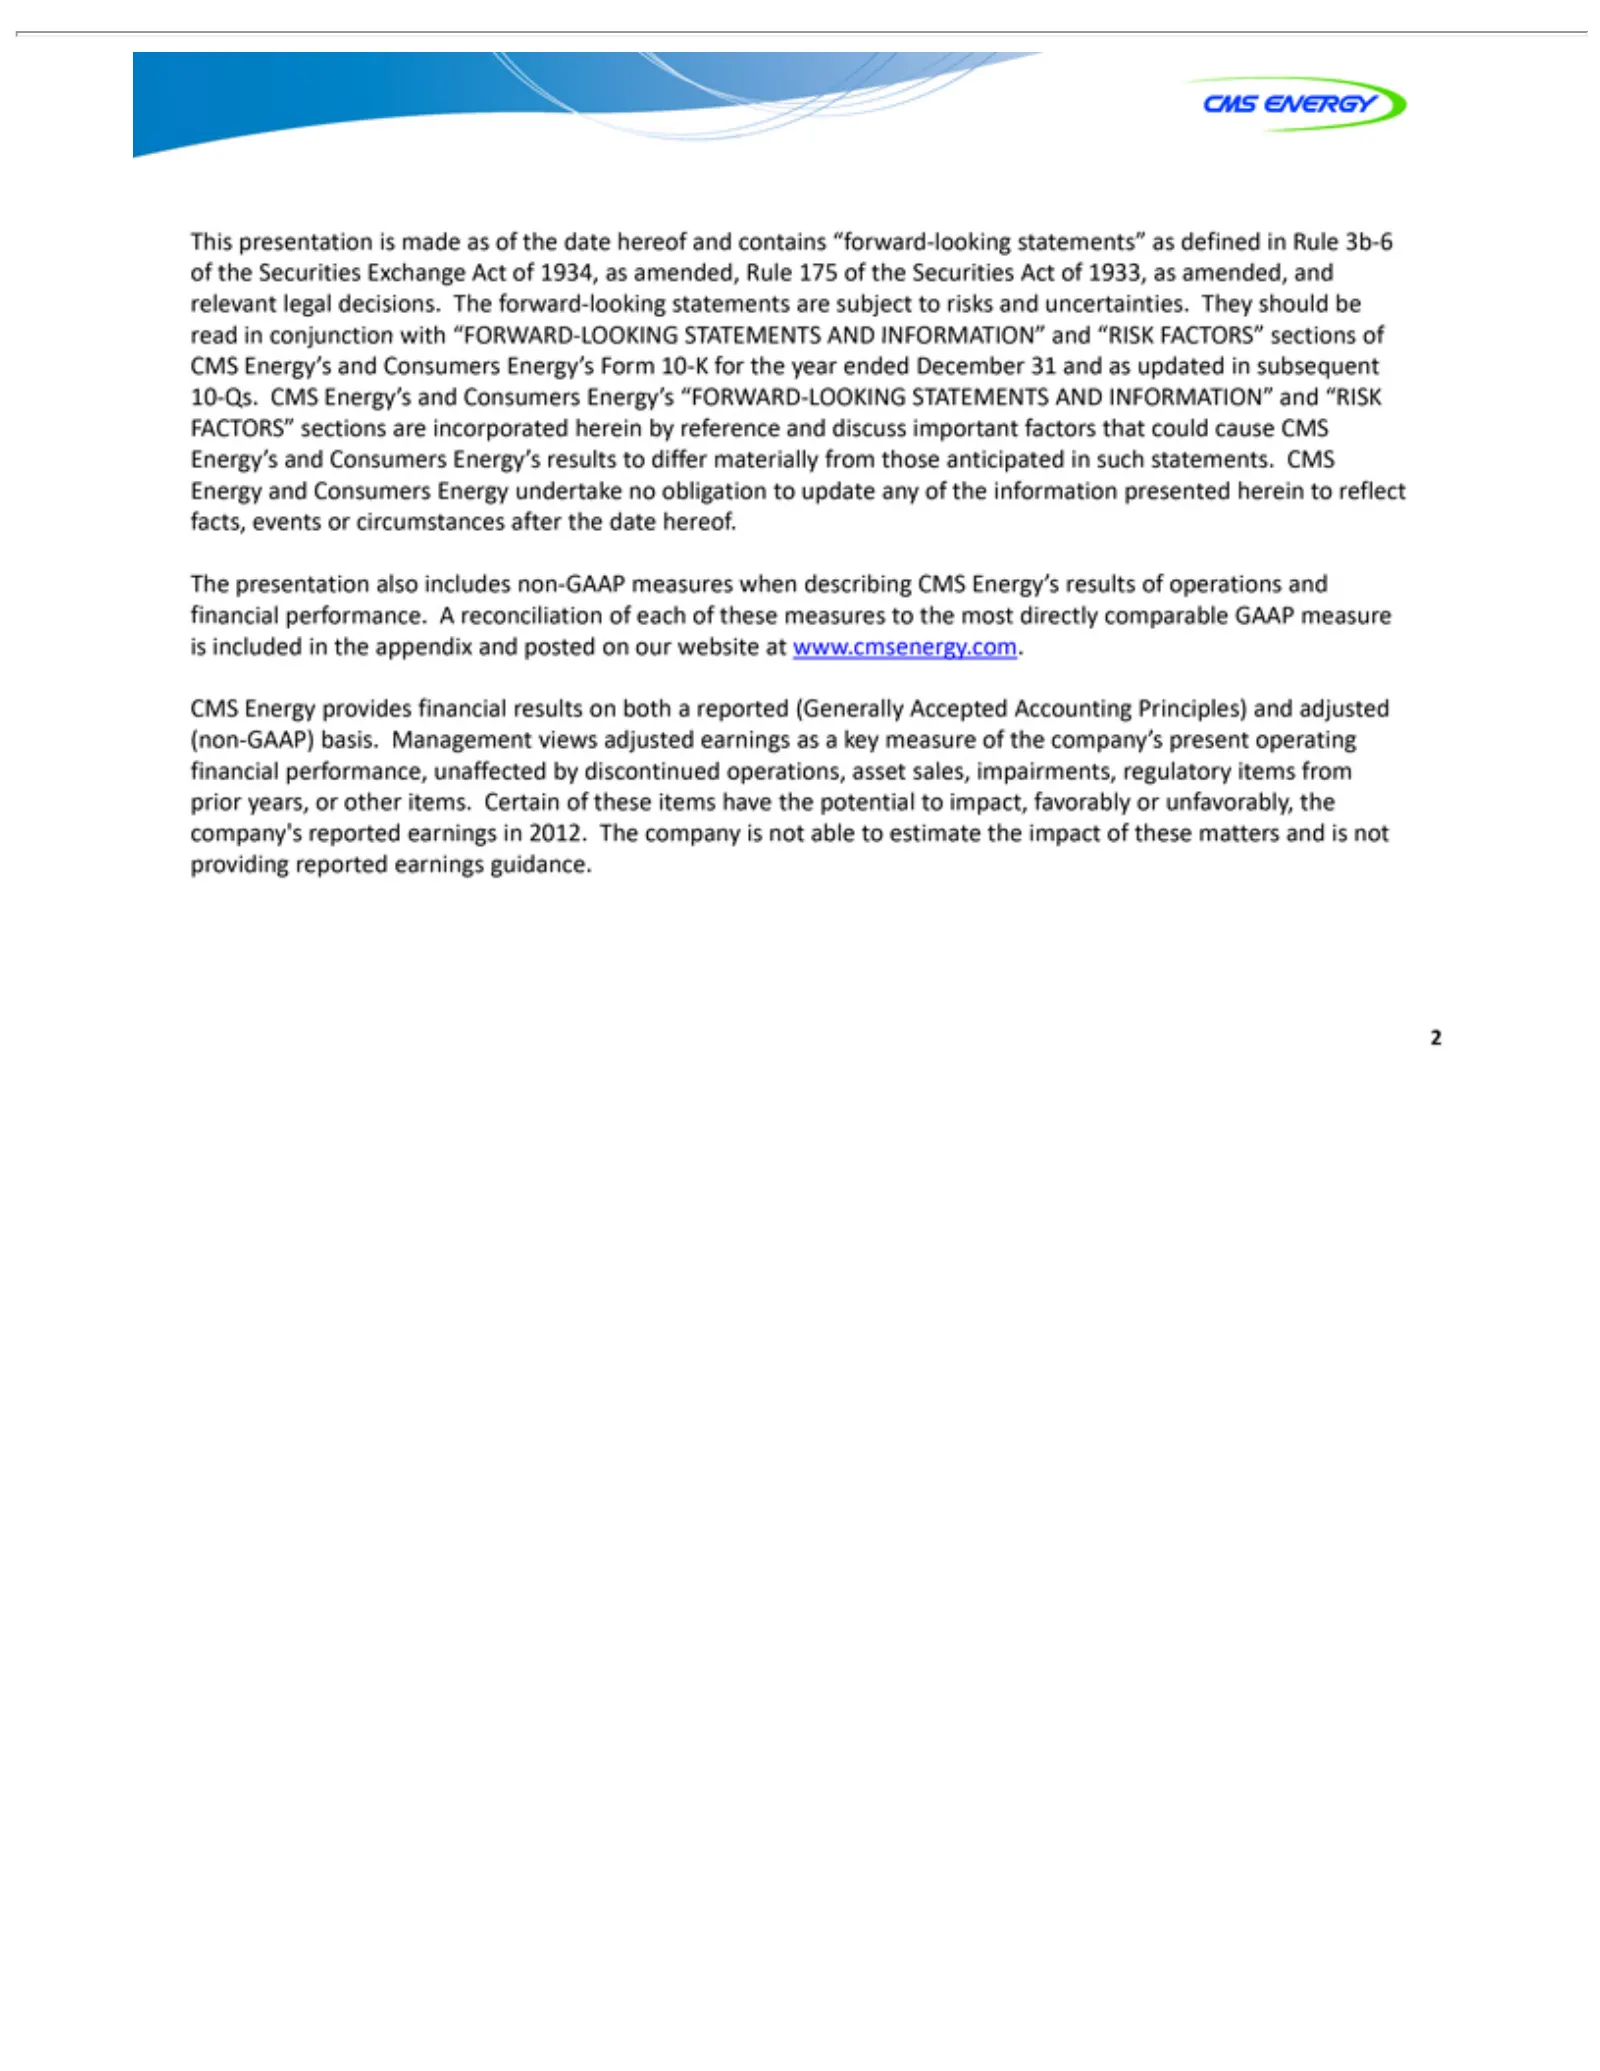
Slide 2: Forward-Looking Statements and Non-GAAP Information
This of STATEMENTS factors update The comparable CMS company’s potential 2 guidance. 1933, presentation presentation Energy’s Energy any that as to present of amended, could impact, GAAP provides the and AND also information is cause operating Consumers measure favorably made and includes INFORMATIO
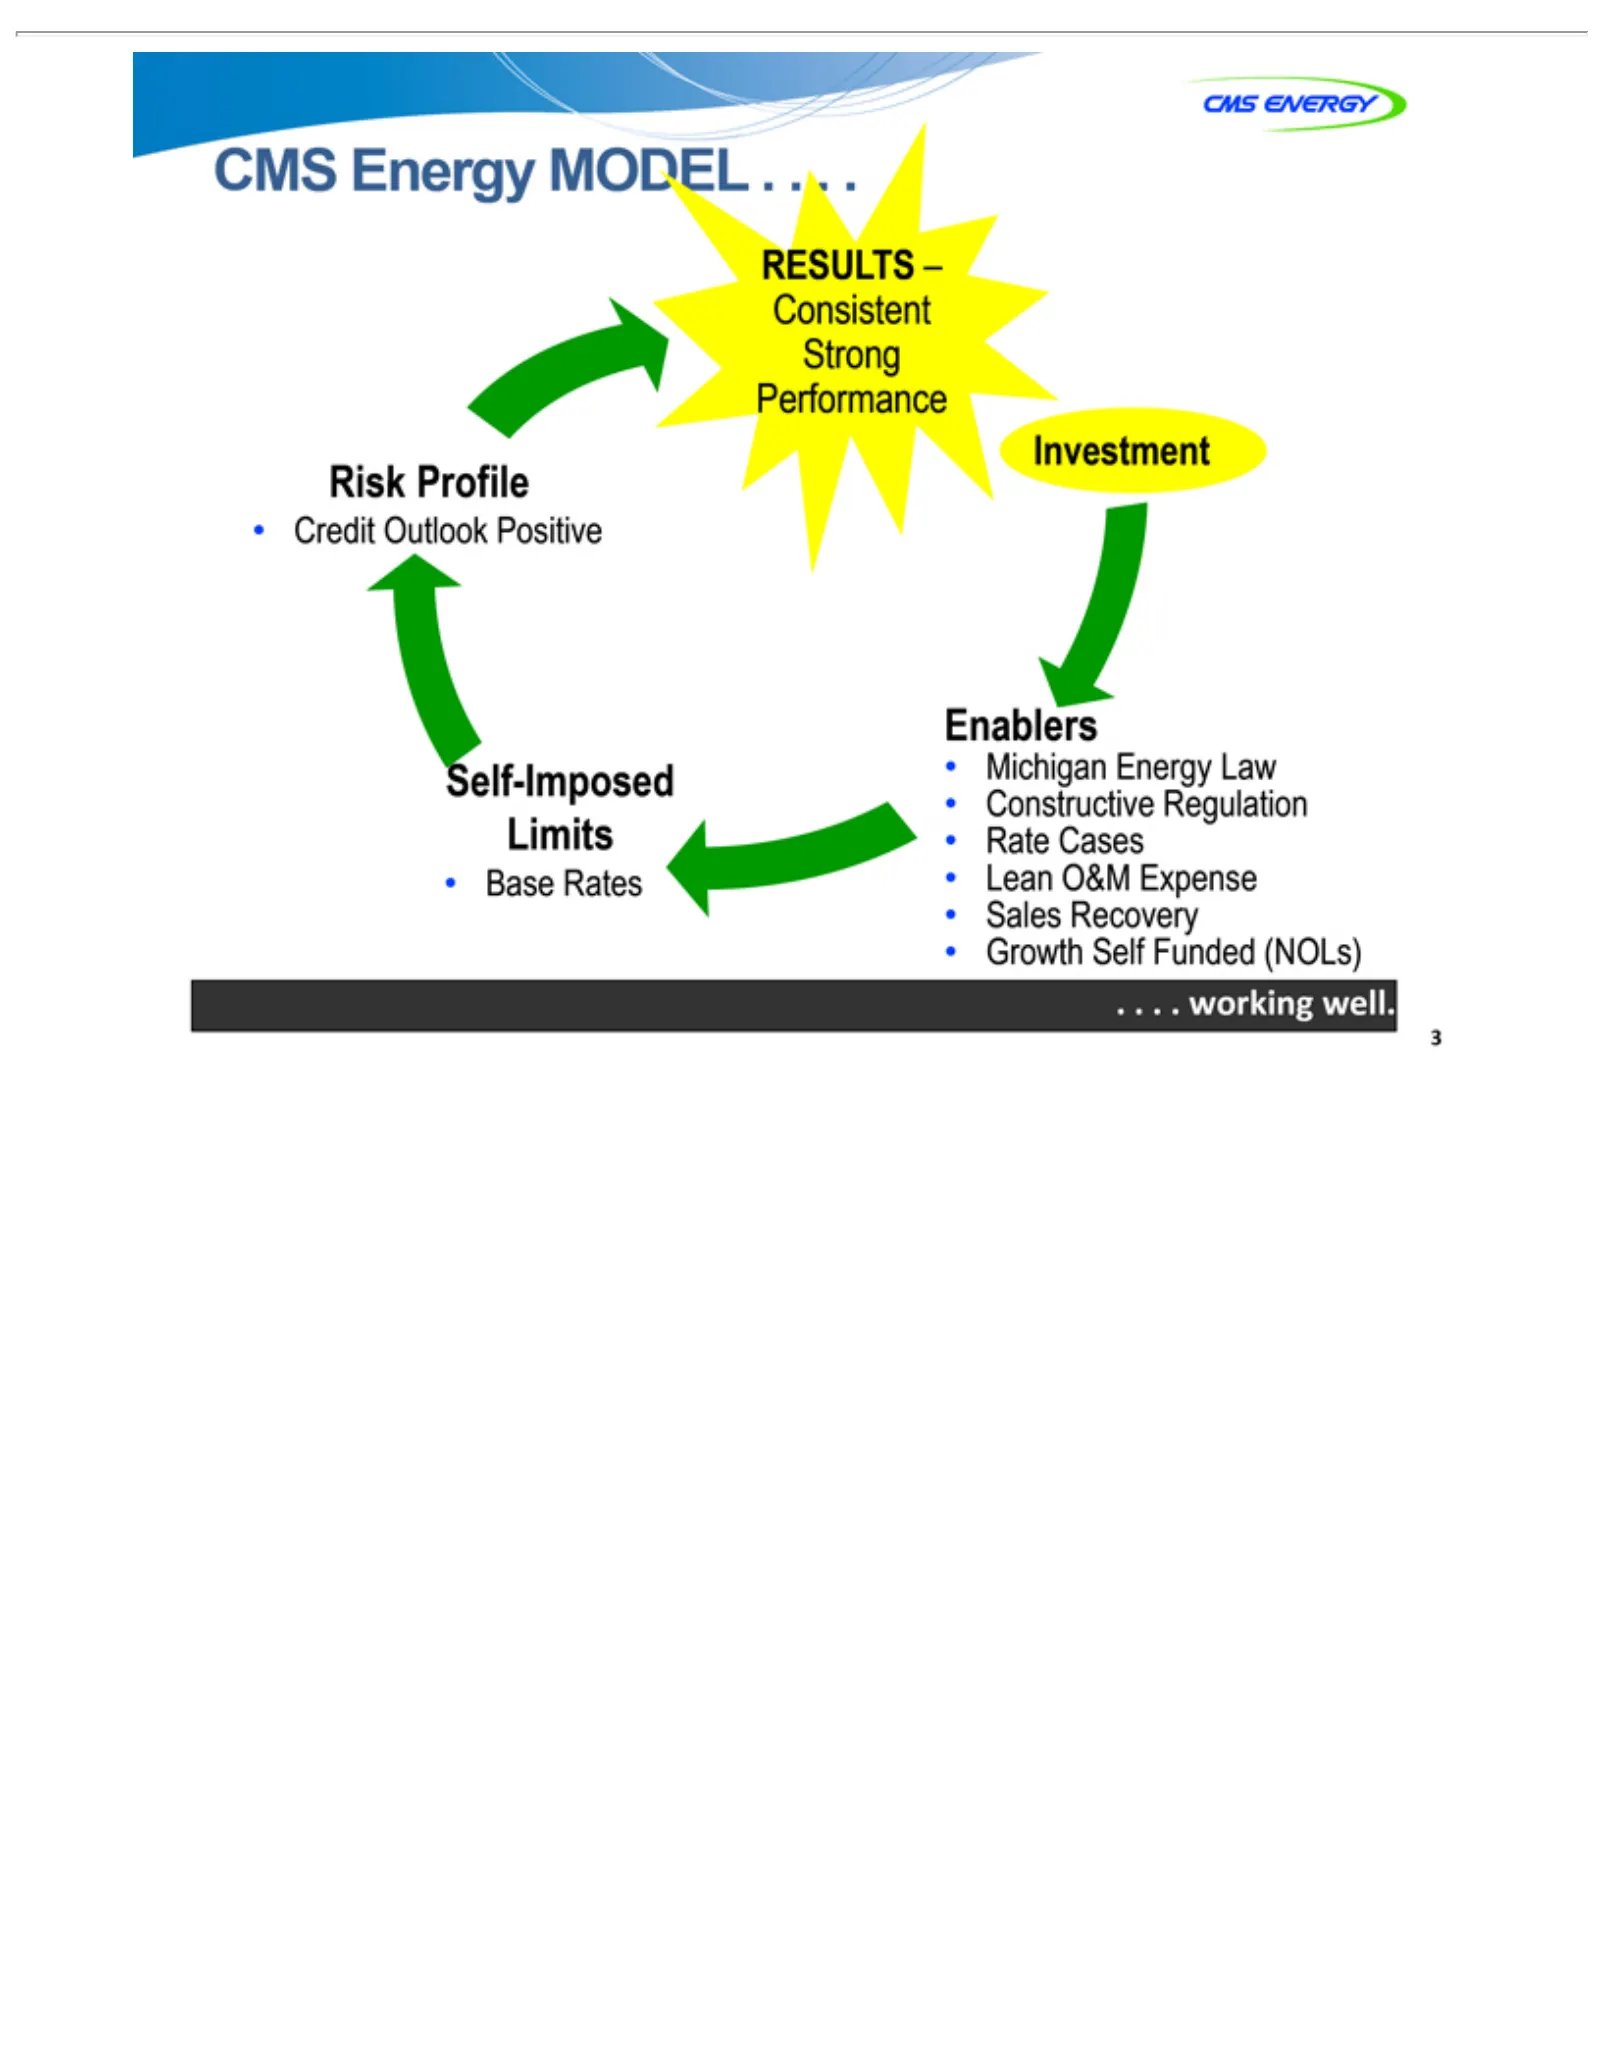
Slide 3: The CMS Energy Model
CMSCases RESULTS Strong Consistent Risk Credit Self-Imposed Investment Base Michigan Enablers Constructive Rate Lean Sales Growth ....working 3 Profile Rates O&M Recovery Energy Outlook Performance Self Energy –well. Expense Funded Regulation MODEL Limits Positive Law(NOLs) ....
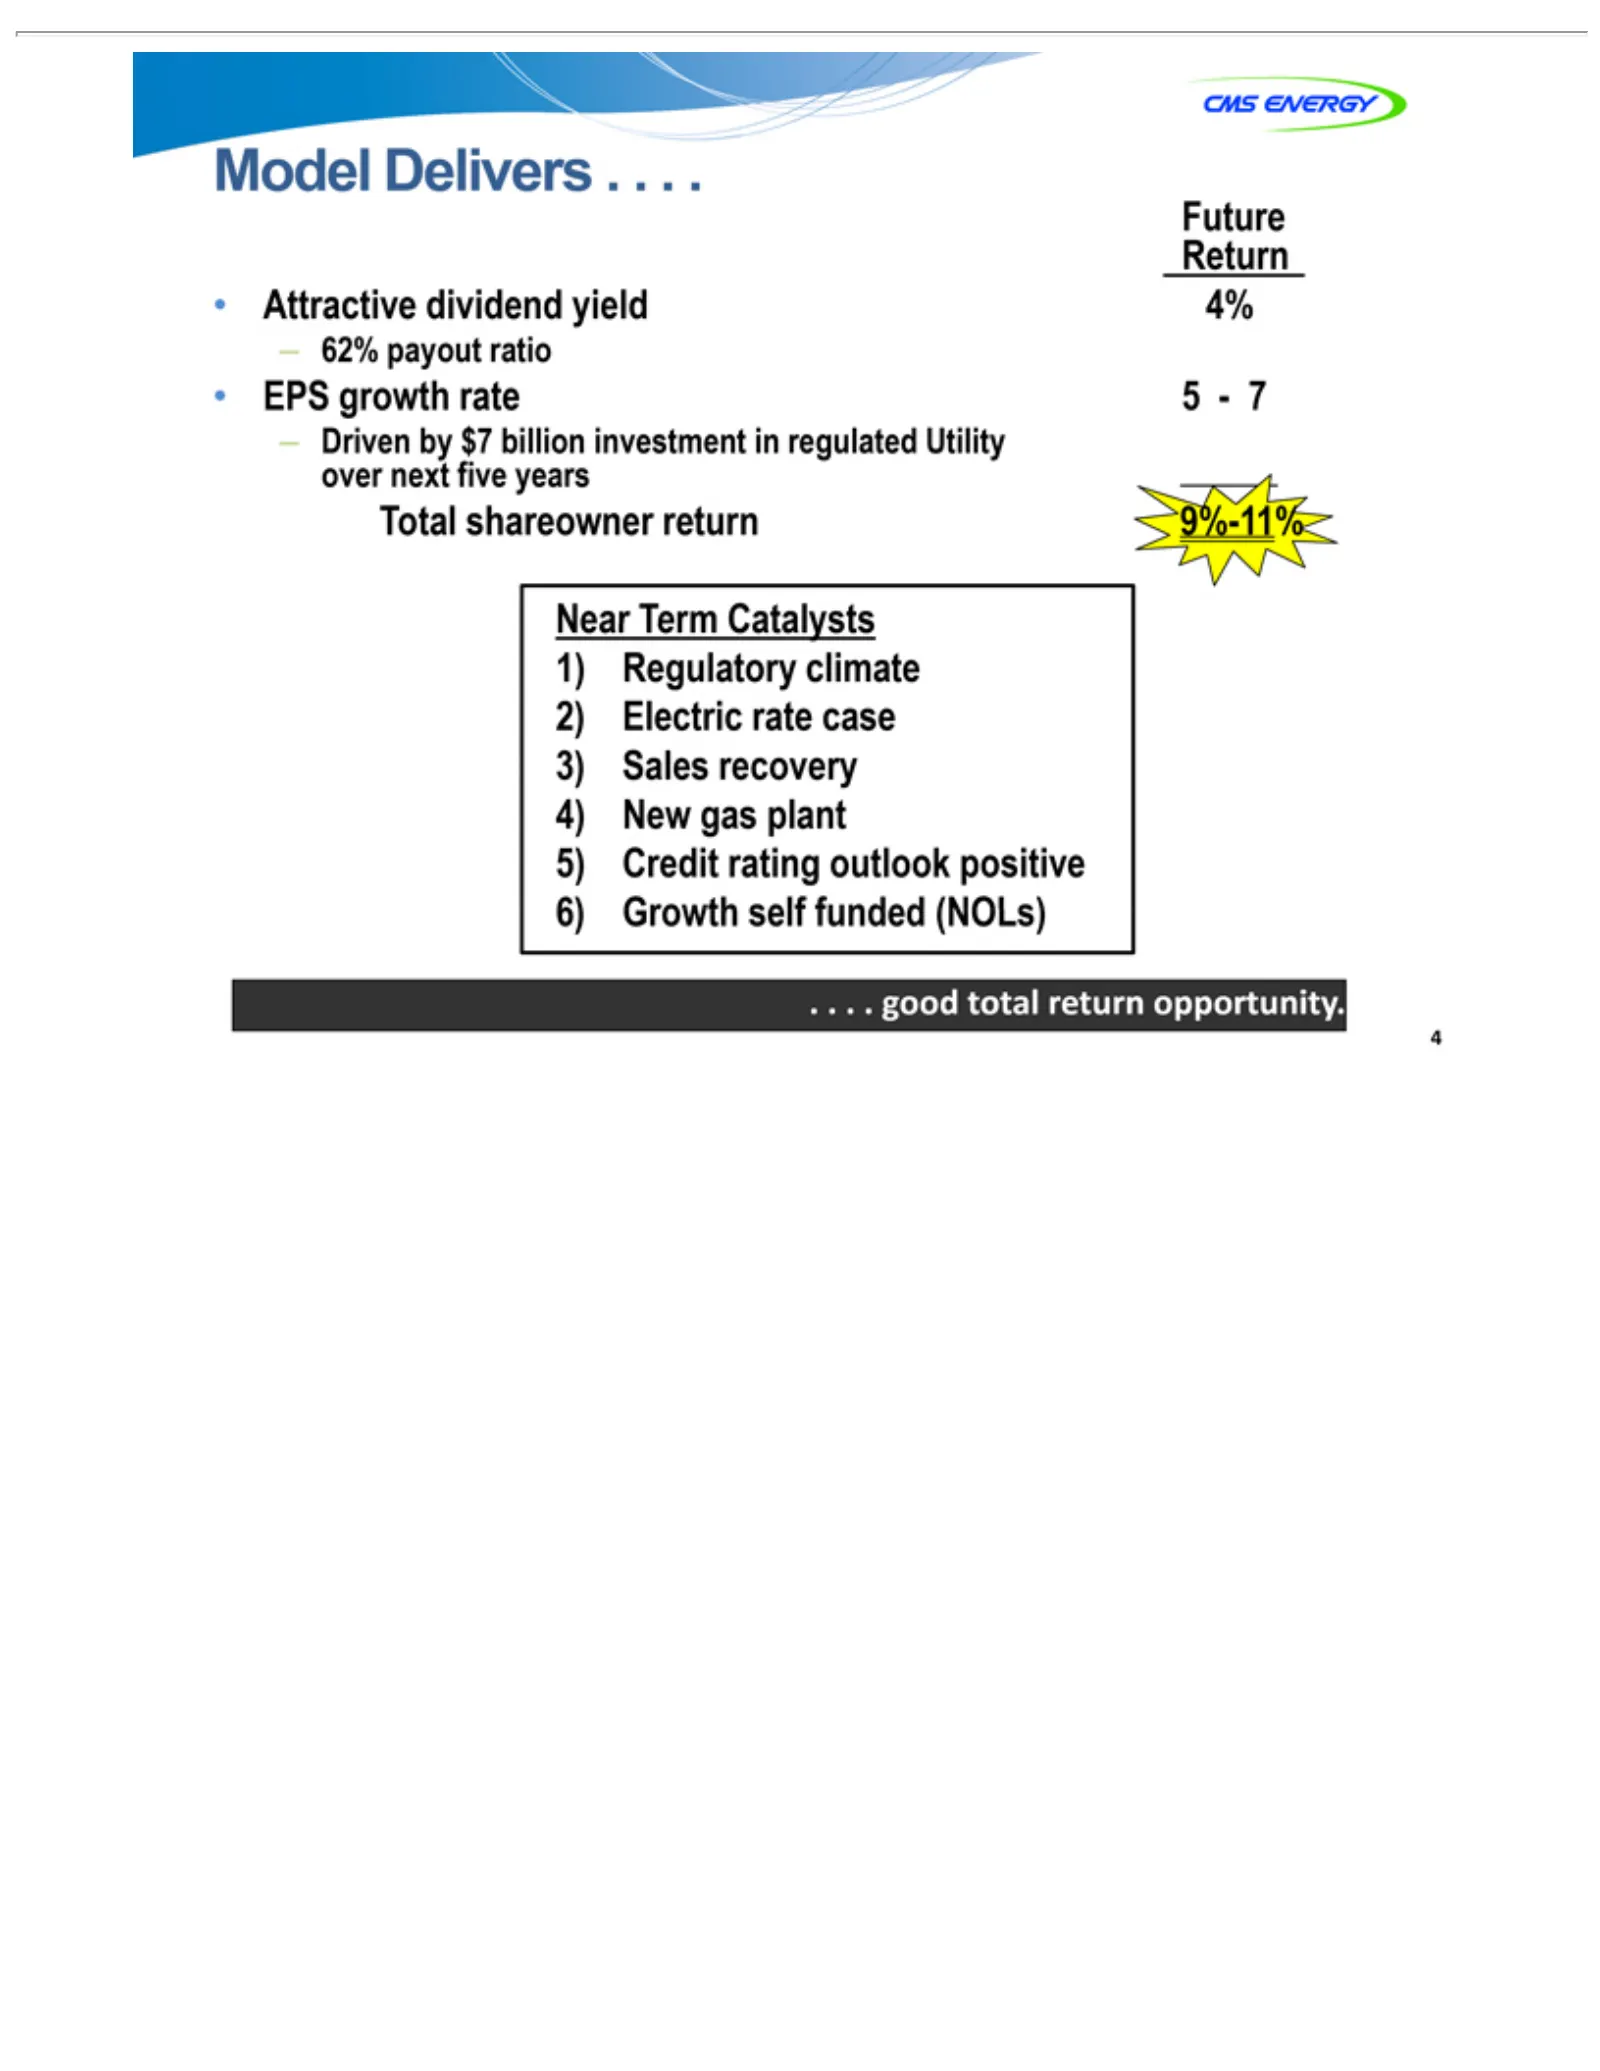
Slide 4: Attractive EPS Growth Model Delivers Total Return
Model Attractive EPS – Total Future 5 4 .over 62% Near 9%-11% 1) 2) 3) 4) 5) .6) . growth shareowner Driven payout Return Delivers .Growth—7 dividend Regulatory Electric Sales New Credit good Term gas rate next ratio recovery rating total self rate 4%. .return Catalysts plant climate funded case .by
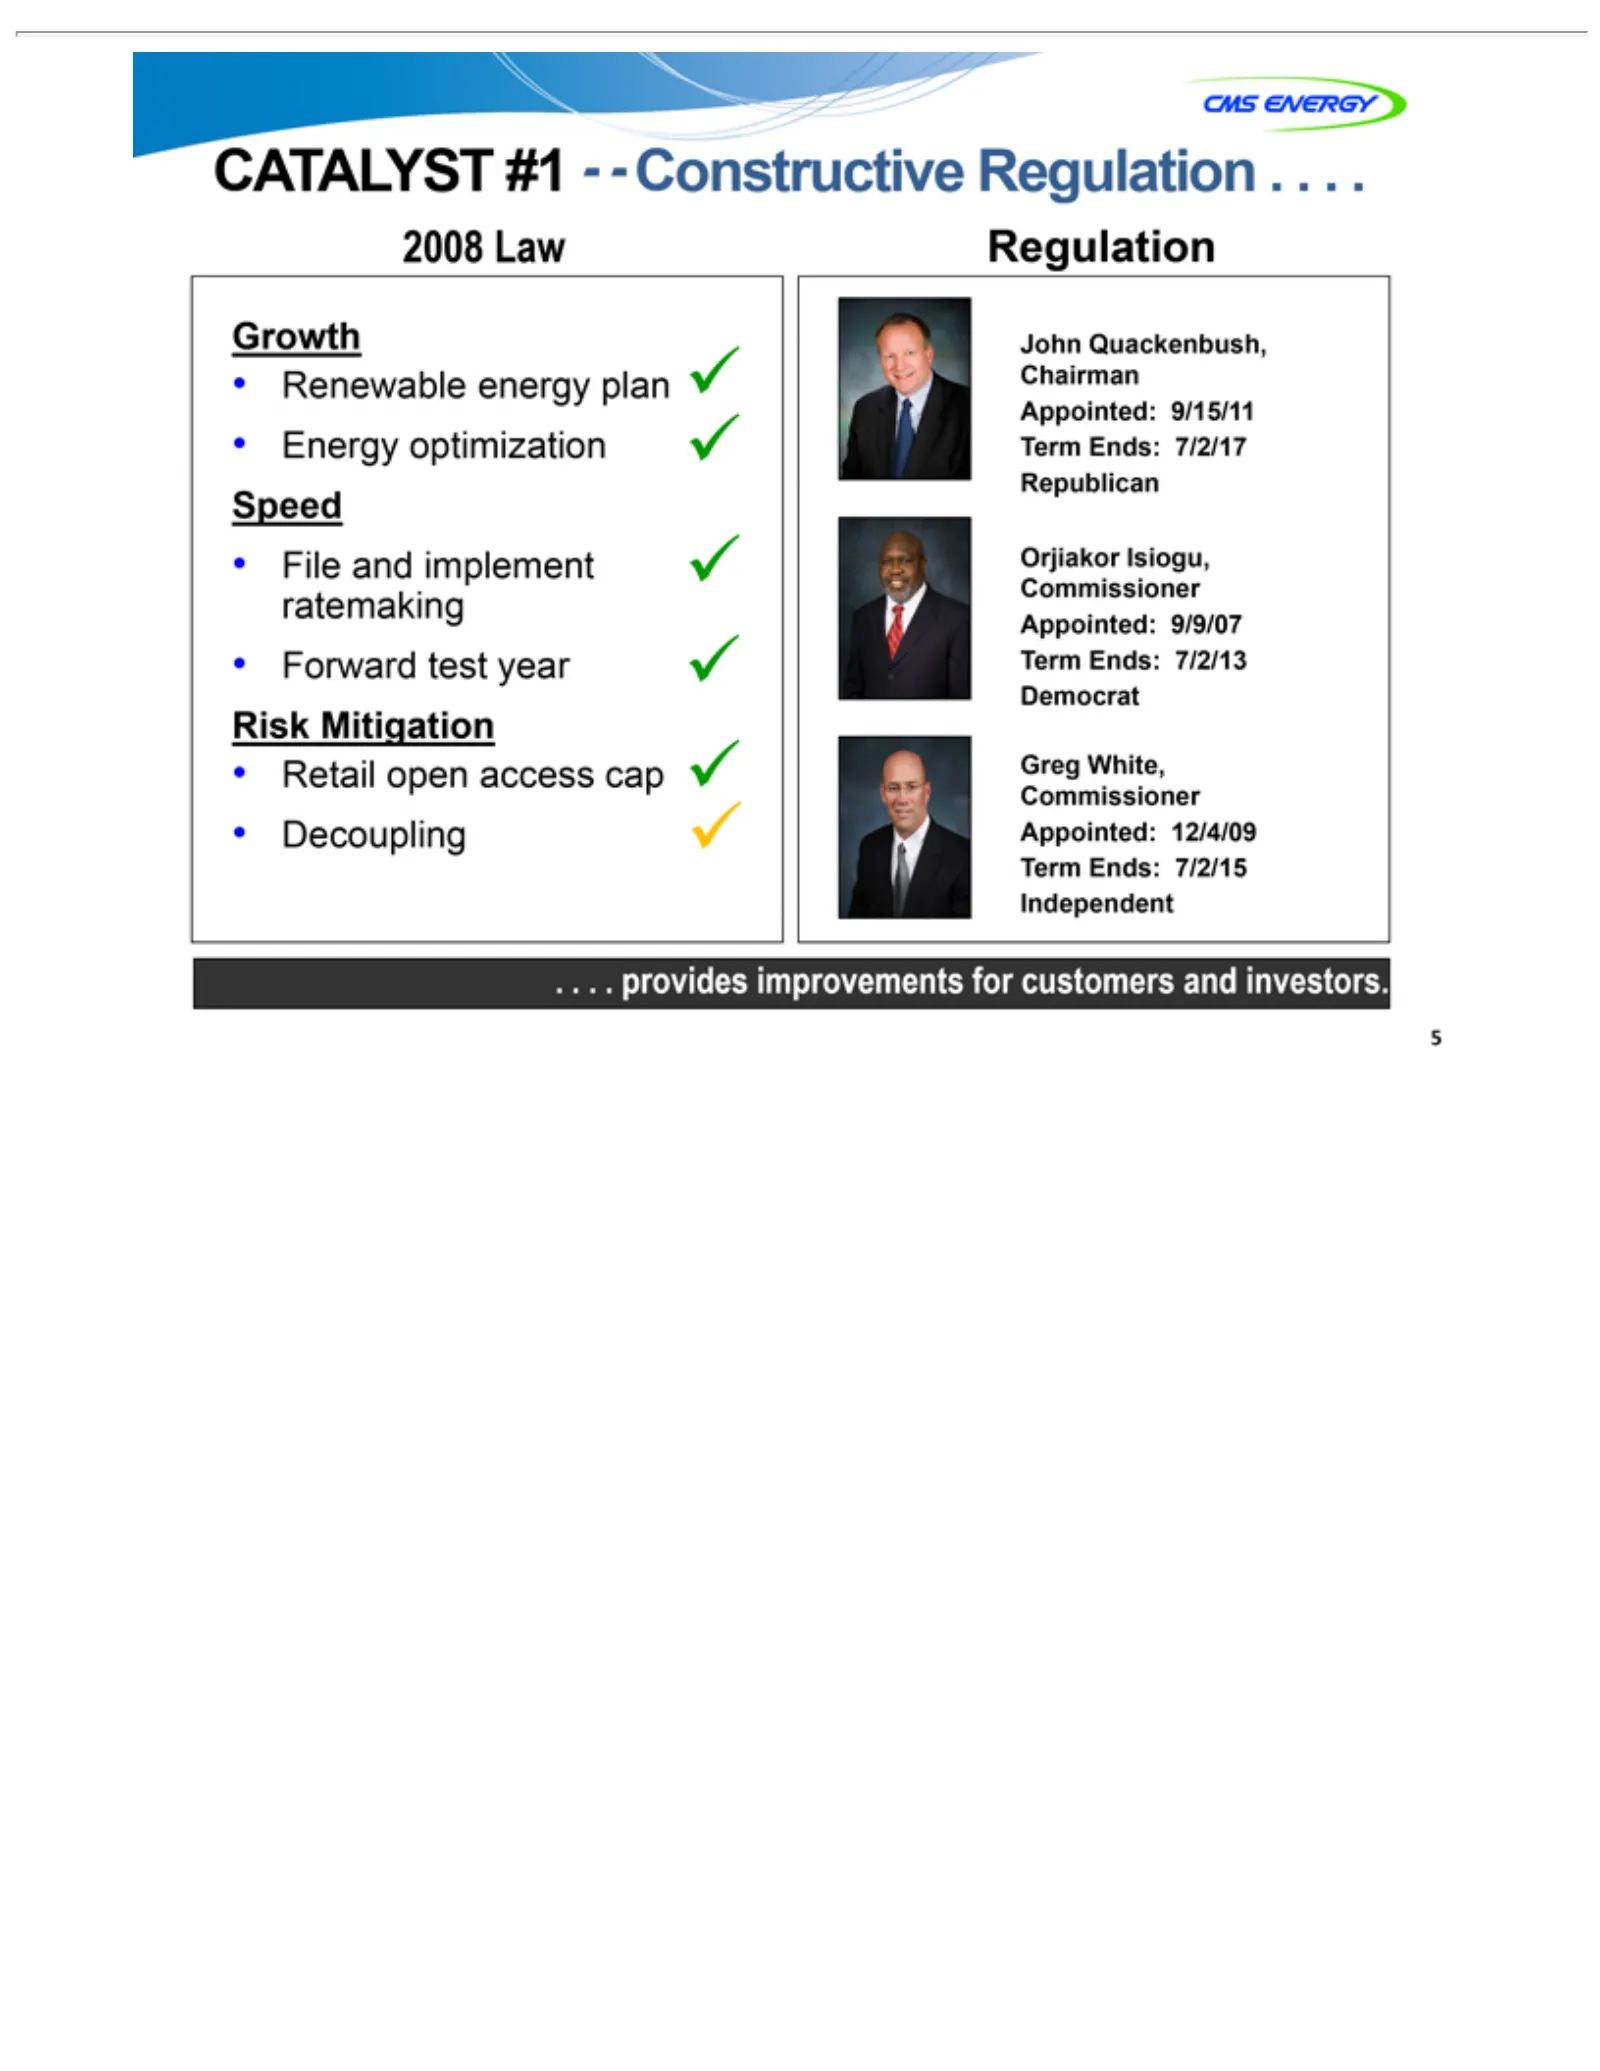
Slide 5: Catalyst #1: Constructive Regulation
CATALYST 2008 Renewable Growth Energy File Speed Forward Risk Retail John Decoupling Orjiakor .Greg 5 . . . and provides Mitigation Quackenbush, White, Law open optimization implement Isiogu, test Regulation energy access #1— Commissioner year improvements Commissioner Constructive cap plan ratemaki
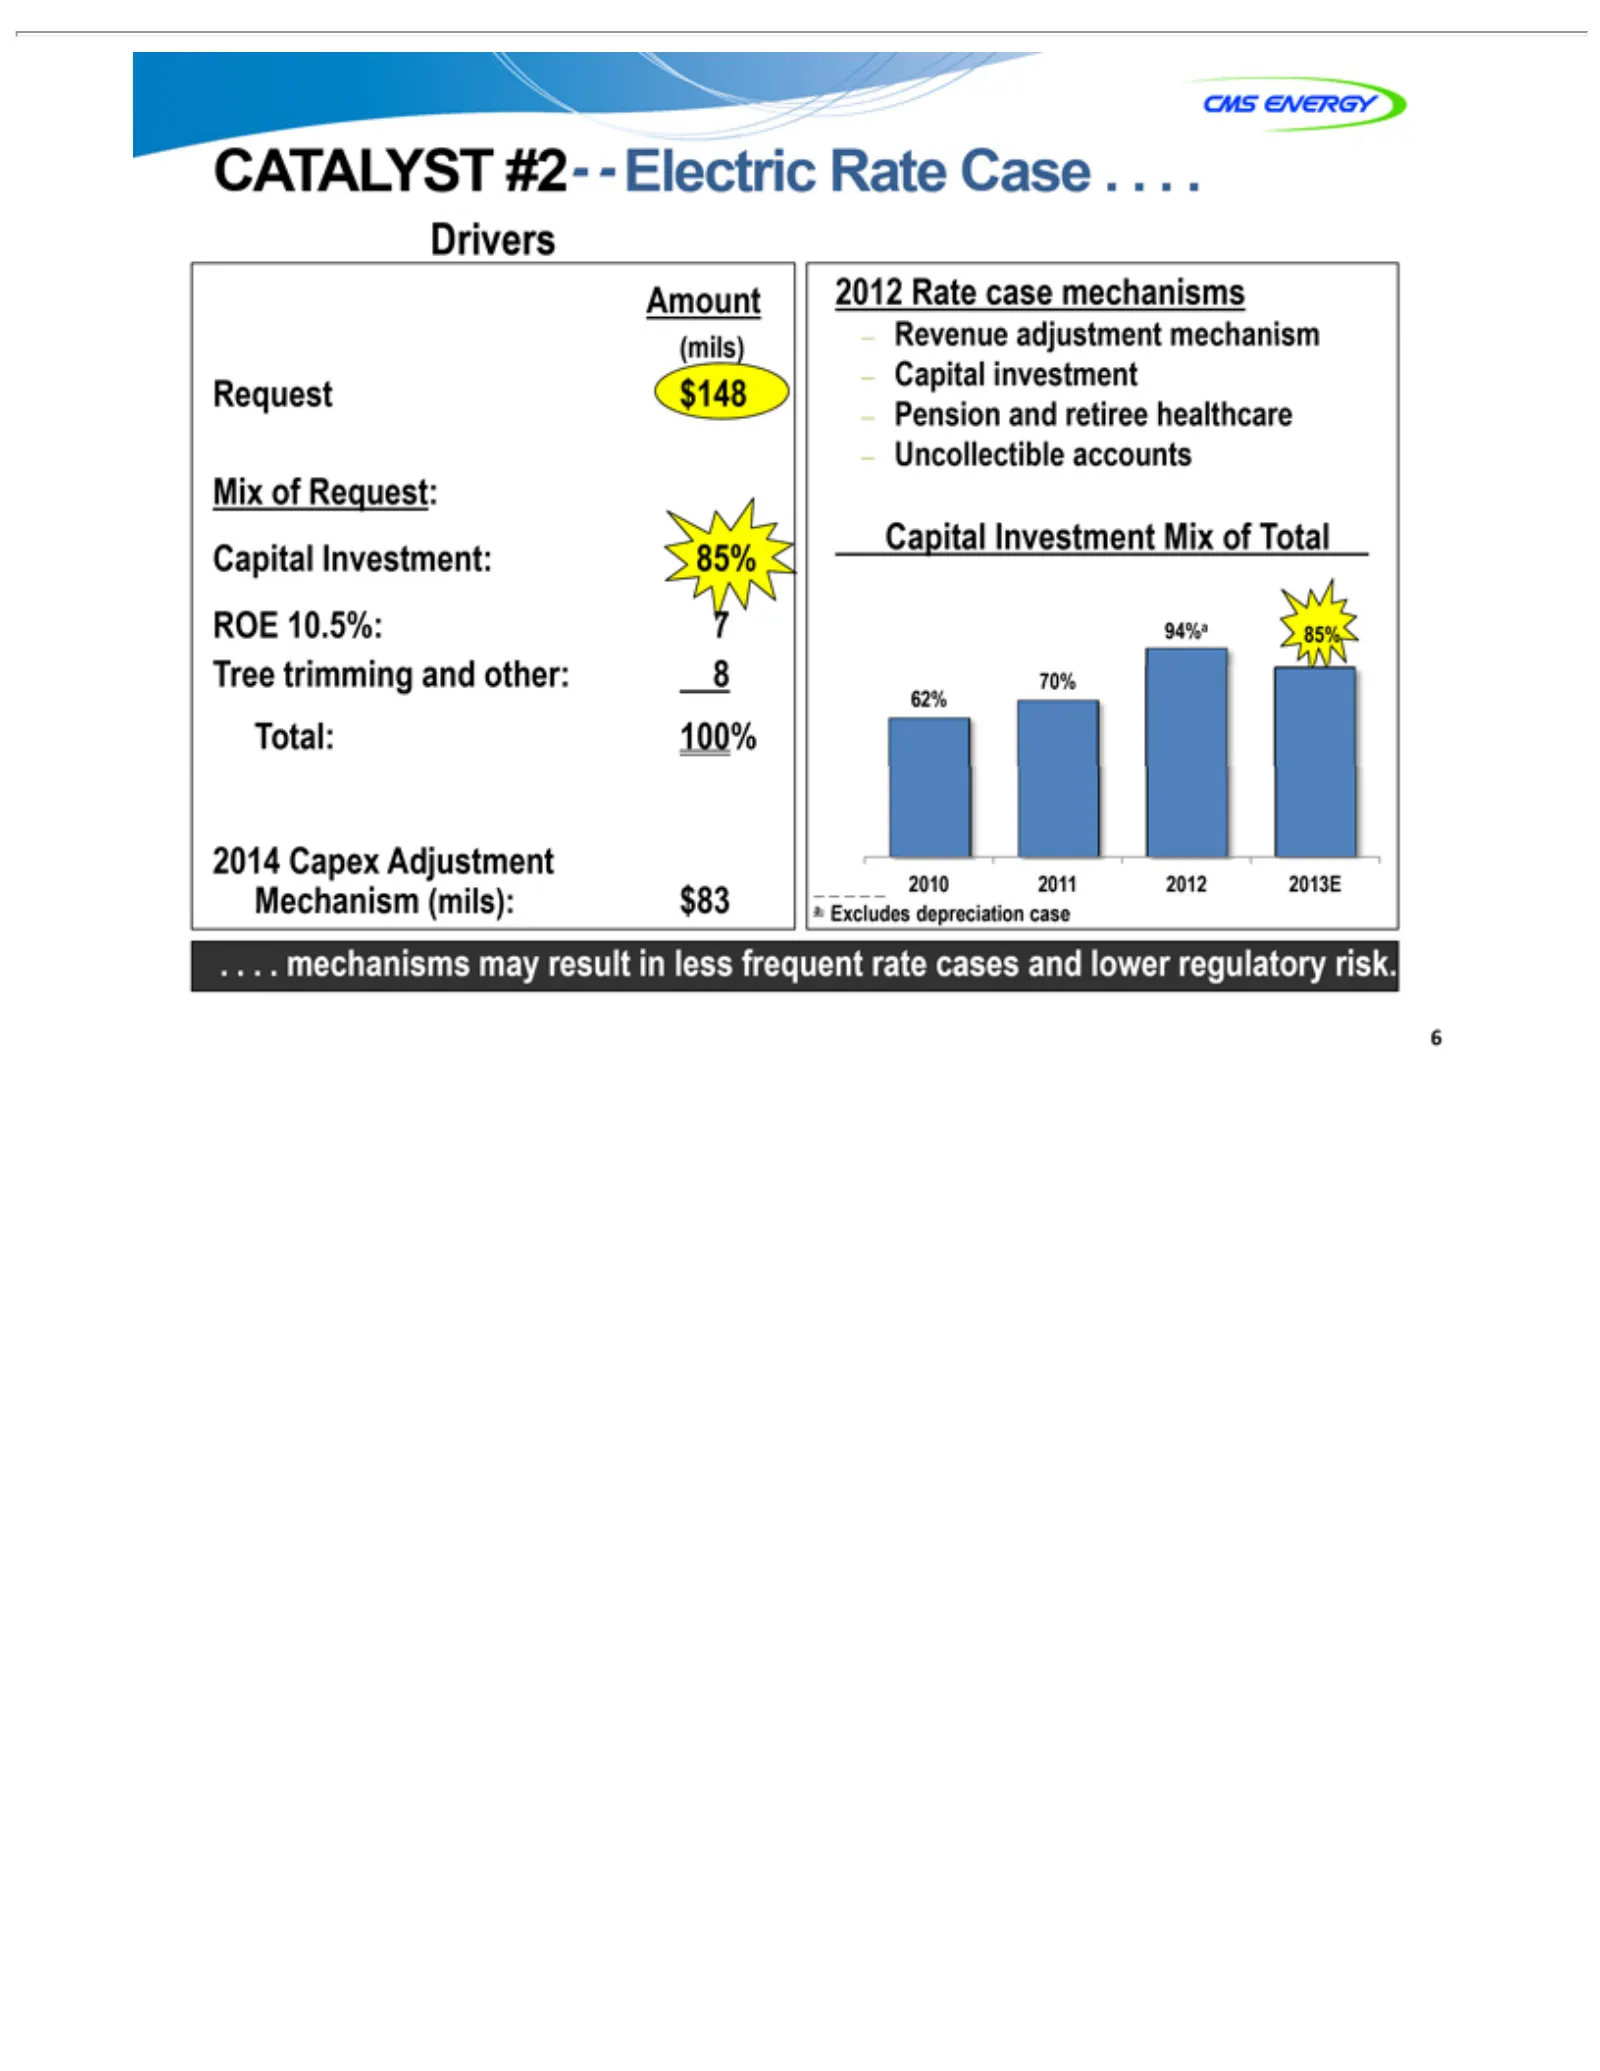
Slide 6: Catalyst #2: Rate Cases
CATALYST Mix Request Drivers 2014 85% $148 (mils) Amount 2012 $83 Revenue – Capital 94%a .a_ 6 .Excludes Capital Pension Uncollectible 2010 . . of mechanisms 7Rate Capex 85% 82011 Request: Investment 100% adjustment investment and case depreciation 70% Adjustment #2— 2012 retiree mechanisms accounts
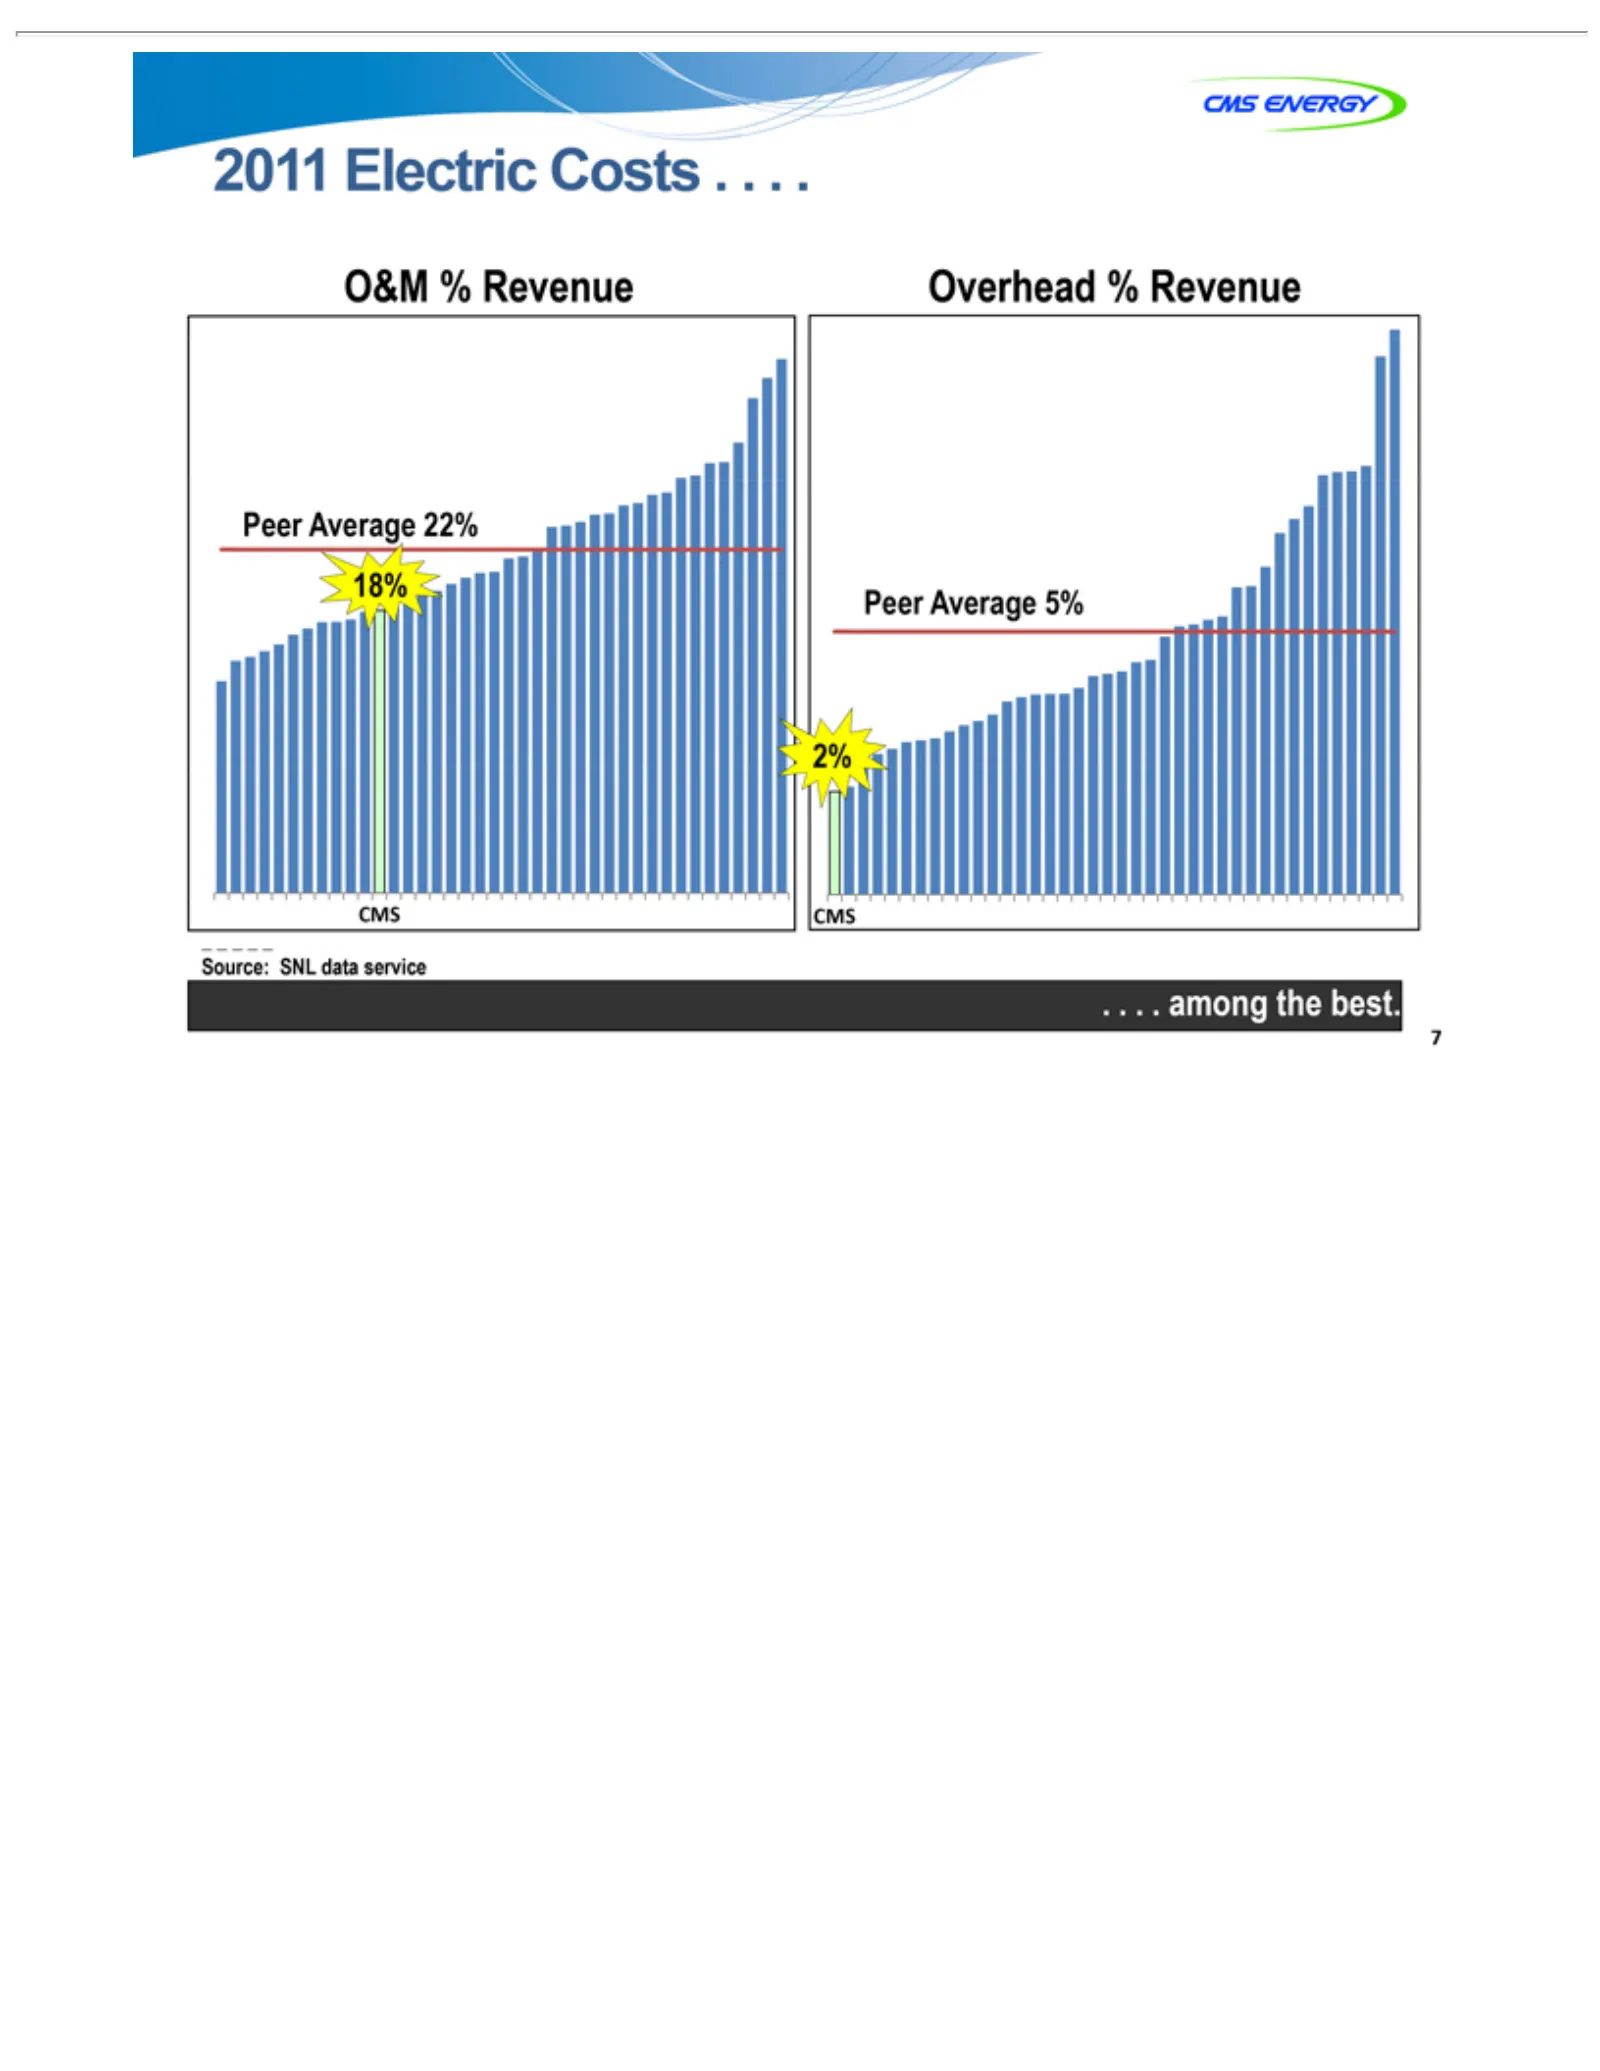
Slide 7: O&M and Overhead Costs vs Peers
2011 O&M Overhead Peer Source: CMS .2% 7 . . . Average among Electric %SNL Revenue %the Revenue data 22% 5% Costs best. service 18% ....
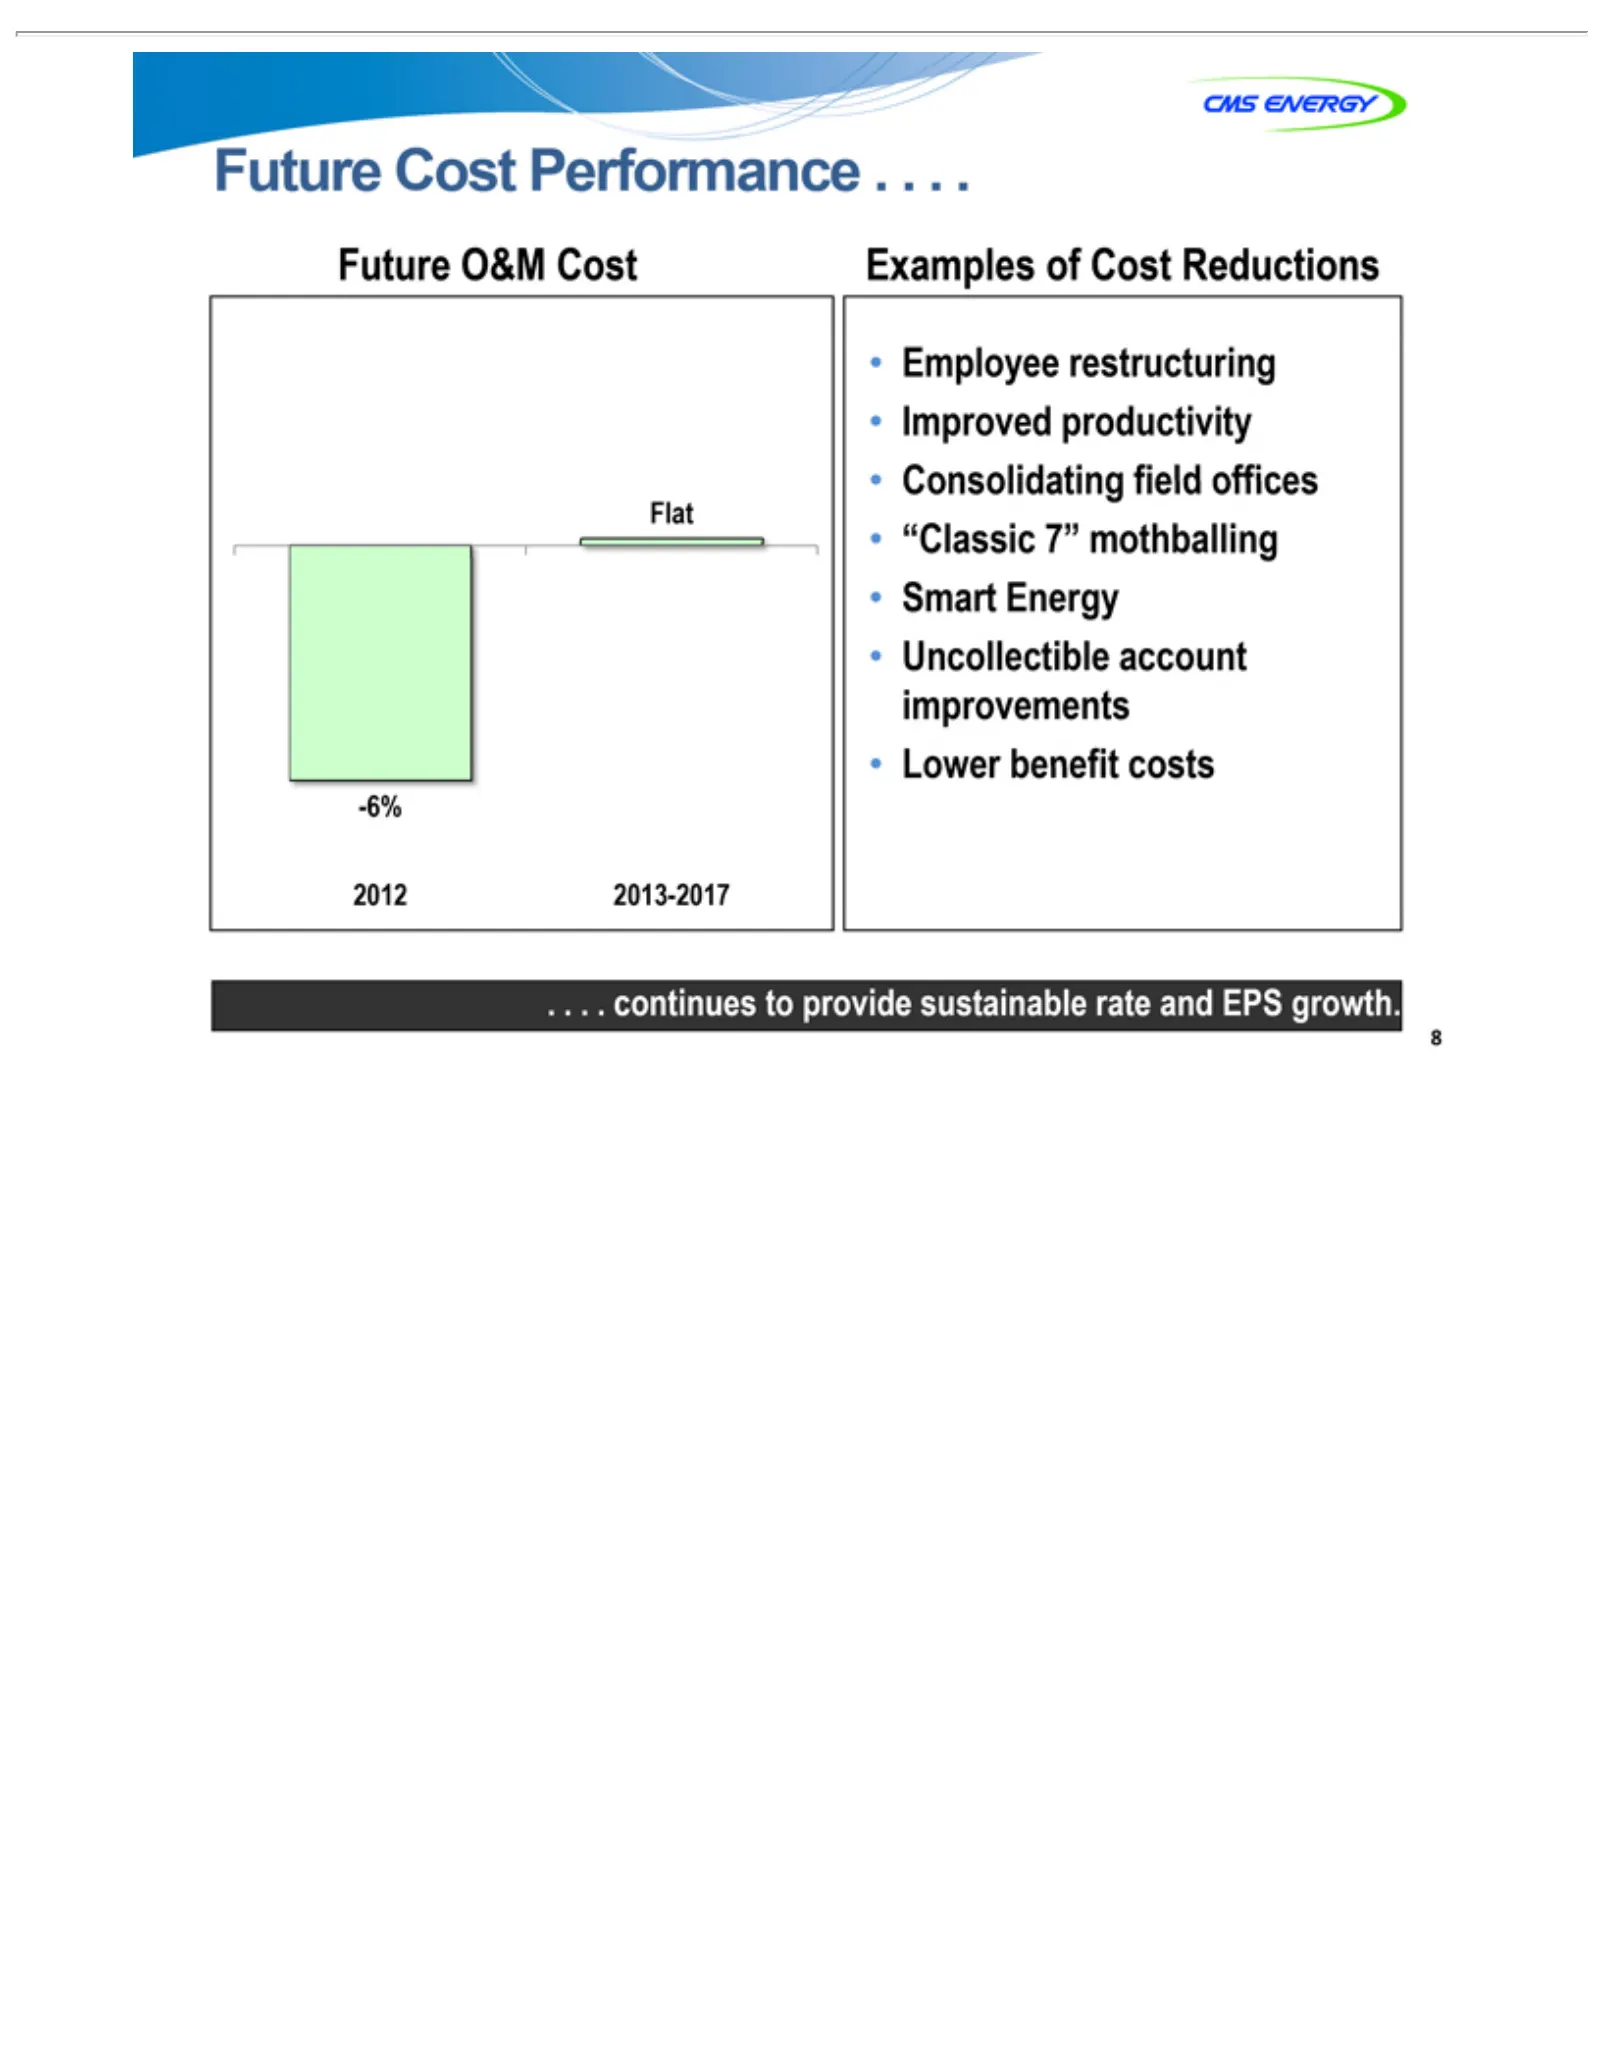
Slide 8: Future Cost Reductions
Future Examples 2012 -6% Flat Employee Improved Consolidating “Classic Smart Uncollectible .Lower 8 . . . continues 2013-2017 Energy benefit Cost O&M 7”productivity of restructuring mothballing Performance Cost Cost account field costs to provide Reductions offices improvements .sustainable ... rate
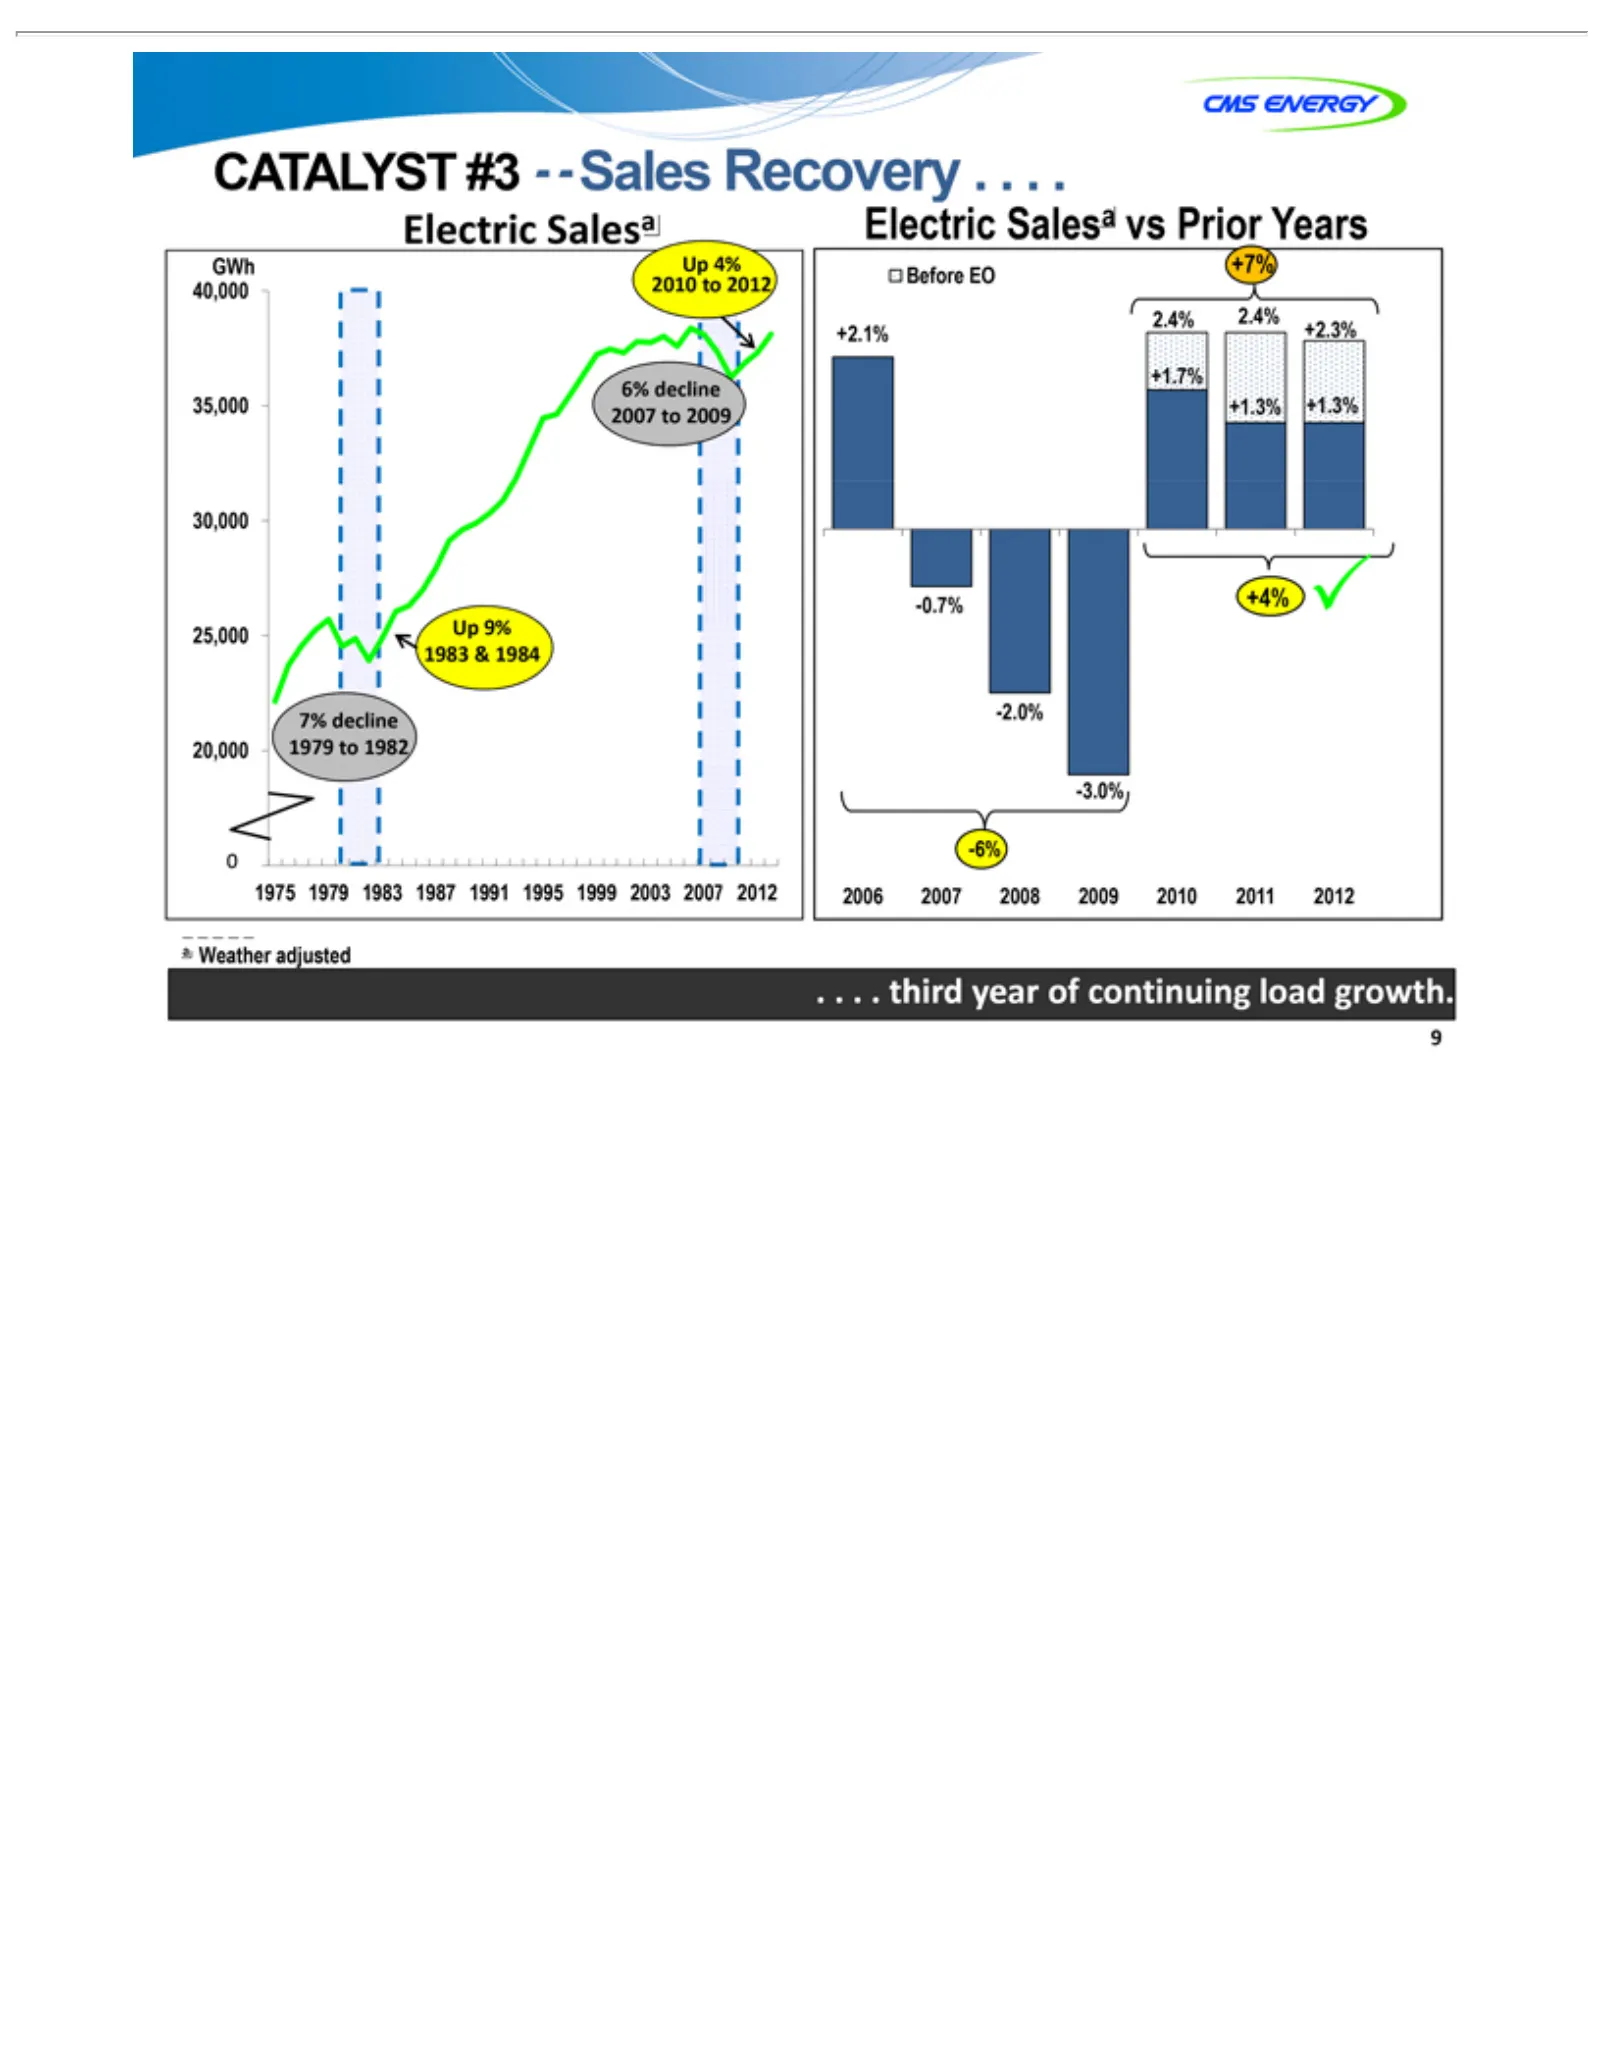
Slide 9: Catalyst #3: Electric Sales Recovery
CATALYST Electric Up GWh 40,000 6% 35,000 25,000 30,000 1983 7% 20,000 1 0 Before 2.4% +2.1% +1.3% +1.7% -0.7% 2006 -6% -3.0% .a-2.0% 9 .975 Weather . 4% .decline third & 1979 2007 2.4% +4% +2.3% +1.3% EO 2010 2007 Up 1979 +7% 1984 Salesa year adjusted 9% 1983 2008 +7% #3 to of Electric 2012 2009 19
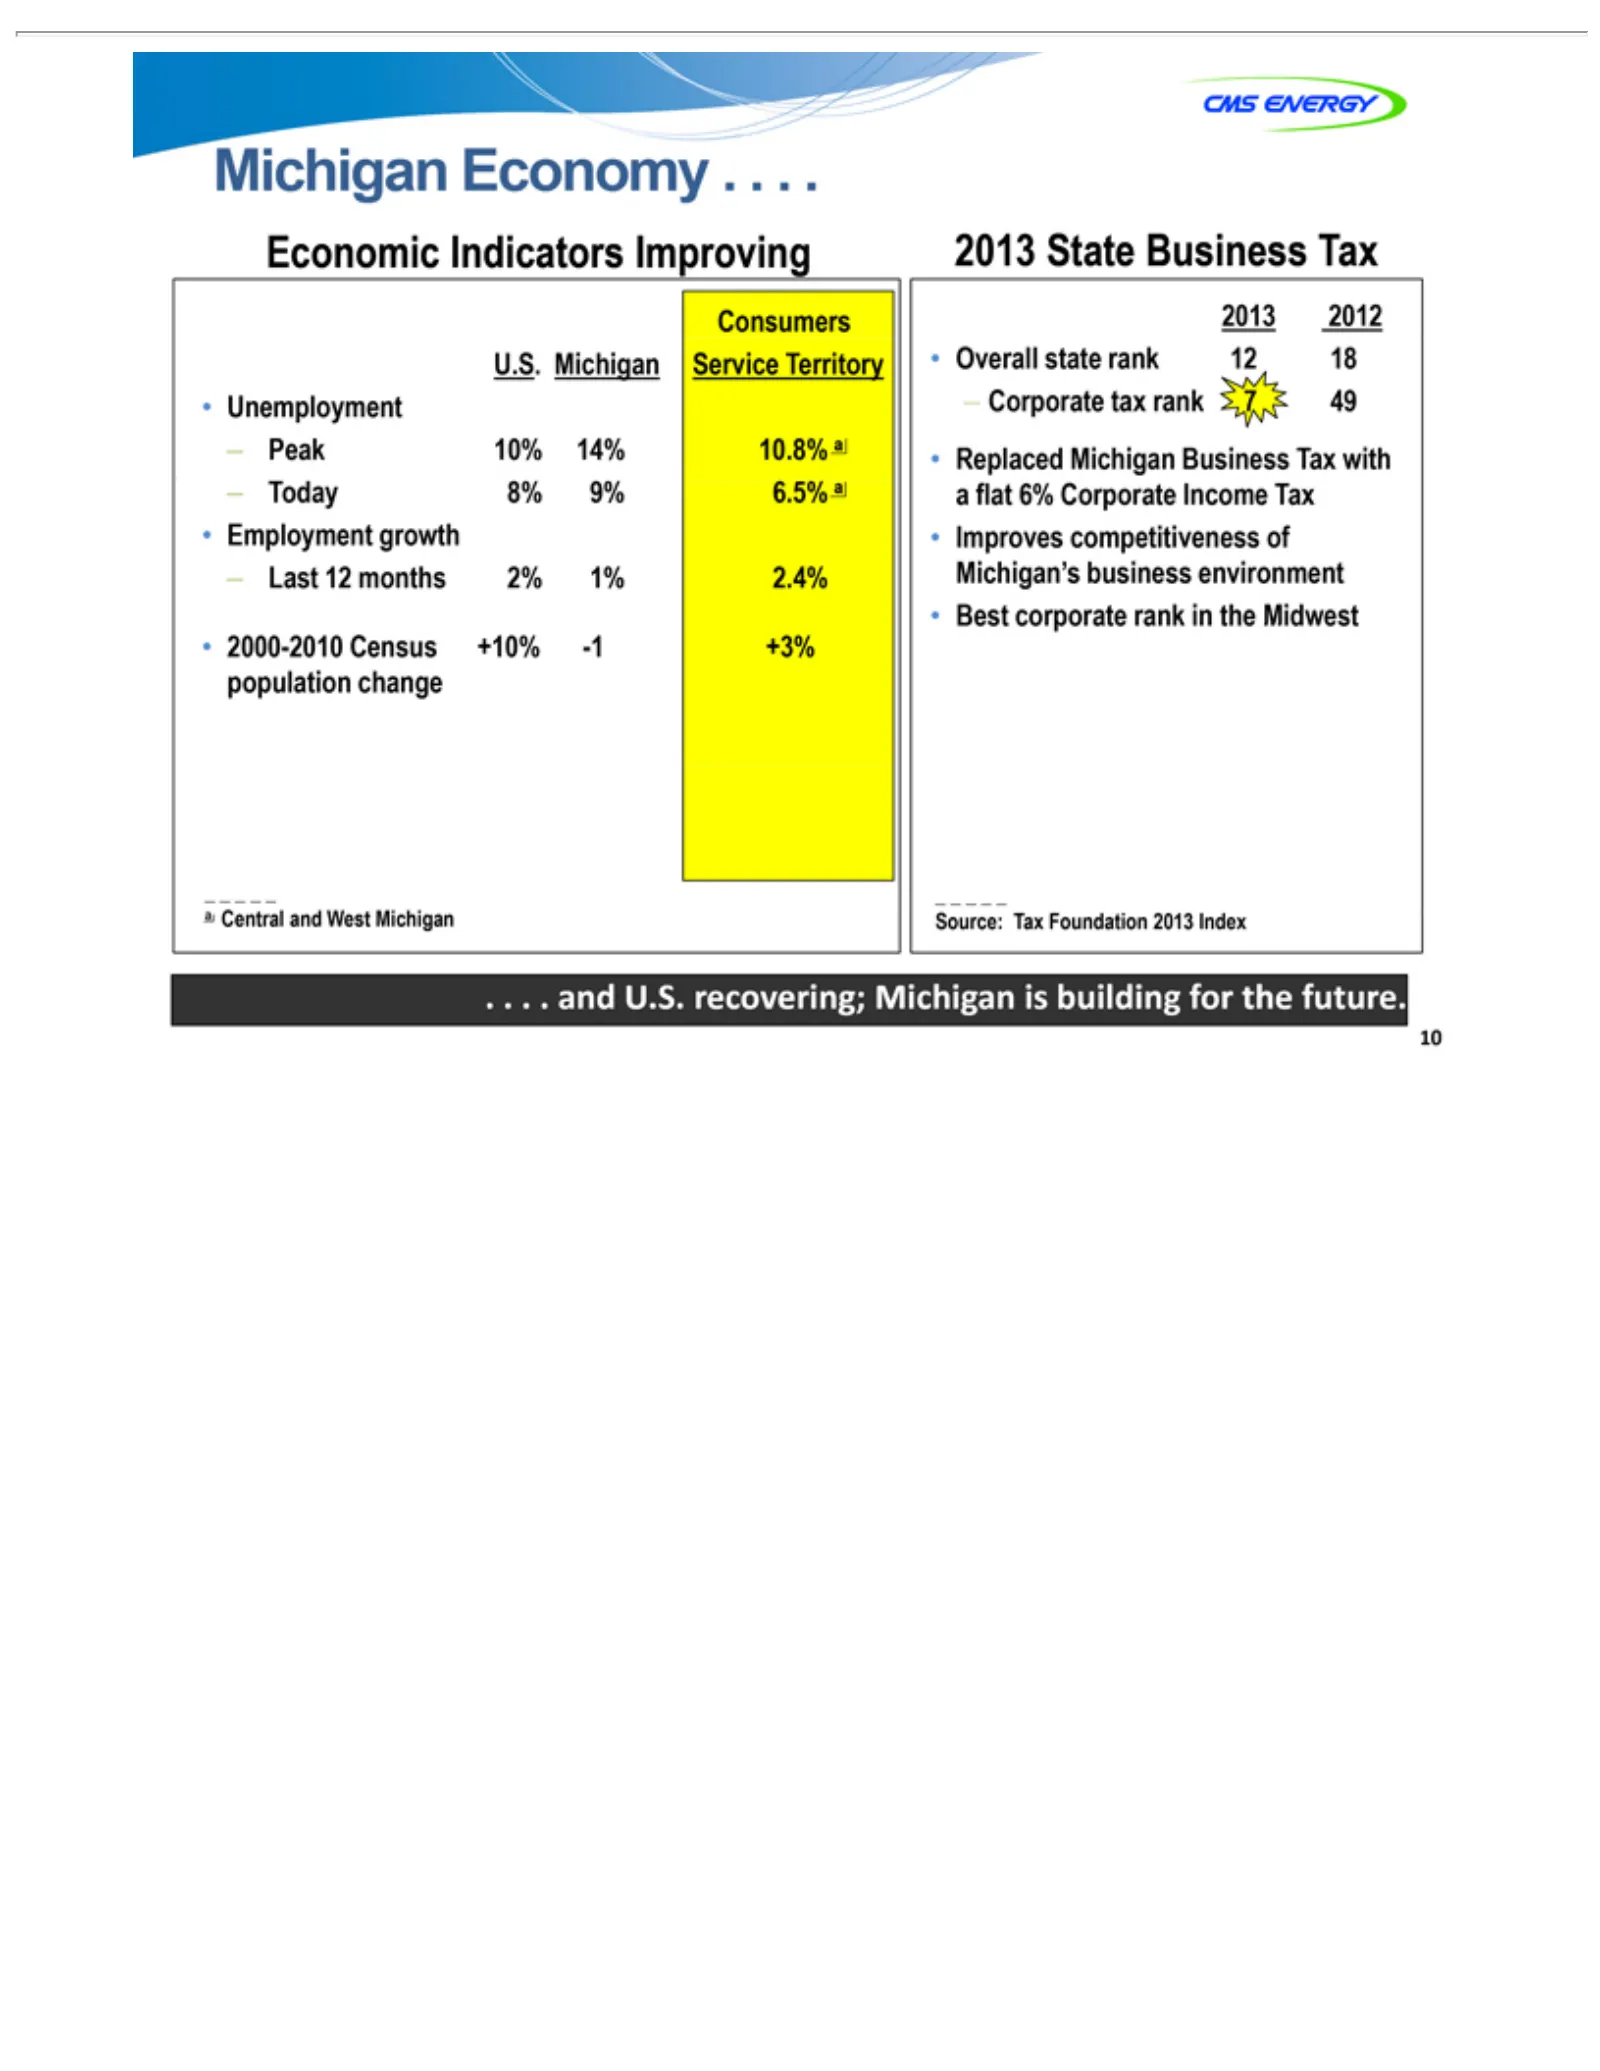
Slide 10: Michigan Economy Recovering
Economic Employment Today Peak Unemployment Last 2000-2010 population Service Consumers -1 1% 9% 14% Michigan +10% 2% 8% 10% U.S. 10.8% 6.5% +3% 2.4% 2013 Overall – aReplaced Improves Michigan’s Best .Source: 10 .flat Central Corporate . . 12 and corporate State 2012 6% a amonths Territory state Tax
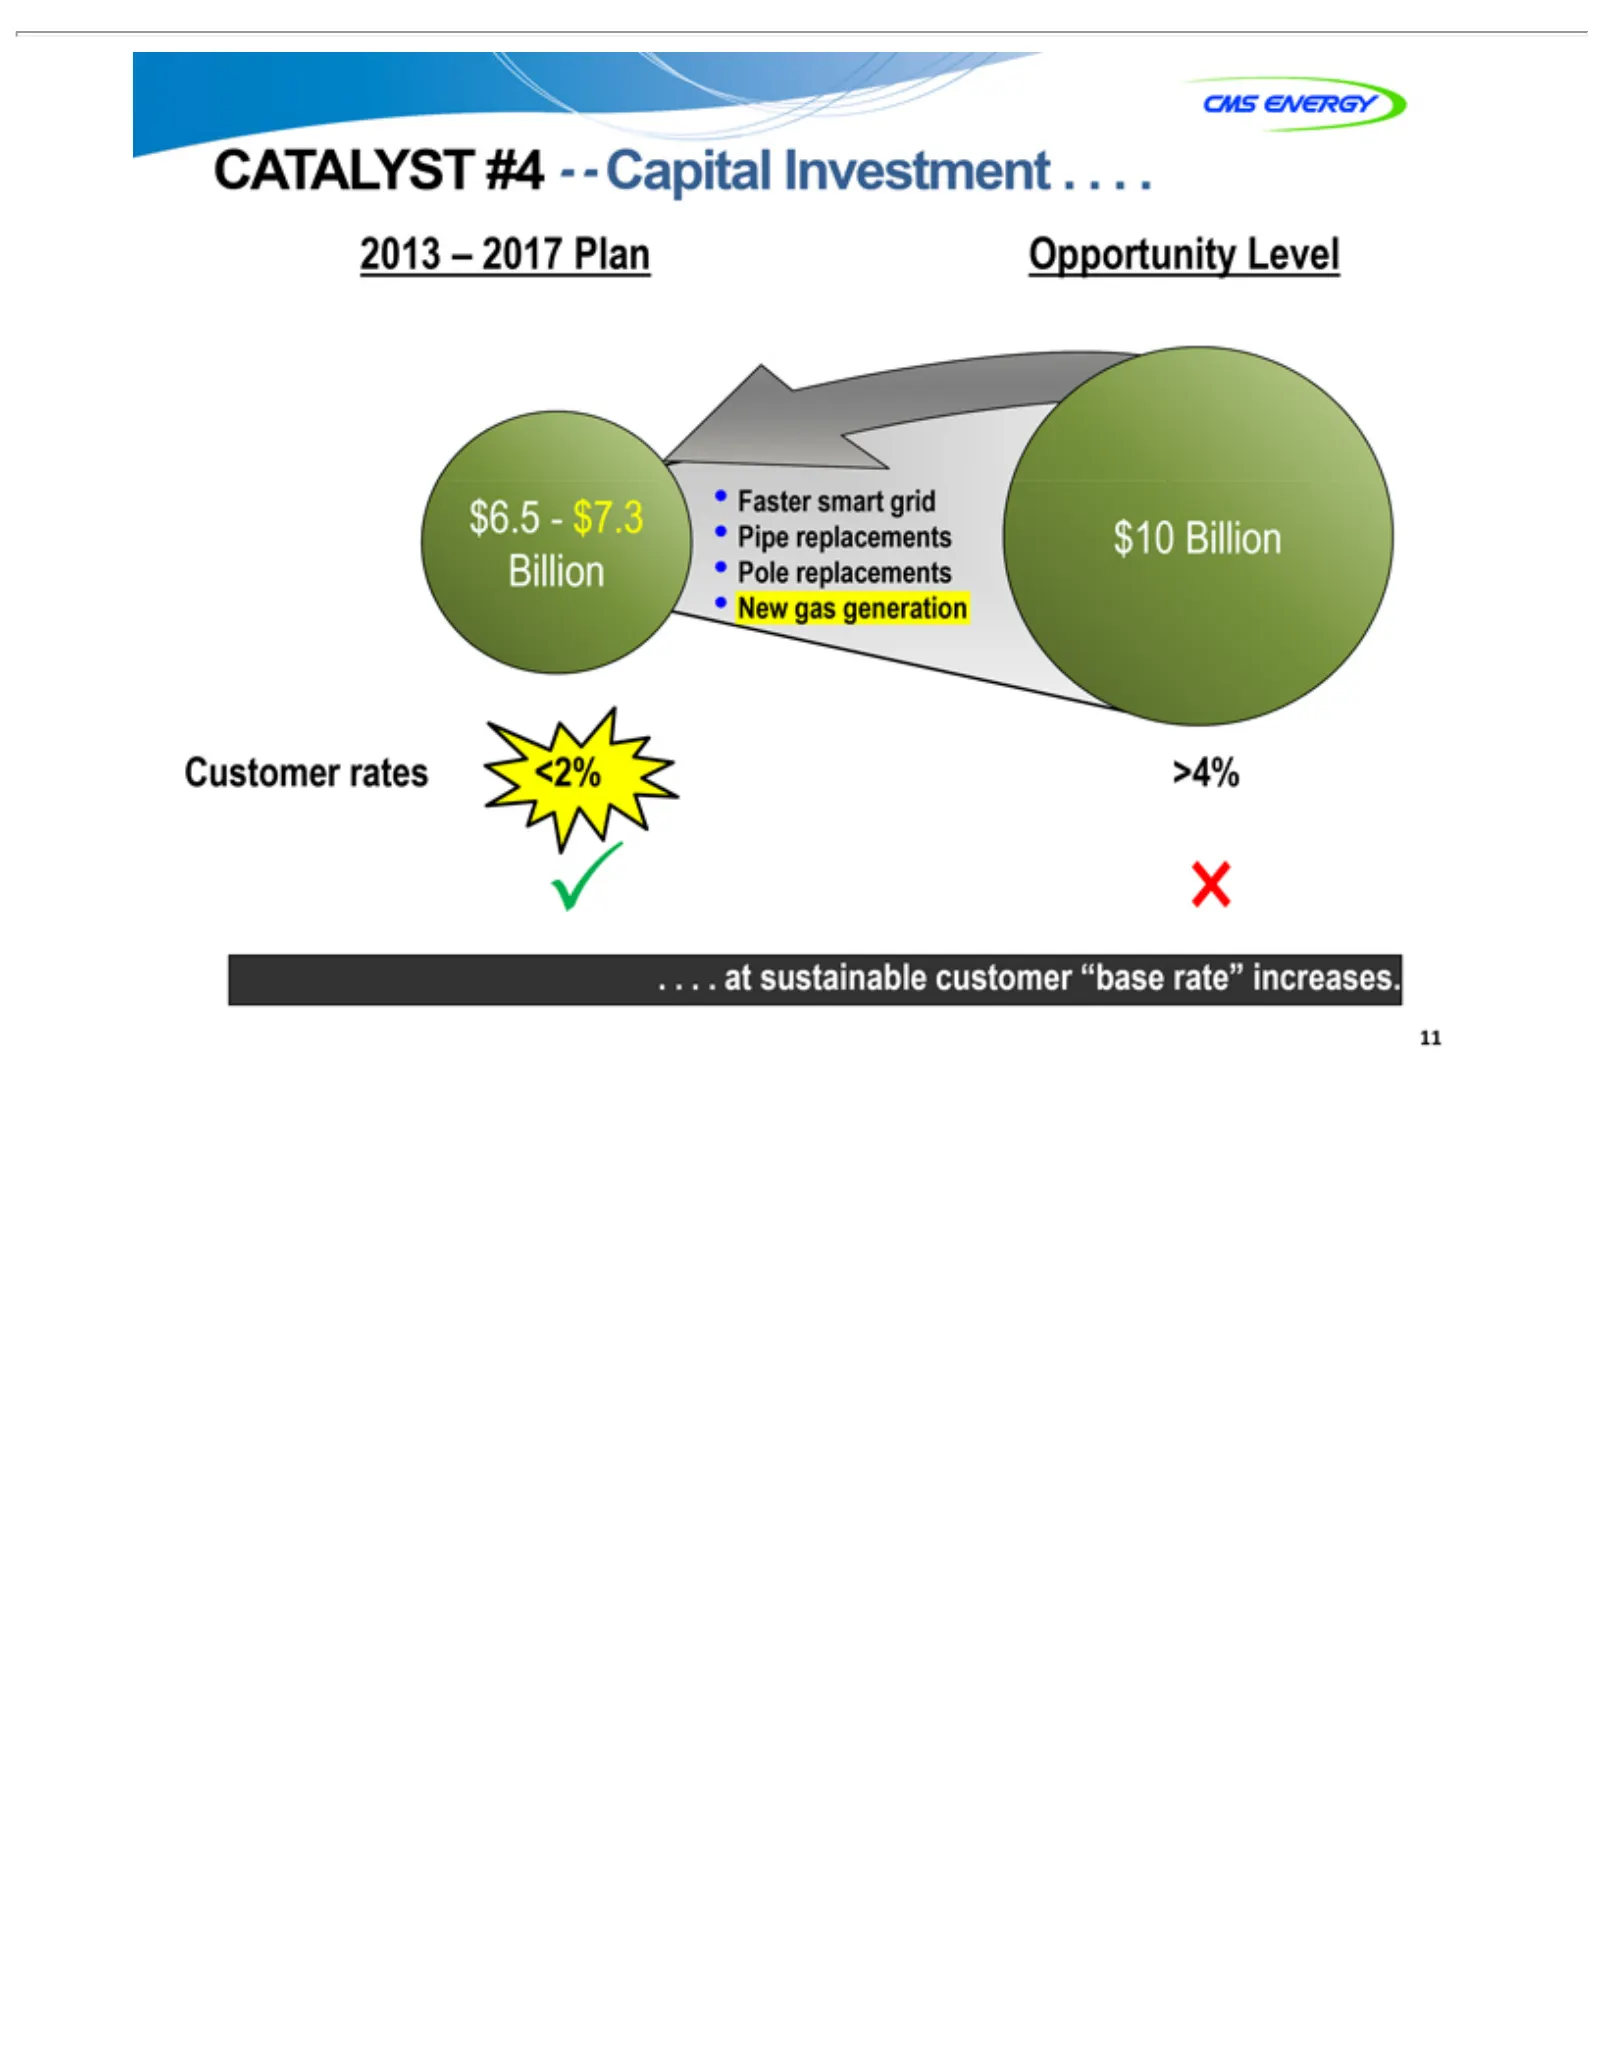
Slide 11: Catalyst #4: Investment Opportunity
CATALYST 2013 Opportunity $6.5—$7.3 Faster $10 .Customer >4% 11 . . .Billion at–smart sustainable 2017 rates Billion Level #4 grid Plan <2% —Pipe Capital customer replacements Investment “base rate” Pole . .increases. .replacements . New gas generation
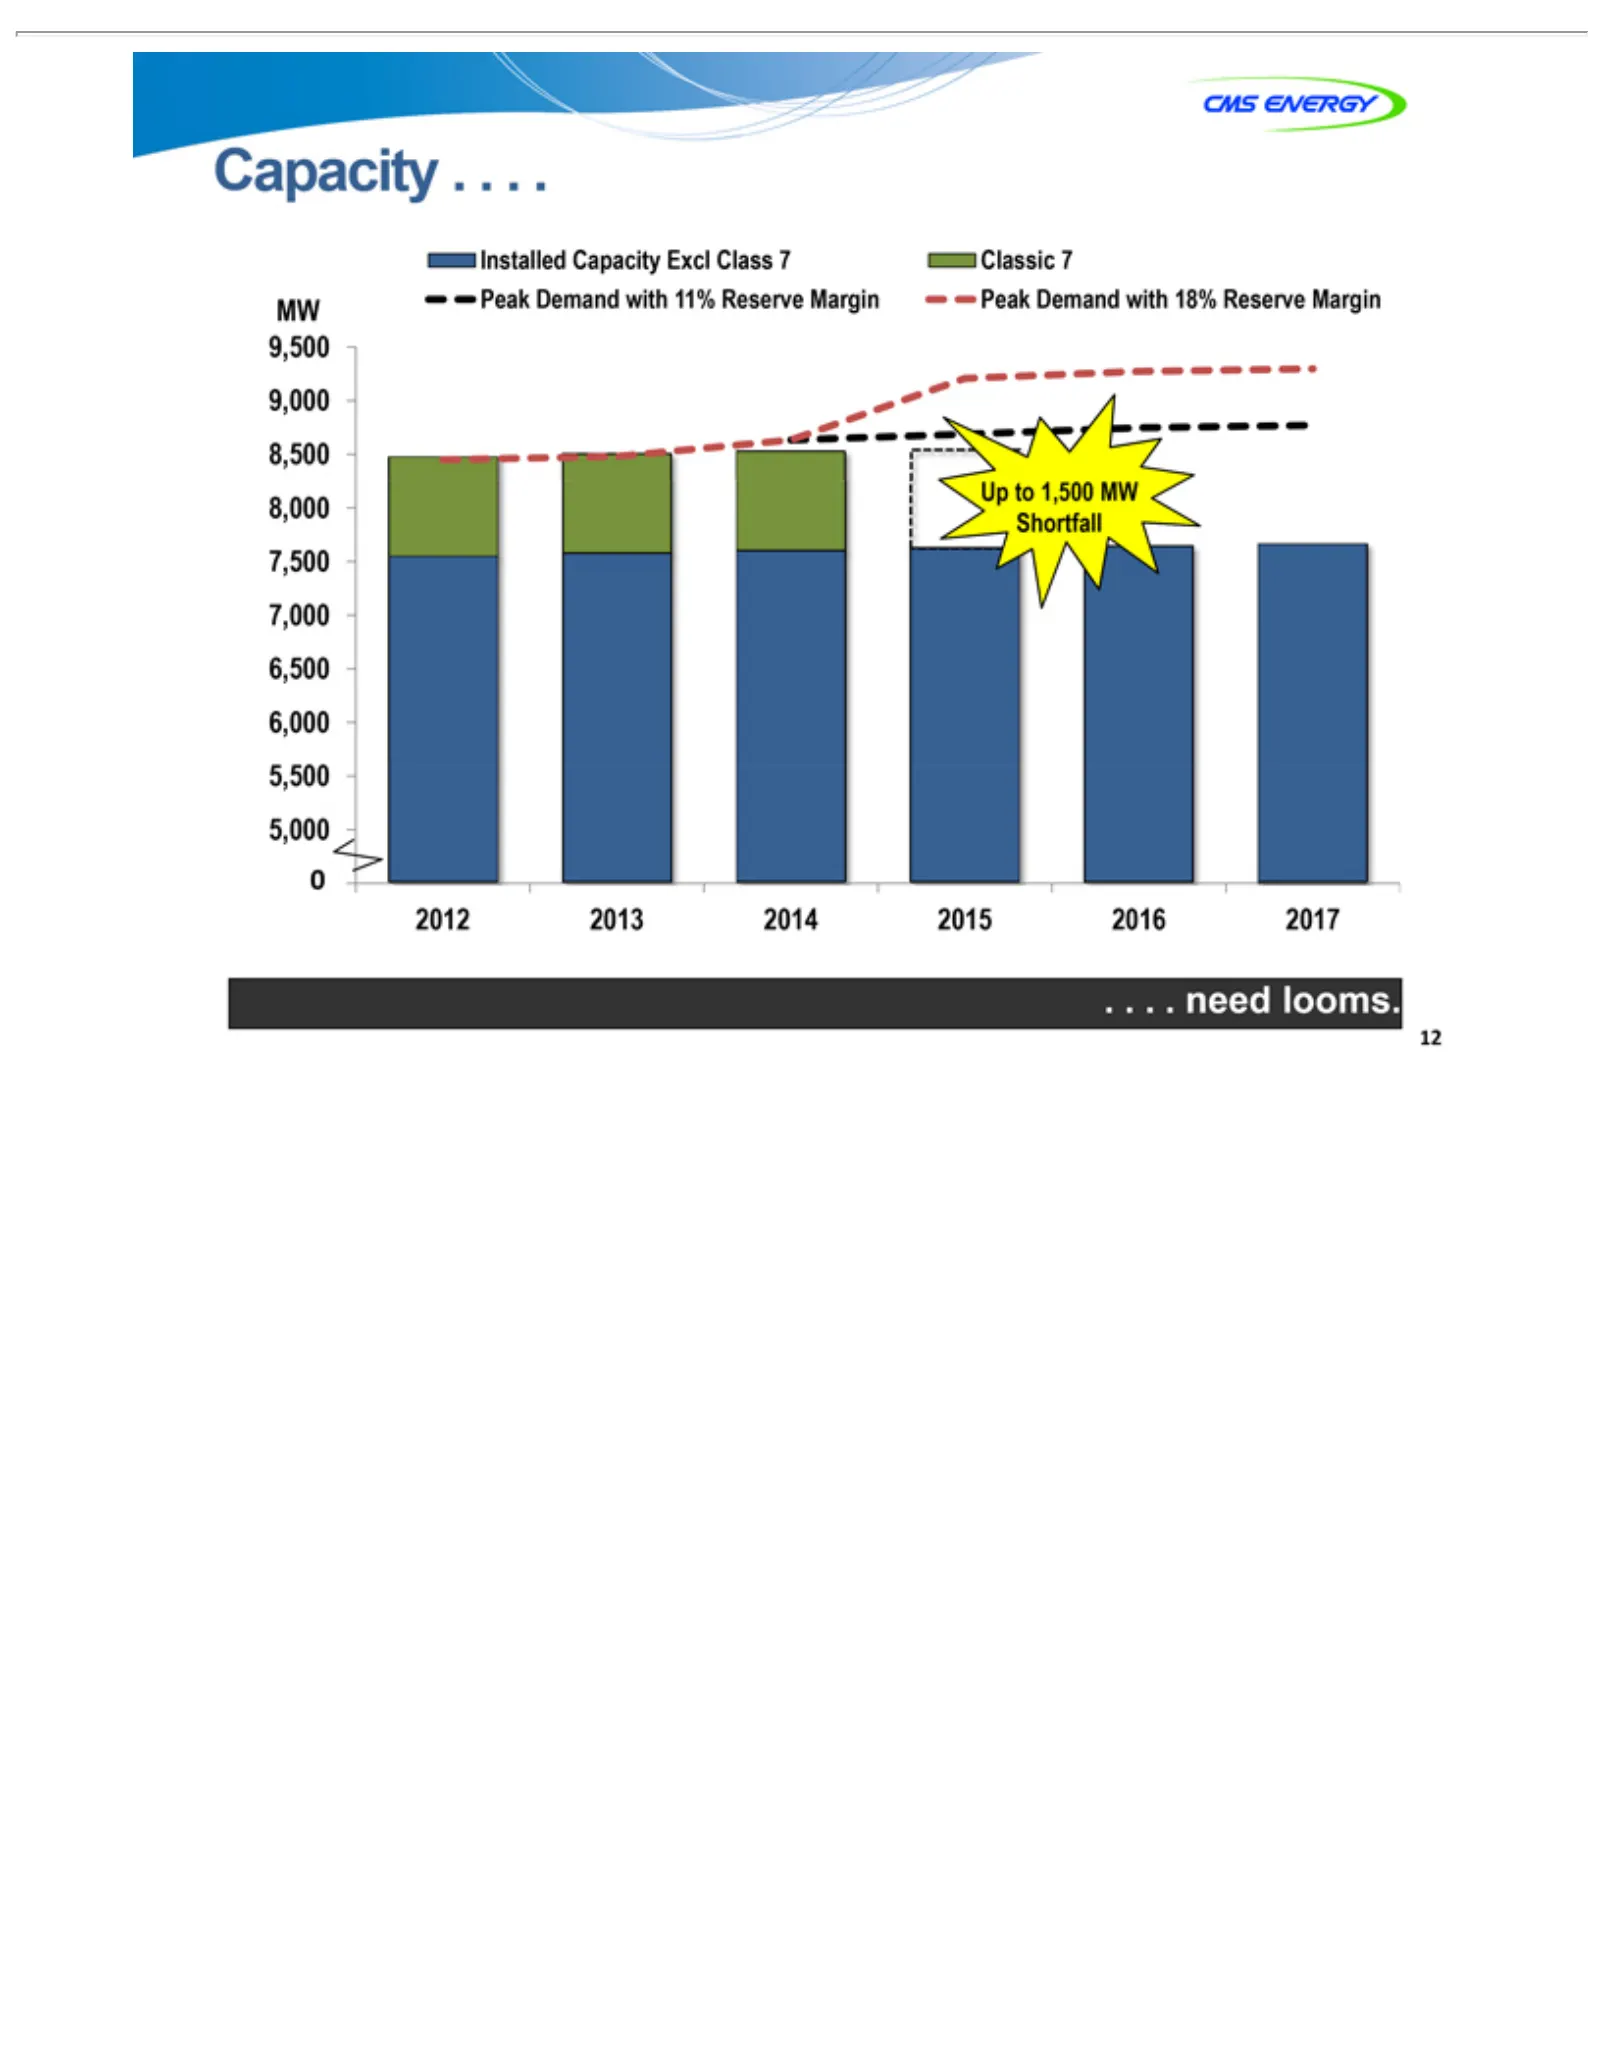
Slide 12: Capacity Need Looms
Capacity Installed MW 2 .0 12.012 . . need Peak 9,500 2013 Capacity . looms. Demand ..2014 9,000 . . 2015 8,500 Excl with 2016 8,000 Class 11%2017 Reserve 77,500 Classic 7,000 Margin 7 6,500 Peak 6,000 Demand 5,500 with 5,00018% Reserve Margin
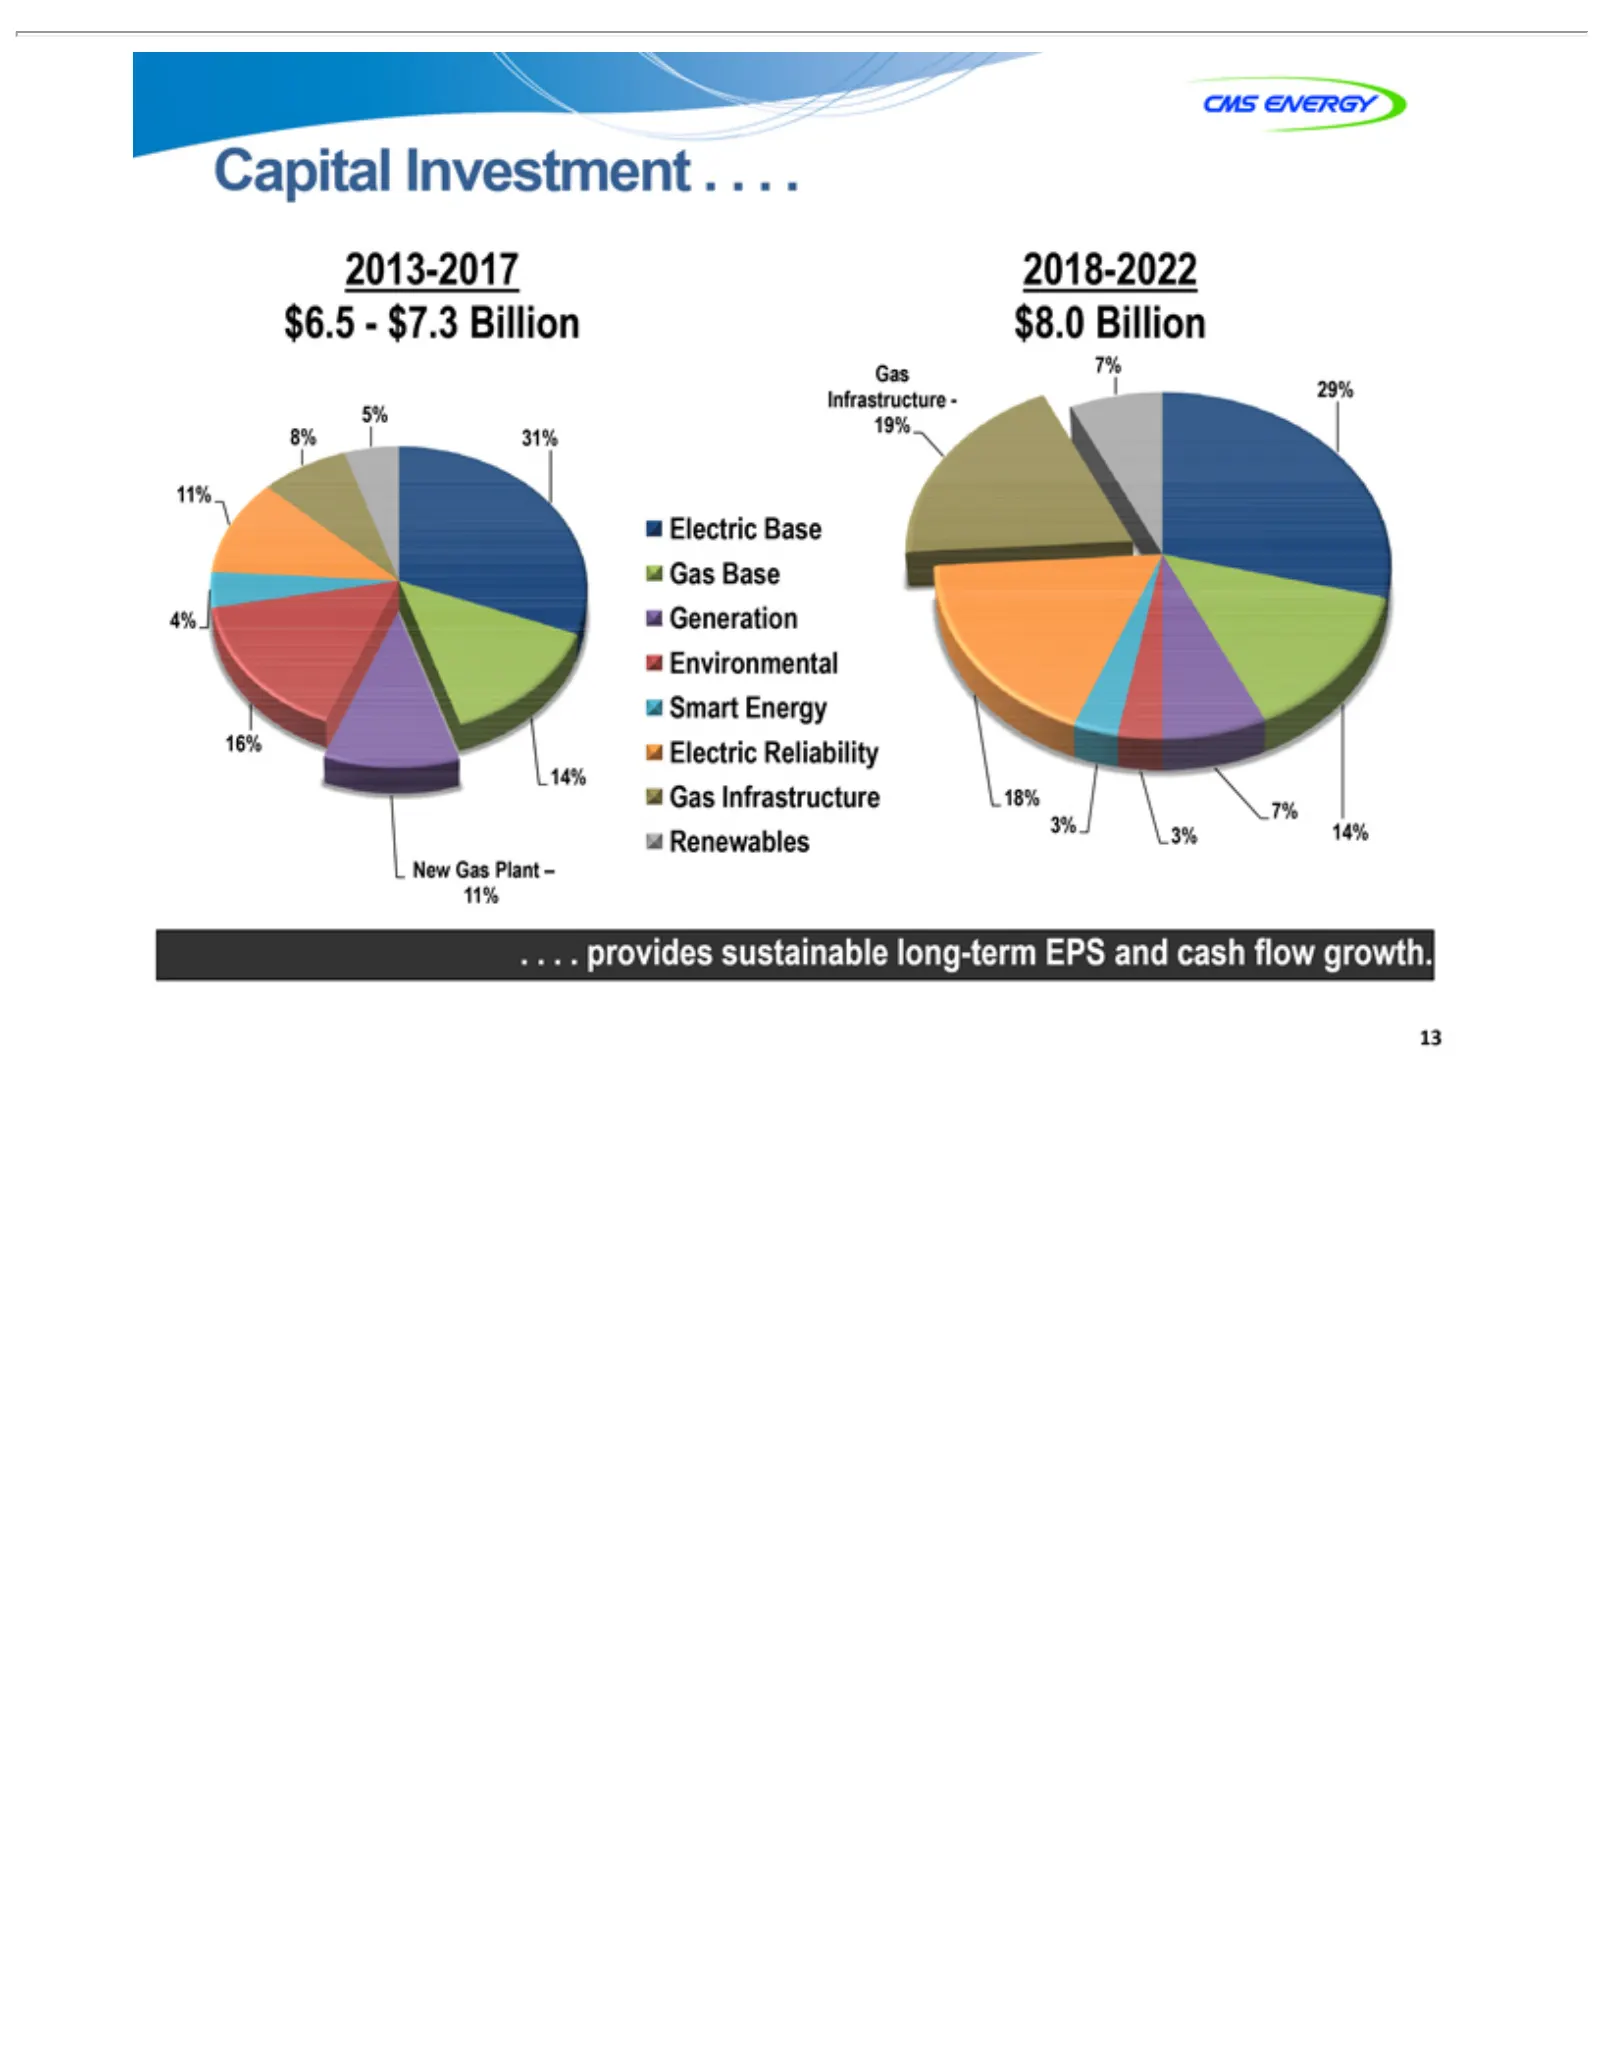
Slide 13: Capital Investment Plan
Capital 2013-2017 2018-2022 Electric 8% 5% New 14% 16% 4% Gas Infrastructure—29% 3% 7% .18% 13 . . .14% 31% 7% provides GasInvestment Base 11% 3% Plant $6.5—$7.3 $8.0 Gas sustainable –11% Billion Base . .19% . .Billion Generation long-termEnvironmental EPS and cash flow Smartgrowth. Energy Electric
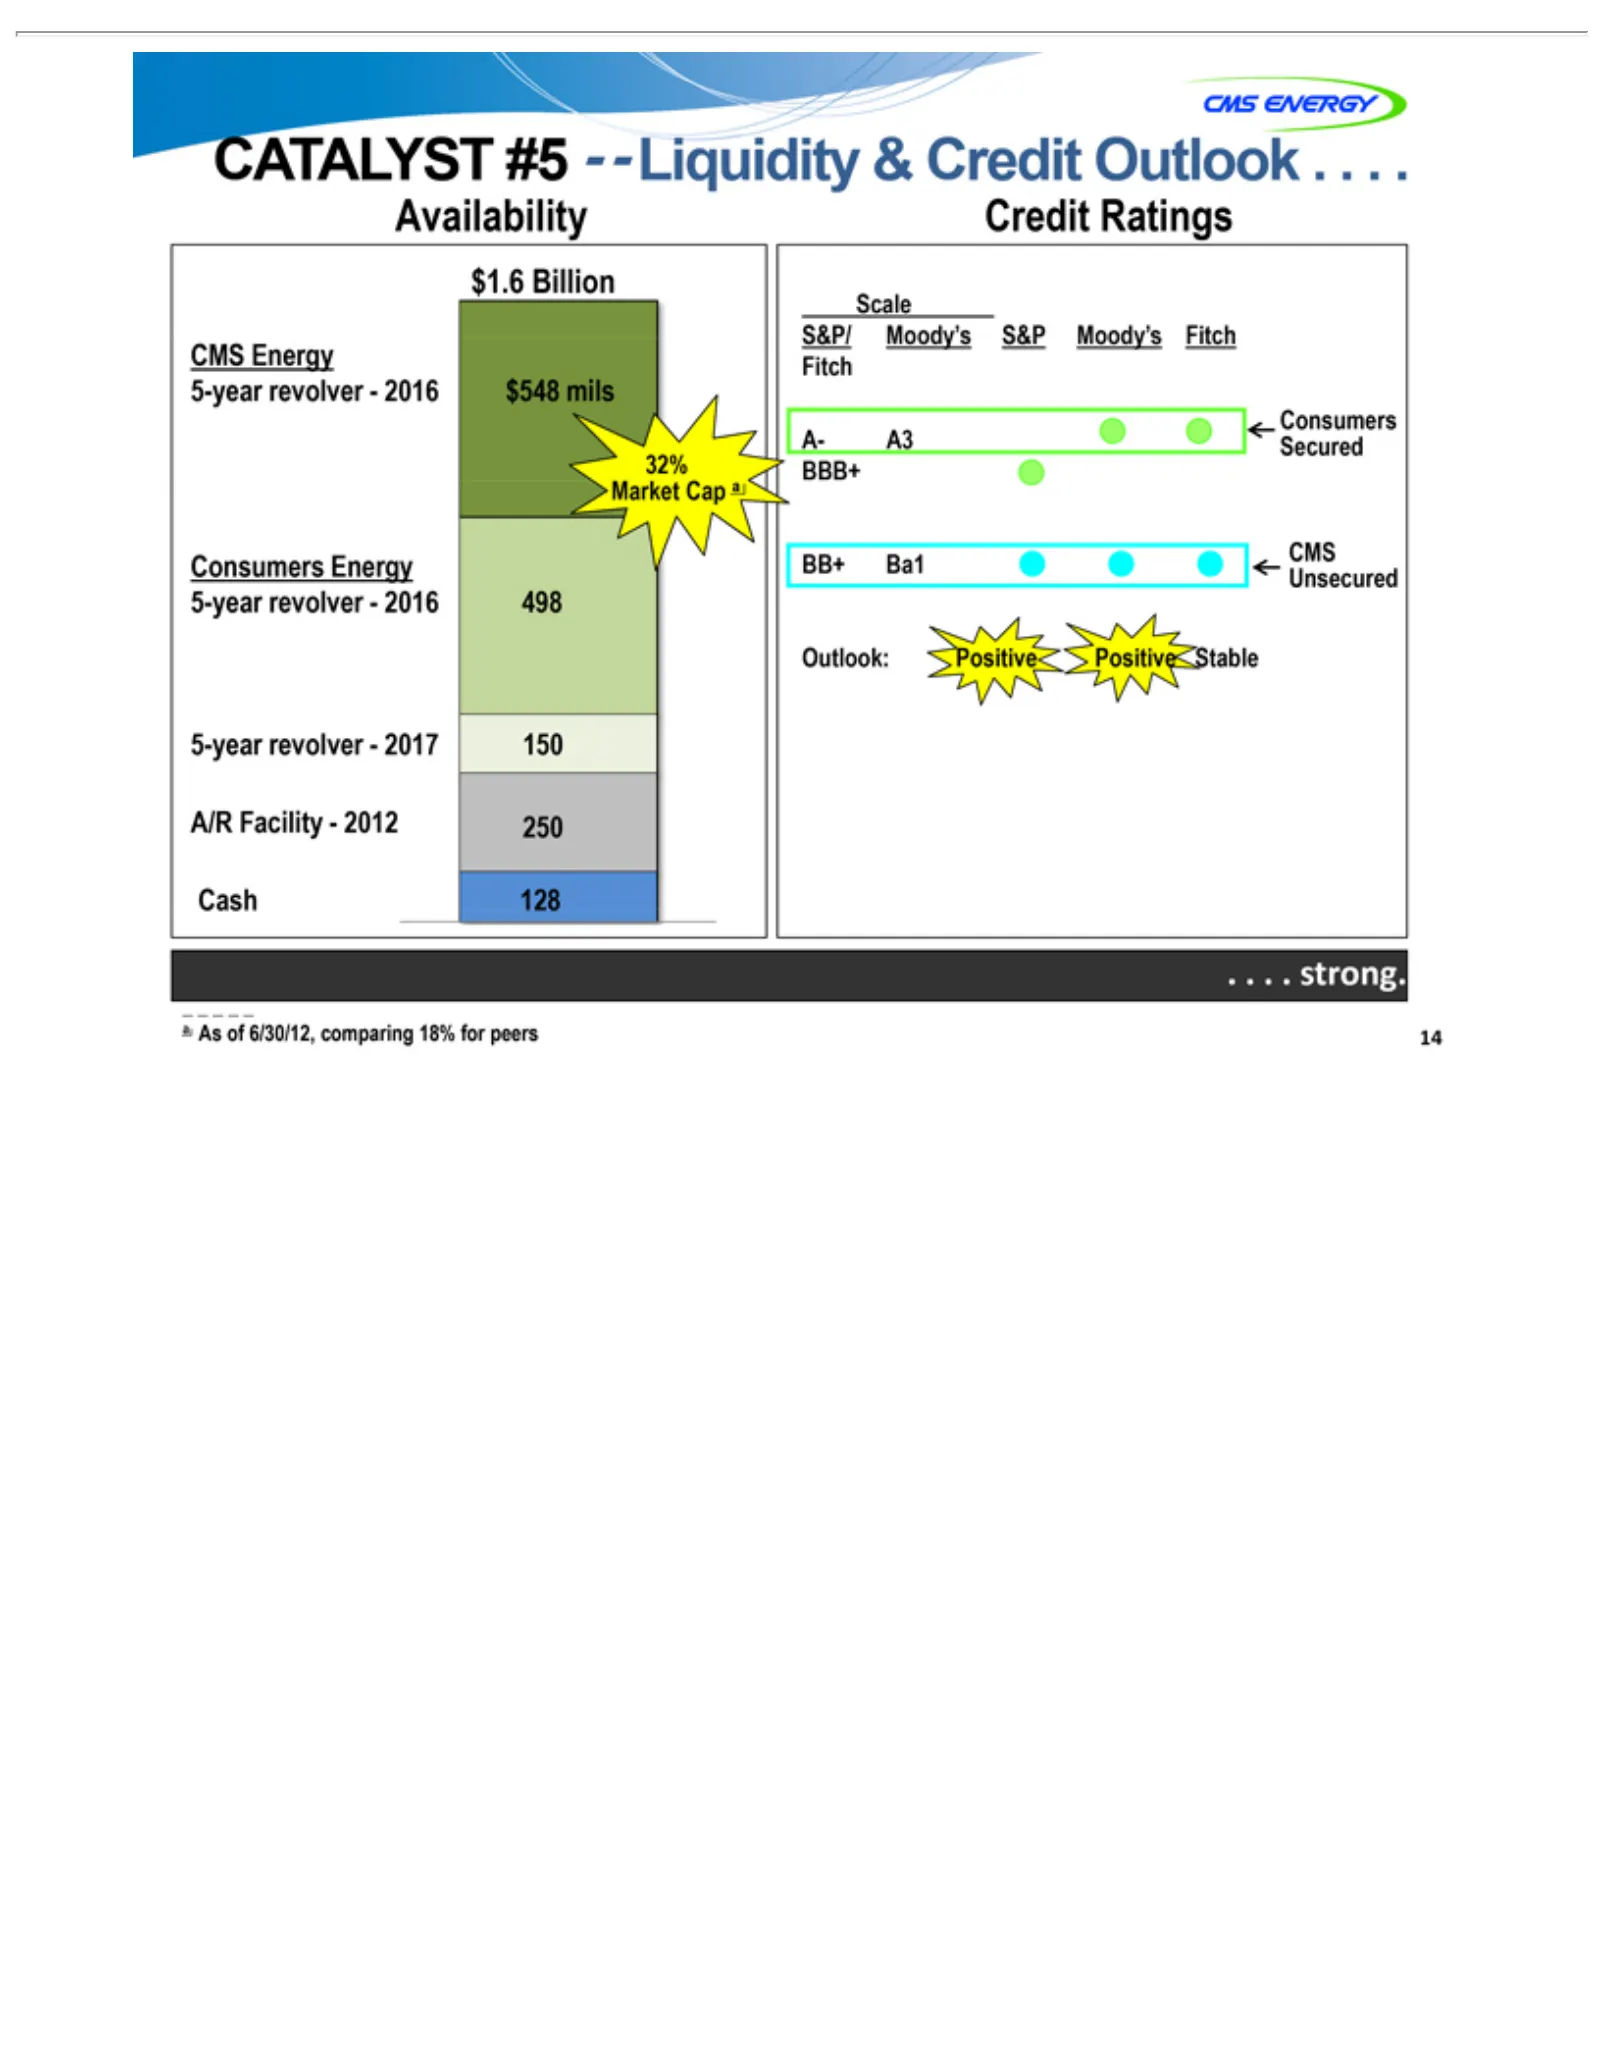
Slide 14: Catalyst #5: Credit Availability and Liquidity
CATALYST Availability CMS 5-year A/R $1.6 Cash $548 Market 32% S&P/ Scale 128 250 150 498 A- Consumers Fitch BB+ BBB+ Outlook: a.Unsecured 14 .As .A3 . Facility—2012 Billion strong. of Ba1 mils Energy Moody’s Secured revolver—2016 revolver—2017 6/30/12, Cap Positive CMS Energy Credit a#5 S&P —compar
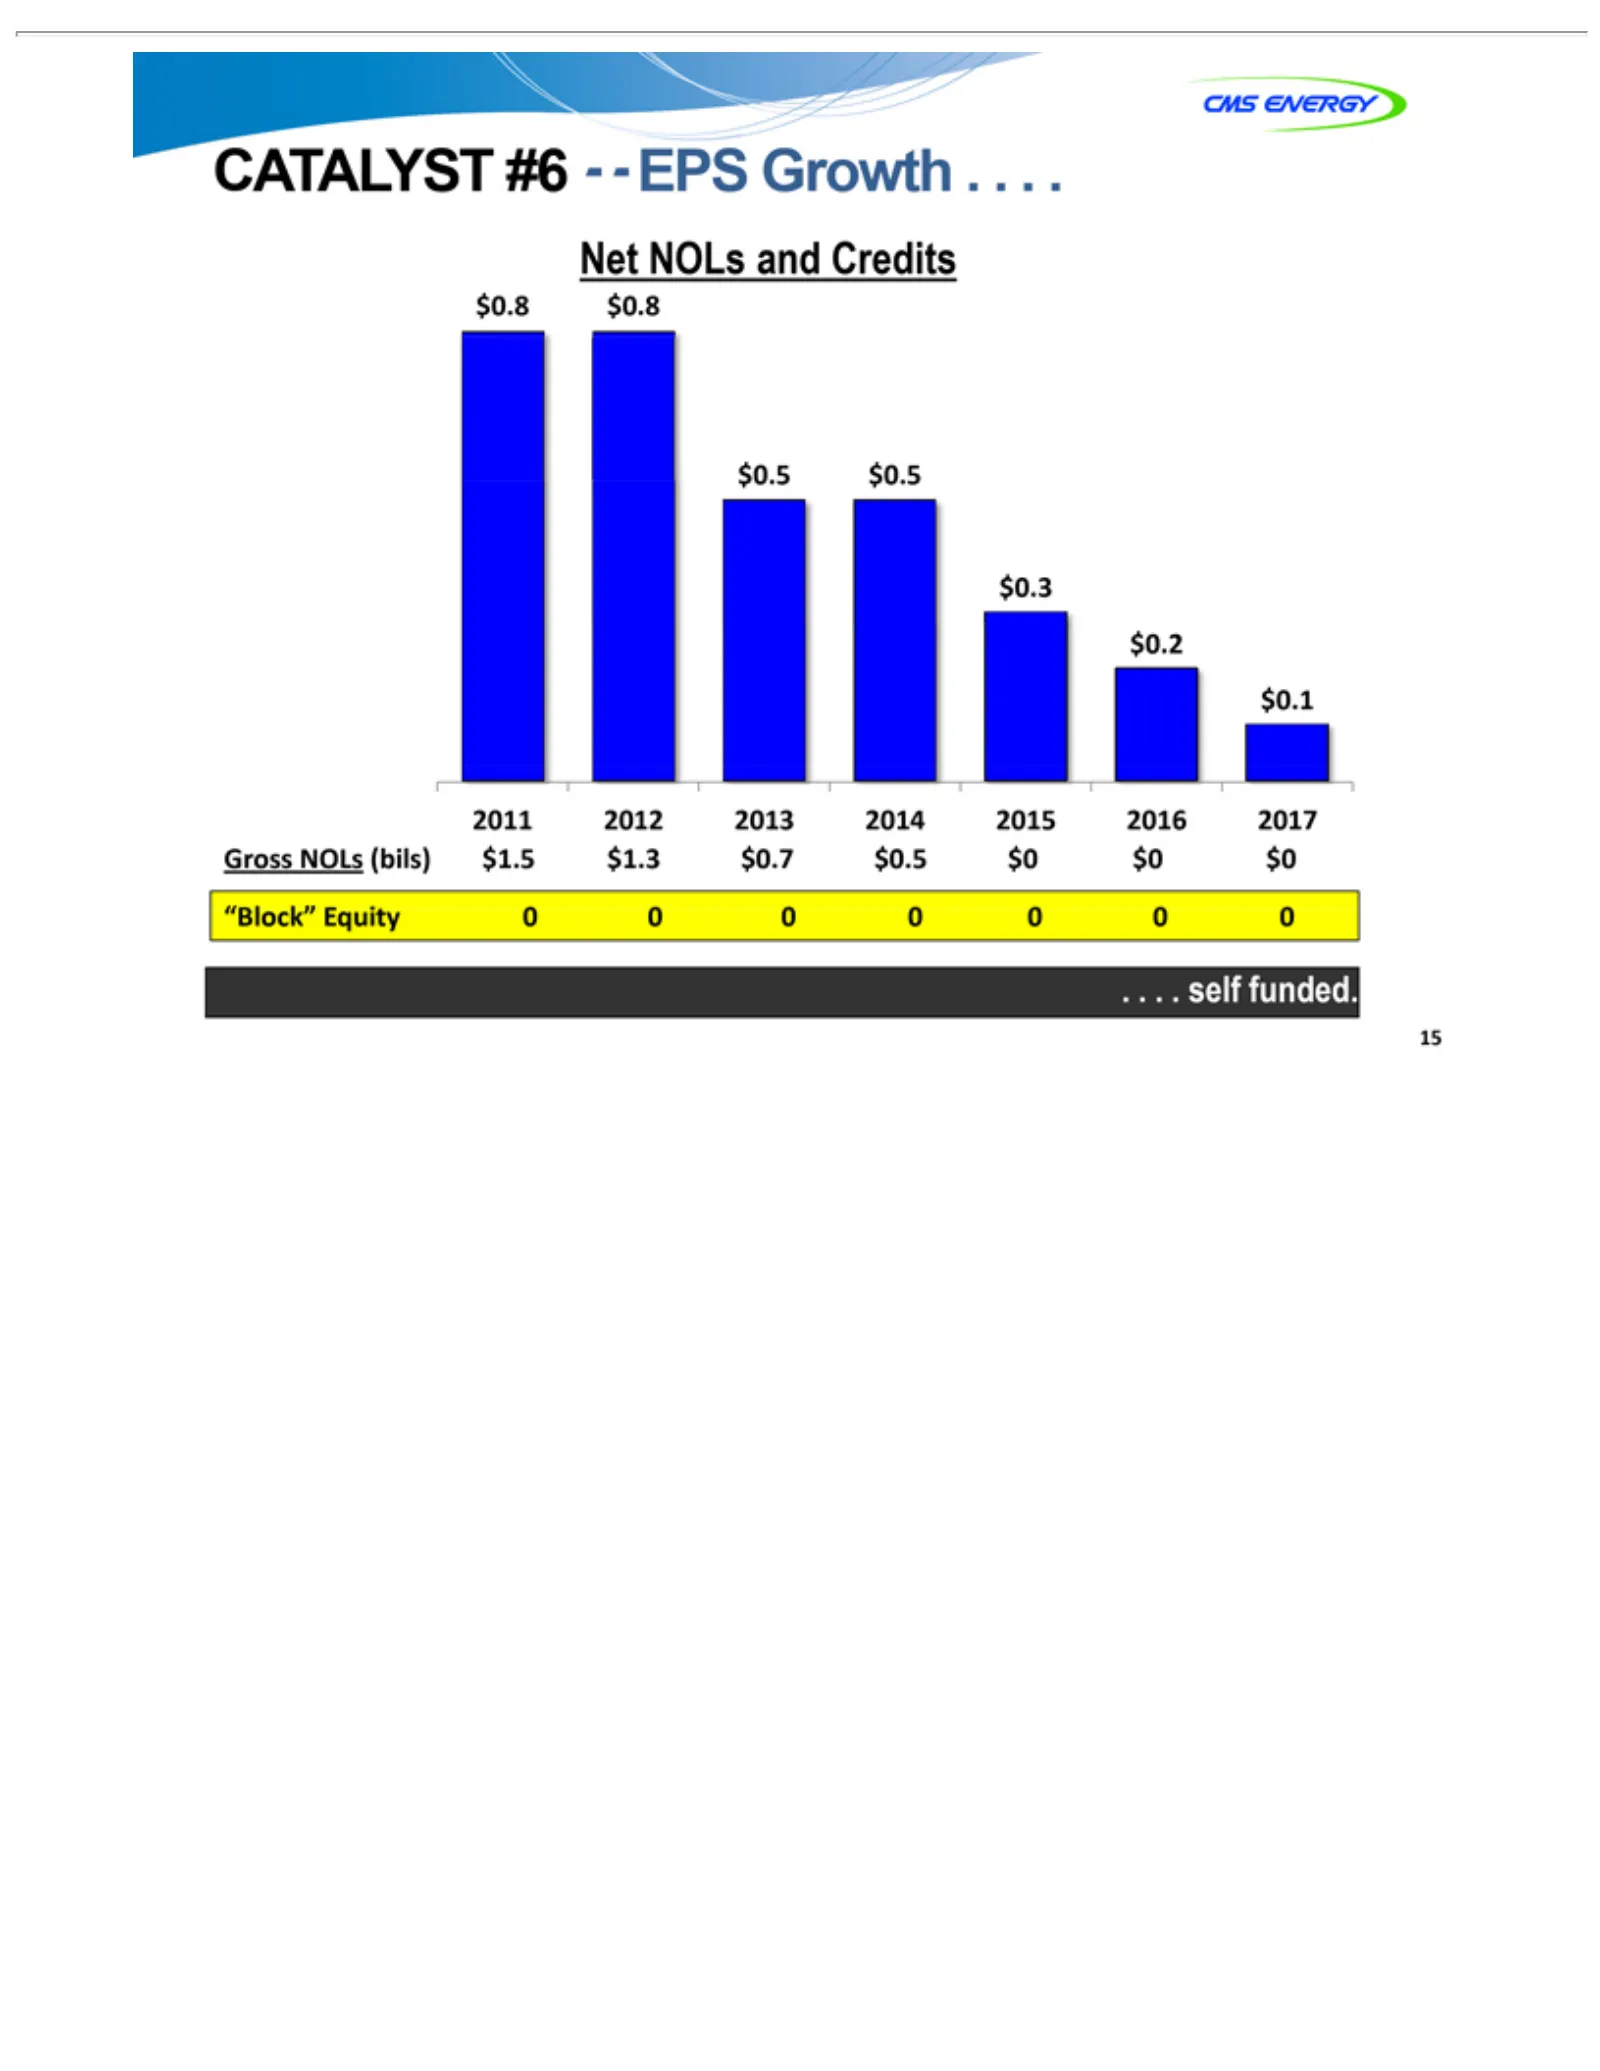
Slide 15: Catalyst #6: NOLs and Credits Self-Fund Equity
CATALYST Net $0.8 $0.5 2011 $0.1 $0.2 $0.3 $1.5 0 Gross .“Block” 15 .0. .0NOLs $0.8 $0.5 $1.3 selfelf 2012 0NOLs 0Equity 0$0.7 and 2013 0funded. #6 (bils) $0.5 Credits —2014 EPS $02015 $0 Growth $02016. .2017 ..
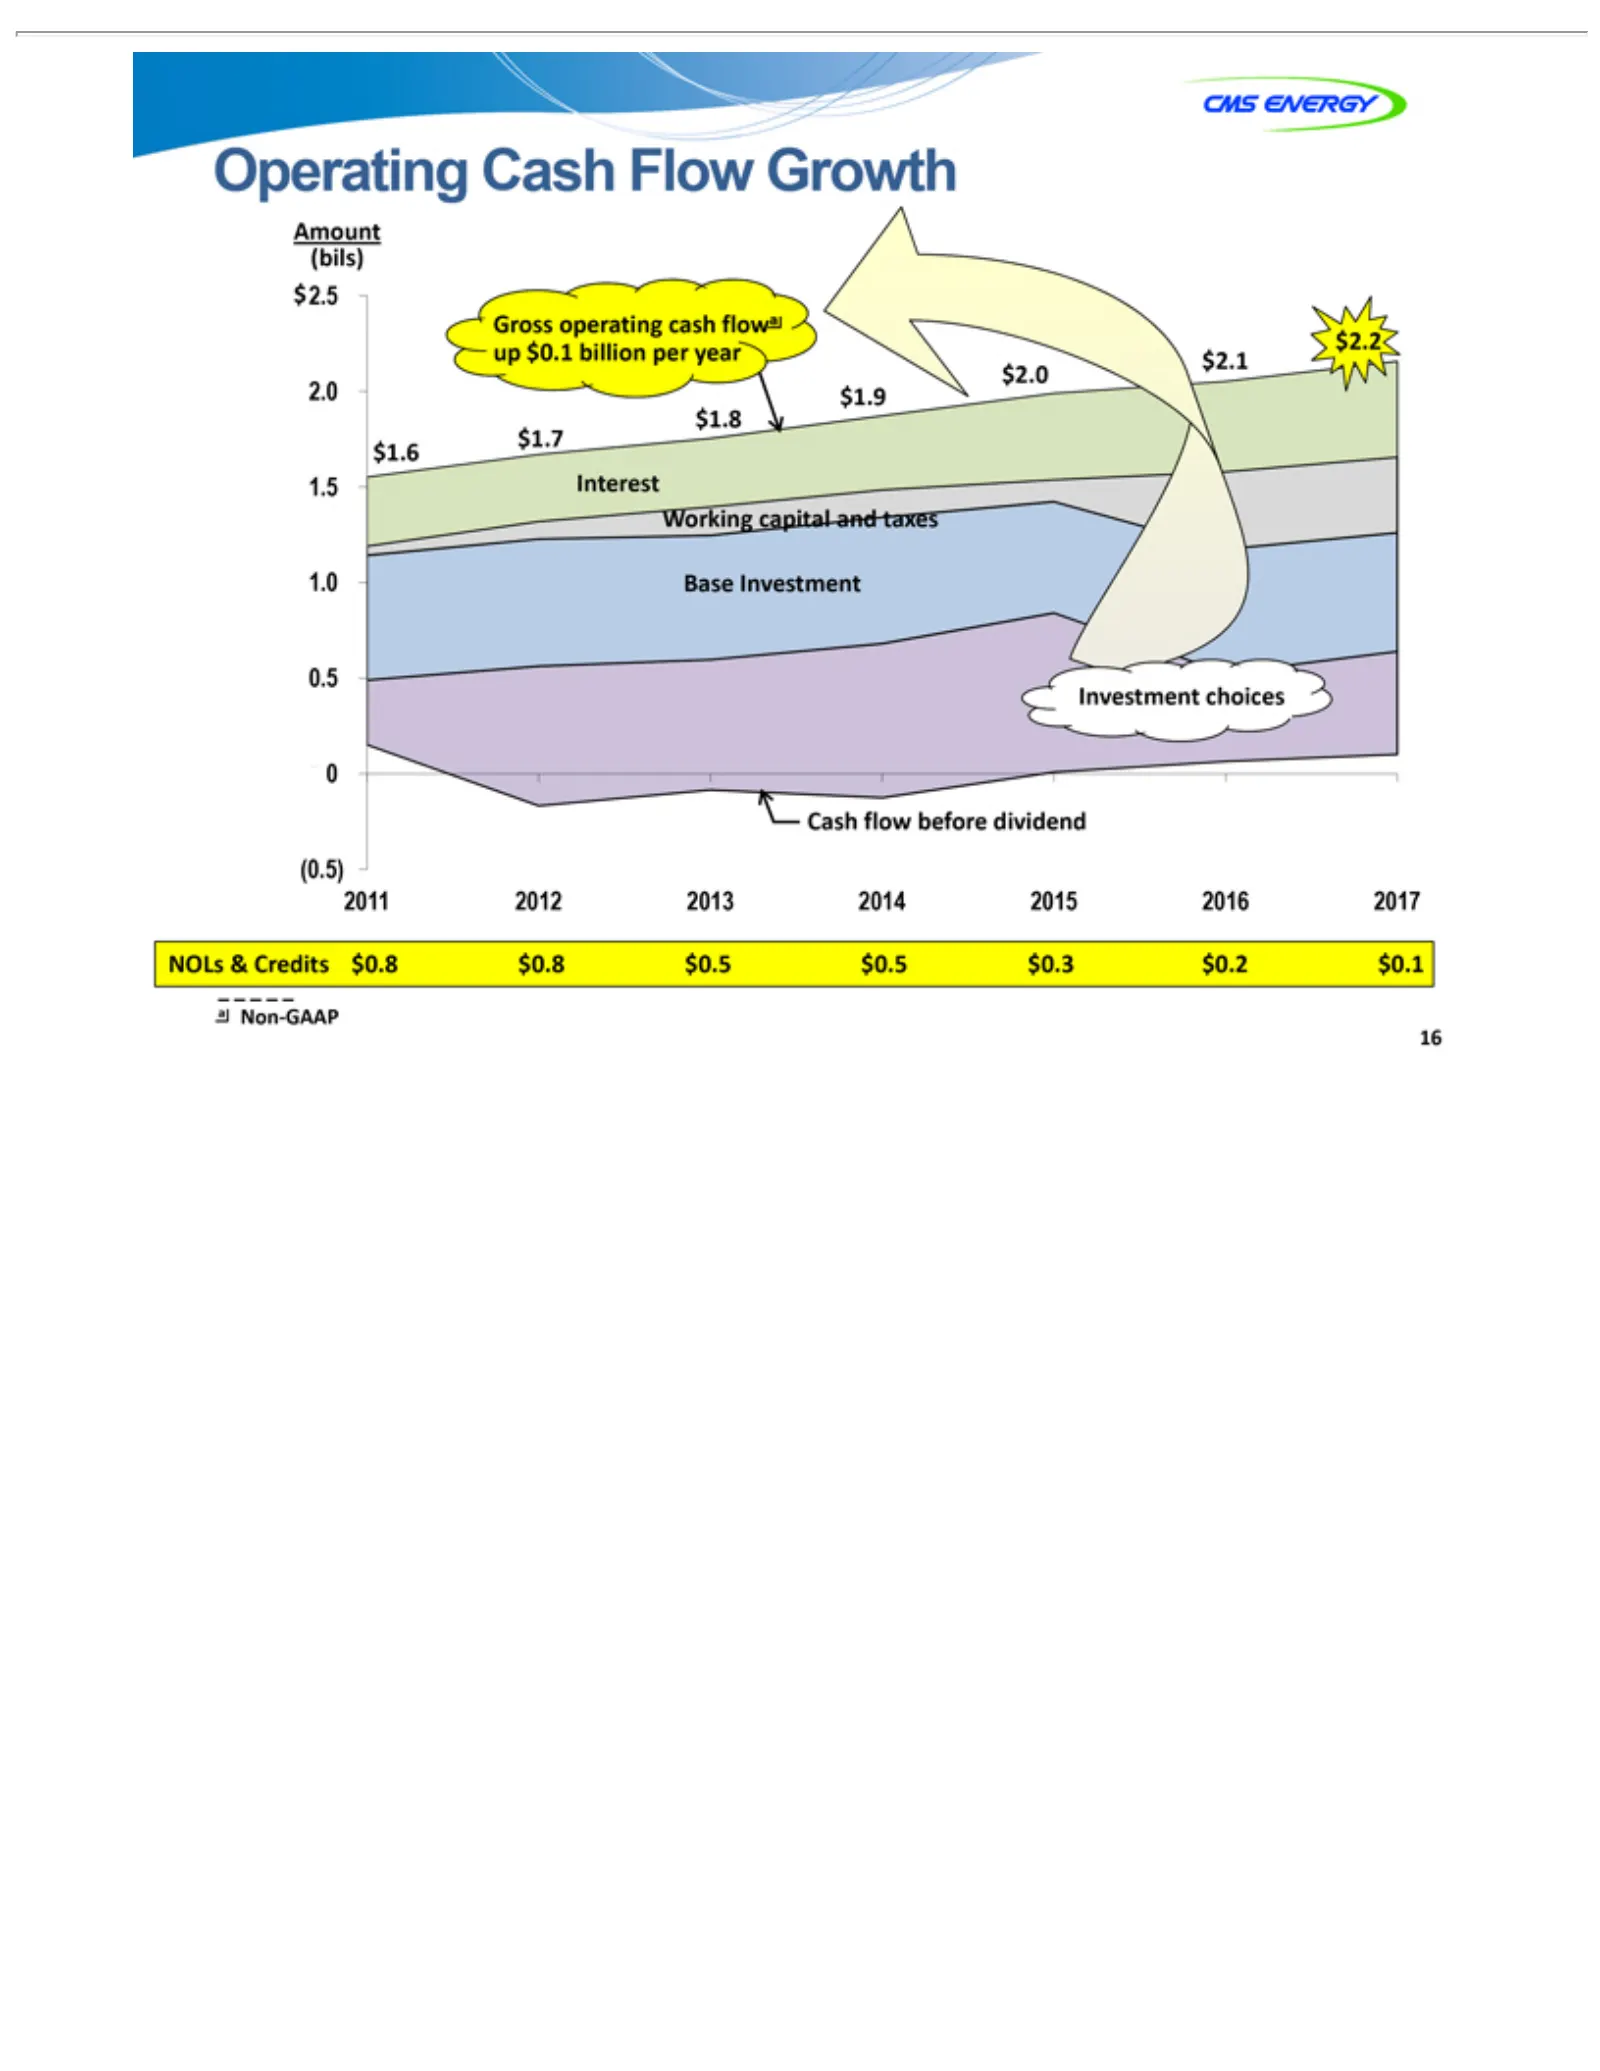
Slide 16: Operating Cash Flow and Investment
Operating Gross Investment Amount 0.5 1.0 1.5 2.0 2011 Working Interest $2.2 $2.0 $1.9 $1.6 $1.8 $1.7 Business Cash aNOLs 16 Non-GAAP 0 2012 (0.5) flow operating & (bils) Credits capital Investment Cash before 2013 choices $2.5 Flow cash and 2014 $0.8 dividend taxes flowa Growth $0.8 2015$0.5 up 201
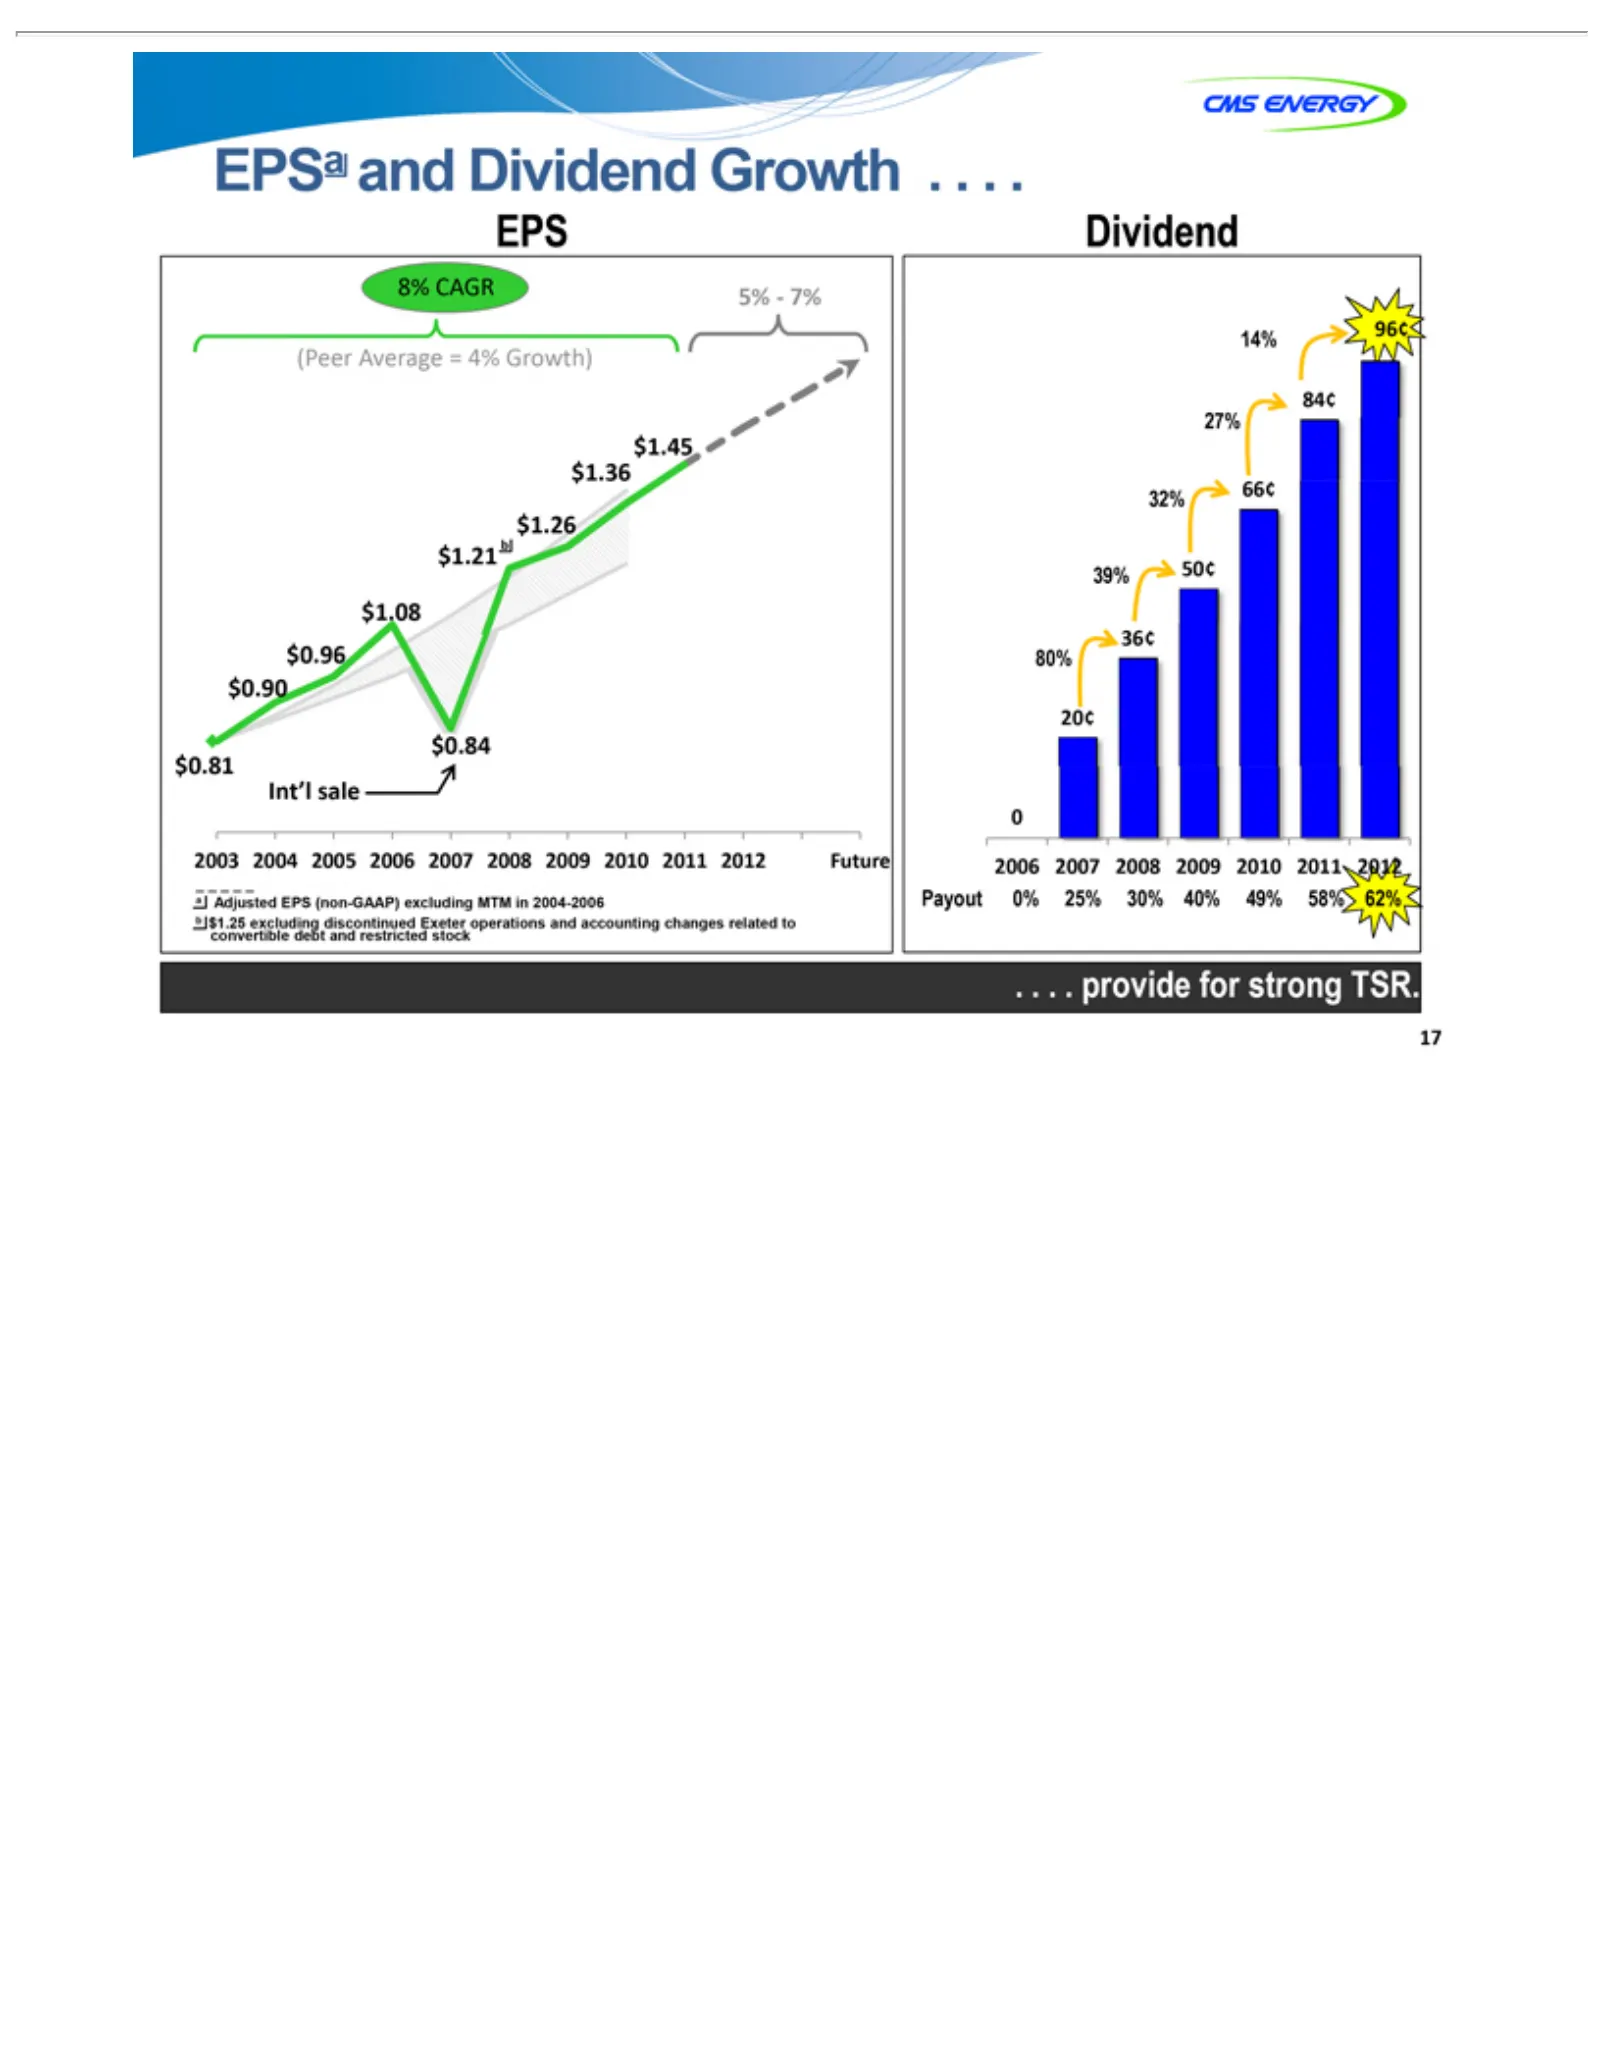
Slide 17: Adjusted EPS and Dividend Growth
EPSa EPS 8% 5% (Peer $1.45 $ b $1.26 $1.08 $0.81 2003 14% 32% 27% 84¢ 39% 80% 2 0 .aPayout 17 1.21 .006 Adjusted . .7% CAGR Dividend provide 96¢ 66¢ 50¢ 36¢ 2004 2007 Average and $1.36 $0.96 $0.84 0%20¢ Dividend EPS 2005 2008 25% $0.90 Int’I for = (non-GAAP) 4% 30% strong 2006 2009 saleGrowth Growth
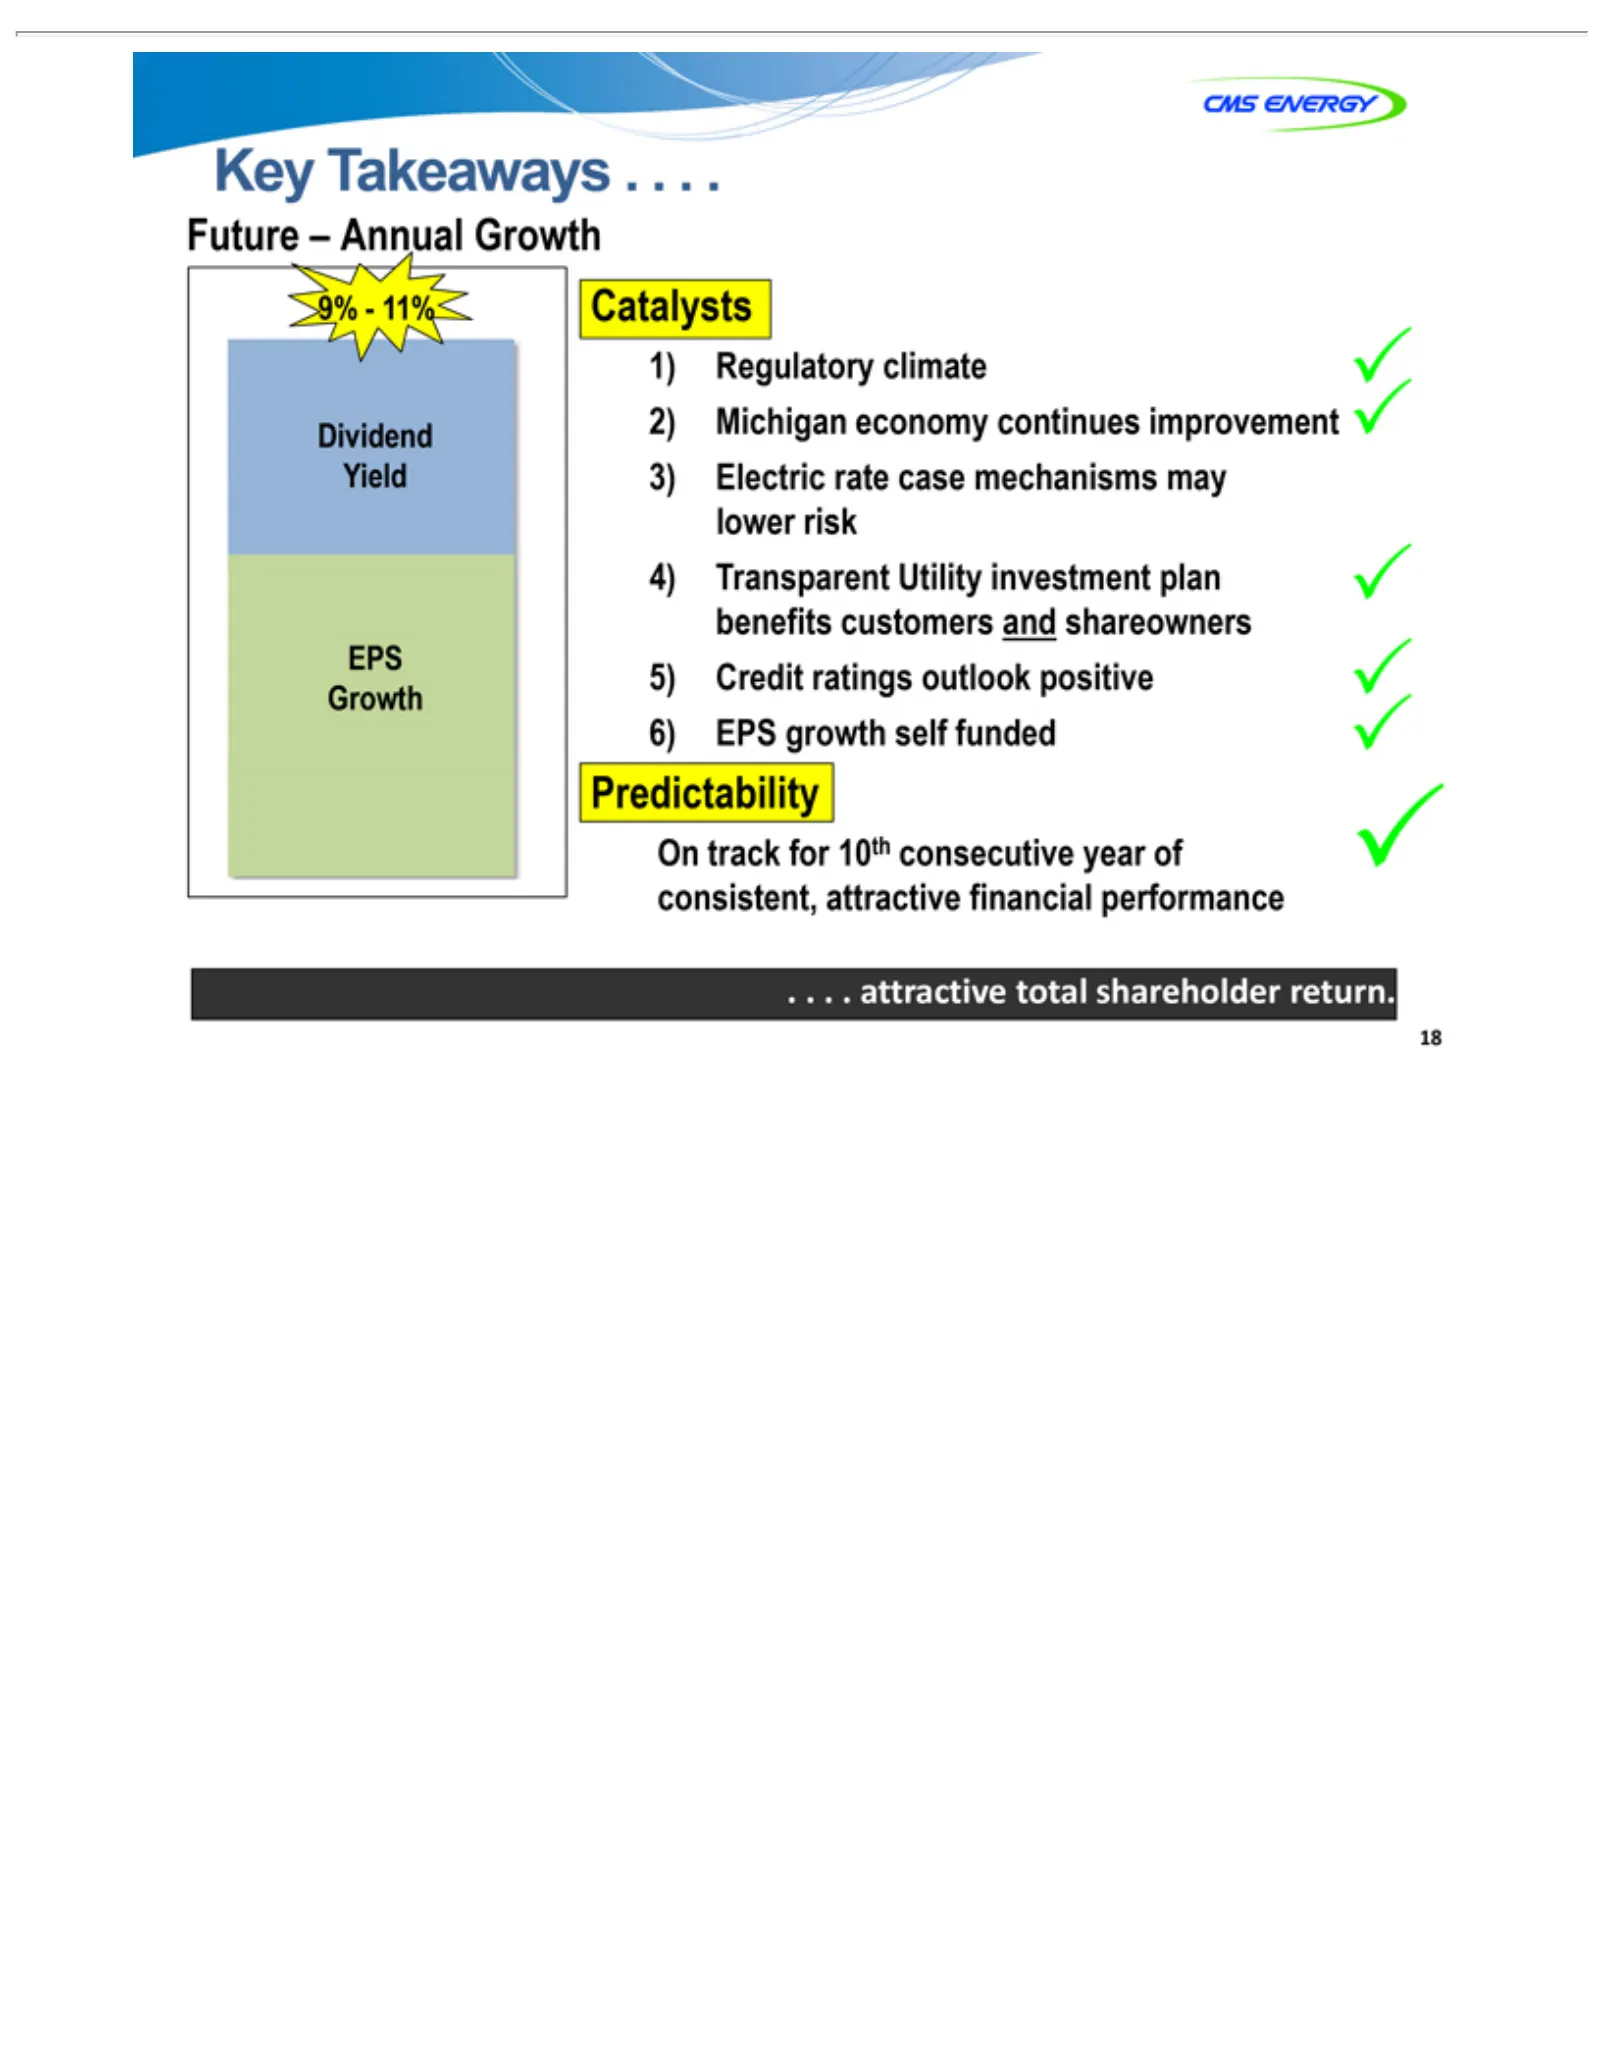
Slide 18: Key Takeaways
Key Future Dividend 9%—11% EPS 1) Catalysts 2) 3) 4) 5) 6) On .Predictability 18 . .Transparent Regulatory Michigan Electric Credit EPS track . Takeaways Growth attractive –growth Annual for ratings Yield rate 10th economy climate total Utility self case .Growth outlook .consecutive .funded sharehol

Slide 19: Appendix
APPENDIX
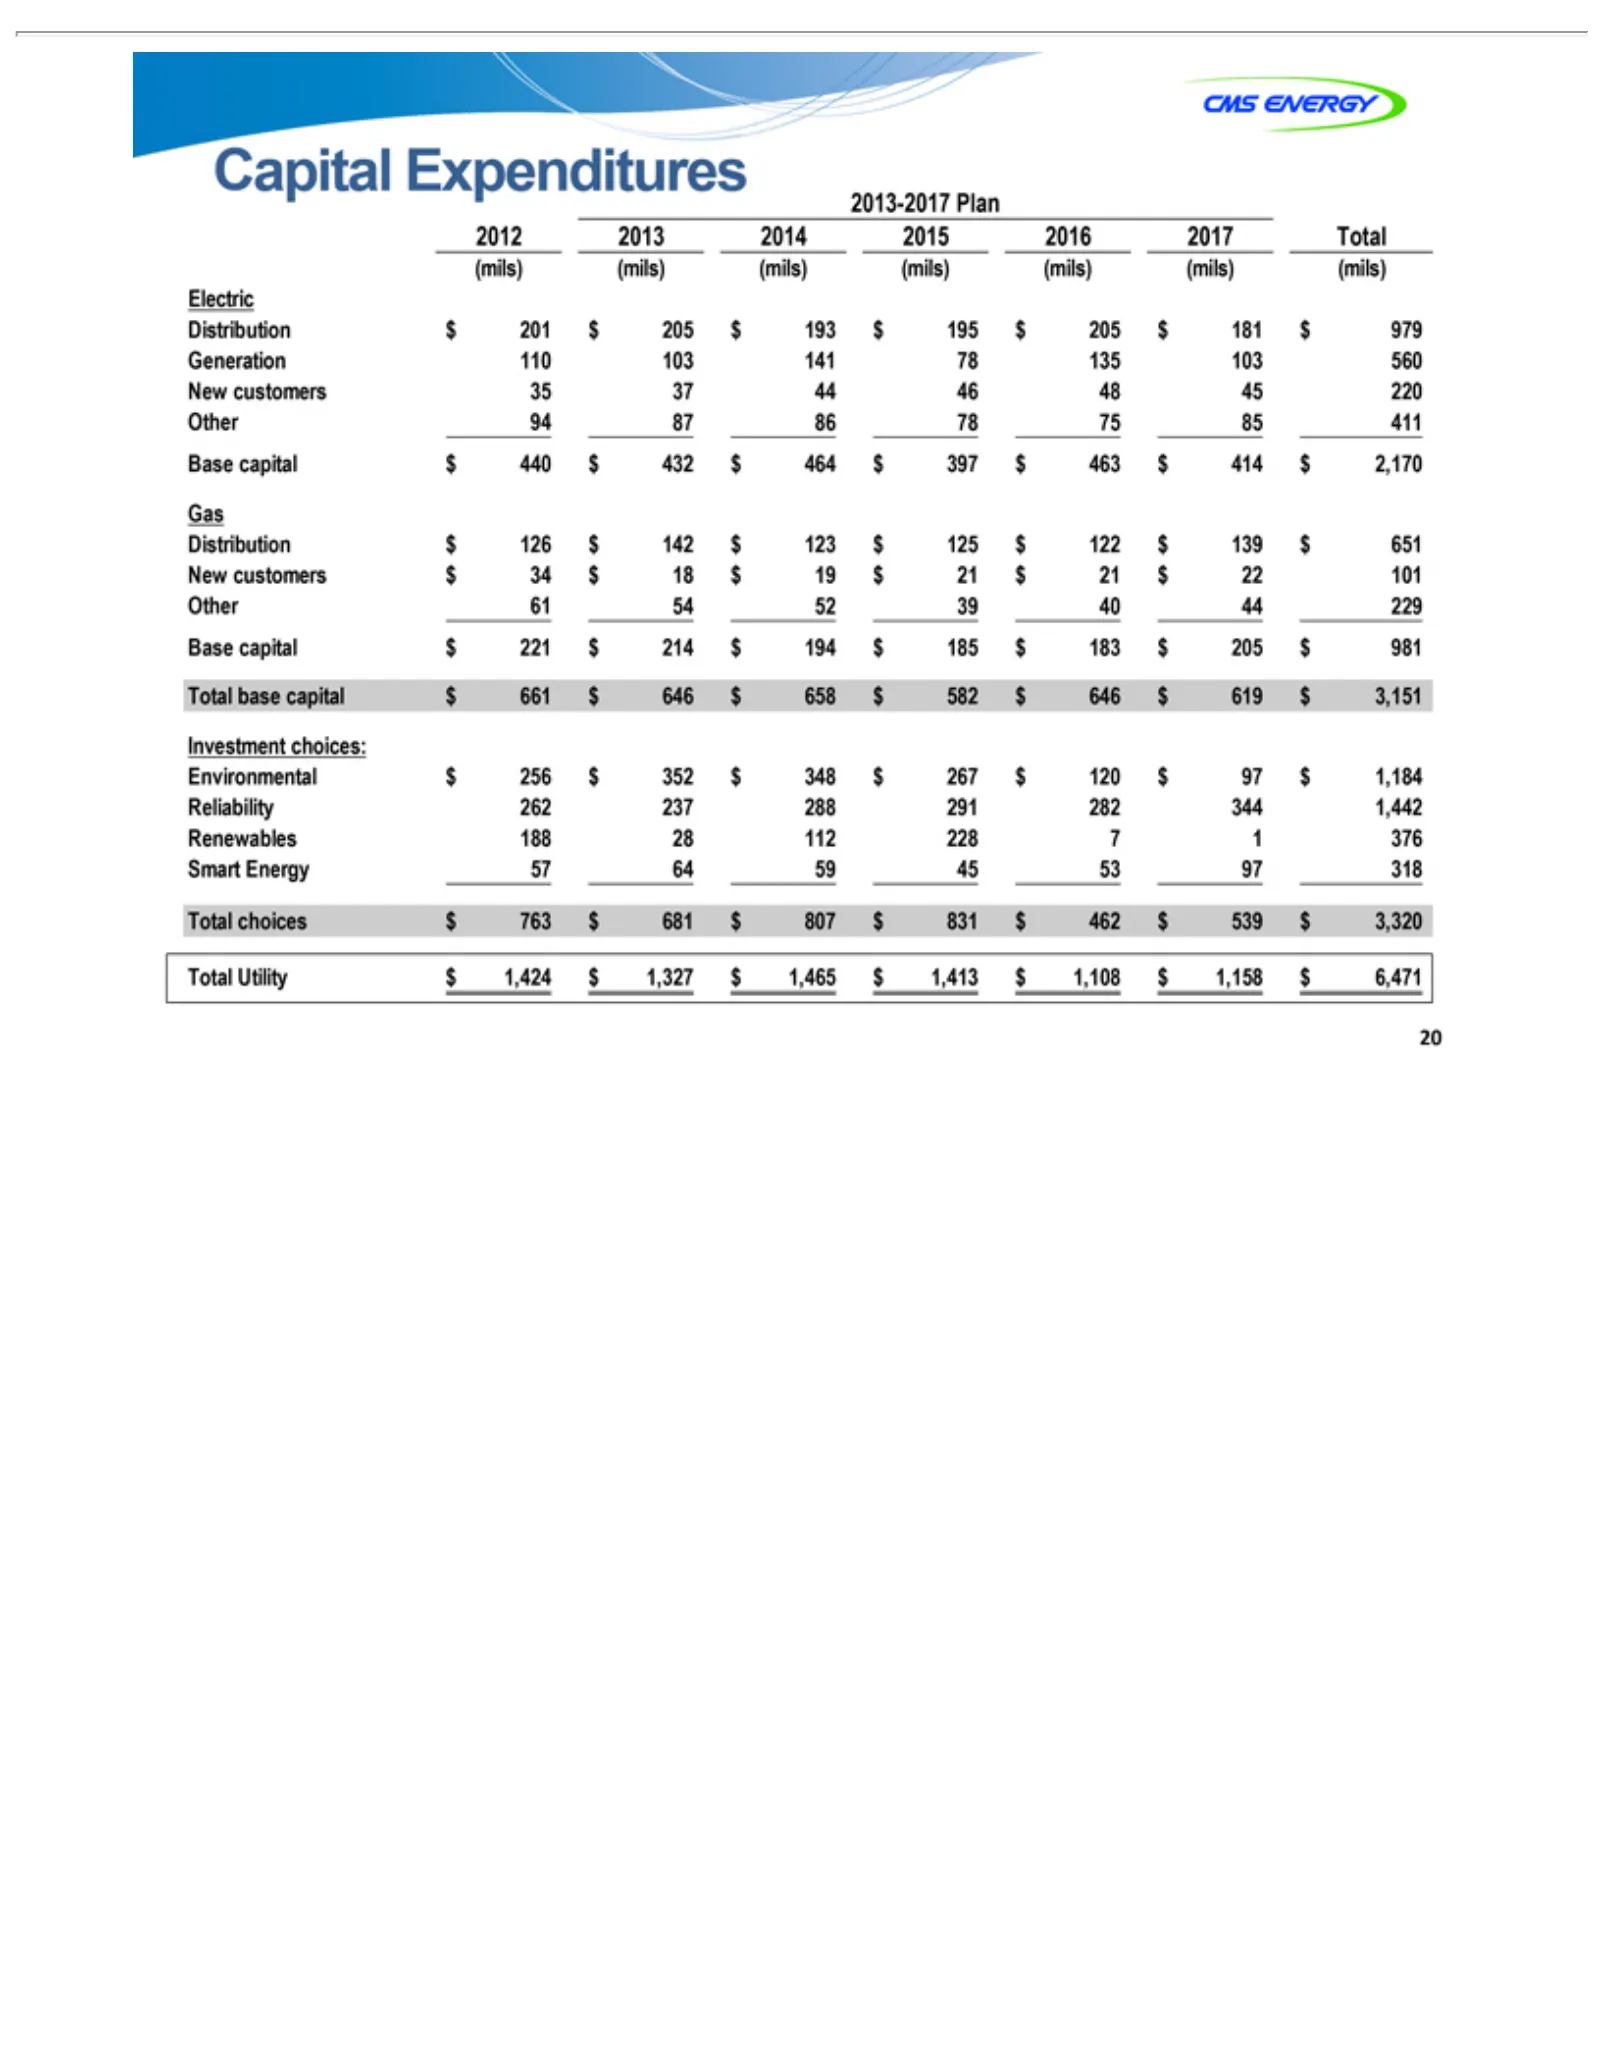
Slide 20: Capital Expenditures Plan 2013-2017
Capital 2013-2017 Generation Electric New Distribution Gas Base Other Investment Smart Renewables Reliability Environmental 94 35 110 $201 2012 61 57 188 262 2013 87 37 54 64 28 237 2014 86 141 52 59 112 288 2015 46 78 39 228 291 2016 75 48 135 40 7 282 53 44 1 440customers 126 34 221 661 256 763 1,
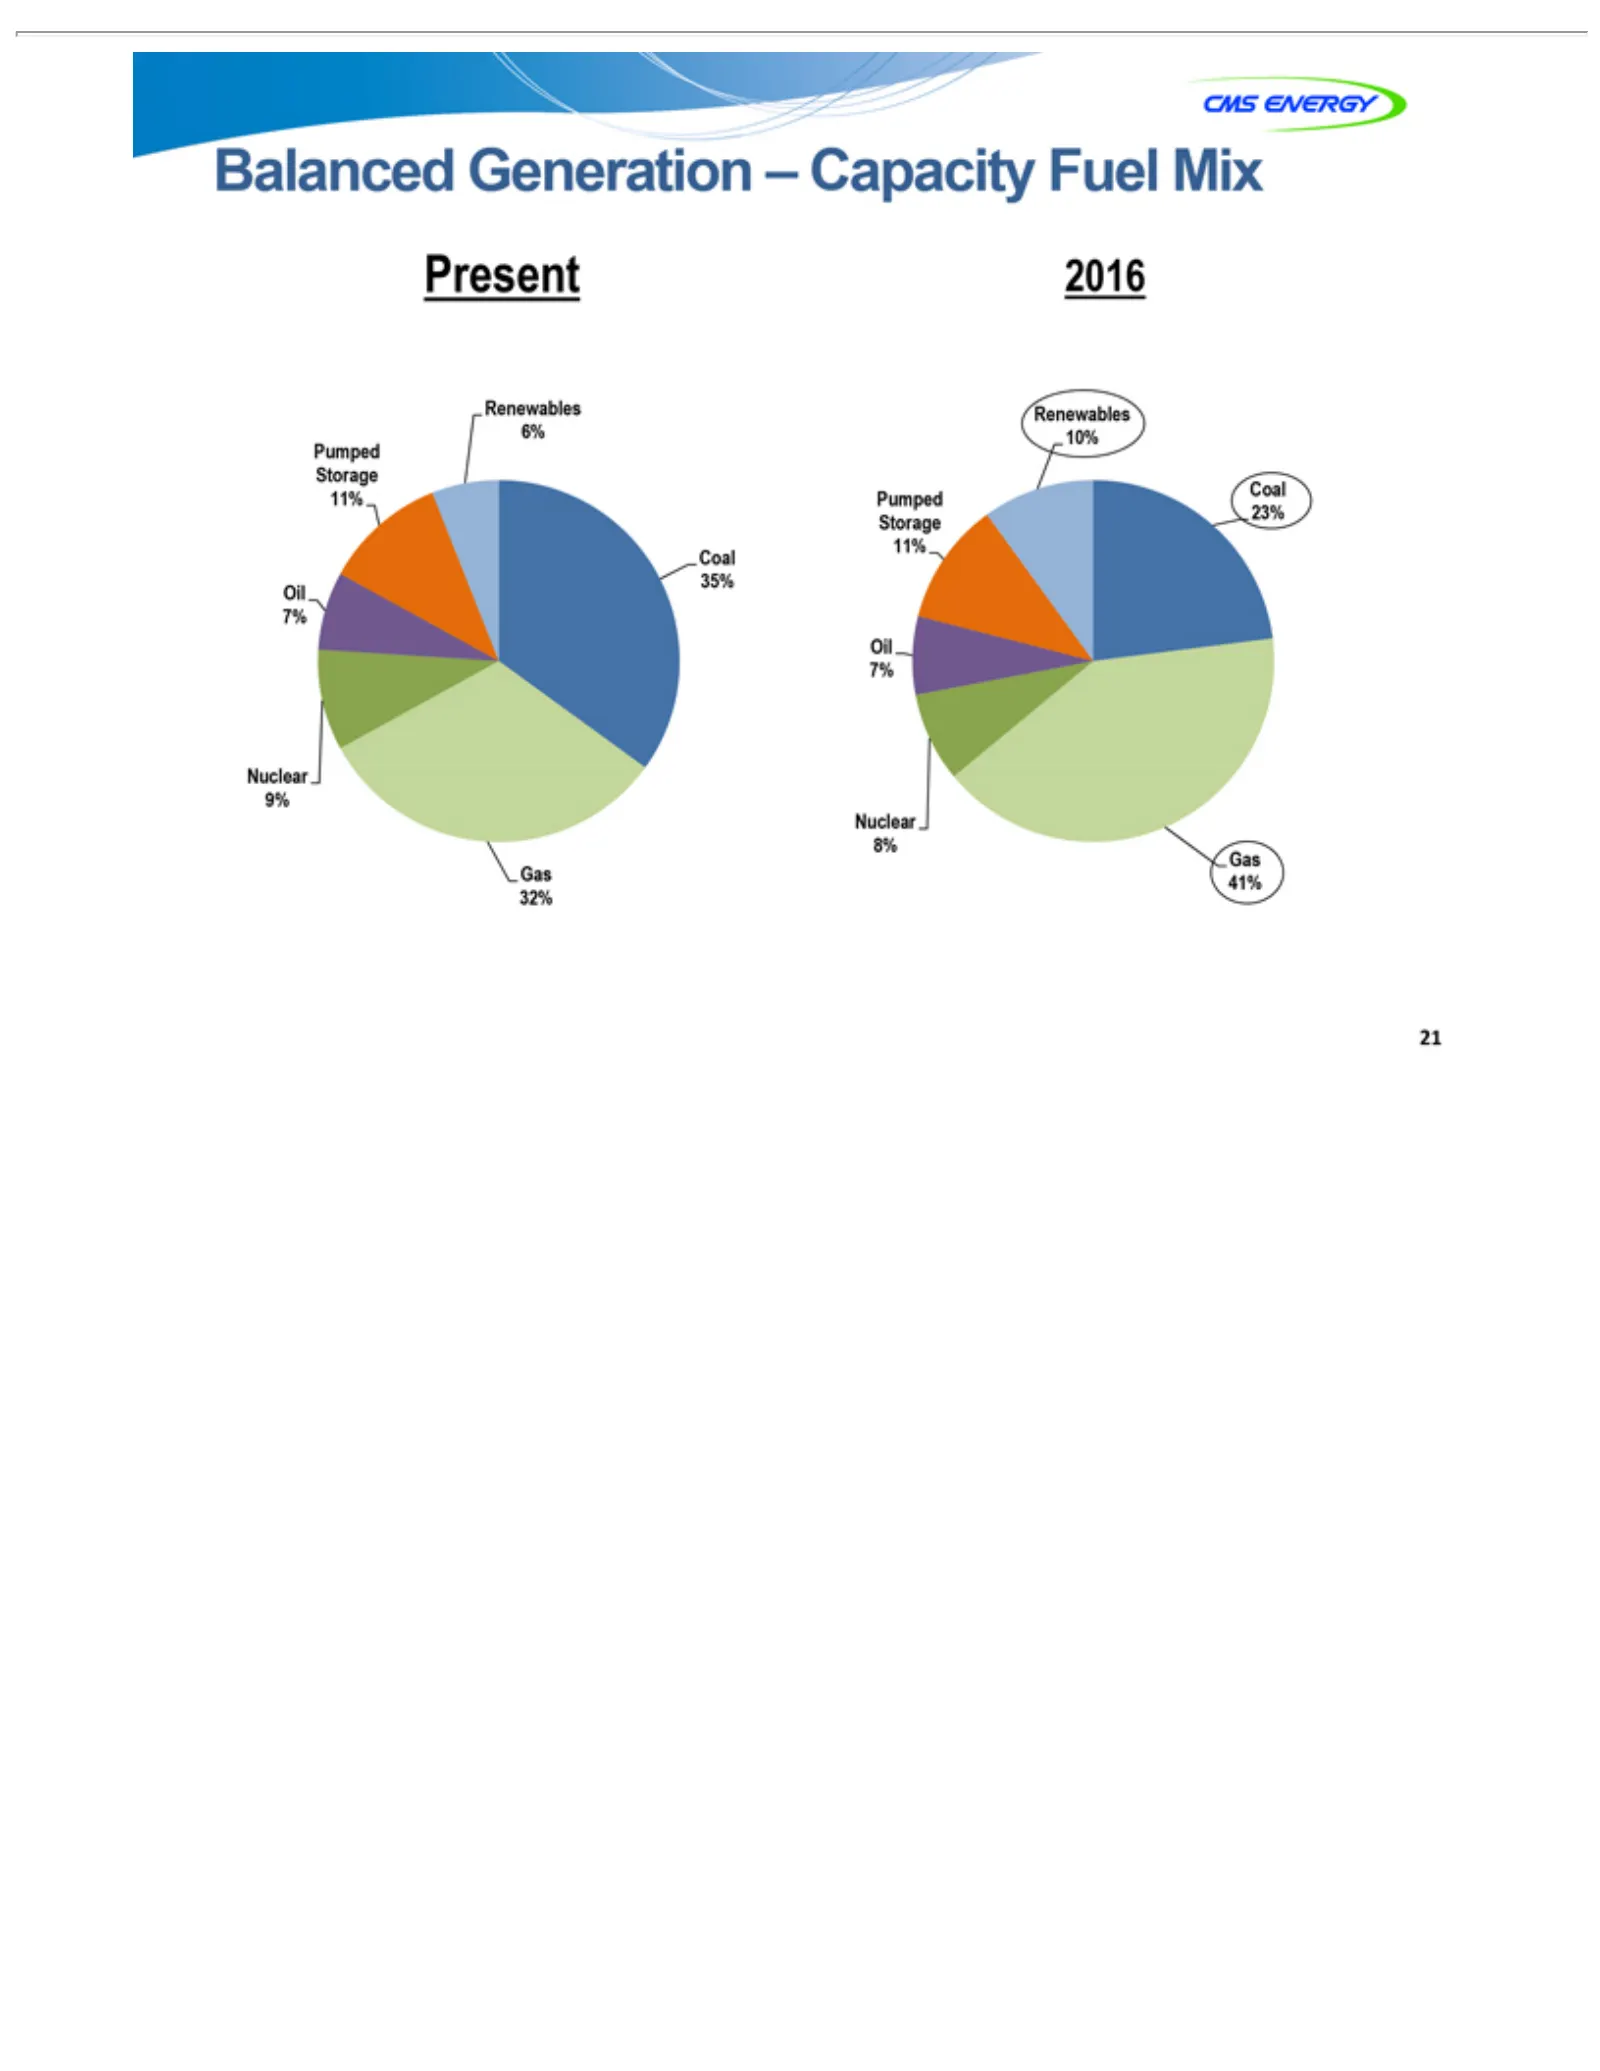
Slide 21: Present Generation Capacity and Fuel Mix
Balanced Present Storage Pumped Oil Nuclear Renewables Coal Gas 21 7% 32% 41% 35% 23% 2016 11% 9% 8% Storage Generation 6% Pumped 10% 11% – Capacity Fuel Mix
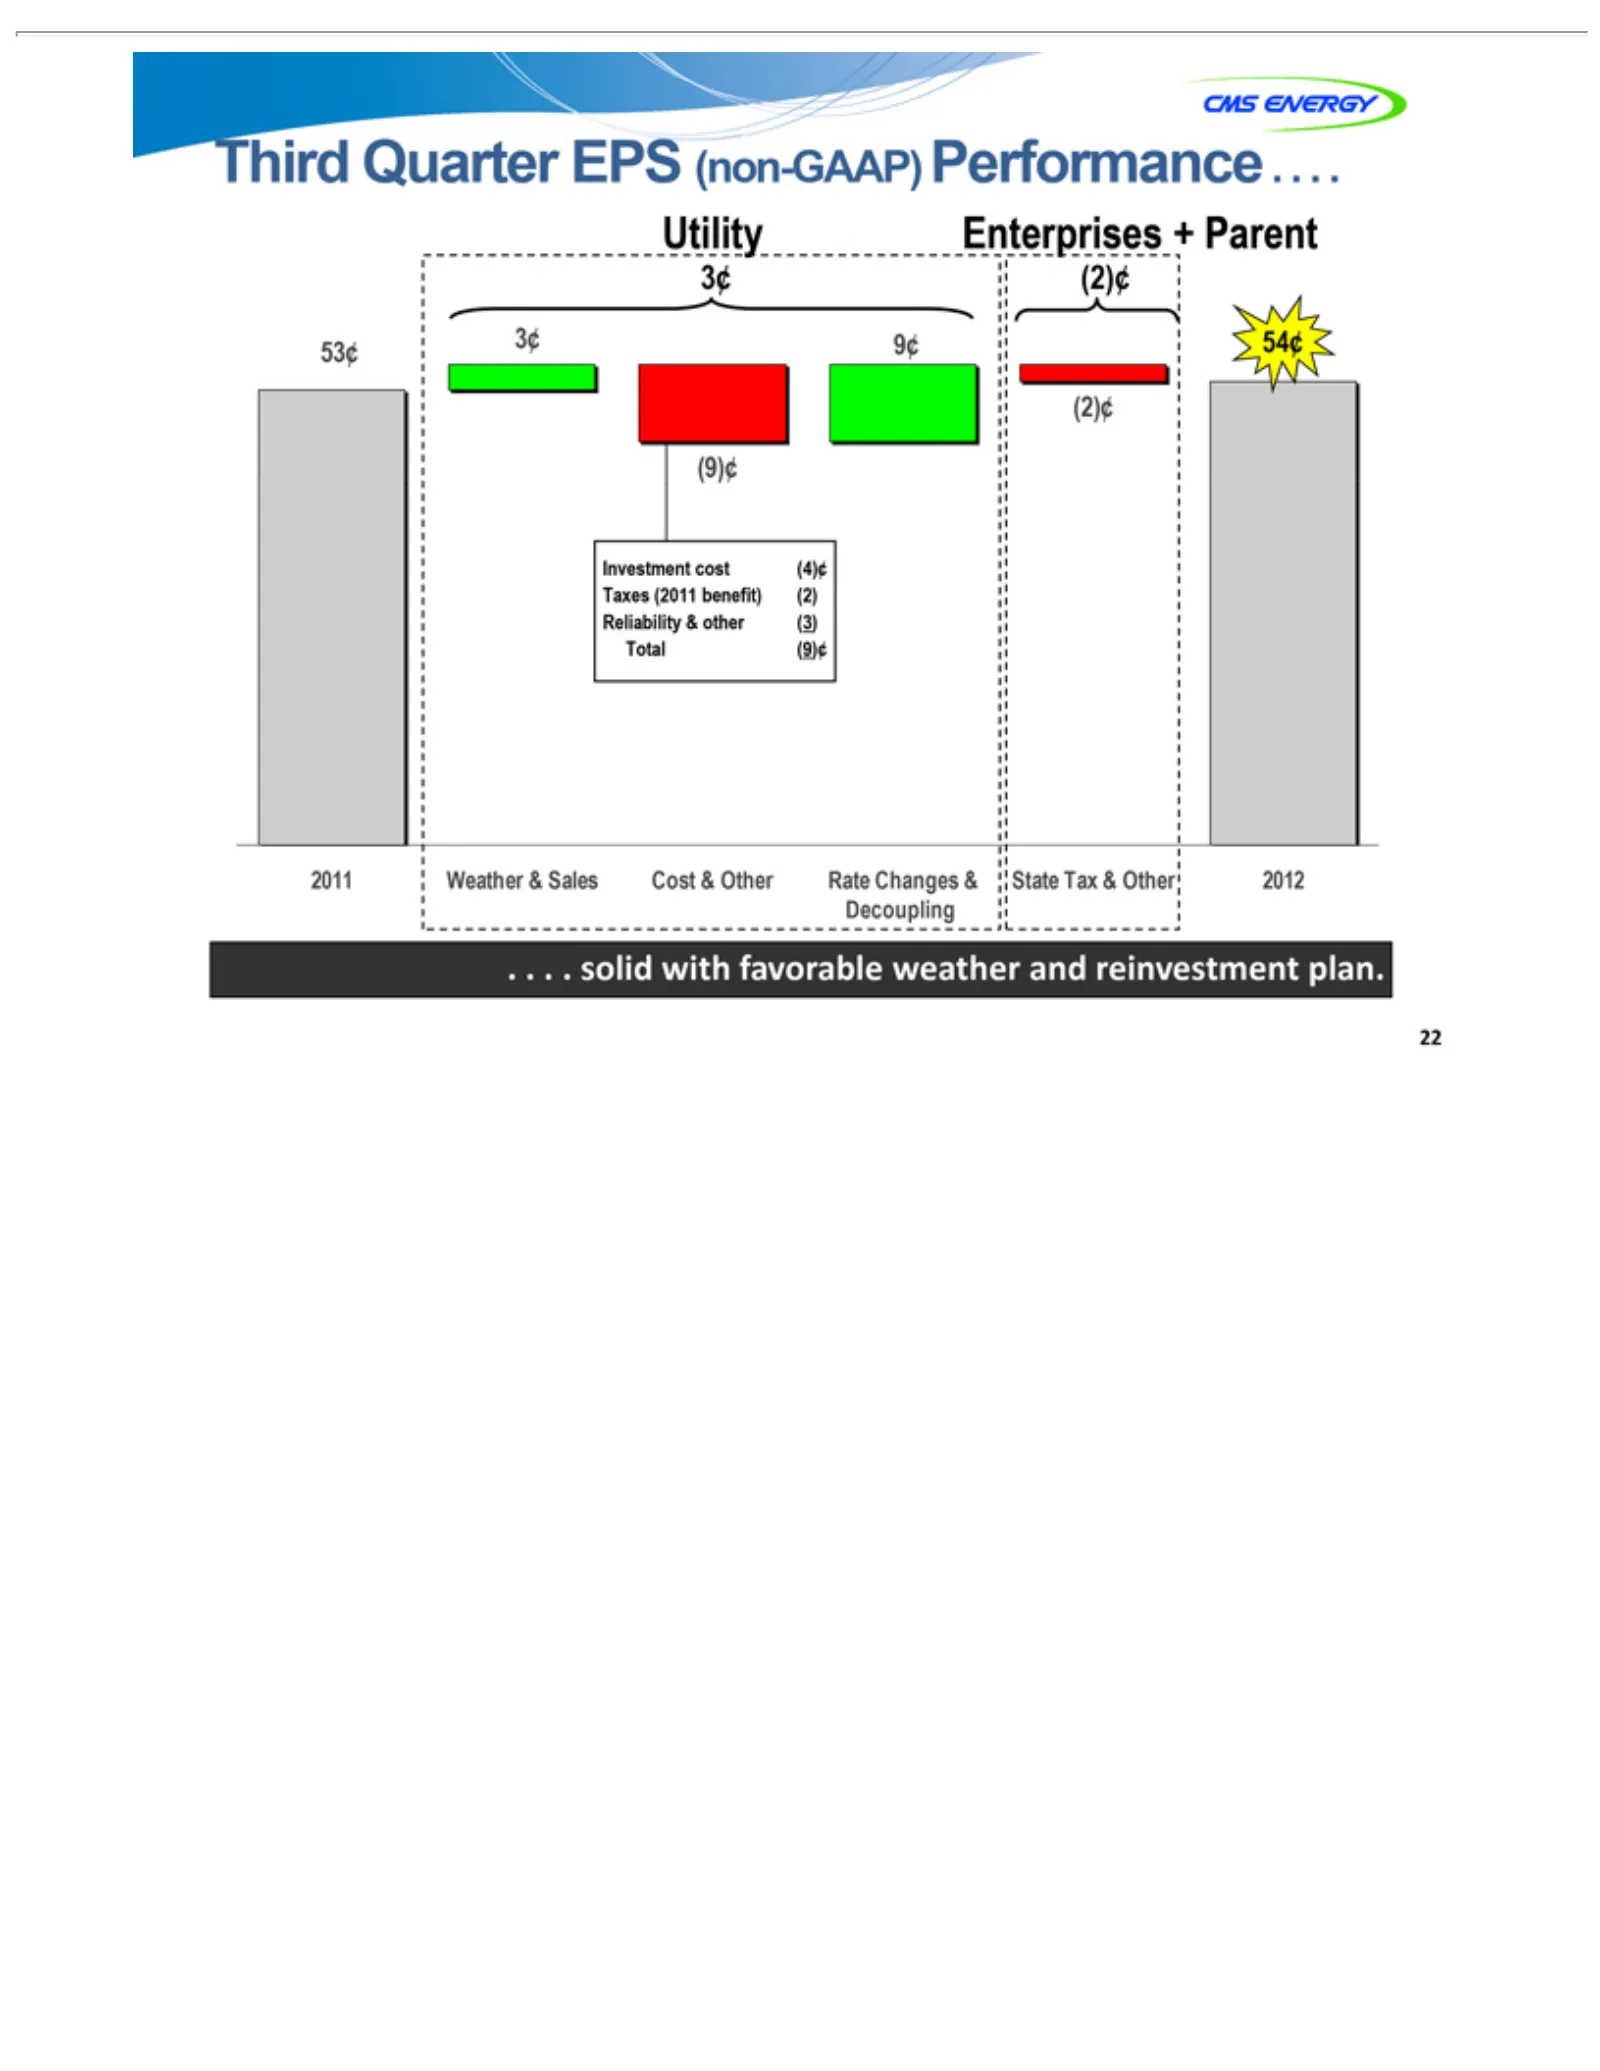
Slide 22: Third Quarter Adjusted EPS
Third Utility 3¢ (2)¢ (9)¢ Quarter Investment 54¢ .2011 22 Enterprises (2)¢ 9¢ . . . solid 53¢ Weather withEPS cost & +(non-GAAP) Parent favorable (4)¢ SalesTaxes Cost weather (2011Performance. & Other benefit) andRate ... & reinvestment Changes (2) Reliability plan. State & Tax other&(3) Other Tota
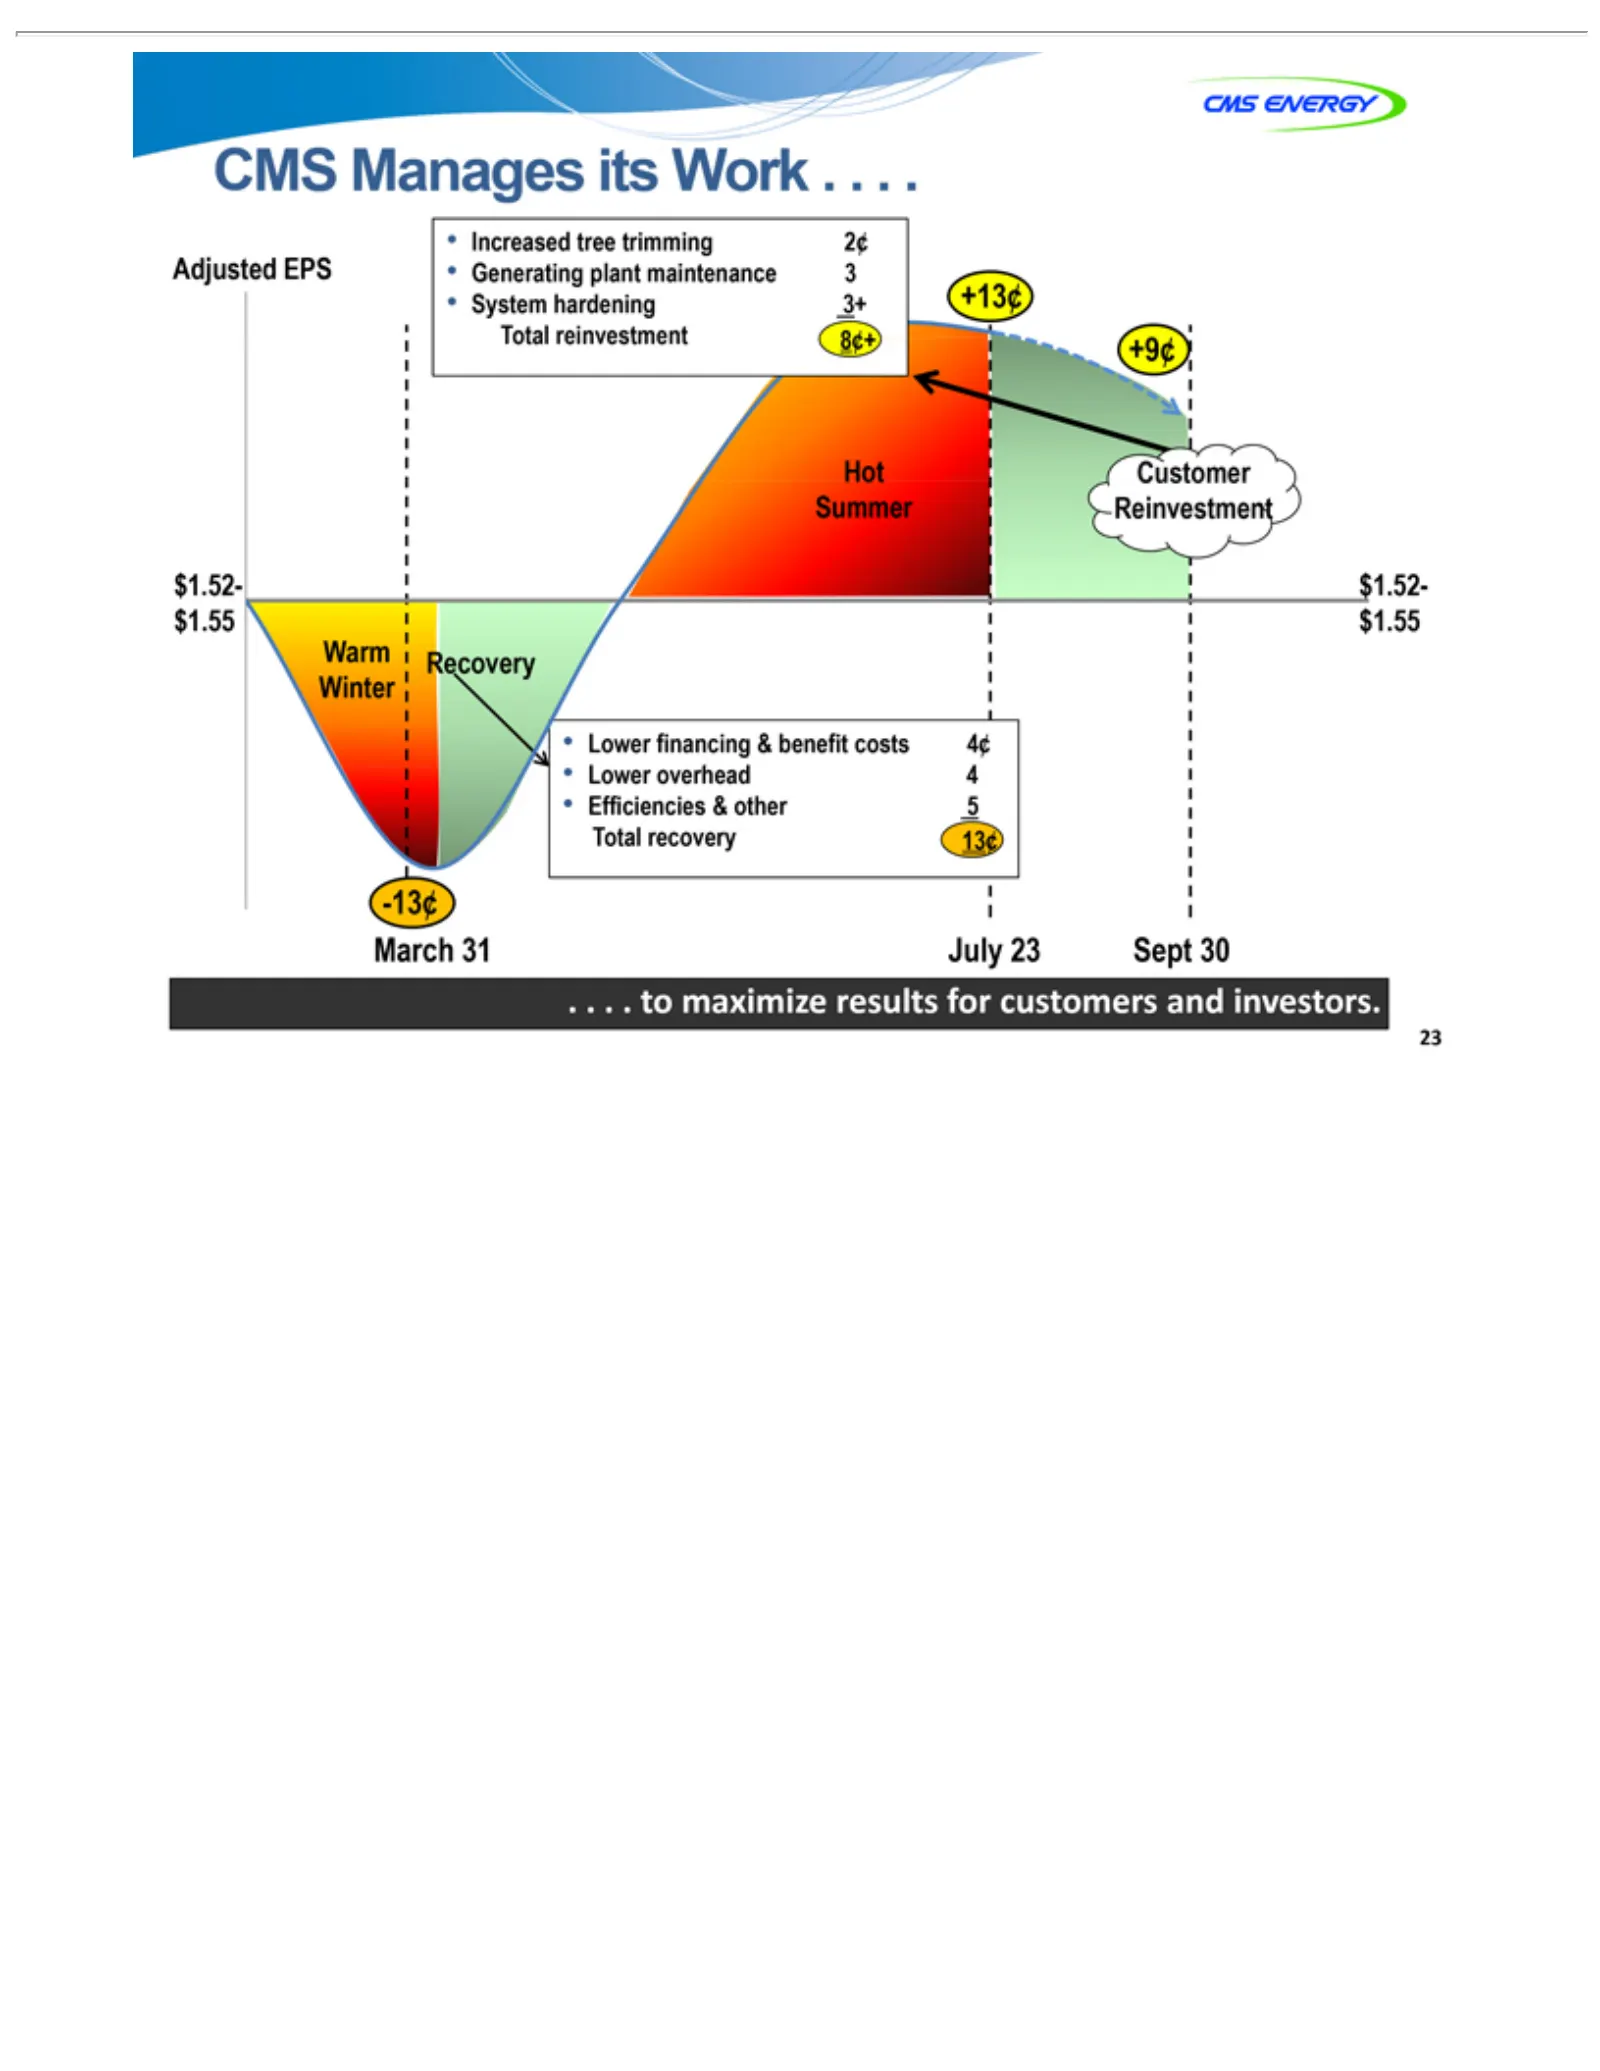
Slide 23: Adjusted EPS Guidance Increased
CMS Adjusted Increased Generating System 2¢ 3 8¢ 3+ 4¢ Hot +9¢ +13¢ Customer Warm $1.55 $1.52- Manages $1.52-$1.55 Lower Recovery hardening EPS tree plant trimming its& maintenance Work Total reinvestment . . .costs . 13. .¢.Summer 4 5 March -13¢ July .Sept 23 30Winter 23 to financing 31 Reinvestmen
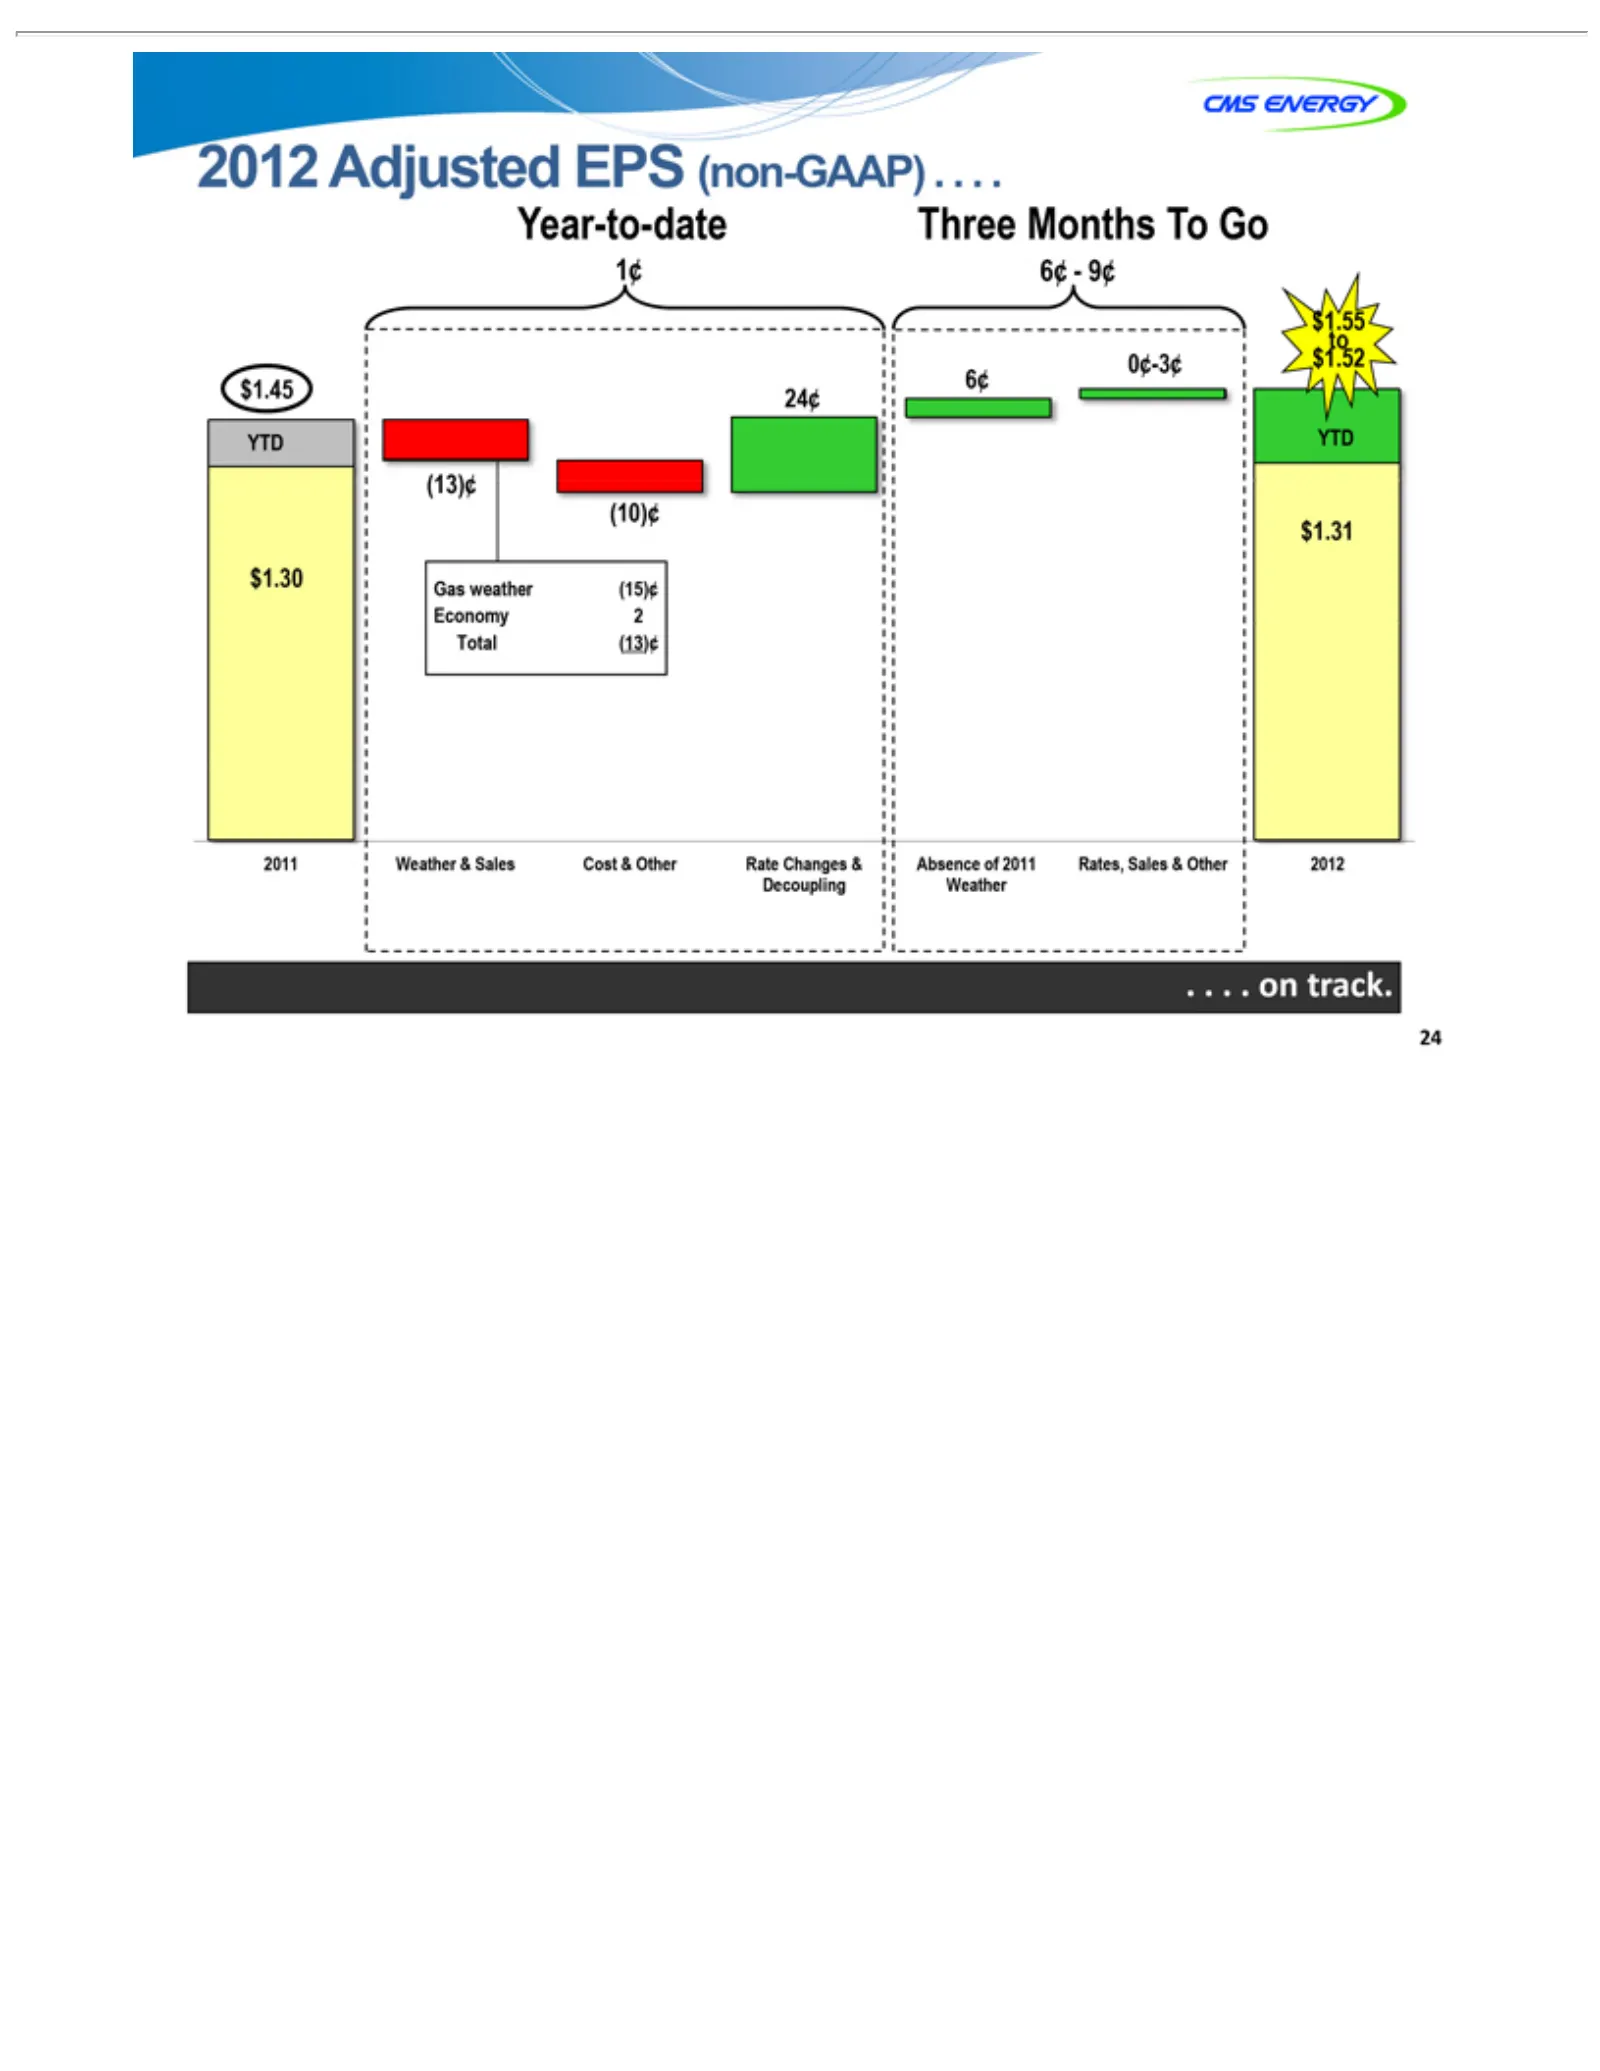
Slide 24: Three Year-to-date Adjusted EPS
2012 Three Year-to-date 1¢ (13)¢ 2011 $1.30 YTD $1.45 (10)¢ Gas Weather Total Economy Adjusted Months 6¢—9¢ To EPSGo(non-GAAP) . . . . . . . weather (15)¢ 2 (13)¢ Cost Rate 24¢ 6¢ Decoupling Absence Rates, 0¢-3¢ .Weather 2012 $1.31 YTD $1.52 To $1.55 24 on & of Sales Changes &Sales Other&&Other trac
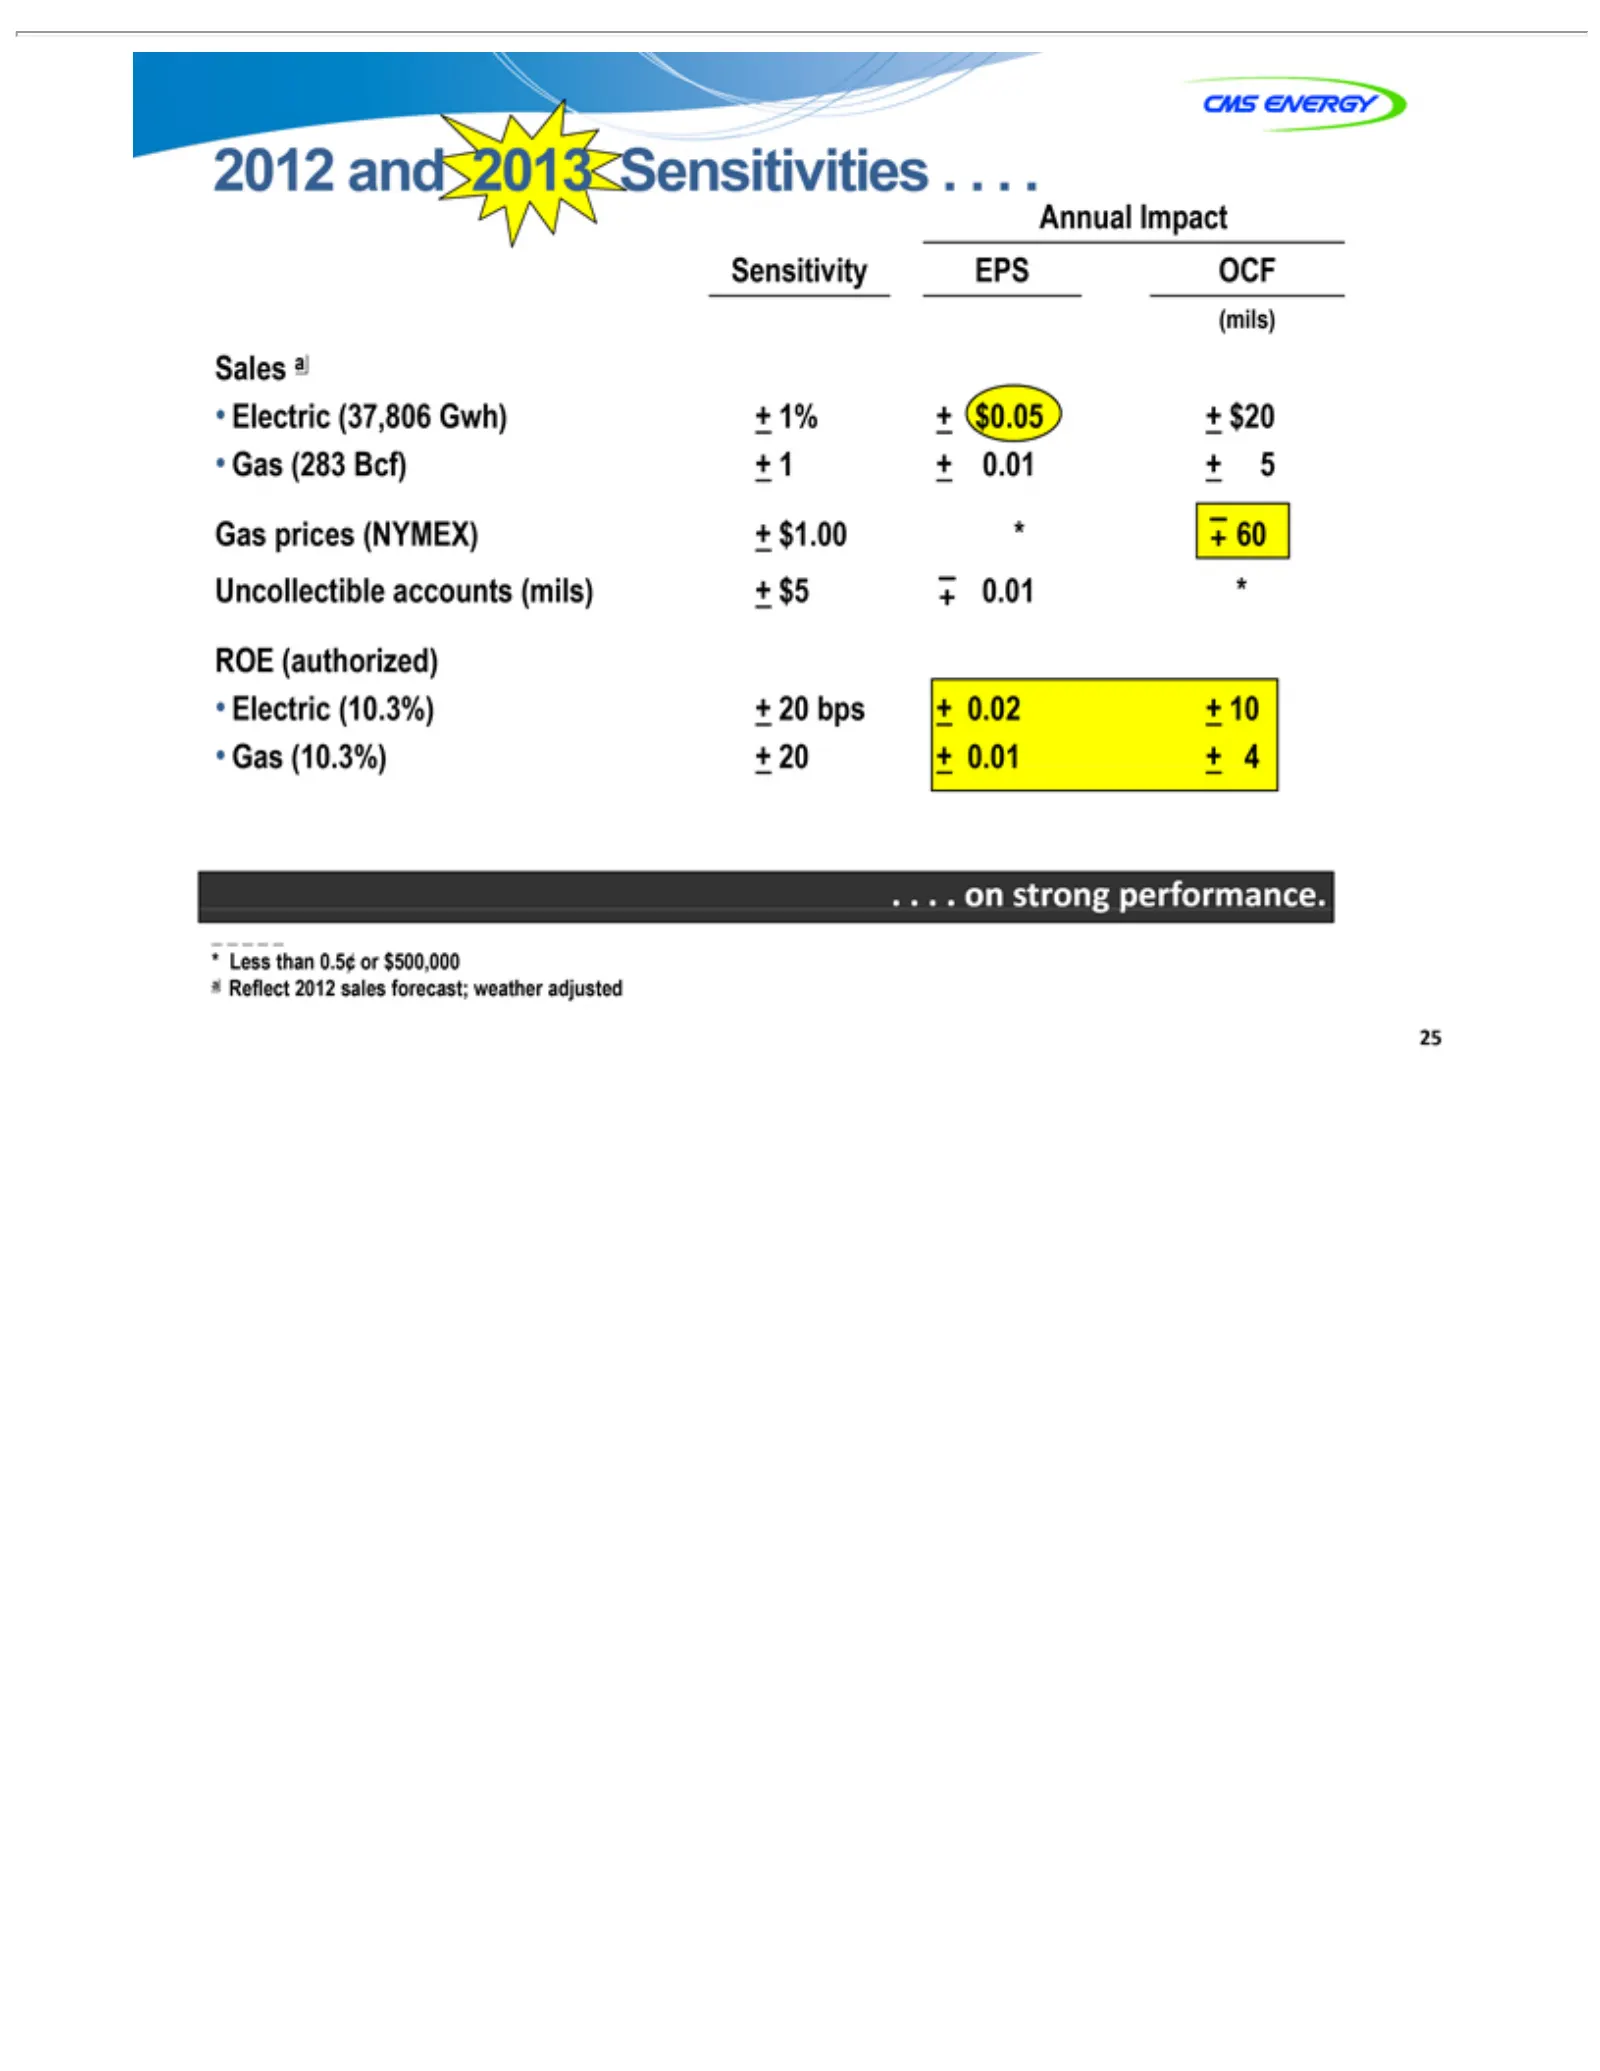
Slide 25: 2012 Sensitivities
2012 Annual Sales Uncollectible ROE Electric Gas Sensitivity EPS –+ (mils) OCF .+ * 25 $11% . 41020 $0.05 .51.00 0.02 0.01 5$20 60 (283 prices (10.3%) bps . 0.01and (authorized) a Impact on (37,806 (10.3%) Bcf) 2013 Less(NYMEX) strong accounts Sensitivities Gwh) than 0.5 or(mils) performance. . . .

Slide 26: GAAP Reconciliation
GAAP RECONCILIATION
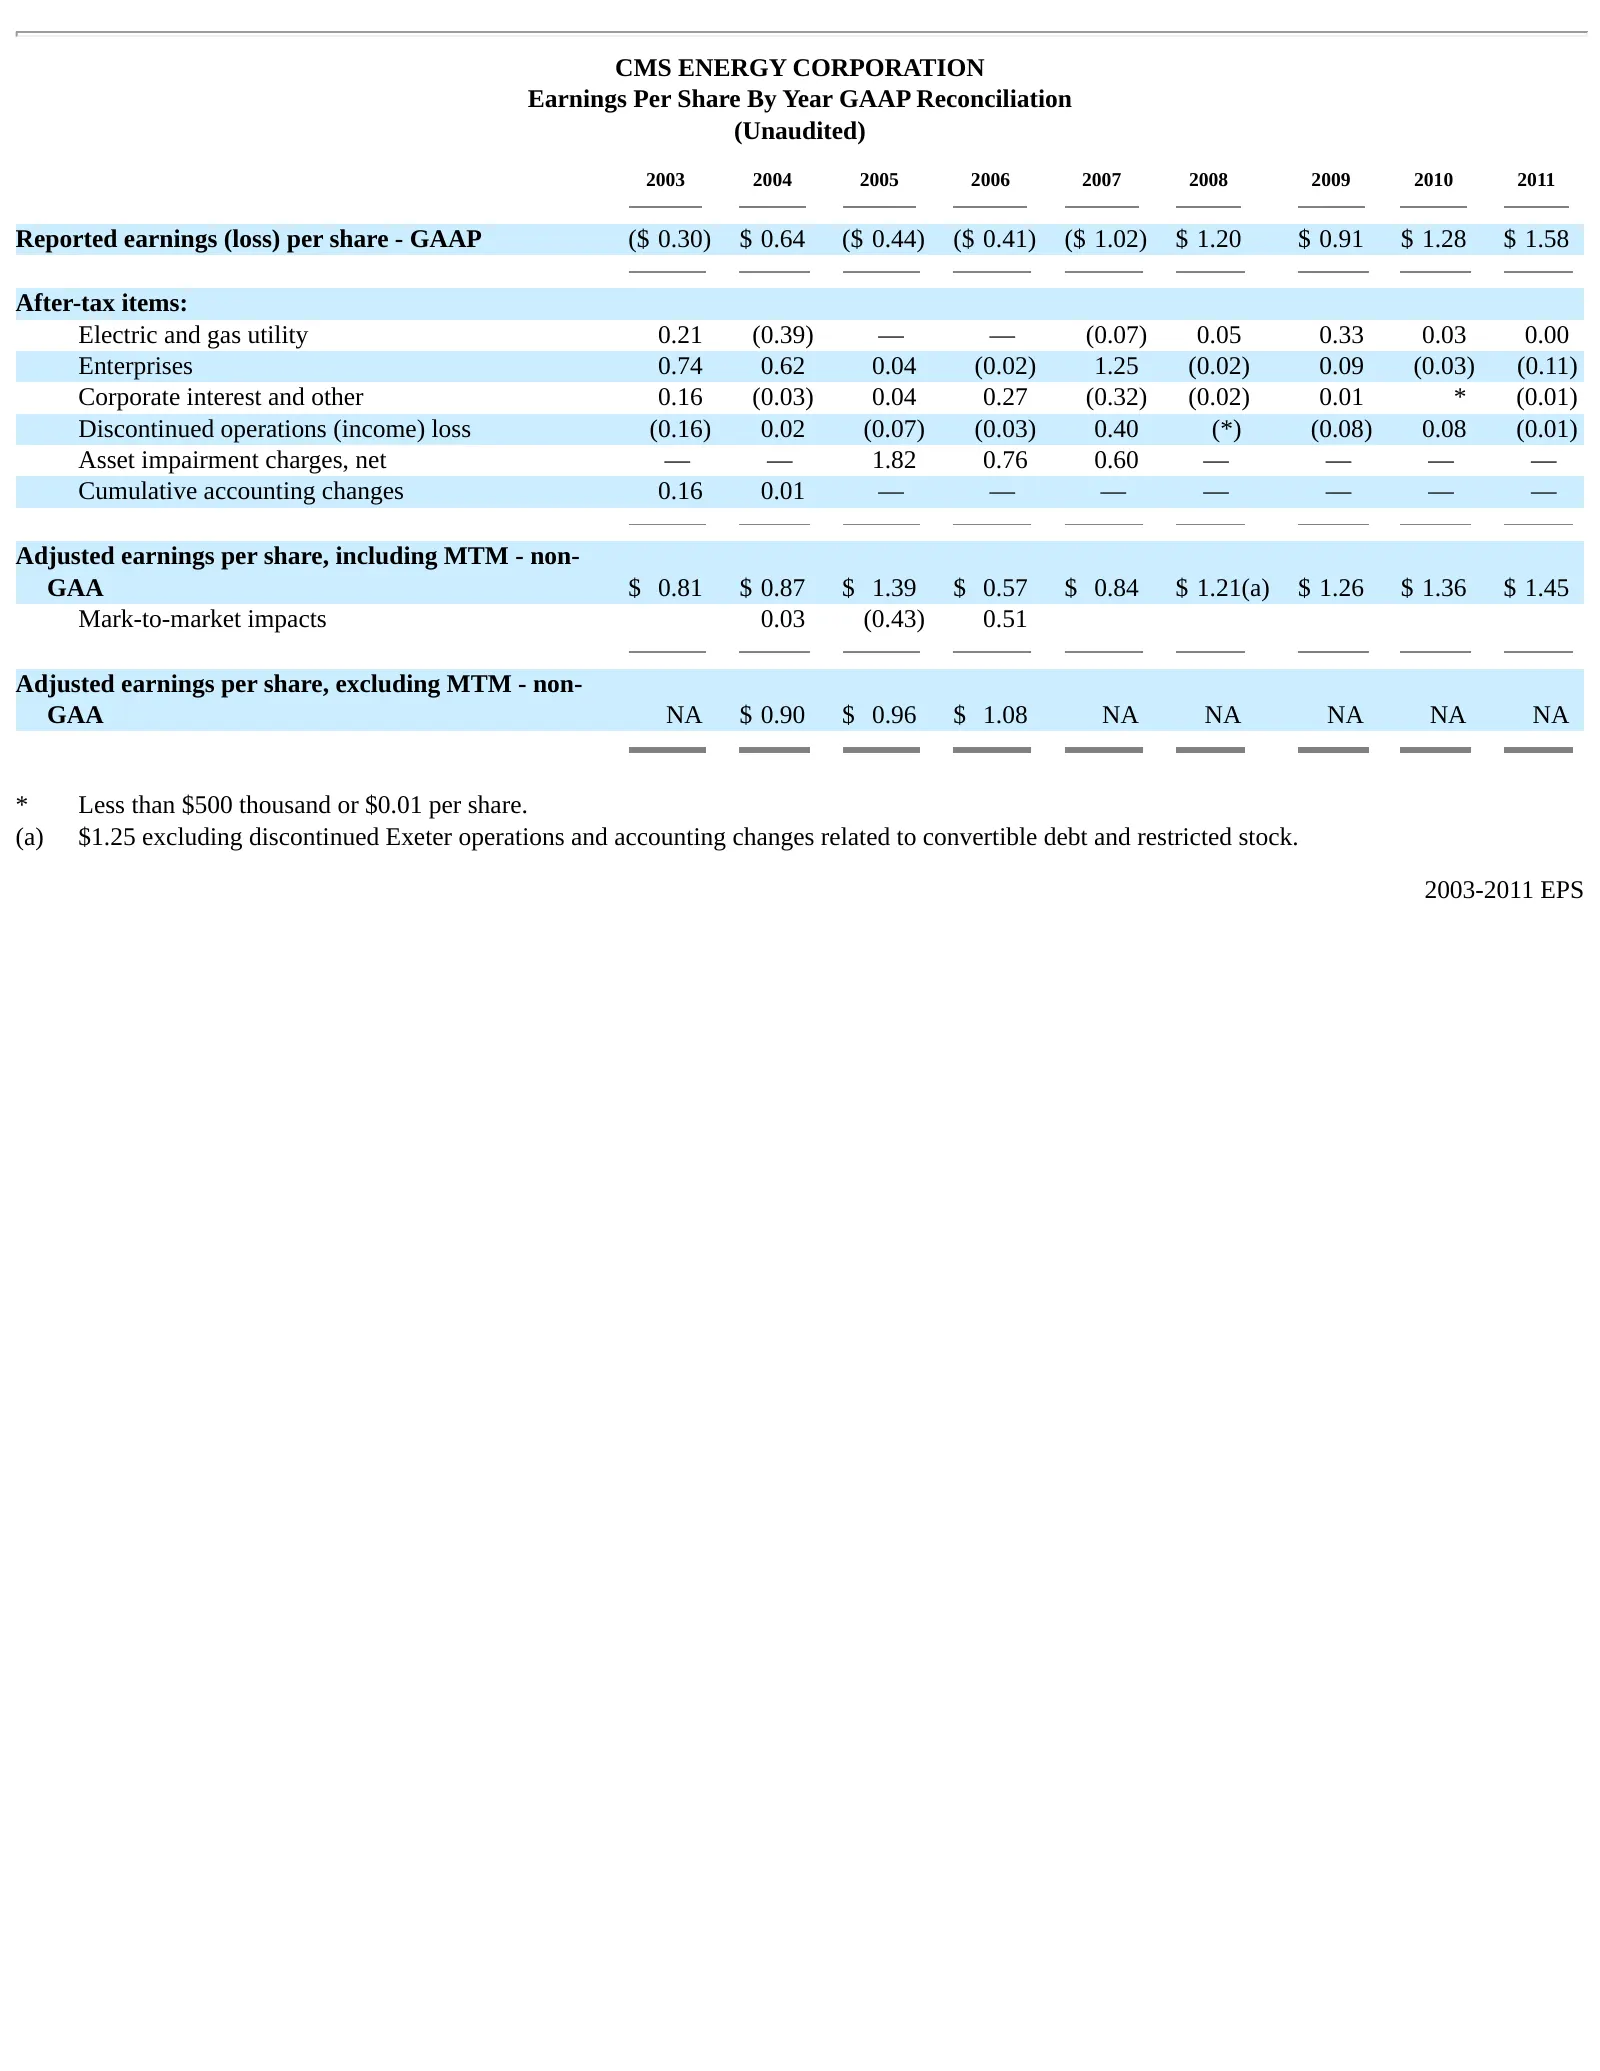
Slide 27: Earnings Per Share By Year GAAP Reconciliation
CMS ENERGY CORPORATION Earnings Per Share By Year GAAP Reconciliation (Unaudited) 2003 2004 2005 2006 2007 2008 2009 2010 2011 Reported earnings (loss) per share - GAAP ($ 0.30) $ 0.64 ($ 0.44) ($ 0.41) ($ 1.02) $ 1.20 $ 0.91 $ 1.28 $ 1.58 After-tax items: Electric and gas utility 0.21 (0.39) — — (0
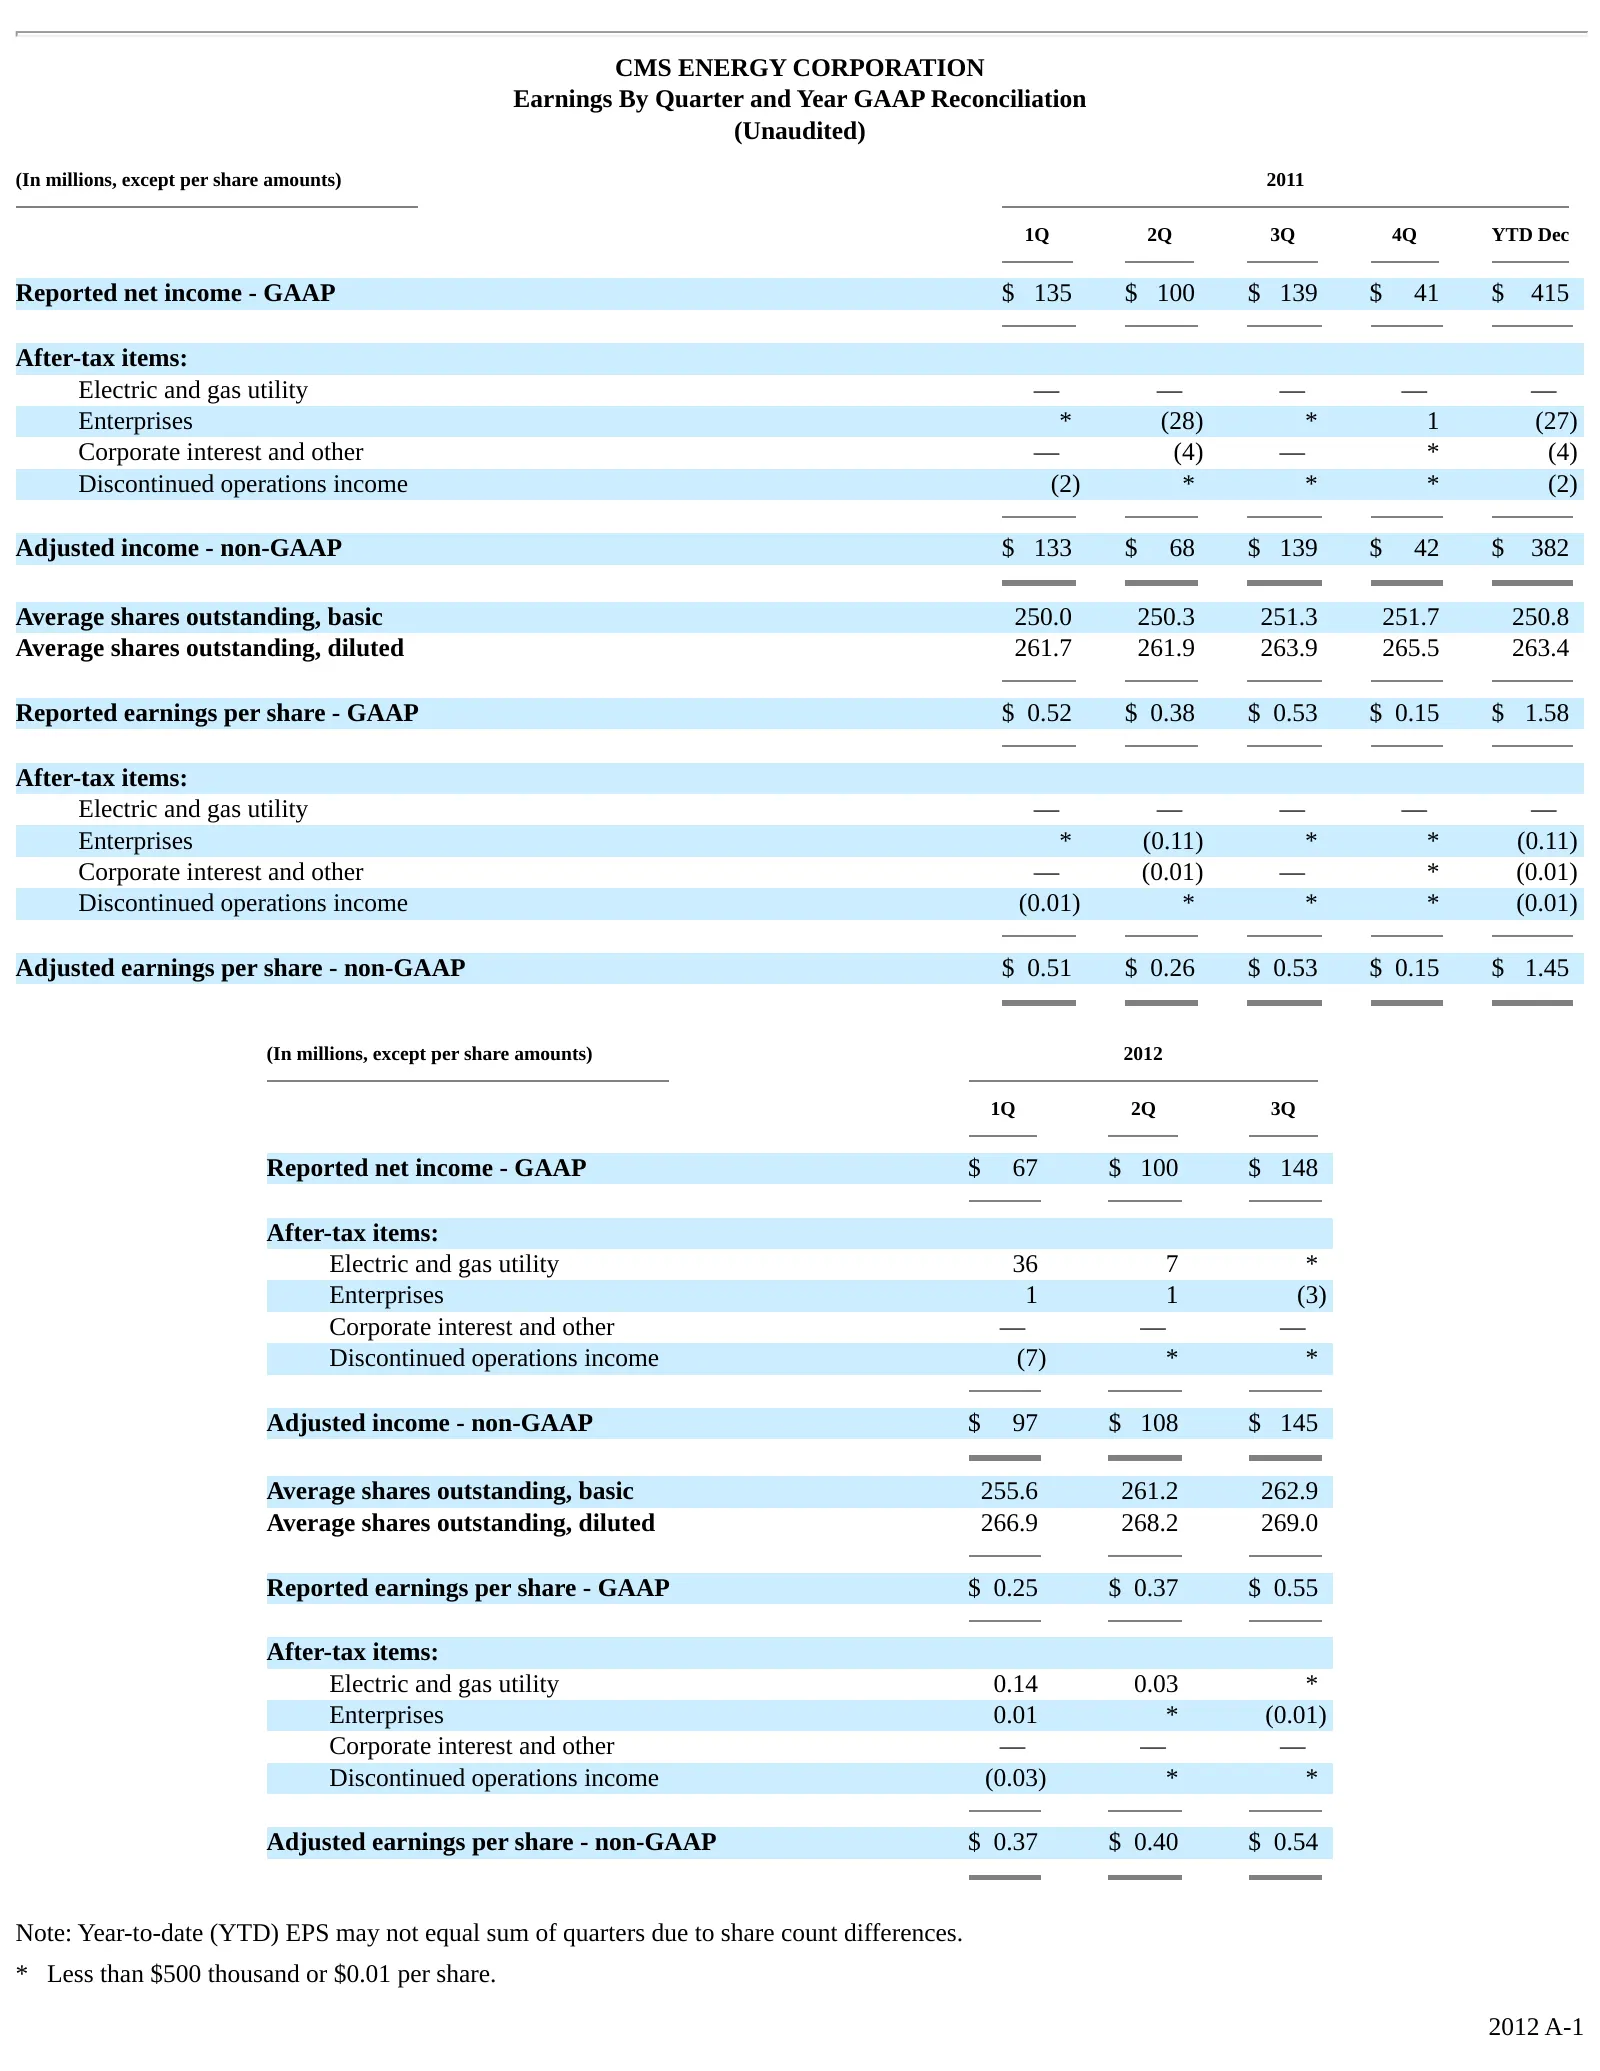
Slide 28: Earnings By Quarter and Year GAAP Reconciliation
CMS ENERGY CORPORATION Earnings By Quarter and Year GAAP Reconciliation (Unaudited) (In millions, except per share amounts) 2011 1Q 2Q 3Q 4Q YTD Dec Reported net income - GAAP $ 135 $ 100 $ 139 $ 41 $ 415 After-tax items: Electric and gas utility — — — — — Enterprises * (28) * 1 (27) Corporate inter
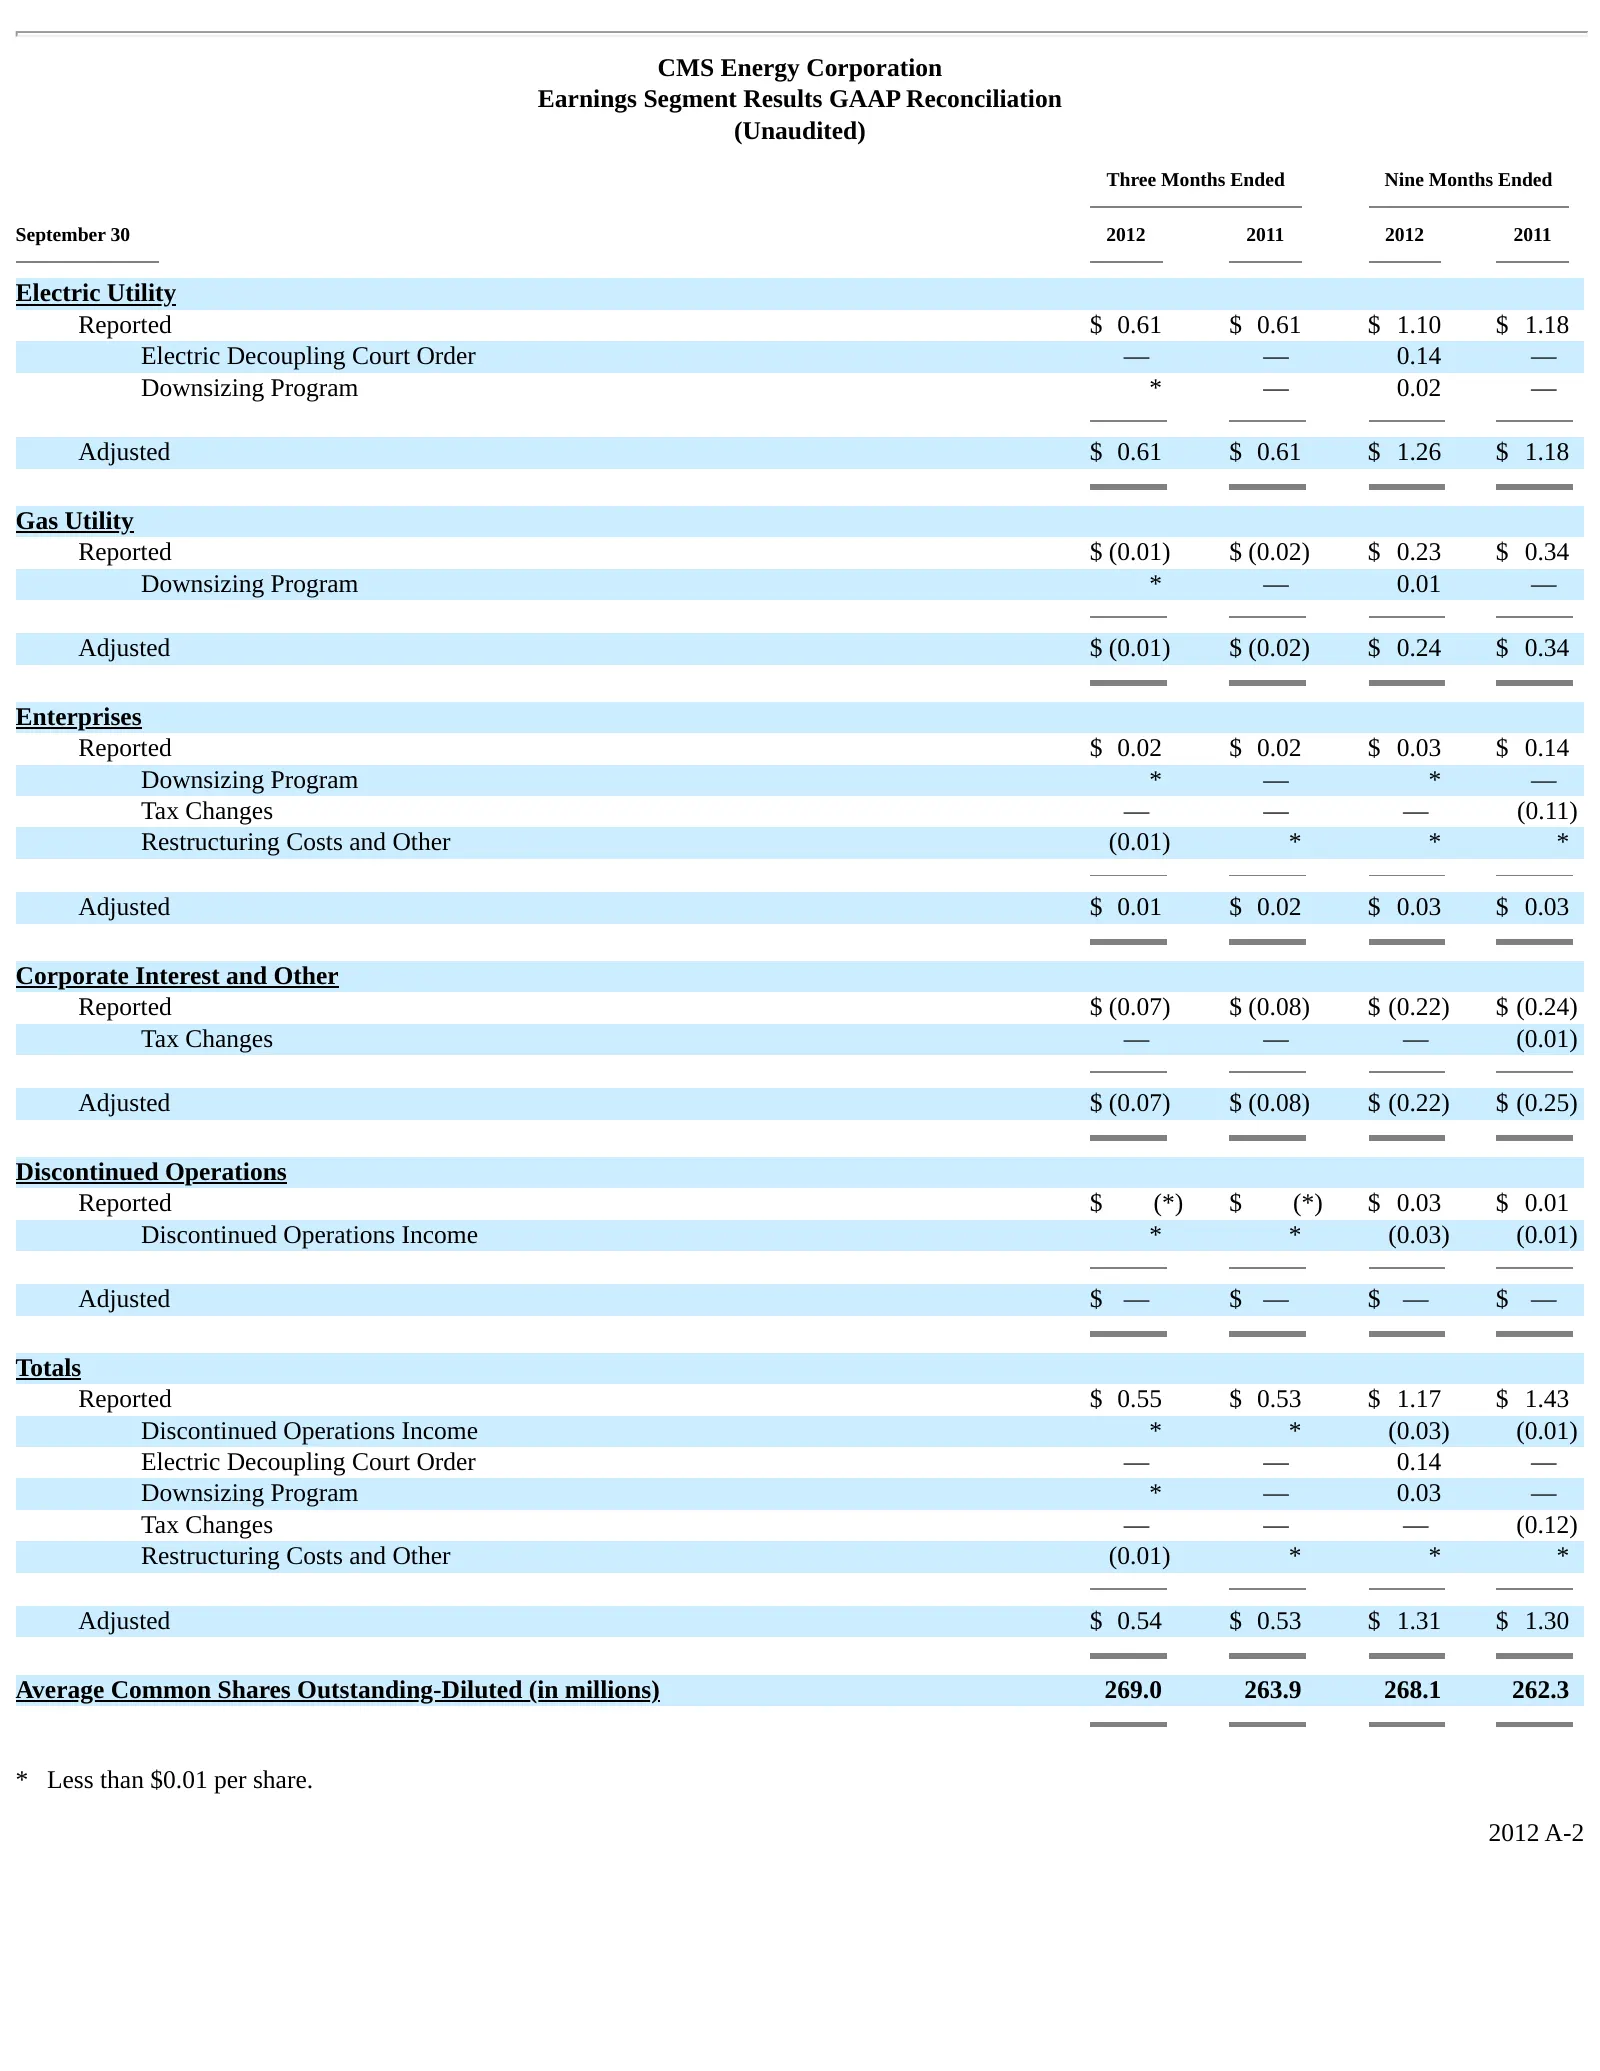
Slide 29: Earnings Segment Results GAAP Reconciliation
CMS Energy Corporation Earnings Segment Results GAAP Reconciliation (Unaudited) Three Months Ended Nine Months Ended September 30 2012 2011 2012 2011 Electric Utility Reported $ 0.61 $ 0.61 $ 1.10 $ 1.18 Electric Decoupling Court Order — — 0.14 — Downsizing Program * — 0.02 — Adjusted $ 0.61 $ 0.61
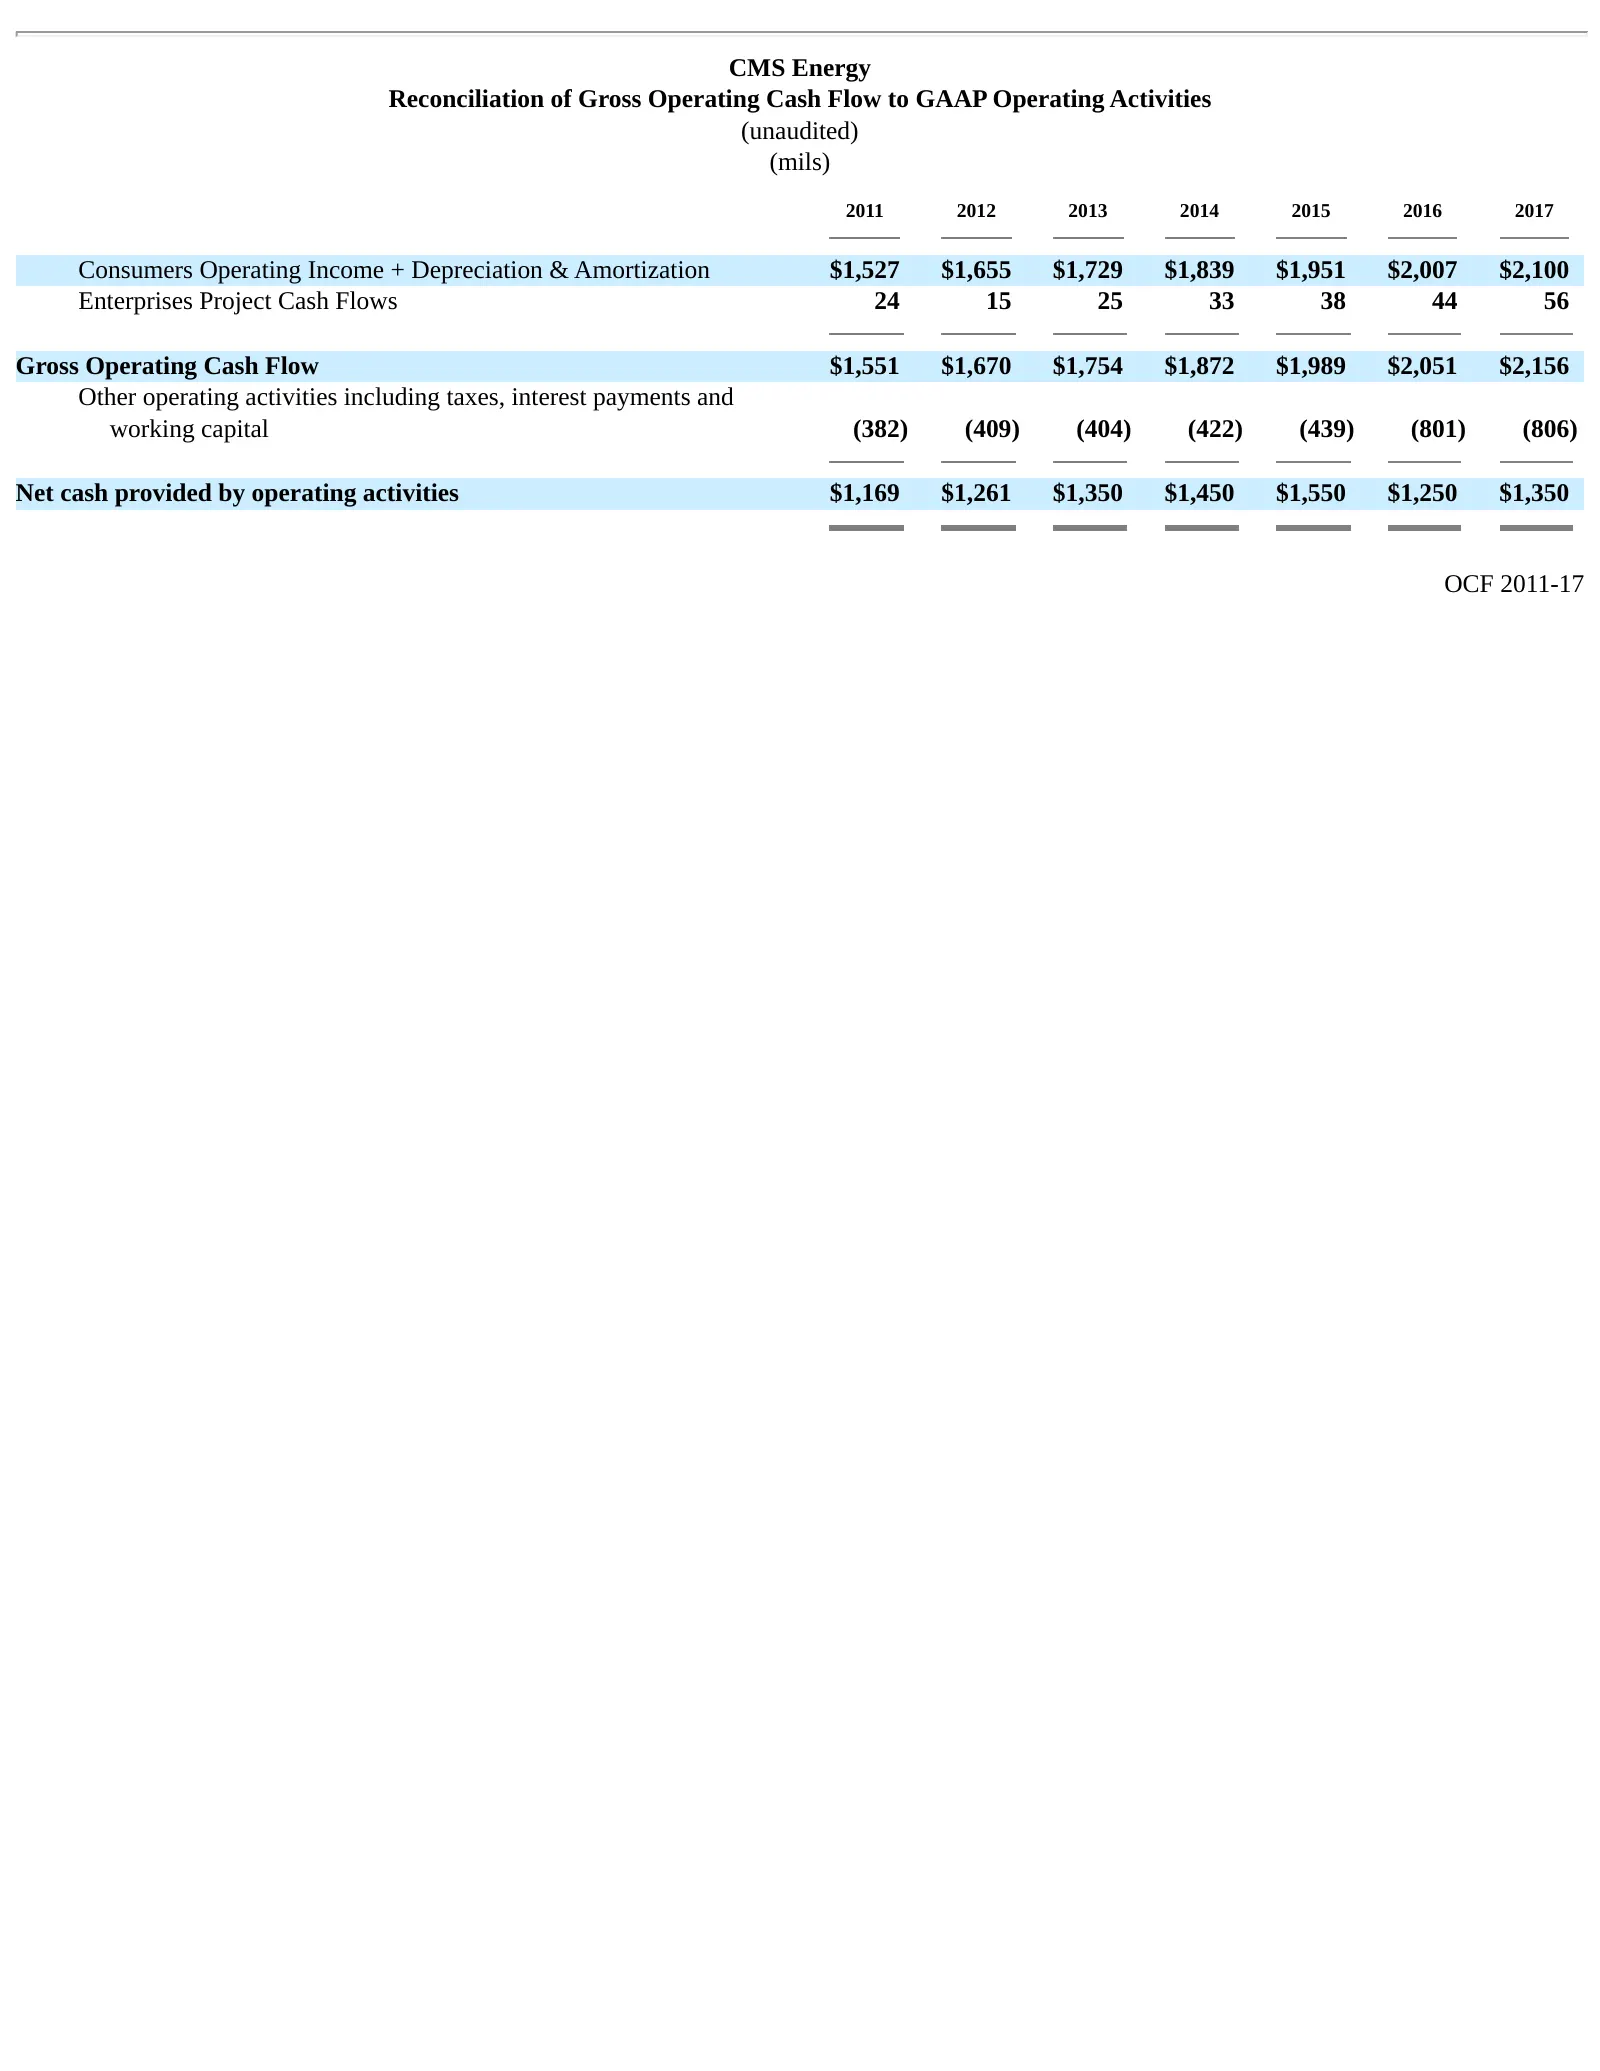
Slide 30: Reconciliation of Gross Operating Cash Flow to GAAP
CMS Energy Reconciliation of Gross Operating Cash Flow to GAAP Operating Activities (unaudited) (mils) 2011 2012 2013 2014 2015 2016 2017 Consumers Operating Income + Depreciation & Amortization $1,527 $1,655 $1,729 $1,839 $1,951 $2,007 $2,100 Enterprises Project Cash Flows 24 15 25 33 38 44 56 Gros
Source: SEC EDGAR · 8-K filed Nov 9, 2012
More decks from Consumers Energy Company
 FY2024 Earnings Presentation33 slides · Feb 6, 2025
 Technical Presentation (August 2024)8 slides · August 2024
 Technical Presentation (August 2024)8 slides · August 2024
 Corporate Update (August 2024)8 slides · August 2024
 Corporate Update (August 2024)8 slides · August 2024
 Corporate Update (September 2023)22 slides · Sep 28, 2023