Santander Holdings USA Inc · NYSE:SNUS/PH
Santander Holdings USA — Debt Investor Presentation (August 2025)
30 slides from Santander Holdings USA's debt investor presentation, Aug 15, 2025
Slide 1: Second Quarter 2025 Fixed Income Investor Presentation
August 15, 2025 Second Quarter 2025 Fixed Income Investor Presentation
Slide 2: Important Information
Important Information This presentation of Santander Holdings USA, Inc. (“SHUSA") contains “forward-looking statements" within the meaning of the Private Securities Litigation Reform Act of 1995 regarding the Financial condition, results of operations, business plans and future performance of SHUSA.
Slide 3: Index: At a glance
Index At aglance
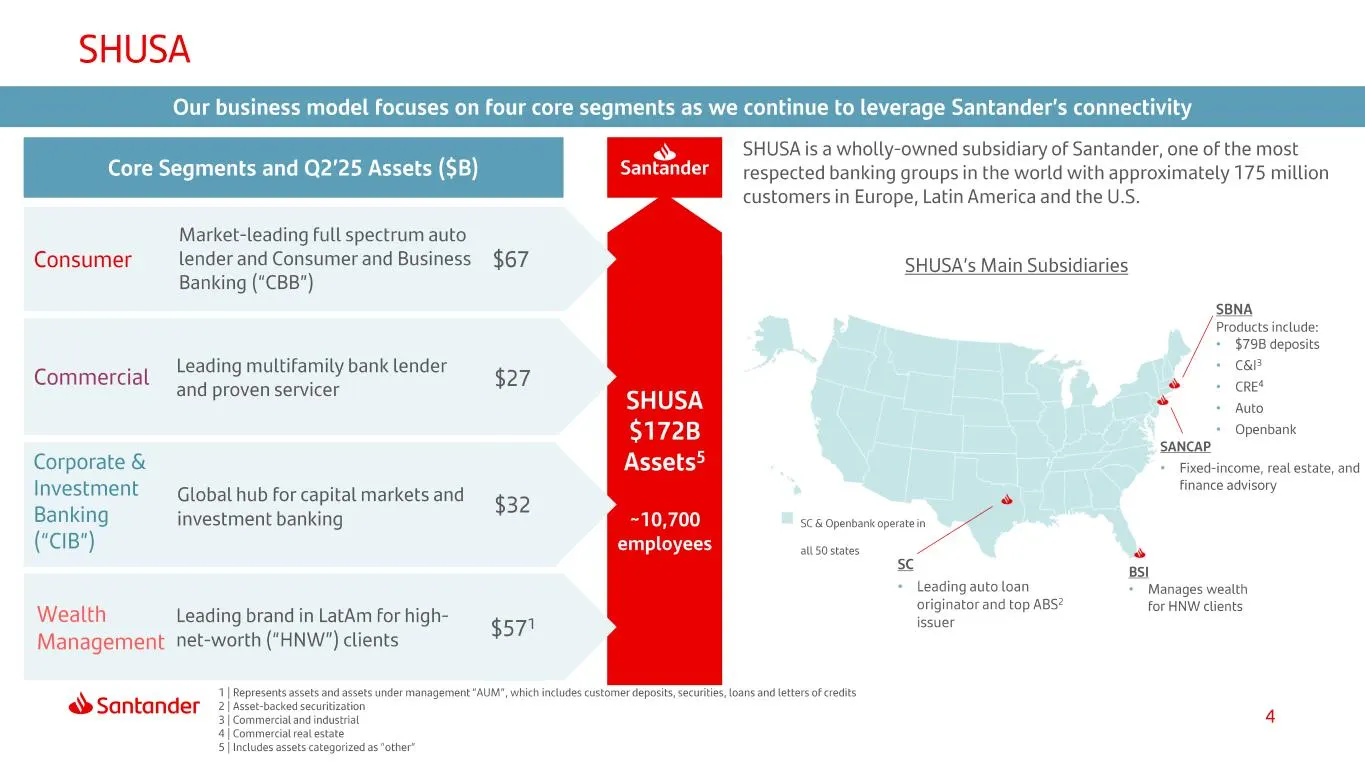
Slide 4: Market-leading full spectrum auto lender and Consumer and Business Banking
Market-leading full spectrum auto Consumer lender and Consumer and Business $67 Banking ("CBB") Ay Santander SHUSA is a wholly-owned subsidiary of Santander, one of the most respected banking groups in the world with approximately 175 million customers in Europe, Latin America and the U.S. SHUSA's M
Slide 5: SHUSA Q2 2025 Results at a Glance
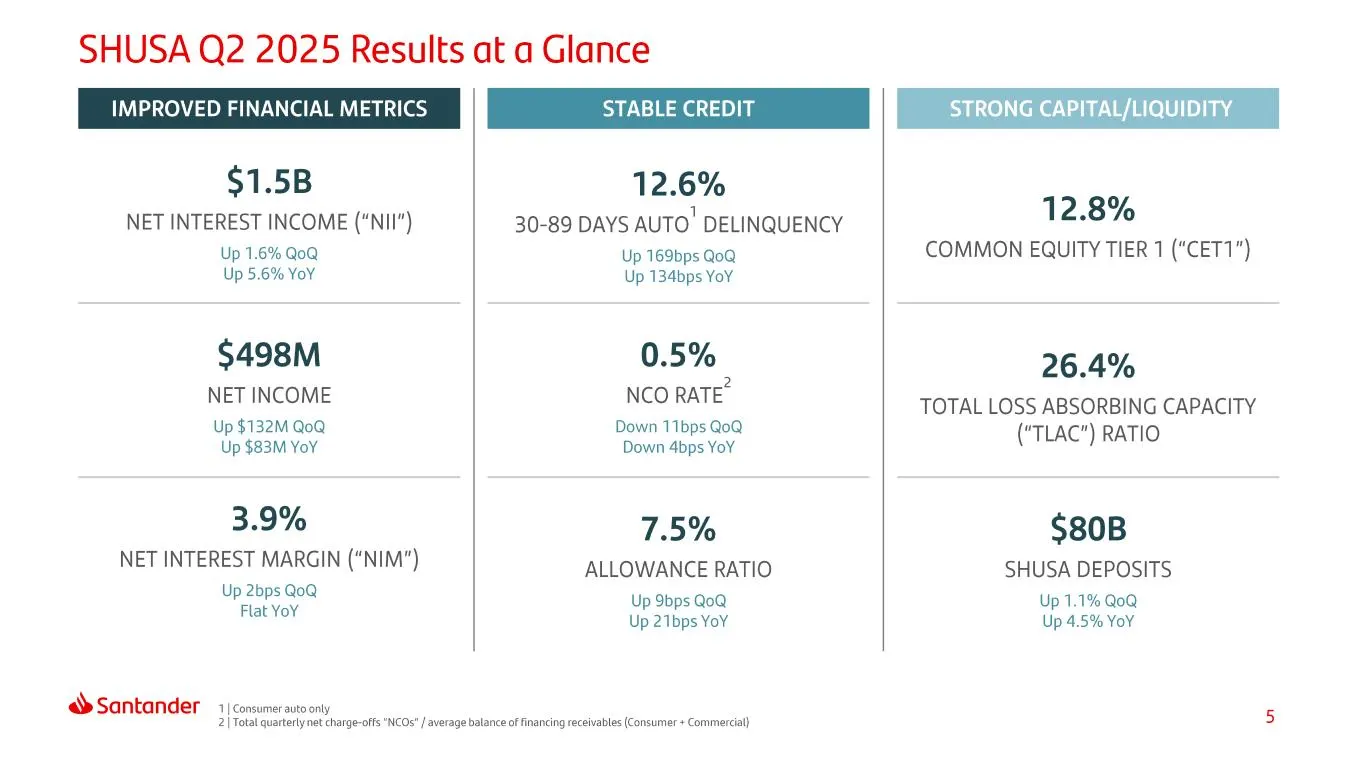
SHUSA Q2 2025 Results at a Glance IMPROVED FINANCIAL METRICS $1.5B NET INTEREST INCOME (“NII”) Up 1.6% QoQ Up 5.6% YoY $498M NET INCOME Up $132M QoQ Up $83M YoY 3.9% NET INTEREST MARGIN (“NIM") Up 2bps QoQ Flat YoY @® Santander + consumer autoony STABLE CREDIT 12.6% 30-89 DAYS AUTO' DELINQUENCY Up 1
Slide 6: Index
Index
Slide 7: Quarterly Profitability
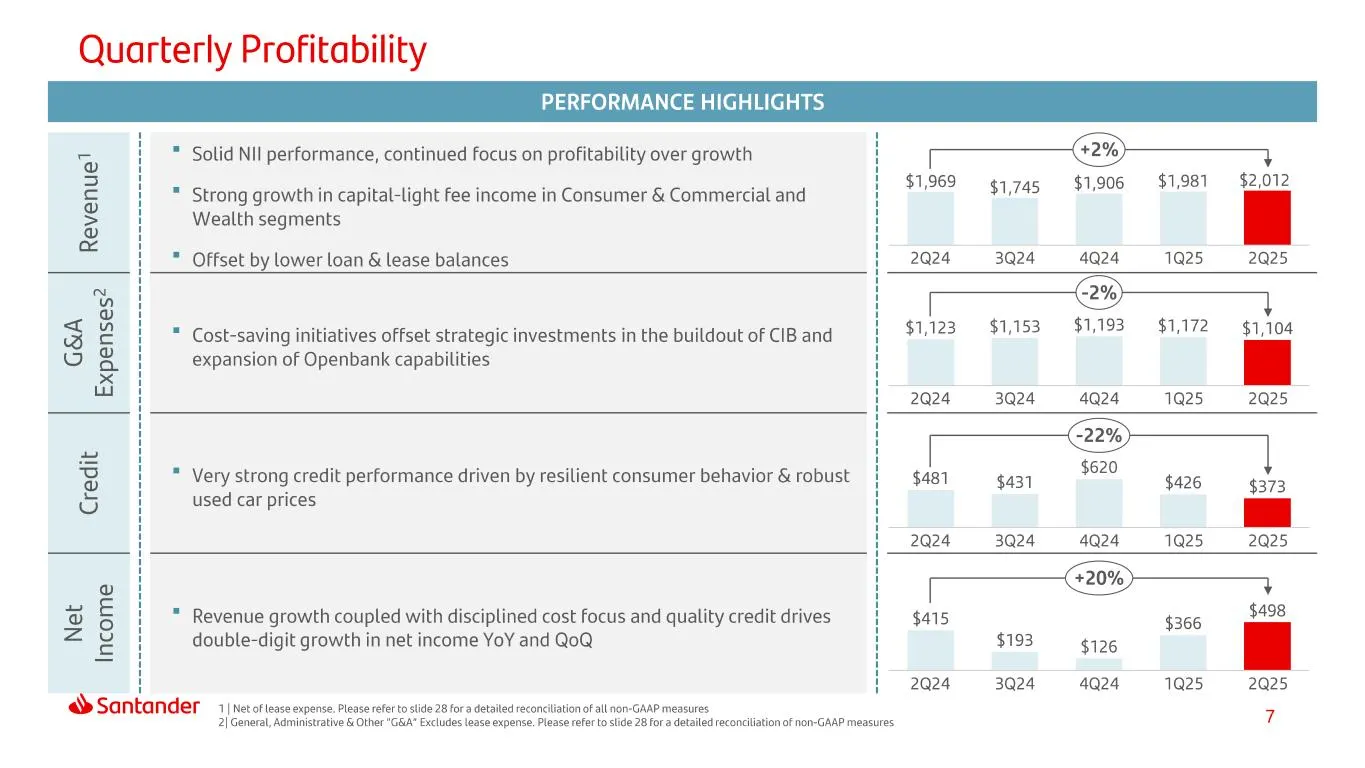
Quarterly Profitability PERFORMANCE HIGHLIGHTS 1 1 TG ' ™ Solid Nil performance, continued focus on profitability over growth H +2% H i =) i 1 $1,969 f 1,981 5 ! ™ Strong growth in capital-light fee income in Consumer & Commercial and H $ $1745 $1,906 $ > H Wealth segments i 2: | i __* Offset by low
Slide 8: Net Interest Income & Net Interest Margin
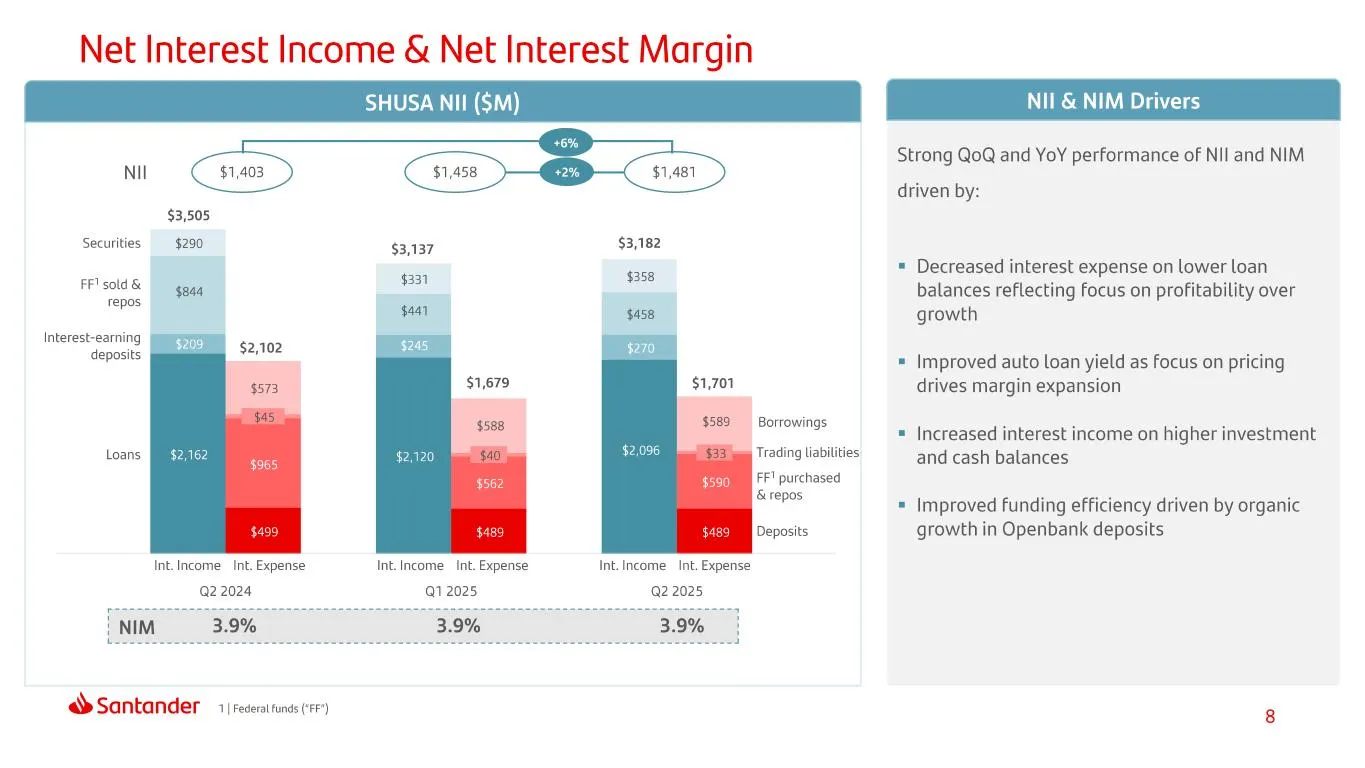
Net Interest Income & Net Interest Margin SHUSA NII ($M) Nil & NIM Drivers 16% Strong QoQ and YoY performance of NIl and NIM <e <> <P oe $3,505 Securities $290 $3,137 $3,182 Si Arse) = Decreased interest expense on lower loan re = $844 balances reflecting focus on profitability over $441 $458 growth
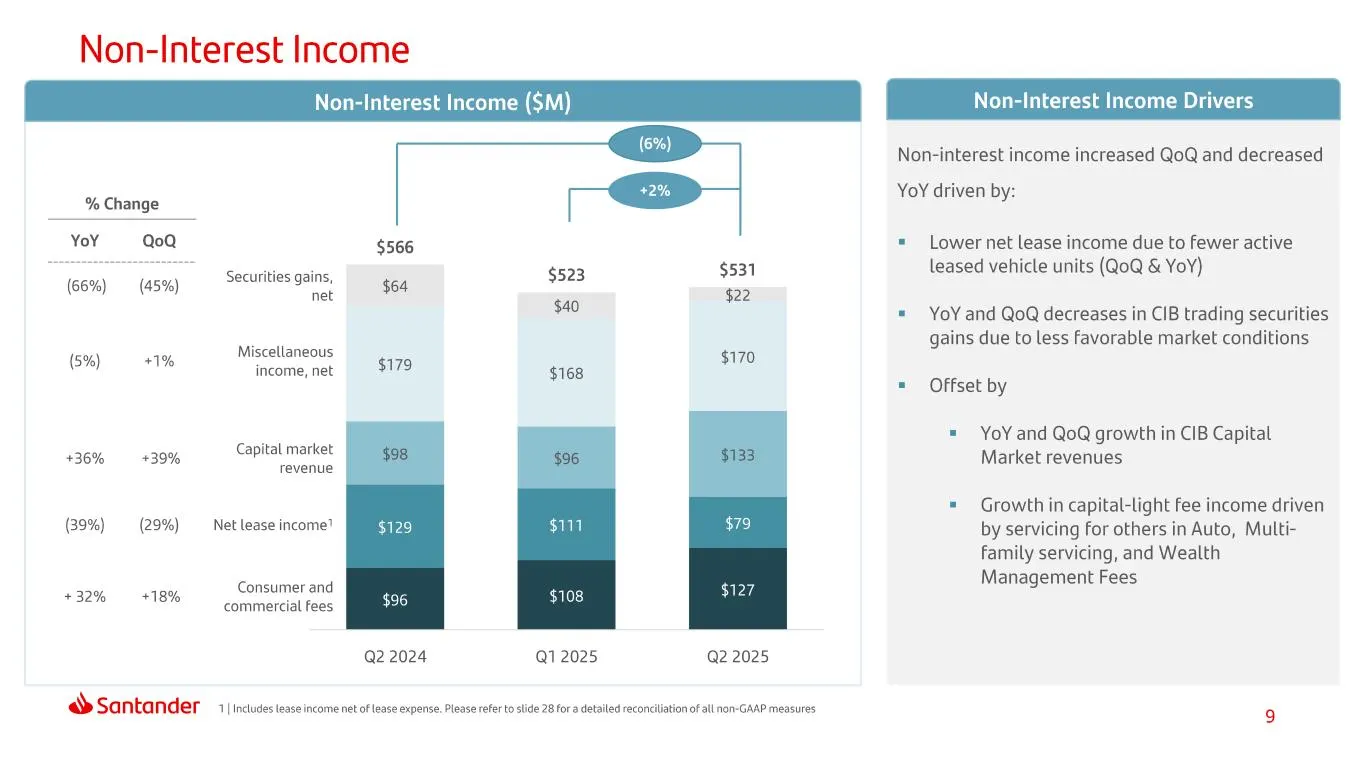
Slide 9: Non-Interest Income
Non-Interest Income Non-Interest Income ($M) No terest Incom ers <> Non-interest income increased QoQ and decreased sé coange =a YoY driven by: YoY QoQ $566 = Lower net lease income due to fewer active — - 531 leased vehicle units (QoQ & YoY) (66%) (45%) Securities gains es $523 a els = YoY and QoQ
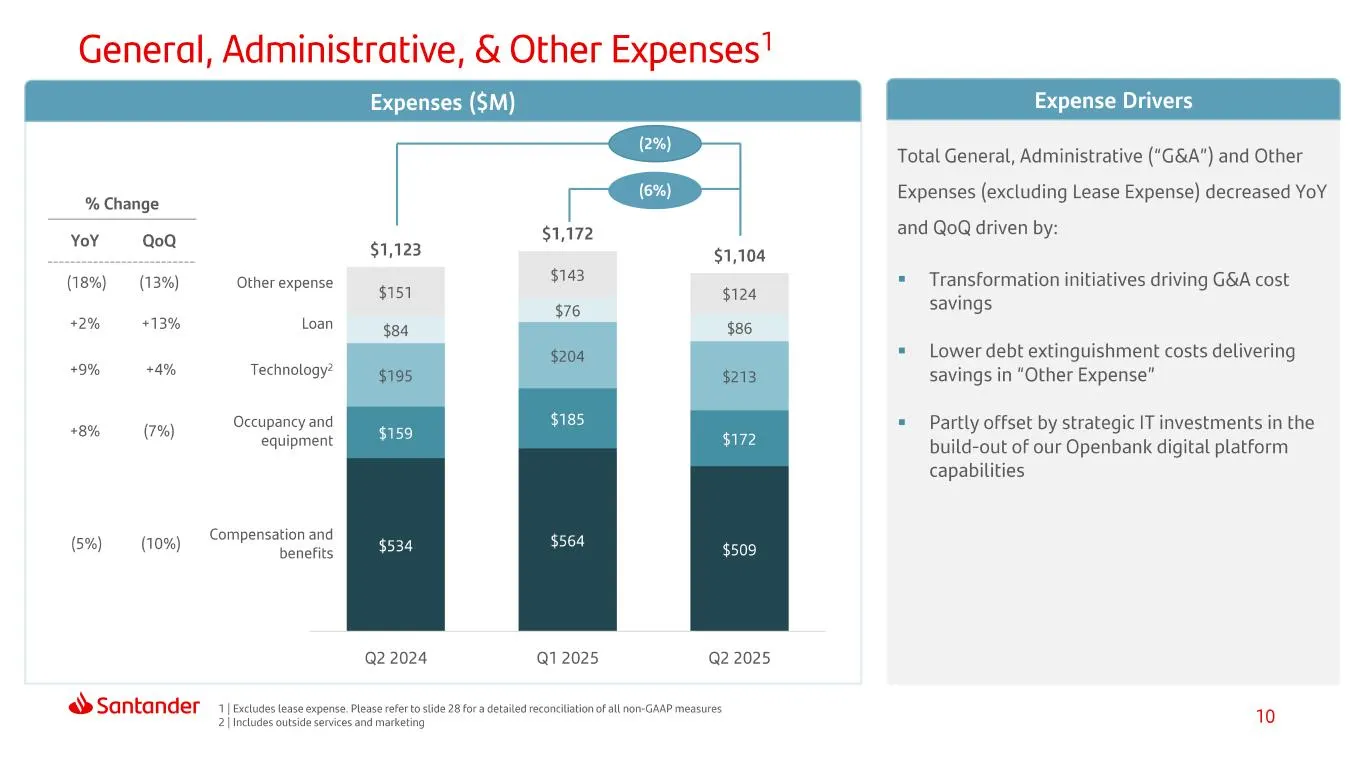
Slide 10: General, Administrative, & Other Expenses
General, Administrative, & Other Expenses! epee Total General, Administrative ("G&A") and Other Expenses (excluding Lease Expense) decreased YoY % Change and QoQ driven by: someone $123 (18%) (13%) Other expense $151 = Transformation initiatives driving G&A cost savings +2% — +13% Loan $84 = Lower d
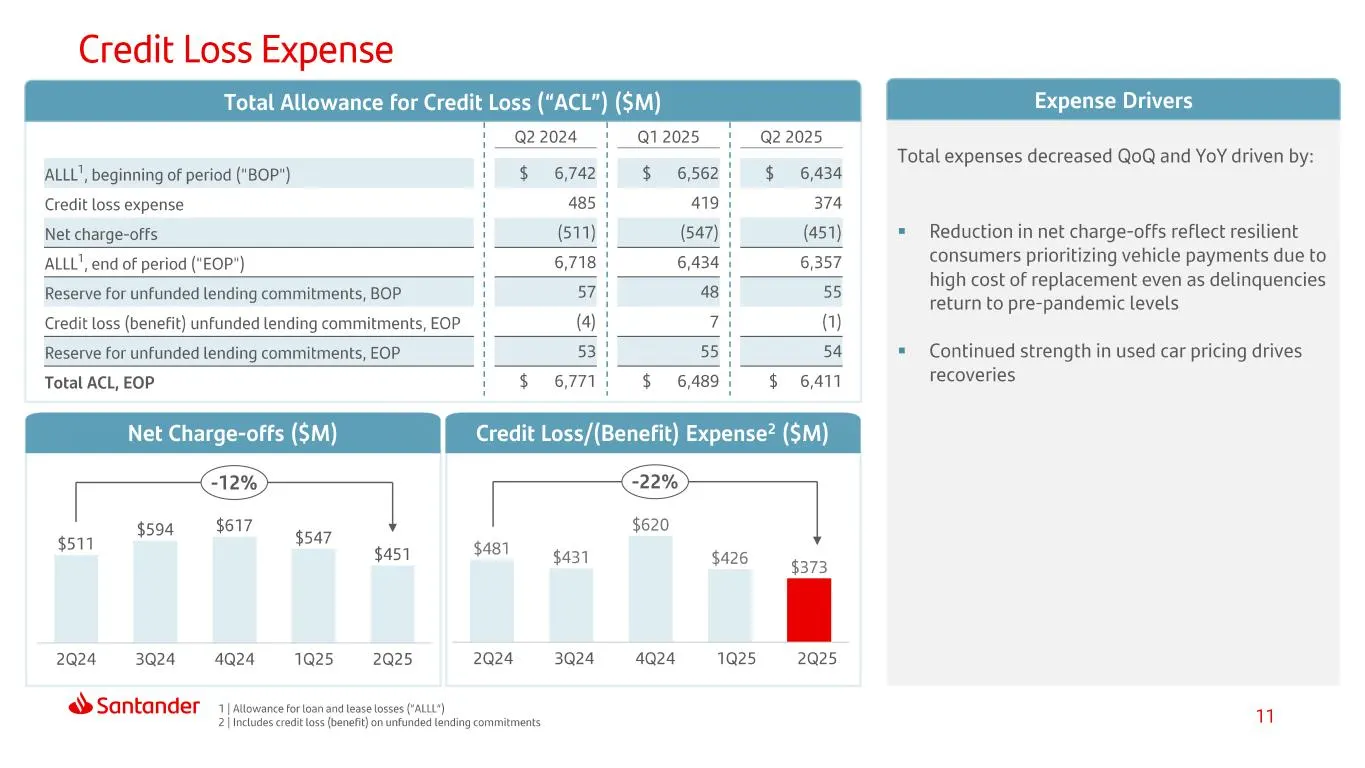
Slide 11: Credit Loss Expense
Credit Loss Expense 1 Q22024 } —Q12025 Q2 2025 f ] Total expenses decreased QoQ and YoY driven by: ALLL’, beginning of period ("BOP") ‘ sie: | Rs $ 6,434 Credit loss expense : 485 | 374 Net charge-offs : (511) : (451) = Reduction in net charge-offs reflect resilient ALLL", end of period ("EOP") 1 6,
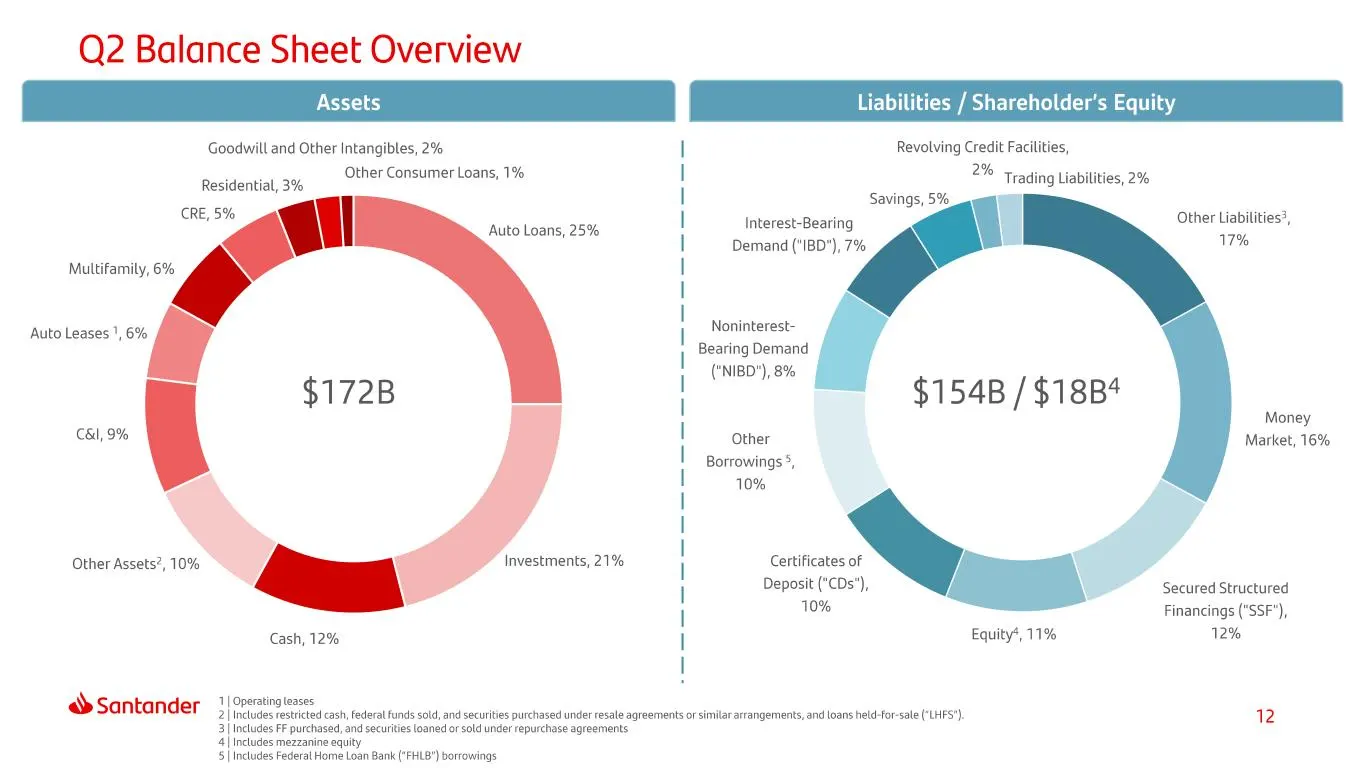
Slide 12: Q2 Balance Sheet Overview
Q2 Balance Sheet Overview Goodwill and Other Intangibles, 2% Residential, 3% CRE, 5% \ | Multifamily, 6% Auto Leases ", 6% a CBI, 9% | Other Assets’, 10% «> Santander ies / Shareholde: Eq Revolving Credit Facilities, 2% Other Consumer Loans, 1% Trading Liabilities, 2% Savings, 5%. Other Liabilities’
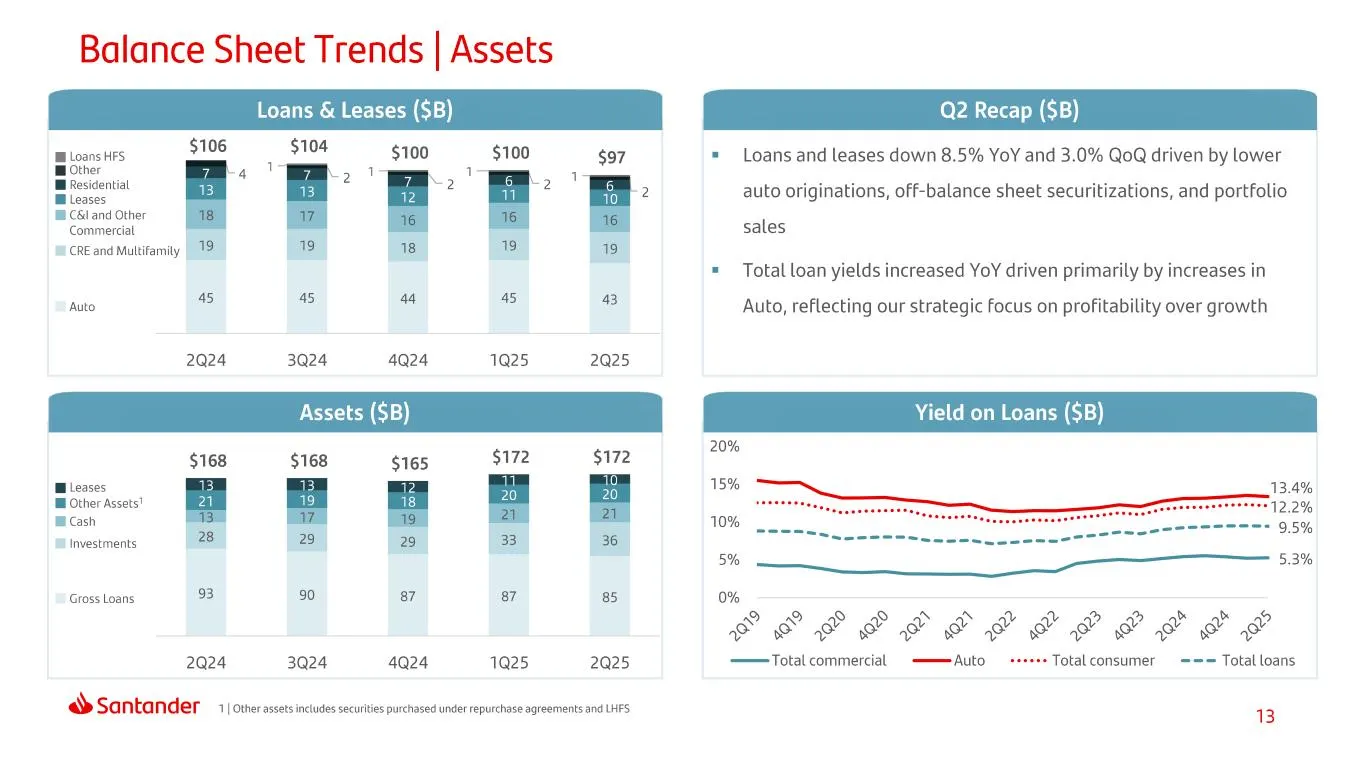
Slide 13: Balance Sheet Trends | Assets
Balance Sheet Trends | Assets a2 Rea (8) Bloons HFS $106 $104 $100 $100 $97 Loans and leases down 8.5% YoY and 3.0% QoQ driven by lower er Hise 7 T & r a 2 auto originations, off-balance sheet securitizations, and portfolio CB and Other Commercial sales 19 CRE and Multifamily = Total loan yields inc
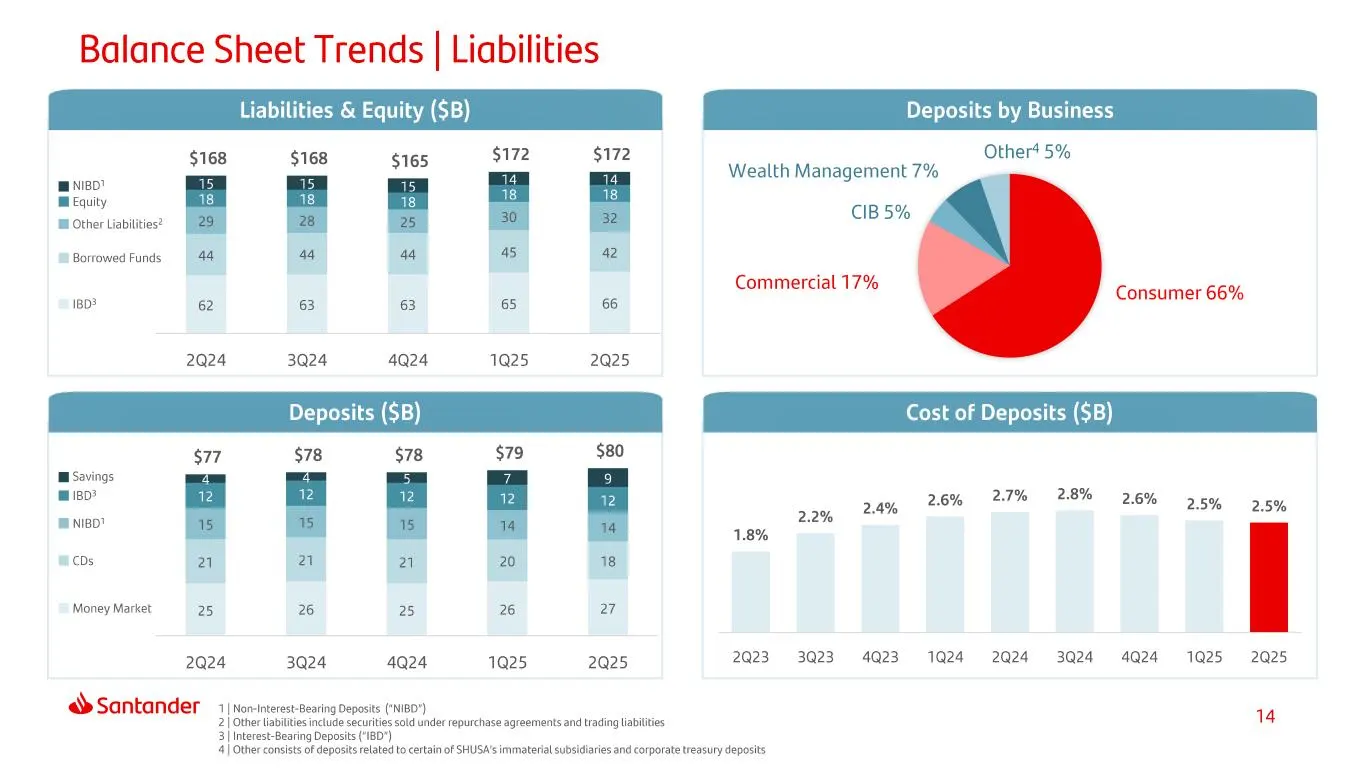
Slide 14: Balance Sheet Trends | Liabilities
Balance Sheet Trends | Liabilities Liabilities & Equity ($B) Deposits by Business 168 168 $172 $172 Other4 5% : =i6s $165 Wealth Management 7% mnie" 14 Equity ; 1 Other Liabilities? CIB 5% 44 44 44 45 2 Borrowed Funds Commercial 17% 9 1803 62 63 63 65 66 Consumer 66% 2024 3024 4024 1925 2025 Deposit
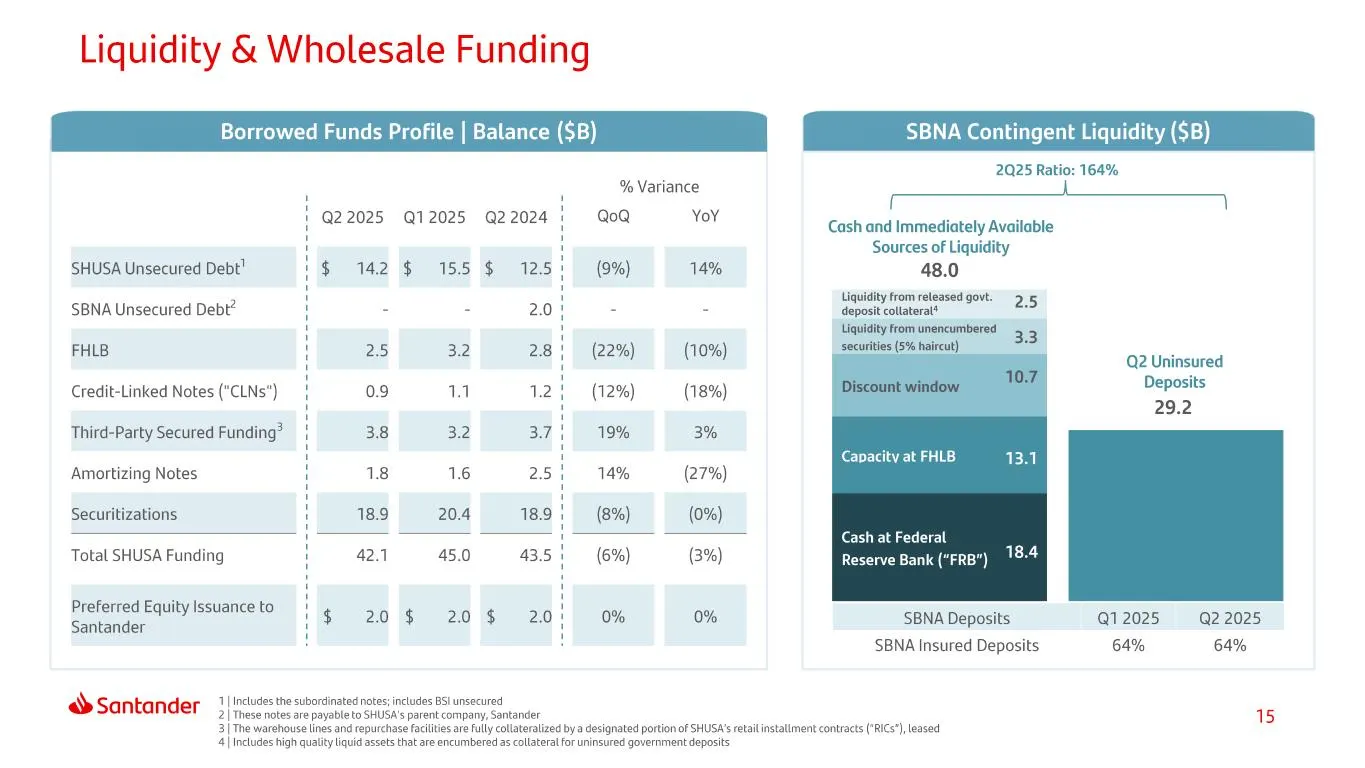
Slide 15: Liquidity & Wholesale Funding
Liquidity & Wholesale Funding Borrowed Funds Profile | Balance ($B) 2Q25 Ratio: 164% % Variance ; k f Q22025 Q12025 Q22024 Go vey Cash and Immediately Available Sources of Liquidity SHUSA Unsecured Debt" $ M42$ 155 $ 125: (9%) 14% 48.0 Liquidity rom released govt. > 5 SBNA Unsecured Debt? ' - - 201
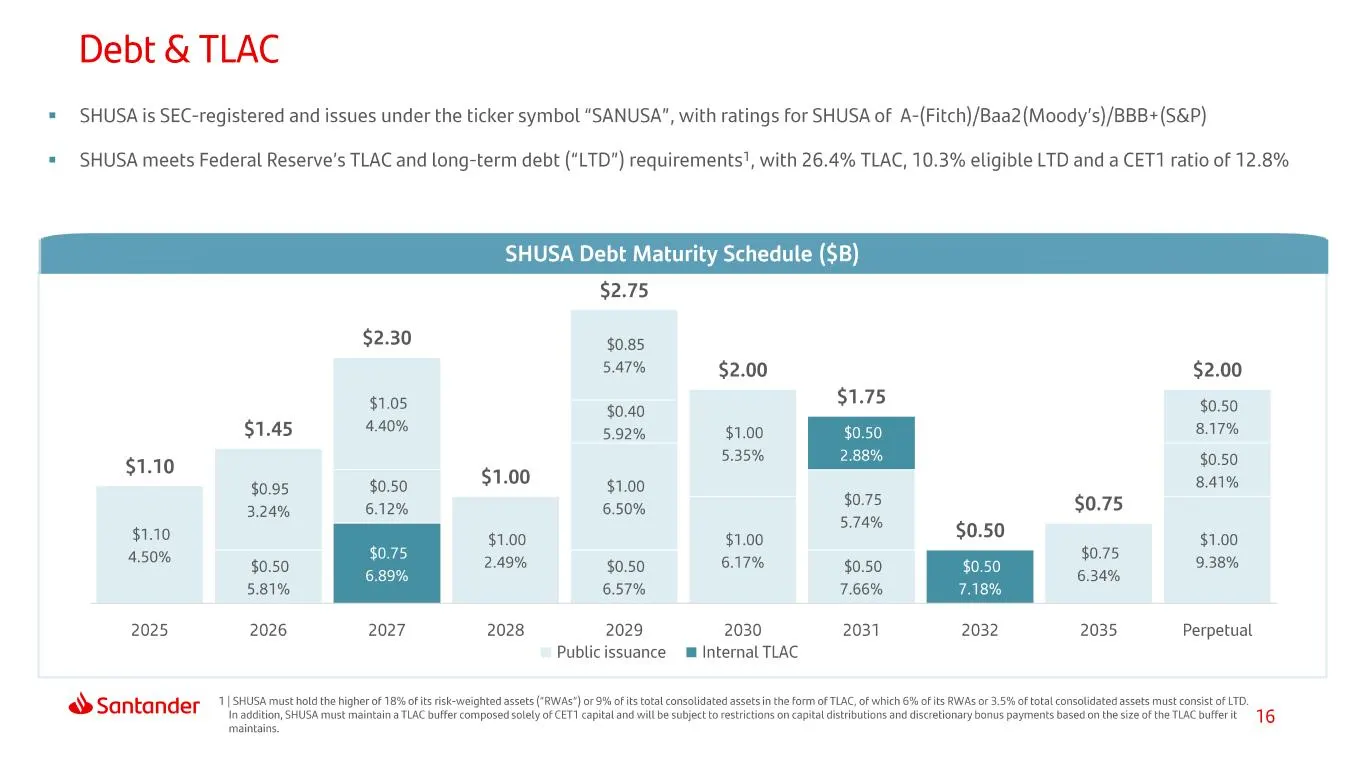
Slide 16: Debt & TLAC
Debt & TLAC = SHUSA is SEC-registered and issues under the ticker symbol “SANUSA", with ratings for SHUSA of A-(Fitch)/Baa2(Moody’s)/BBB+(S&P) = SHUSA meets Federal Reserve's TLAC and long-term debt ("LTD") requirements’, with 26.4% TLAC, 10.3% eligible LTD and a CET1 ratio of 12.8% SHUSA Debt Matur
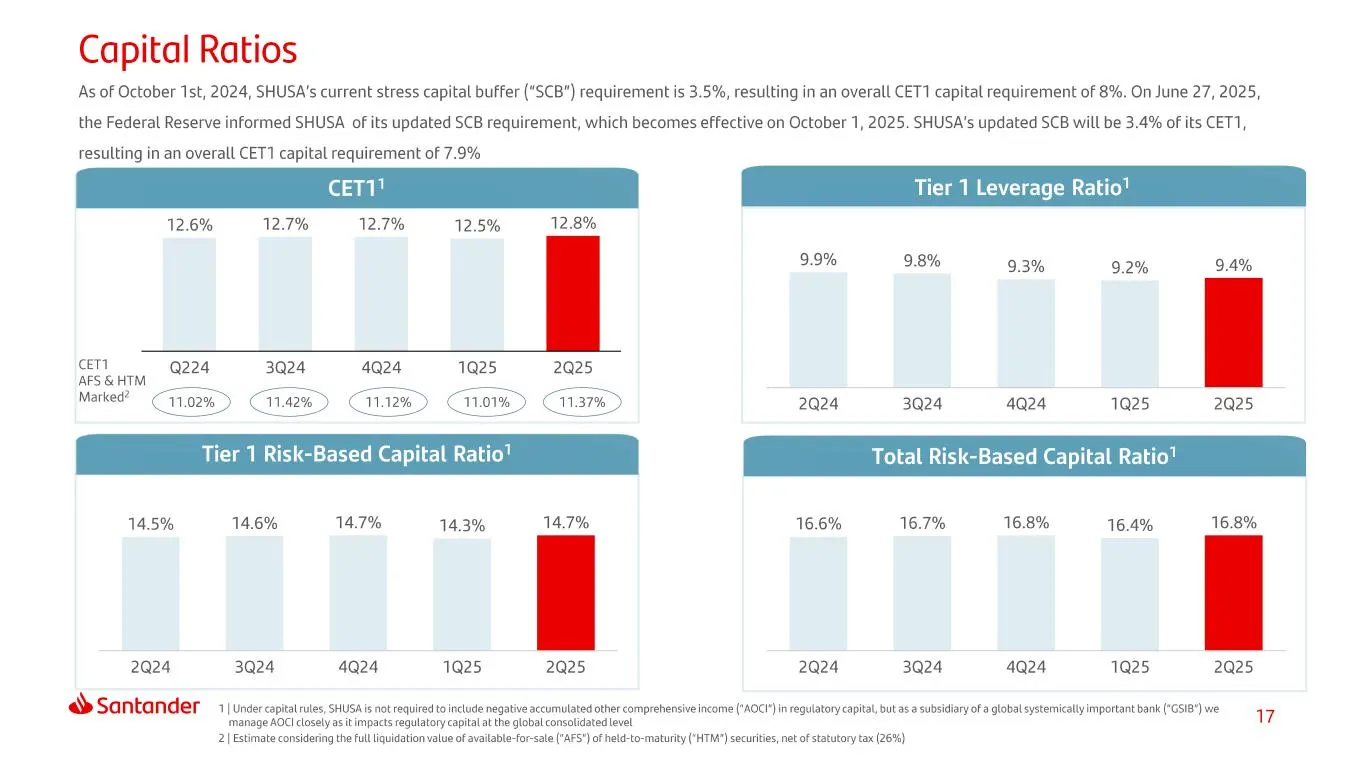
Slide 17: Capital Ratios
Capital Ratios As of October 1st, 2024, SHUSA’s current stress capital buffer ("SCB") requirement is 3.5%, resulting in an overall CET1 capital requirement of 8%. On June 27, 2025, the Federal Reserve informed SHUSA of its updated SCB requirement, which becomes effective on October 1, 2025. SHUSA's
Slide 18: Index
wn un ge os a us a un KS = = ug < Index
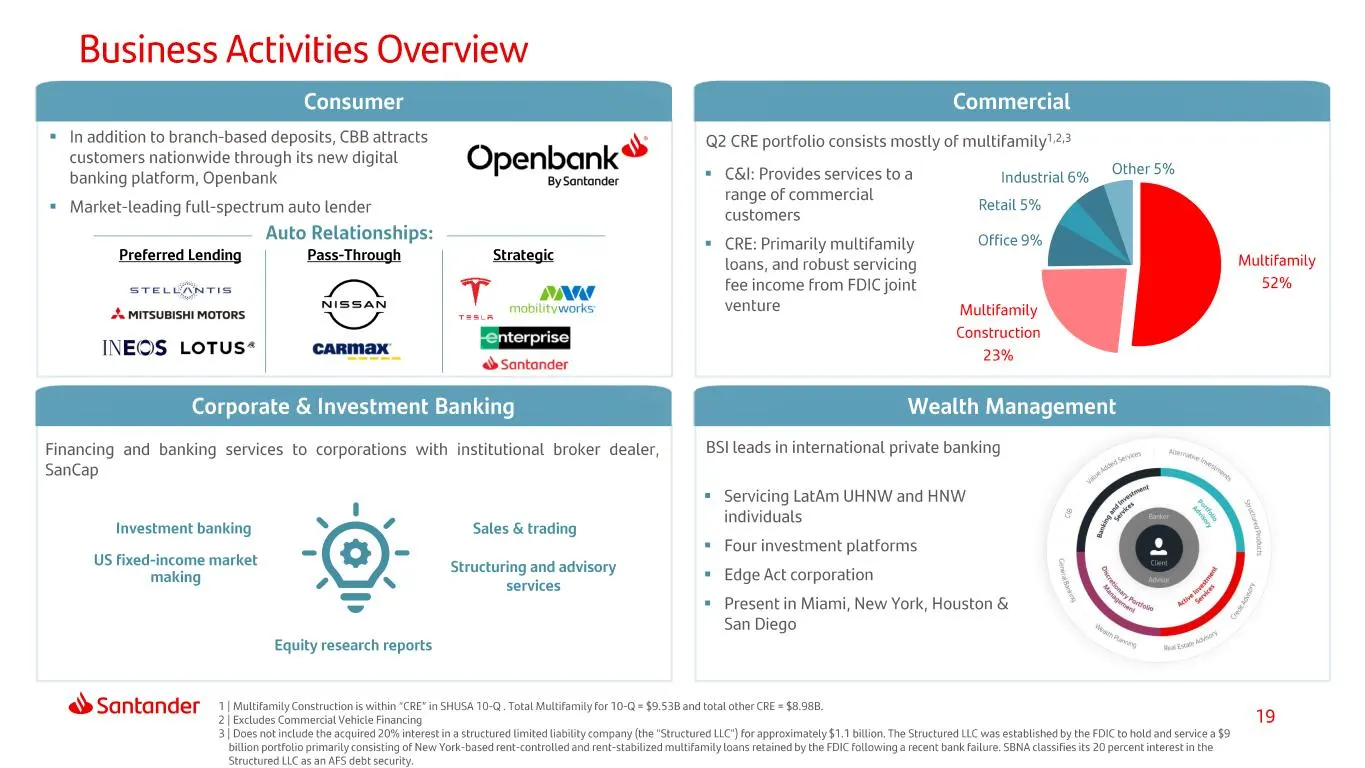
Slide 19: Business Activities Overview
Business Activities Overview Consumer Commer * In addition to branch-based deposits, CBB attracts QZ ERE portfolio:consists mostiy of multifarnity'23 customers nationwide through its new digital Openbank® L banking platform, Openbank By Santonder = C&il: Provides services to a Industrial 6% _ Other
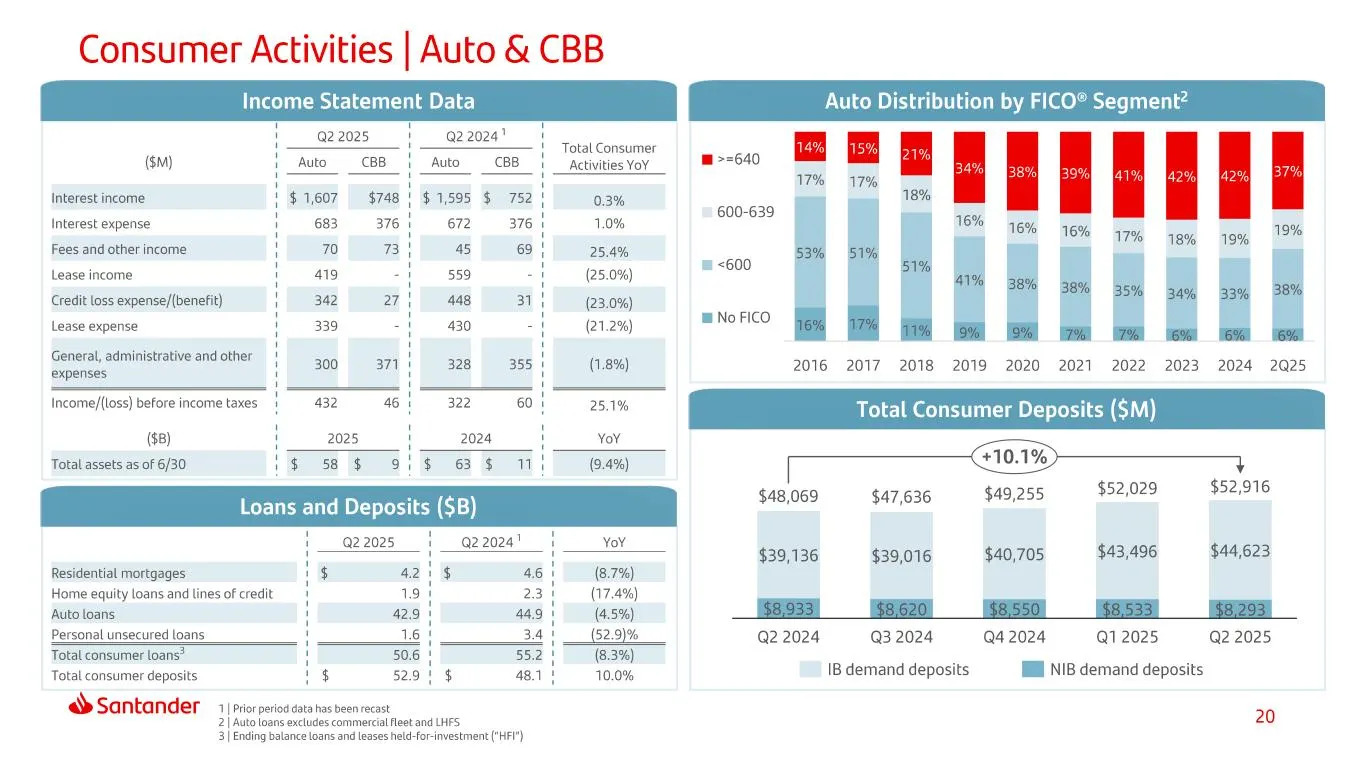
Slide 20: Consumer Activities | Auto & CBB
Consumer Activities | Auto & CBB Income Statement Data 1 a22025 | ga20z4" ! ' ! Total Consumer (sm) 4, Auto. SEBs f atulo: CBB: __Activities YoY Interest income | $1607 $748 | $1,595 $ 752! 03% Interest expense | 683-376! 672,376} 1.0% Fees and other income ‘ 70 B! 45 oo! 25.4% Lease income 1 419 =}
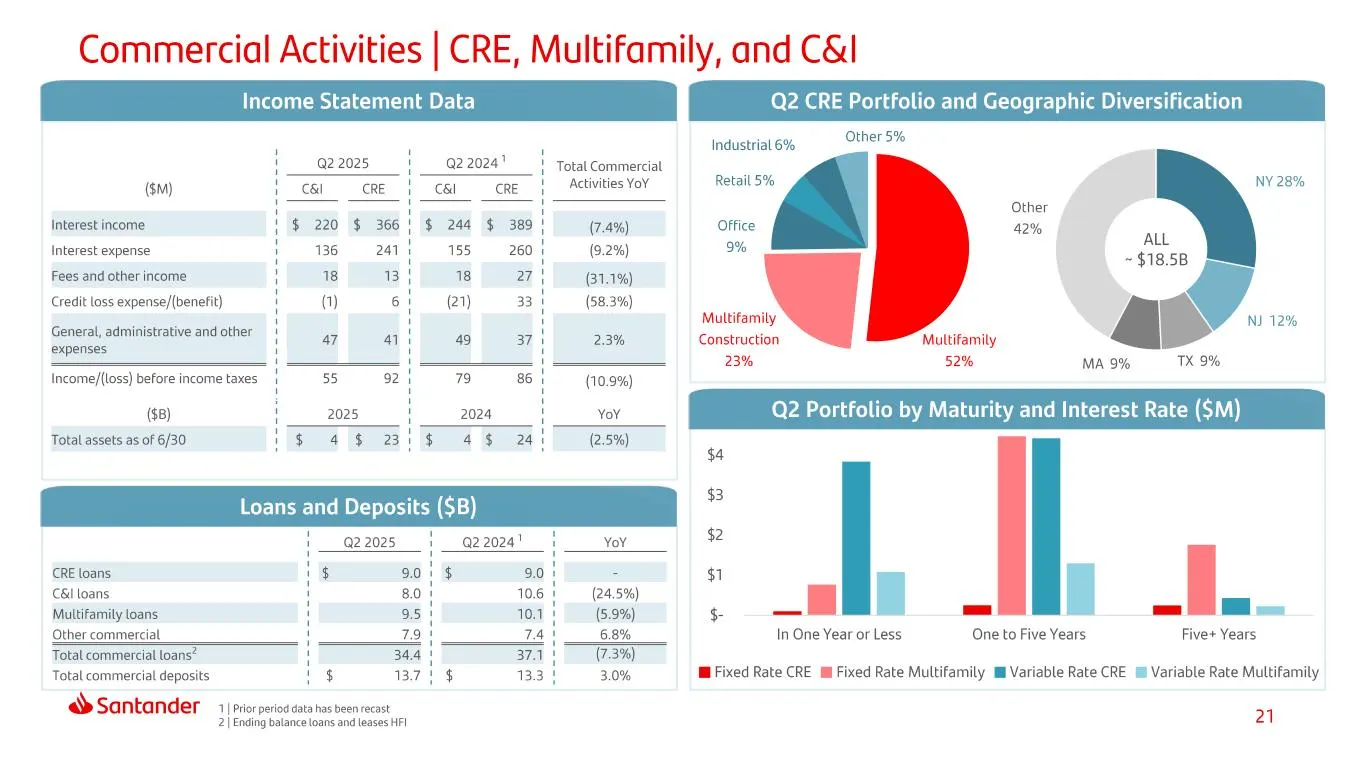
Slide 21: Commercial Activities | CRE, Multifamily, and C&I
Commercial Activities | CRE, Multifamily, and C&I Income Statement Data Q2 CRE Portfolio and Geographic Diversification ' : , Industrial 6% Other 5% ' Q2 2025 ' 22024"! Total Commercial (sm) 1 Cal CRE | «CRI CRE_(|_—Atvities YoY Retail 5% NY 28% \ H H Other Interest income ! § 220 $ 366! $ 244 $ 389
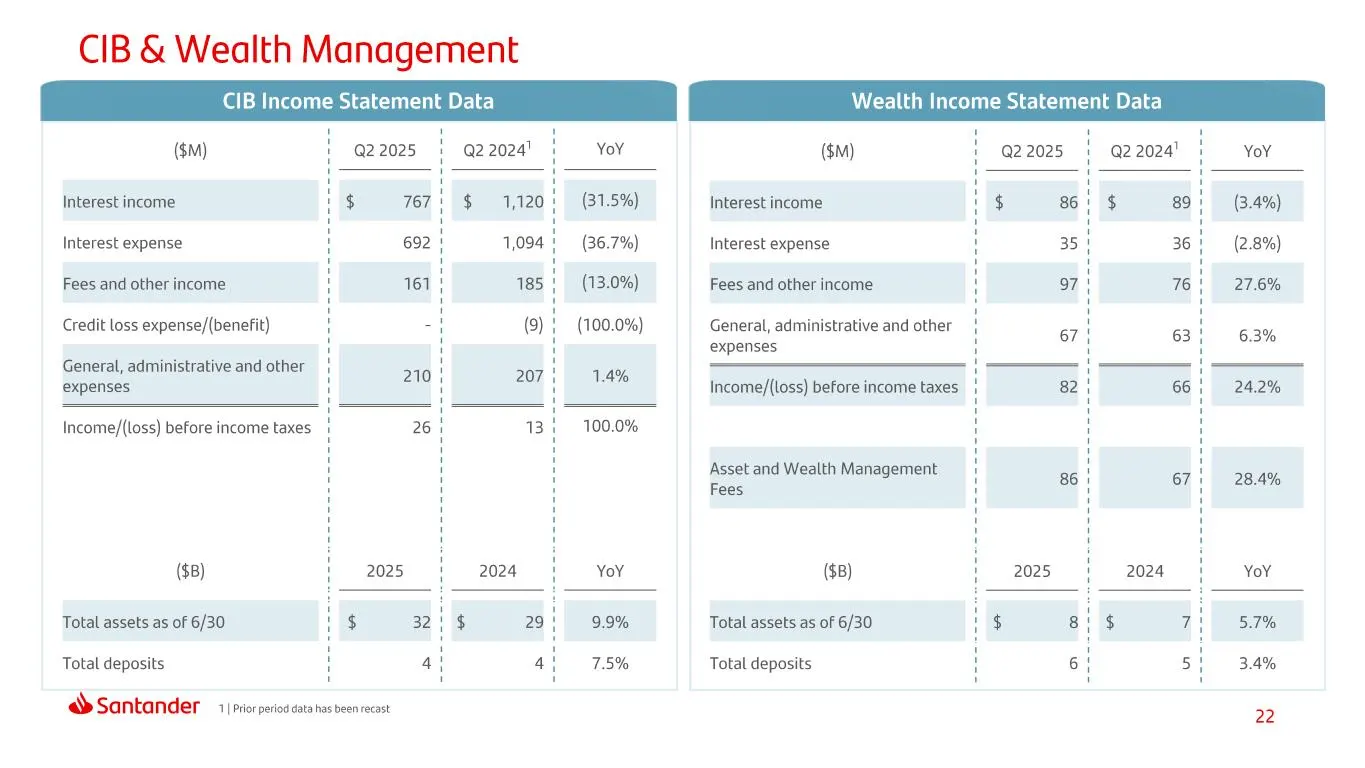
Slide 22: CIB & Wealth Management
CIB & Wealth Management (sm) | @22025 | @22024 | YoY ($m) | 22025 | @220241 YoY Interest income | $ 767! $ 1,120! (31.5%) Interest income 1 861 $ 89! (3.4%) Interest expense ' 692 | 1,094 | (36.7%) Interest expense 35! 36! (2.8%) Fees and other income ' 161! 185} (13.0%) Fees and other income 97! 76
Slide 23: Appendix
Appendix Index A tie
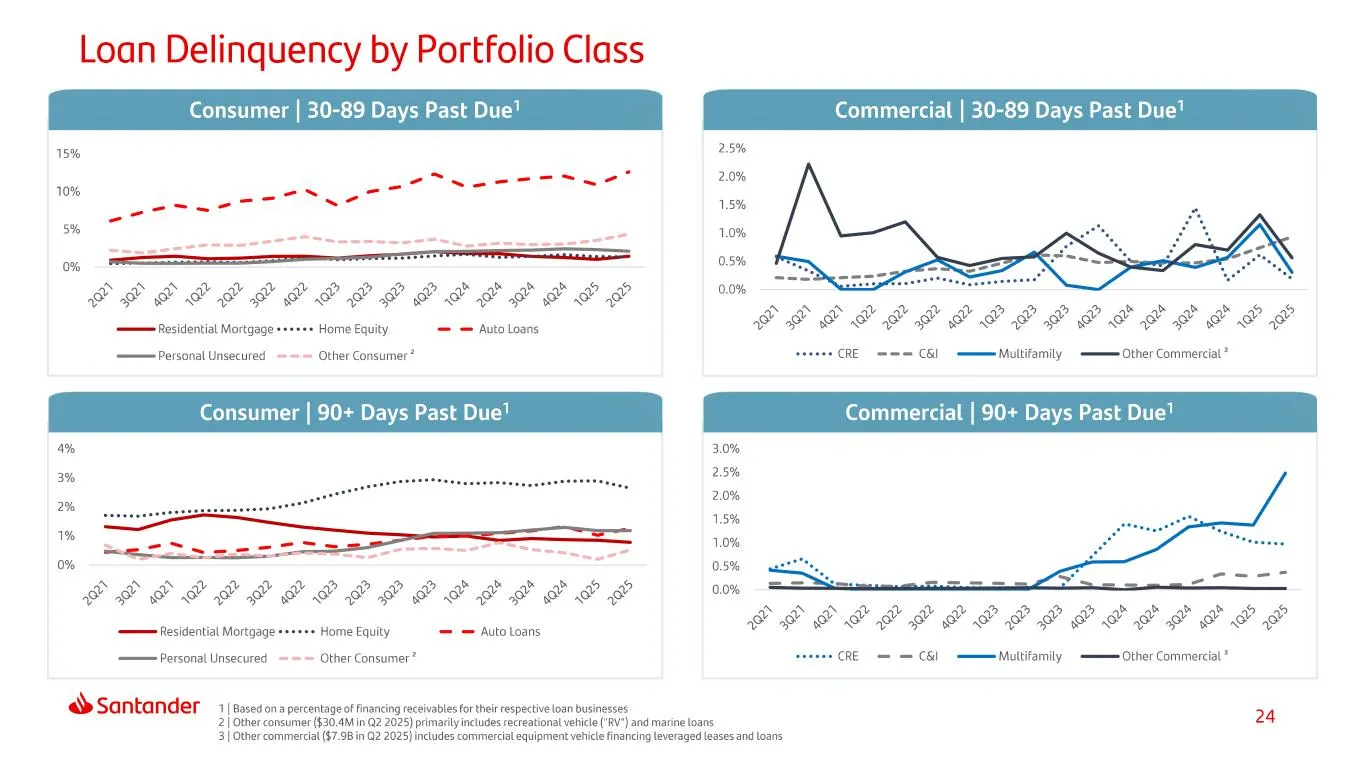
Slide 24: Loan Delinquency by Portfolio Class
Loan Delinquency by Portfolio Class Consumer | 30-89 Days Past Due’ Commercial | 30-89 Days Past Due’ ie 2.5% 2.0% 10% 15% 5% 1.0% «& 0.5% SD DM DP DS PP PPP PP DP oO 0.0% $ SMM SD SM PP PS Pio PP SP SS SA A SS SSS Residential Mortgage +++++ Home Equity = = Auto Loans —— Personal Unsecured === Other
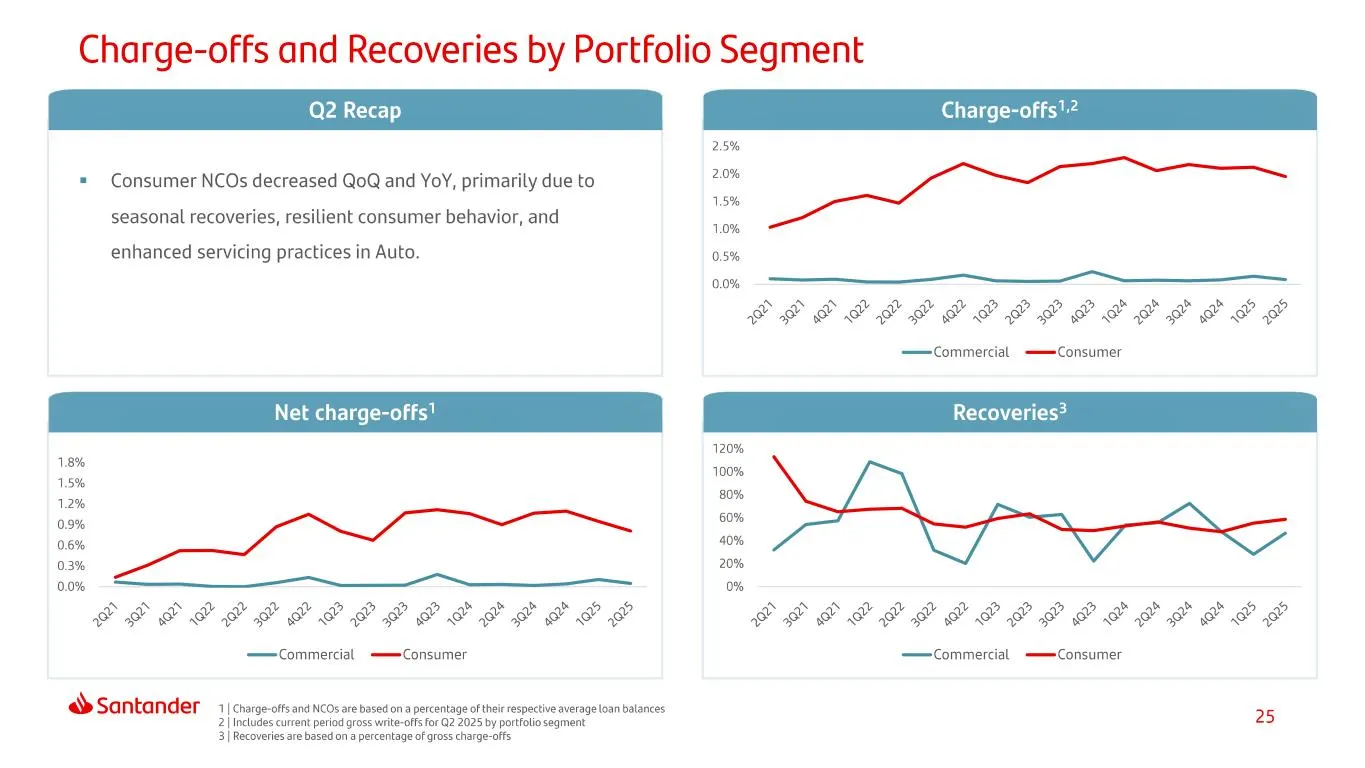
Slide 25: Charge-offs and Recoveries by Portfolio Segment
Charge-offs and Recoveries by Portfolio Segment Q2 Recap Charge-offs' = Consumer NCOs decreased QoQ and YoY, primarily due to seasonal recoveries, resilient consumer behavior, and enhanced servicing practices in Auto. 1.8% 1.5% 12% 0.9% 0.6% 03% 0.0% SDPO M HHO RPO HD OM SS LSP VMI I EEE ES SS SP SS
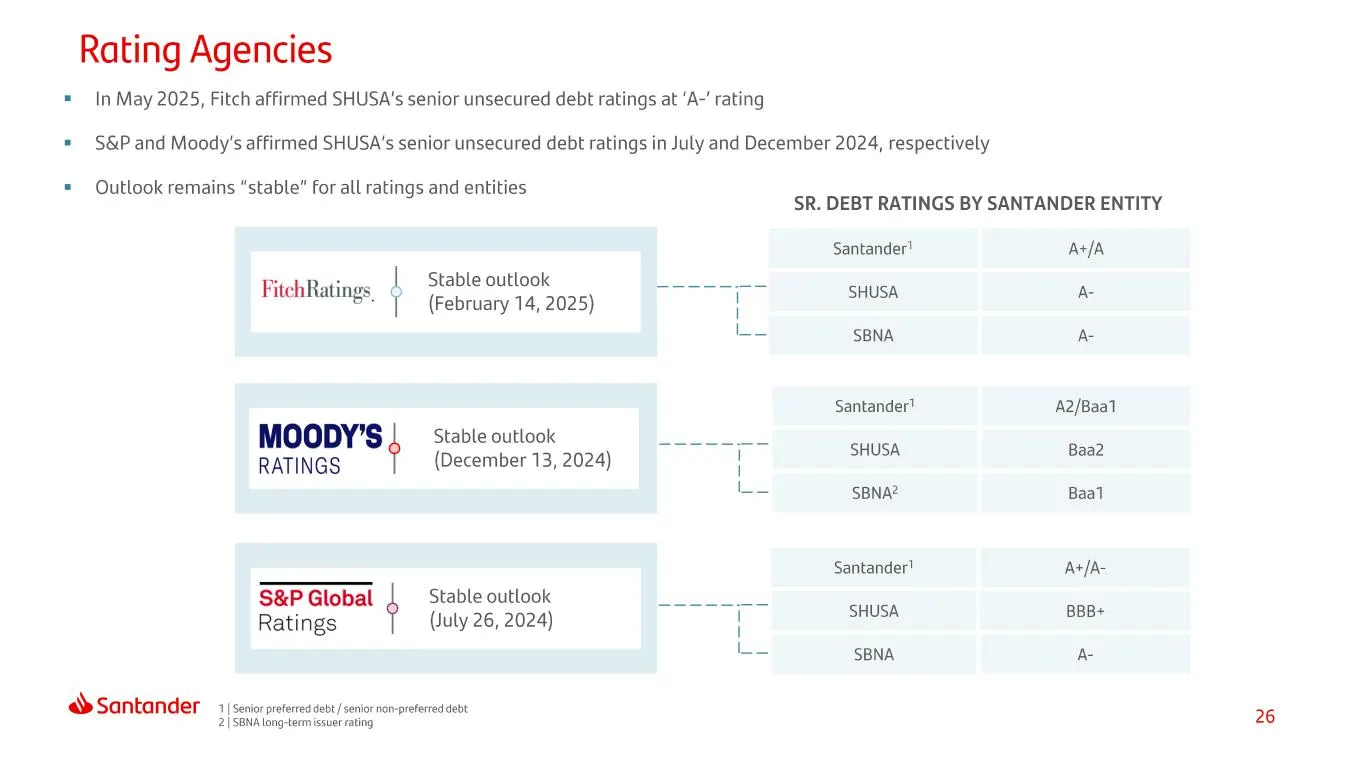
Slide 26: Rating Agencies
Rating Agencies = In May 2025, Fitch affirmed SHUSA's senior unsecured debt ratings at ‘A-' rating = S&P and Moody's affirmed SHUSA’s senior unsecured debt ratings in July and December 2024, respectively * Outlook remains “stable” for all ratings and entities FitchRatings, « MOODY'S RATINGS S&P Glob
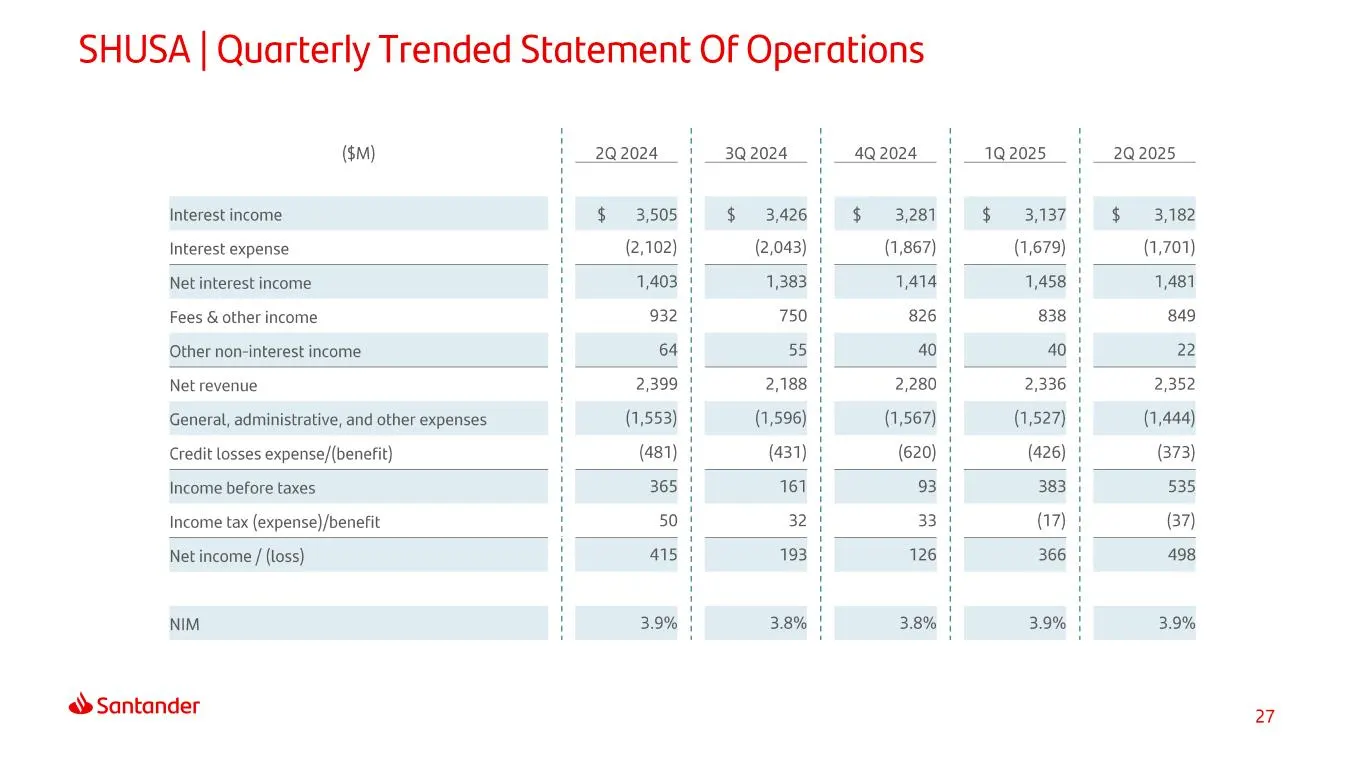
Slide 27: SHUSA | Quarterly Trended Statement Of Operations
SHUSA | Quarterly Trended Statement Of Operations ($m) 20.2024 3Q.2024 4Q 2024 1Q 2025 2@ 2025 Interest income ' § 3505! $ 3426! $ 3281! $ 3137! $ 3,182 Interest expense | (2,102) (2,043) (1,867) | (1,679) (1,701) Net interest income ' 1,403 | 7,383 | 1414 | 1,458 | 7,481 Fees & other income 932 750
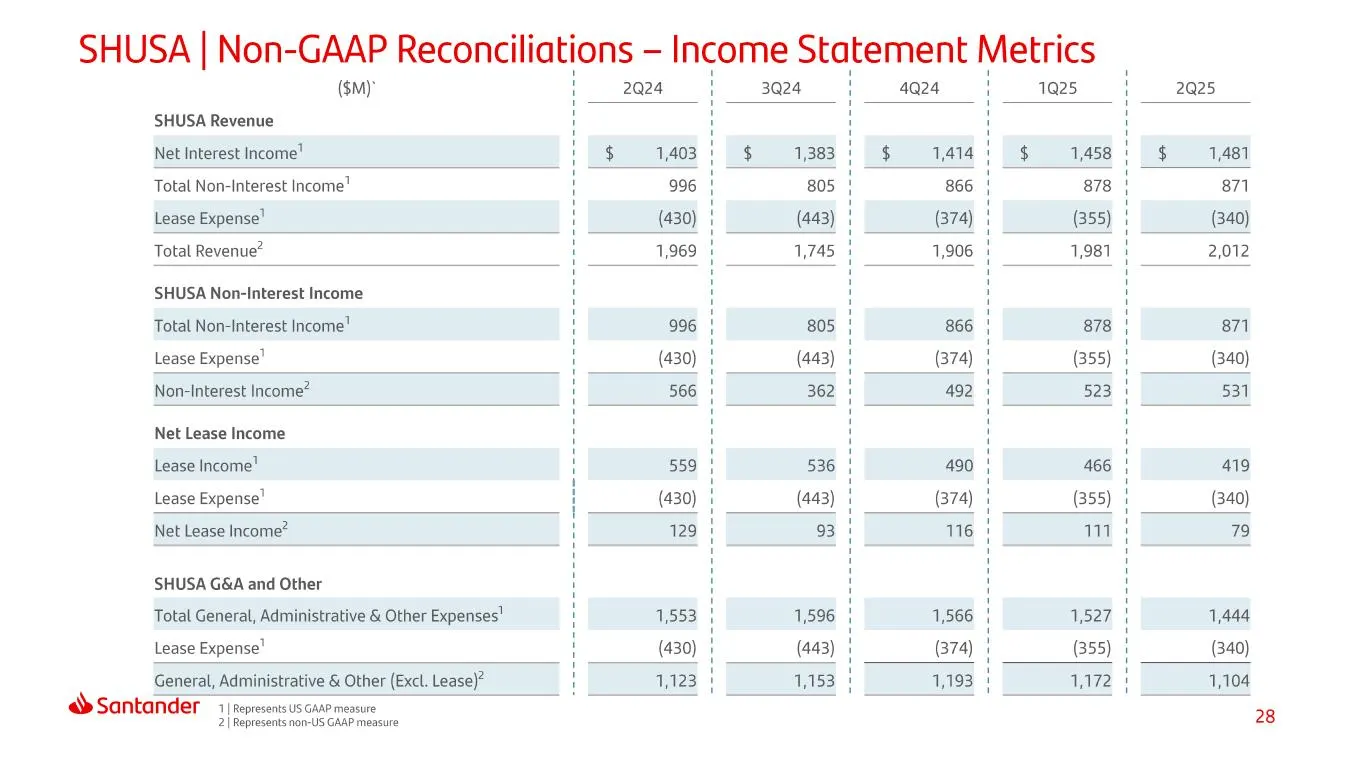
Slide 28: SHUSA | Non-GAAP Reconciliations
SHUSA | Non-GAAP Reconciliations — Income Statement Metrics ($m)° H 2Q24 ' 4Q24 ' 1Q25 ' 2Q25 SHUSA Revenue Net Interest Income! ' $1403! $ $1414 | 1,458 | 1,481 Total Non-Interest Income! ' 996 | 866 | 878 | 871 lease Expense (430) | (374) | (355) | (340) Total Revenue” ' 1,969 } 1,906 | 1,981 2,01
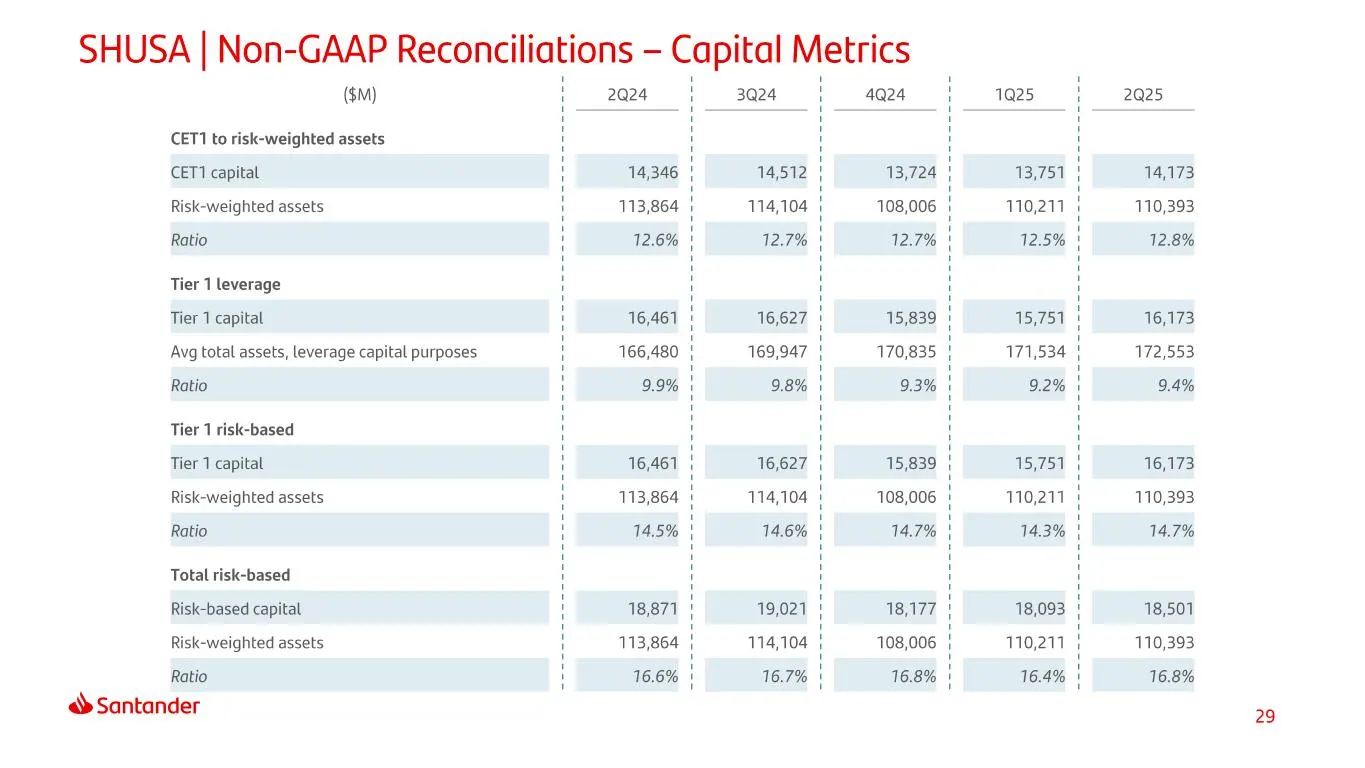
Slide 29: SHUSA | Non-GAAP Reconciliations - Capital Metrics
SHUSA | Non-GAAP Reconciliations - (sm) CET1 to risk-weighted assets CET1 capital Risk-weighted assets Ratio Tier 1 leverage Tier 1 capital Avg total assets, leverage capital purposes Ratio Tier 1 risk-based Tier 1 capital Risk-weighted assets Ratio Total risk-based Risk-based capital Risk-weighted
Slide 30: Thank You.
Thank You. Our purpose is to help people and businesses prosper. Our culture is based on believing that everything we do should be: Simple Personal Fair. «Santander Dow Jones Sustainability Indices In Coaboration with RabecoSAM « FTSE4Good
Source: SEC EDGAR · 8-K filed Aug 15, 2025
More decks from Santander Holdings USA Inc
 Debt Investor Presentation (August 2026)30 slides · Aug 12, 2026
 Debt Investor Presentation (August 2026)30 slides · Aug 12, 2026
 Debt Investor Presentation (June 2026)29 slides · Jun 12, 2026
 Debt Investor Presentation (June 2026)29 slides · Jun 12, 2026
 Debt Investor Presentation (March 2026)36 slides · Mar 6, 2026
 Debt Investor Presentation (March 2026)36 slides · Mar 6, 2026