Heartland Financial USA — Q4 2021 Earnings Presentation
48 slides from Heartland Financial USA's earnings presentation, Jan 31, 2022
Slide 1: 4th Quarter 2021 Financials
FITLE Strength. Insight. Growth. 4th Quarter 2021 Financials
Slide 2: Safe Harbor
Safe Harbor 2 This release (including any information incorporated herein by reference), and future oral and written statements of HTLF and its management, may contain forward- looking statements within the meaning of Section 27A of the Securities Act of 1933, as amended, and Section 21E of the Secu
Slide 3: Corporate Profile
3 Corporate Profile
Slide 4: Company Overview – Fiscal 4Q 2021 Financial Highlights
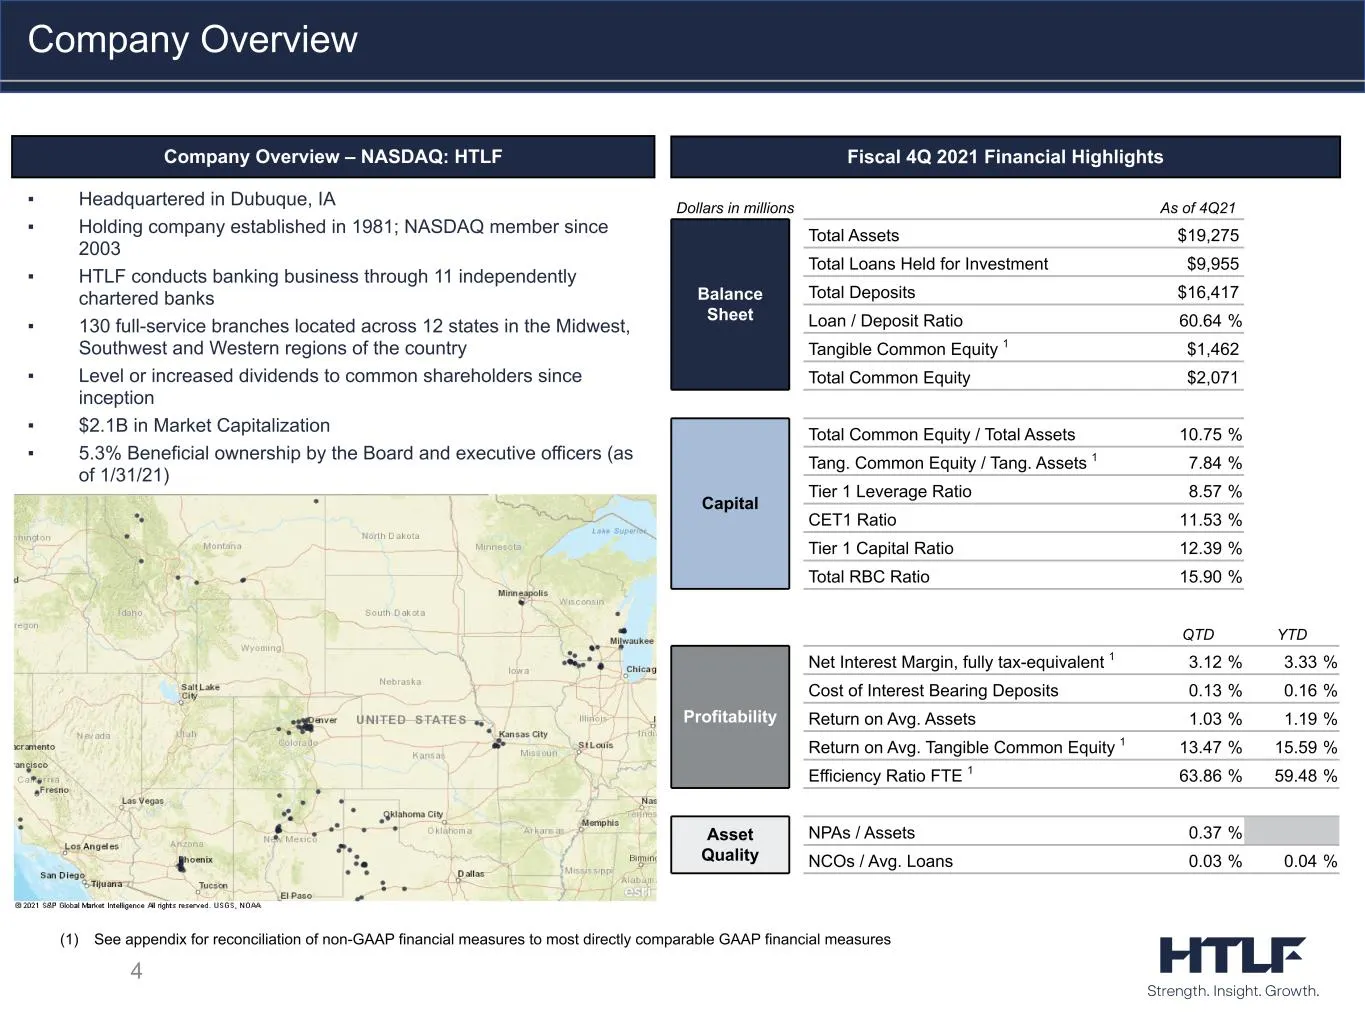
4 Company Overview – NASDAQ: HTLF Fiscal 4Q 2021 Financial Highlights ▪ Headquartered in Dubuque, IA ▪ Holding company established in 1981; NASDAQ member since 2003 ▪ HTLF conducts banking business through 11 independently chartered banks ▪ 130 full-service branches located across 12 states in the M
Slide 5: Strength. Insight. Growth.
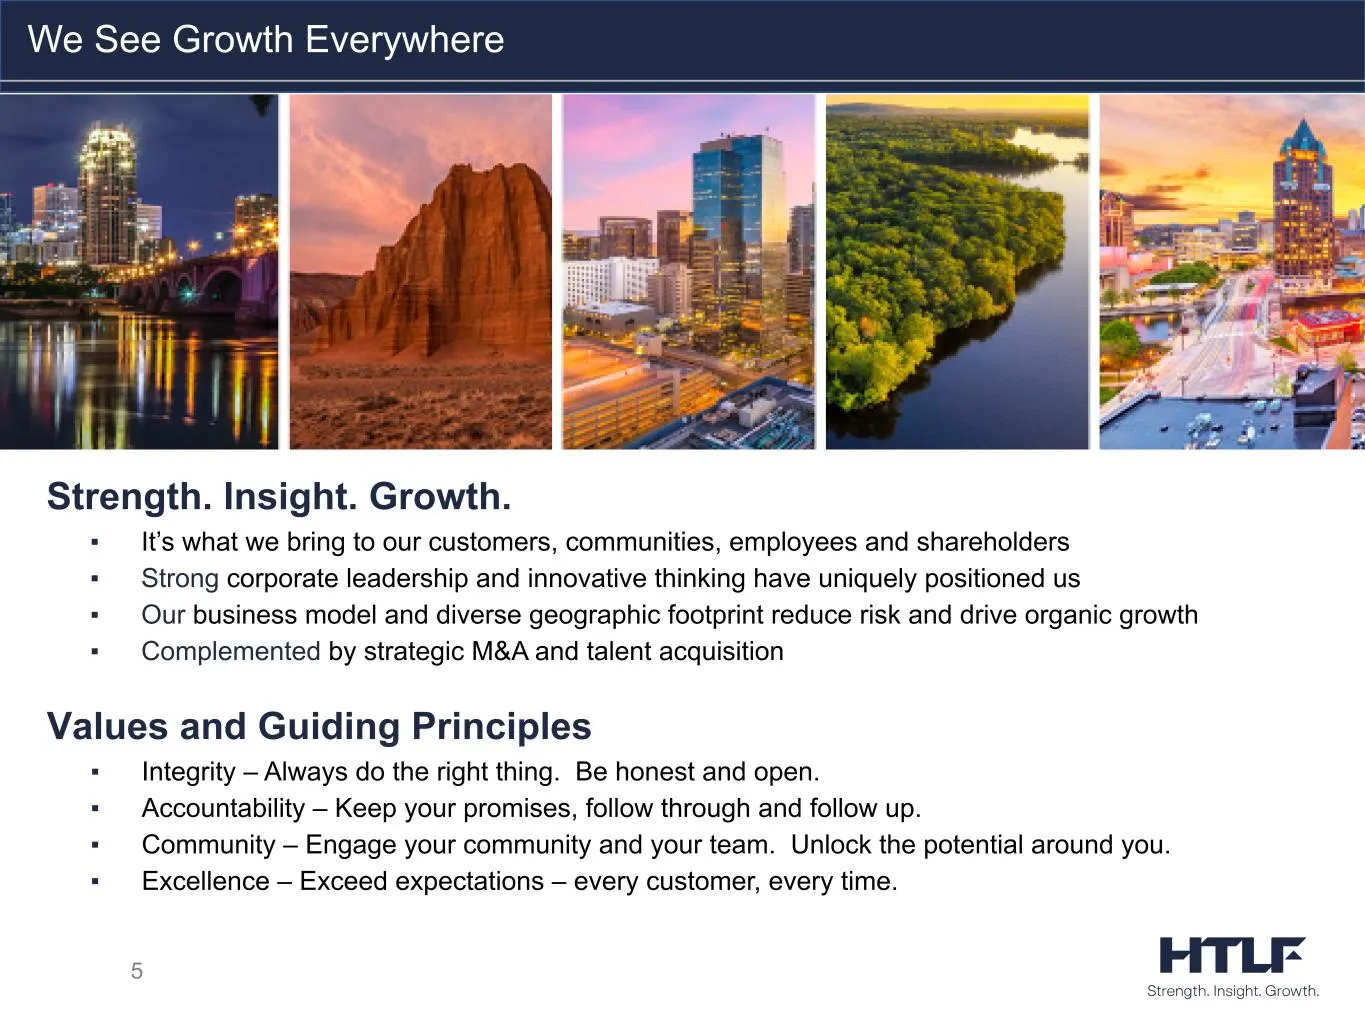
Strength. Insight. Growth. ▪ It’s what we bring to our customers, communities, employees and shareholders ▪ Strong corporate leadership and innovative thinking have uniquely positioned us ▪ Our business model and diverse geographic footprint reduce risk and drive organic growth ▪ Complemented by str
Slide 6: Commercial-focused local banking with the scale to compete at any level
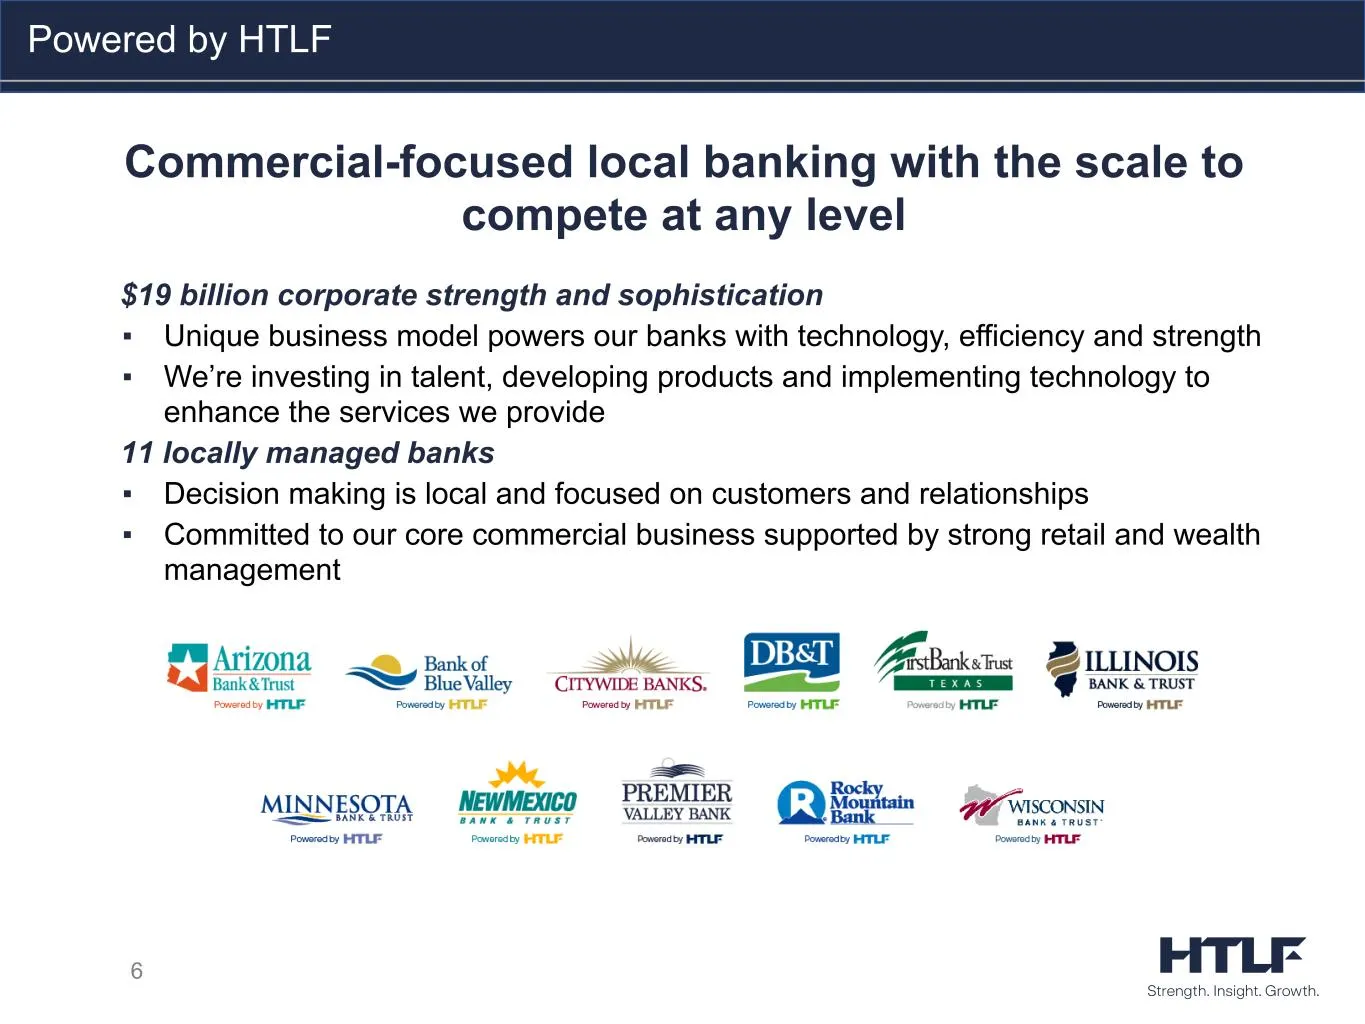
Commercial-focused local banking with the scale to compete at any level $19 billion corporate strength and sophistication ▪ Unique business model powers our banks with technology, efficiency and strength ▪ We’re investing in talent, developing products and implementing technology to enhance the serv
Slide 7: Corporate Structure
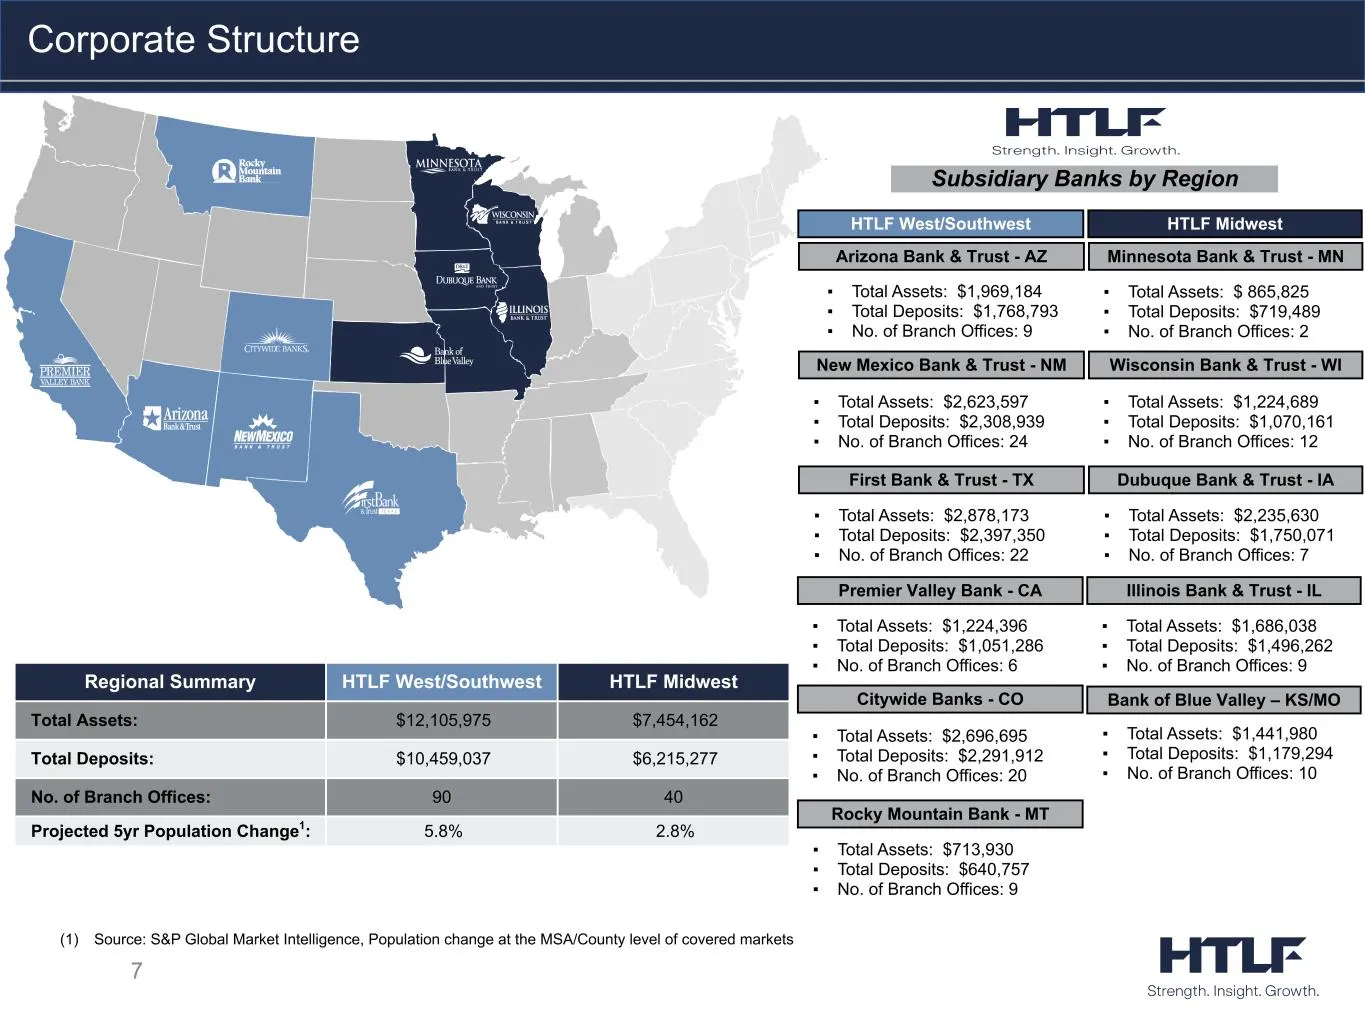
7 Corporate Structure Subsidiary Banks by Region Bank of Blue Valley – KS/MO (1) Source: S&P Global Market Intelligence, Population change at the MSA/County level of covered markets Illinois Bank & Trust - IL Minnesota Bank & Trust - MN HTLF Midwest ▪ Total Assets: $1,686,038 ▪ Total Deposits: $1,49
Slide 8: HTLF West/Southwest Major MSA Coverage
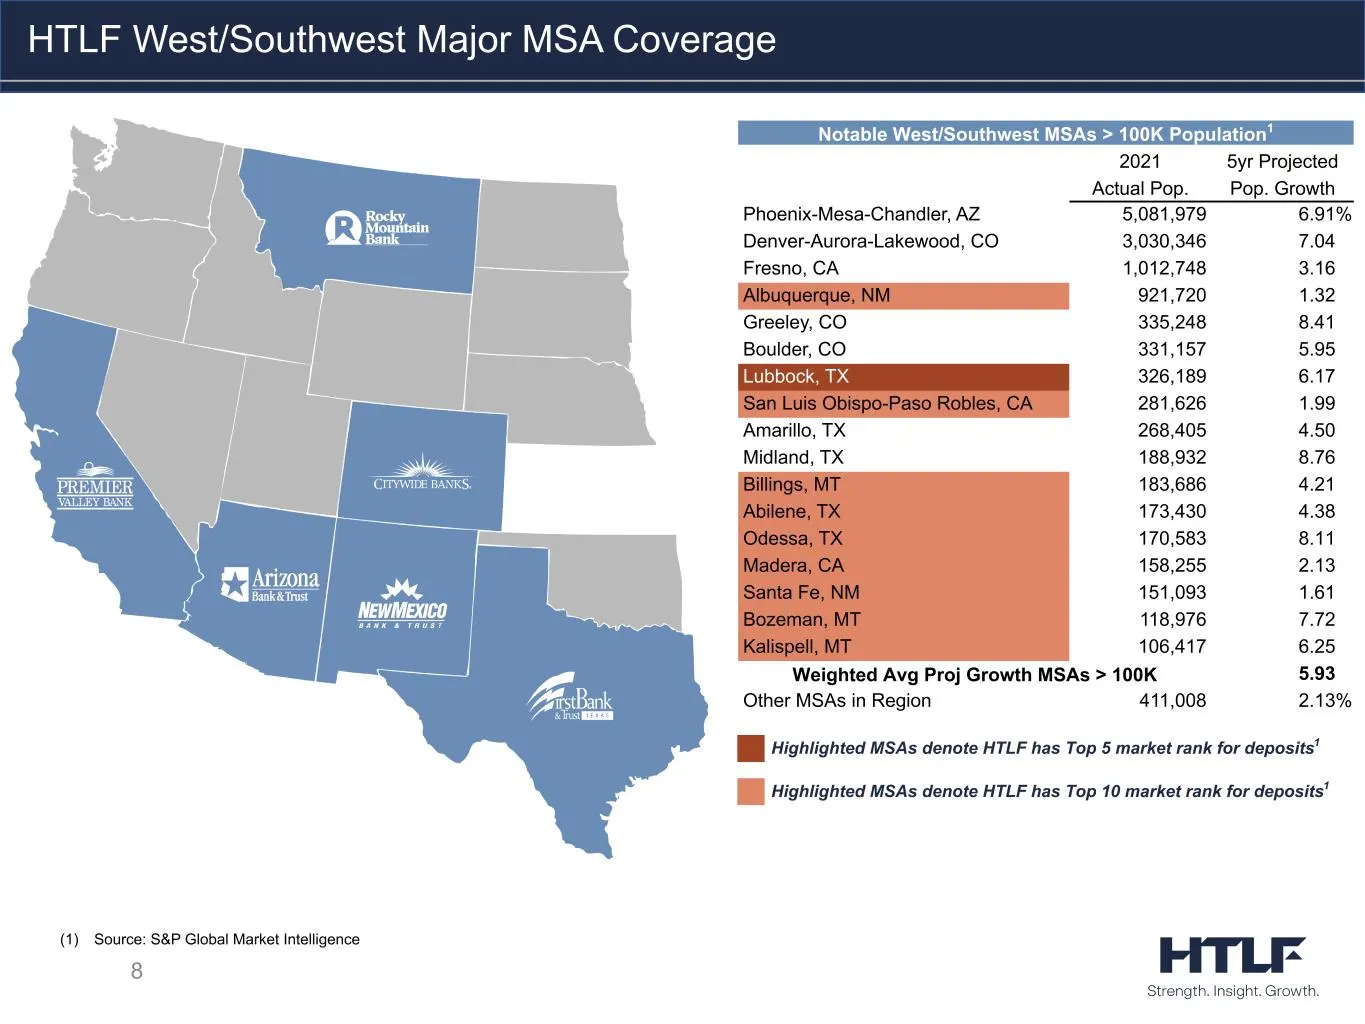
8 HTLF West/Southwest Major MSA Coverage (1) Source: S&P Global Market Intelligence Highlighted MSAs denote HTLF has Top 10 market rank for deposits1 Highlighted MSAs denote HTLF has Top 5 market rank for deposits1 Notable West/Southwest MSAs > 100K Population1 2021 5yr Projected Actual Pop. Pop. Gr
Slide 9: HTLF Midwest Major MSA Coverage
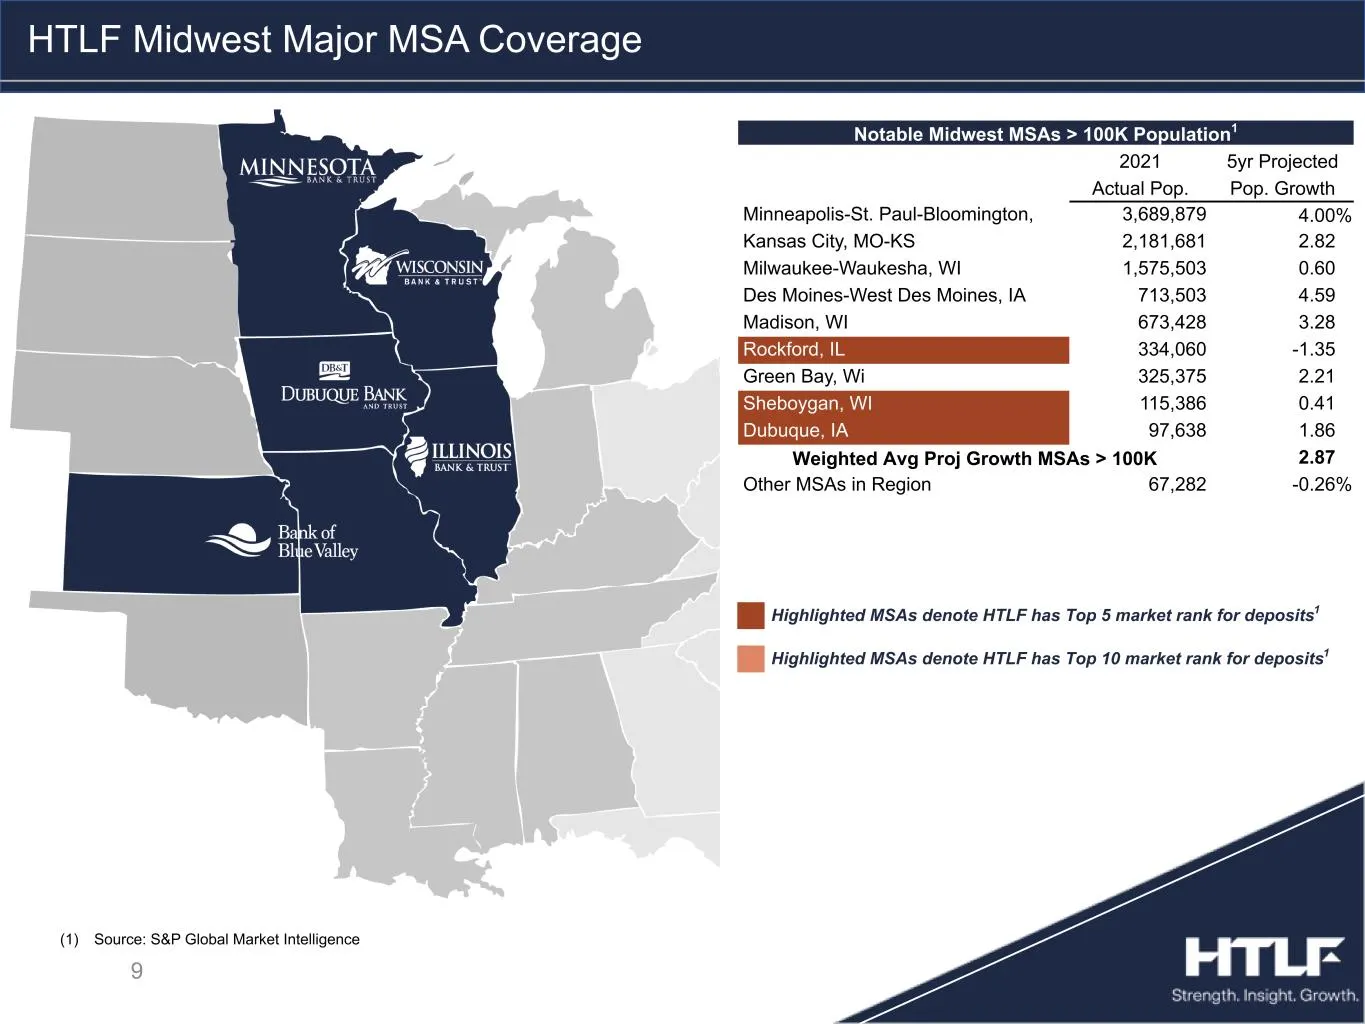
9 HTLF Midwest Major MSA Coverage (1) Source: S&P Global Market Intelligence Highlighted MSAs denote HTLF has Top 10 market rank for deposits1 Highlighted MSAs denote HTLF has Top 5 market rank for deposits1 Notable Midwest MSAs > 100K Population1 2021 5yr Projected Actual Pop. Pop. Growth Minneapol
Slide 10: HTLF Excellence Recognition
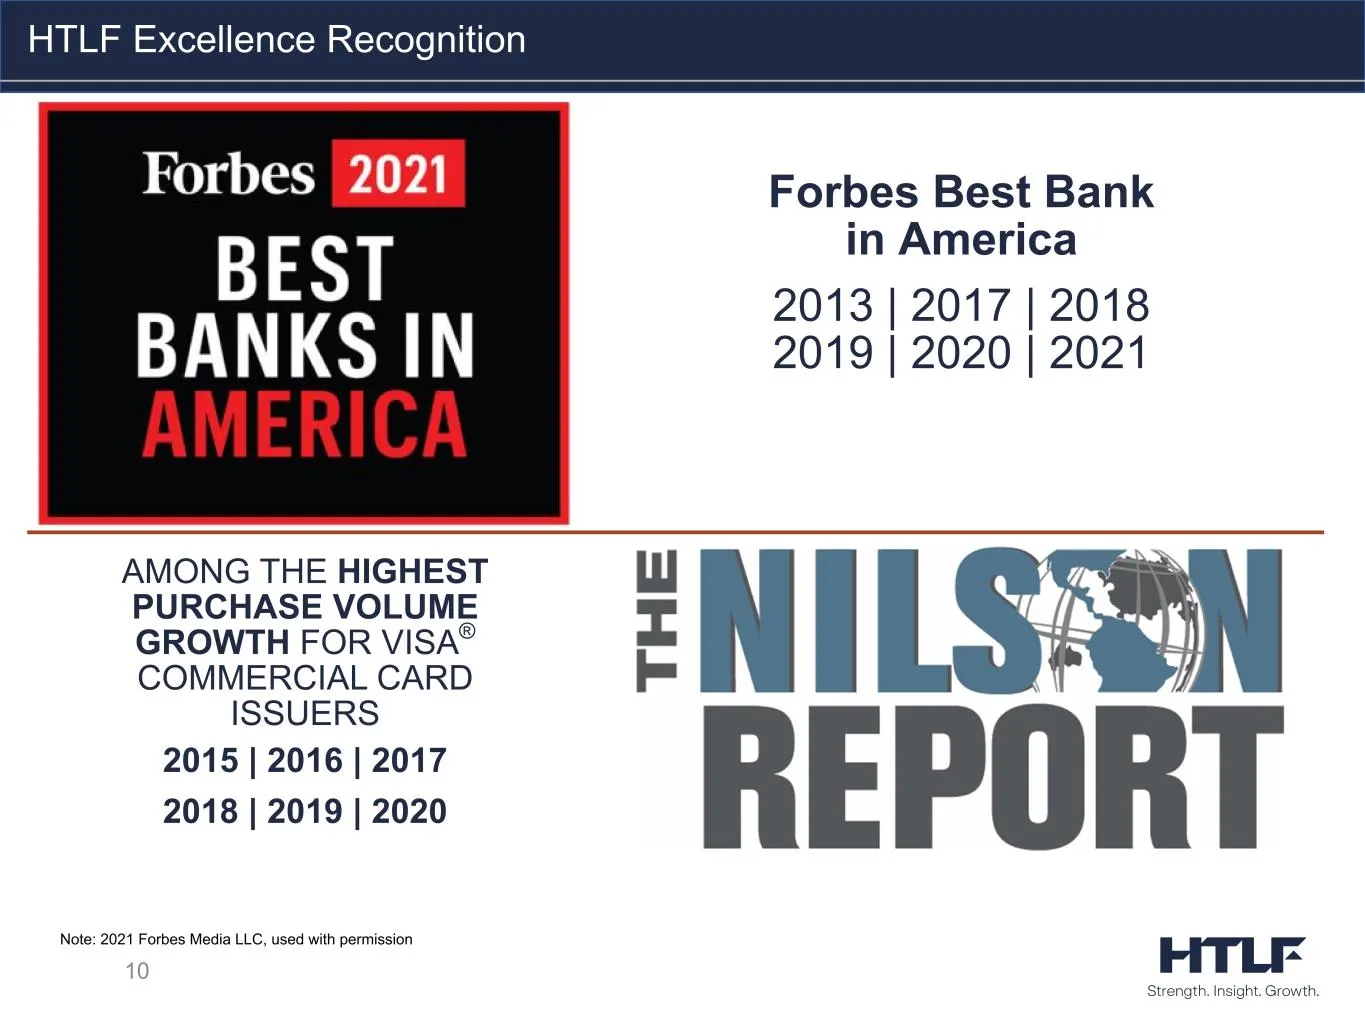
10 HTLF Excellence Recognition Note: 2021 Forbes Media LLC, used with permission AMONG THE HIGHEST PURCHASE VOLUME GROWTH FOR VISA® COMMERCIAL CARD ISSUERS 2015 | 2016 | 2017 2018 | 2019 | 2020 Forbes Best Bank in America 2013 | 2017 | 2018 2019 | 2020 | 2021
Slide 11: A Steadfast Commitment to Growth
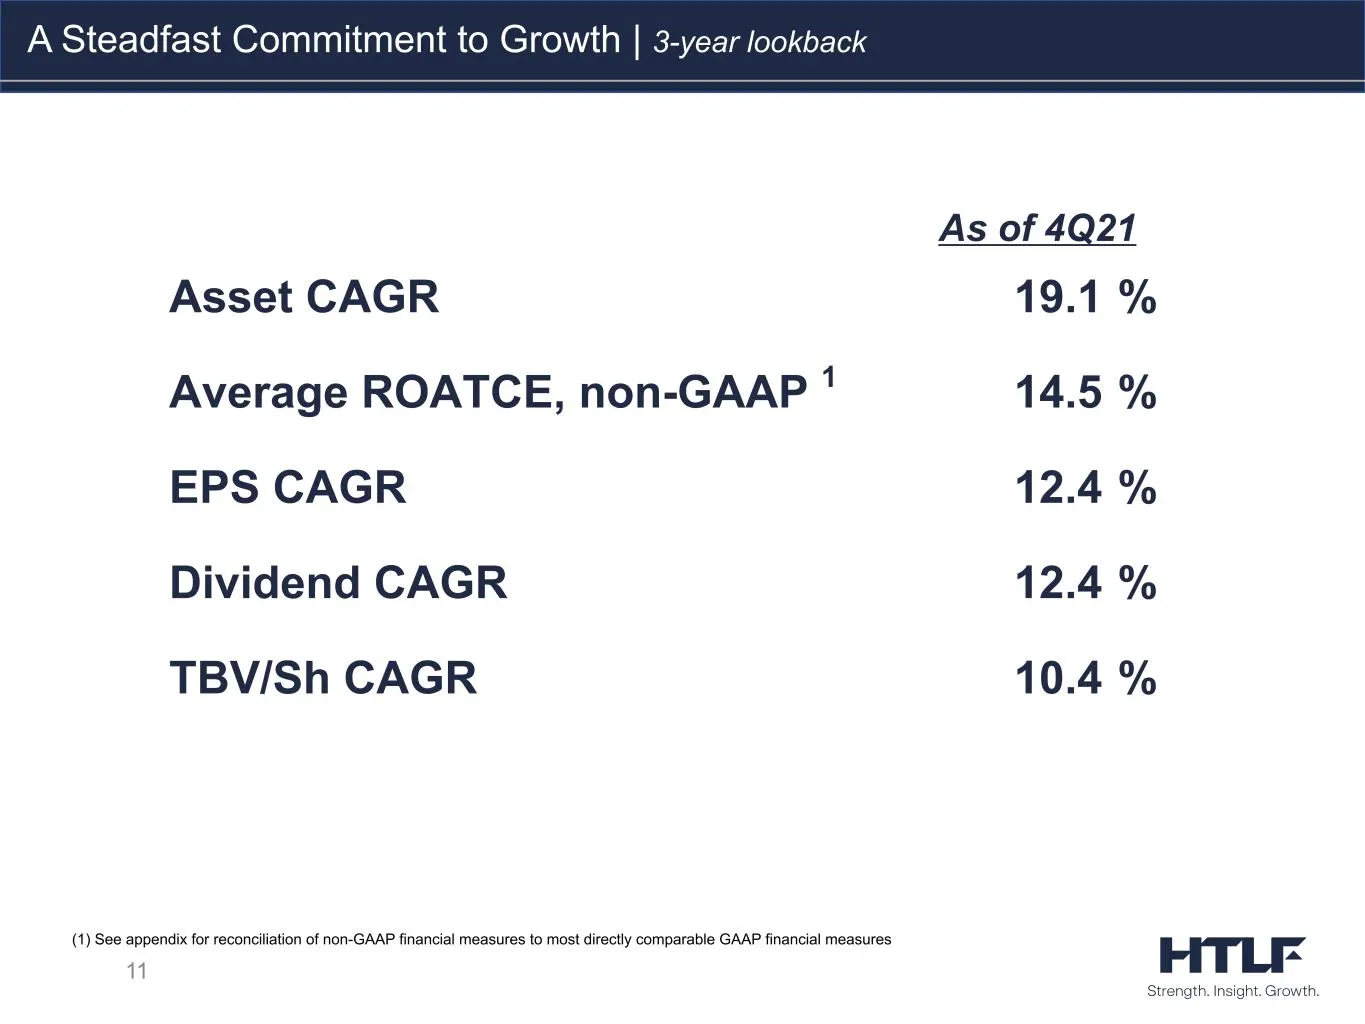
11 A Steadfast Commitment to Growth | 3-year lookback (1) See appendix for reconciliation of non-GAAP financial measures to most directly comparable GAAP financial measures As of 4Q21 Asset CAGR 19.1 % Average ROATCE, non-GAAP 1 14.5 % EPS CAGR 12.4 % Dividend CAGR 12.4 % TBV/Sh CAGR 10.4 %
Slide 12: Broad footprint enhances profitable growth strategies and diversifies risk
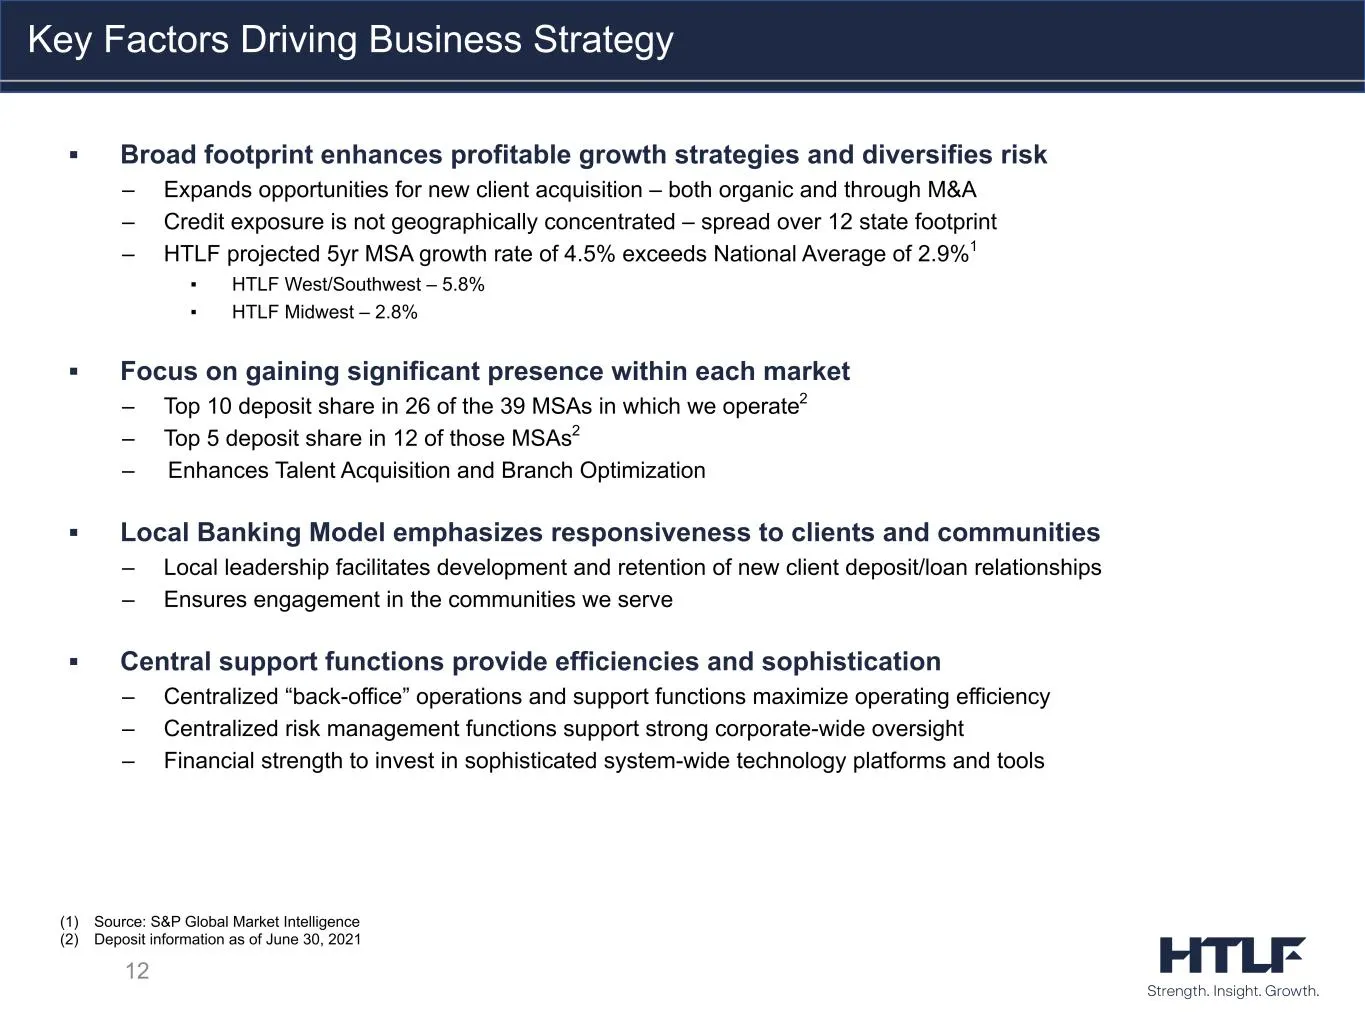
▪ Broad footprint enhances profitable growth strategies and diversifies risk – Expands opportunities for new client acquisition – both organic and through M&A – Credit exposure is not geographically concentrated – spread over 12 state footprint – HTLF projected 5yr MSA growth rate of 4.5% exceeds Na
Slide 13: Bank charter consolidation into a Colorado state chartered bank
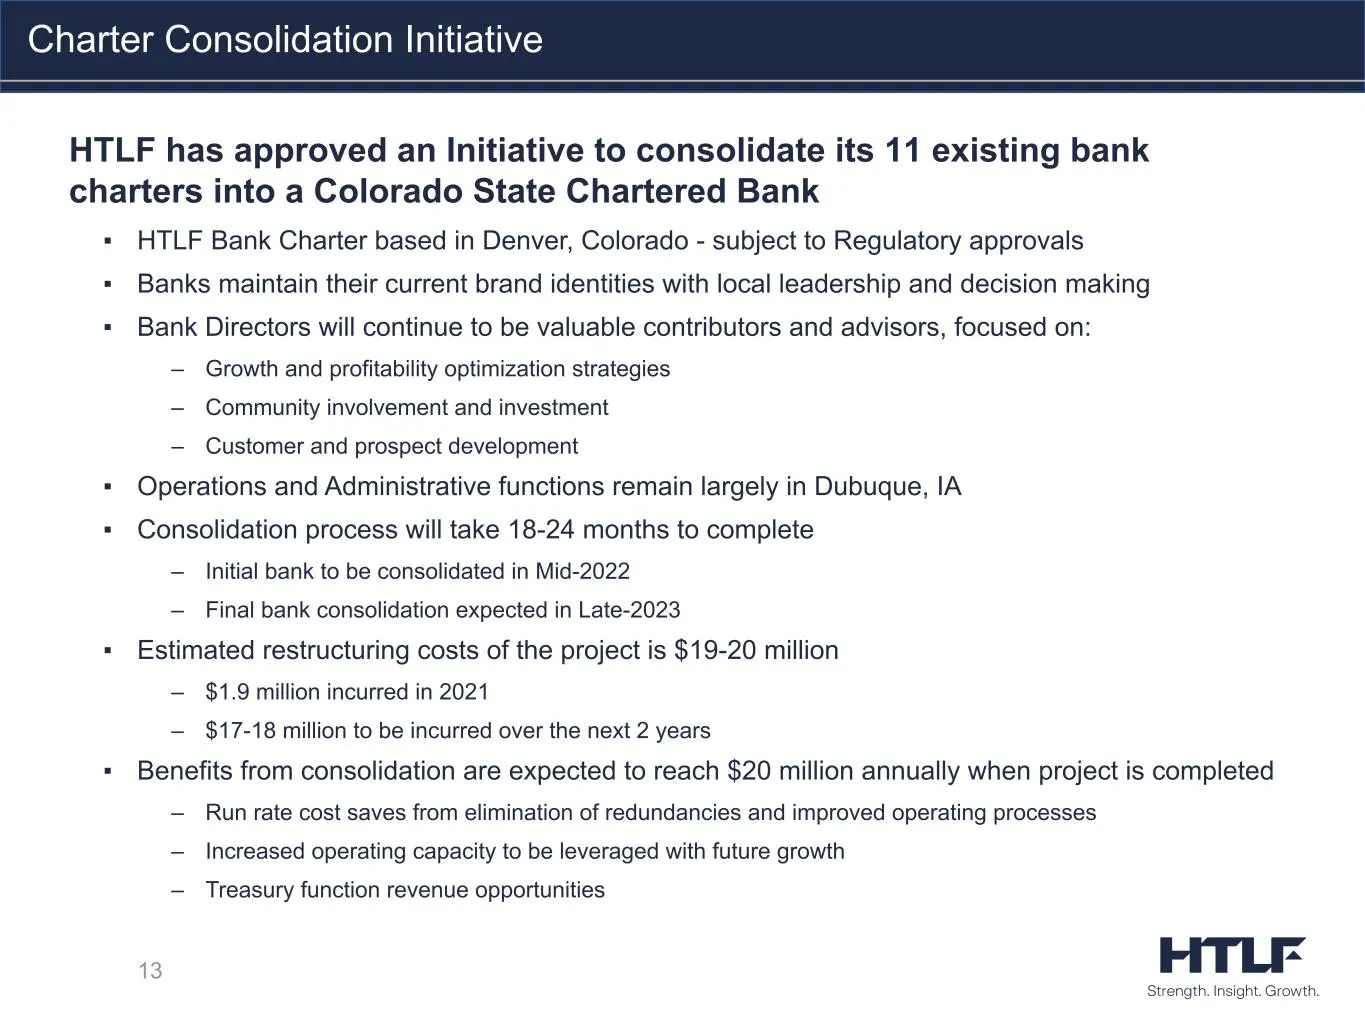
HTLF has approved an Initiative to consolidate its 11 existing bank charters into a Colorado State Chartered Bank ▪ HTLF Bank Charter based in Denver, Colorado - subject to Regulatory approvals ▪ Banks maintain their current brand identities with local leadership and decision making ▪ Bank Directors
Slide 14: Customer experience and omni-channel phased implementations
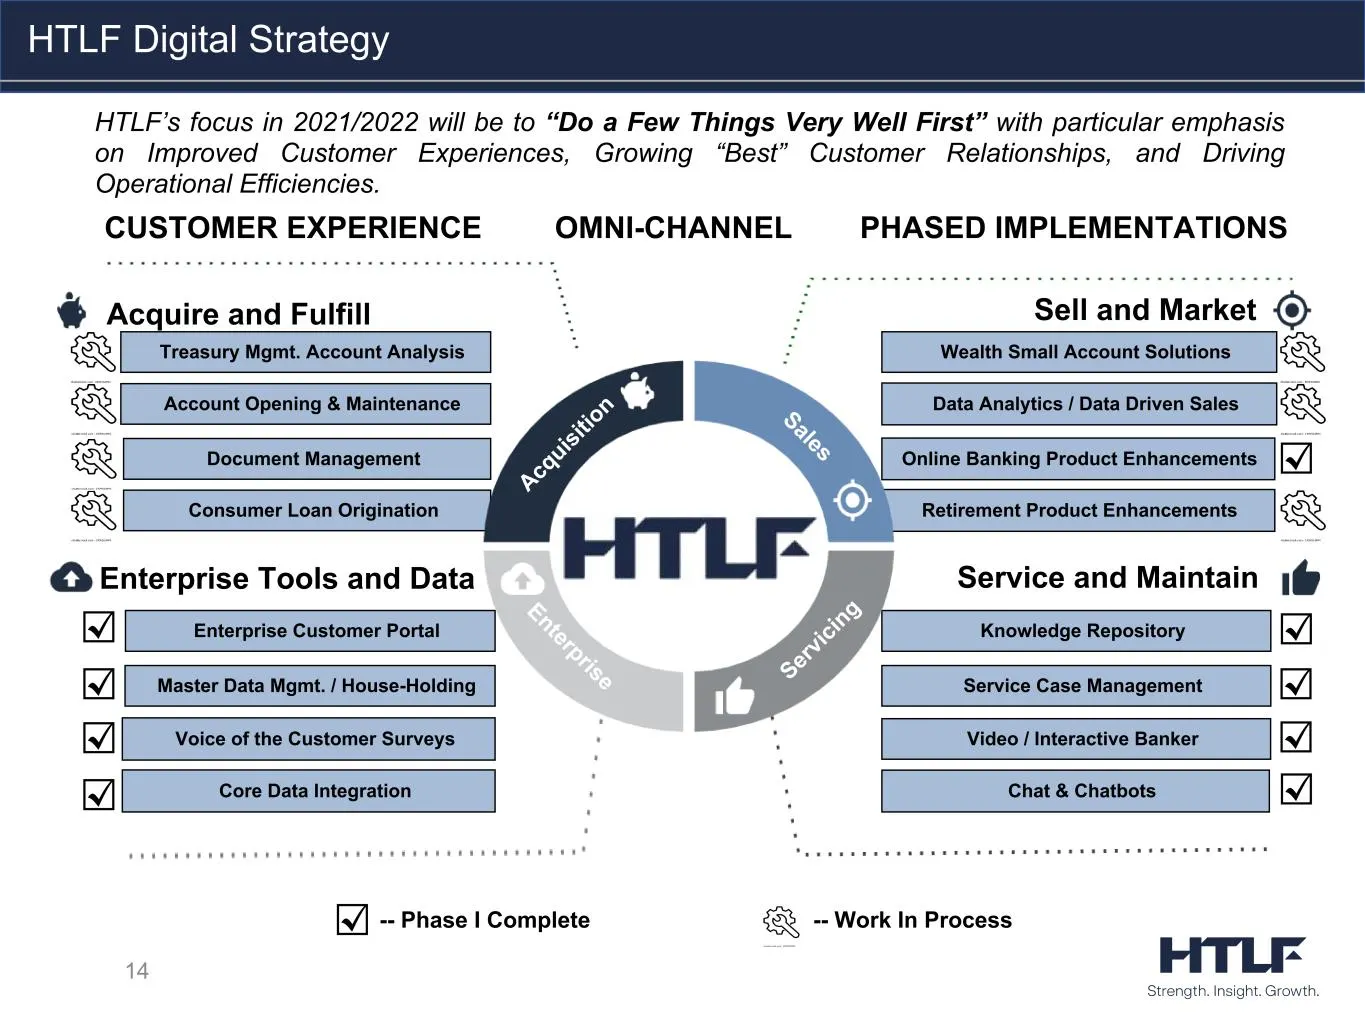
14 Retirement Product Enhancements Online Banking Product Enhancements Deposit Account Opening & Consumer LOS Implementation Options Document Management Consumer Loan Origination Account Opening & Maintenance Enterprise Tools and Data Acquire and Fulfill Sell and Market Service and Maintain Enterpri
Slide 15: Growth Focused | Enhancing Growth Trajectory
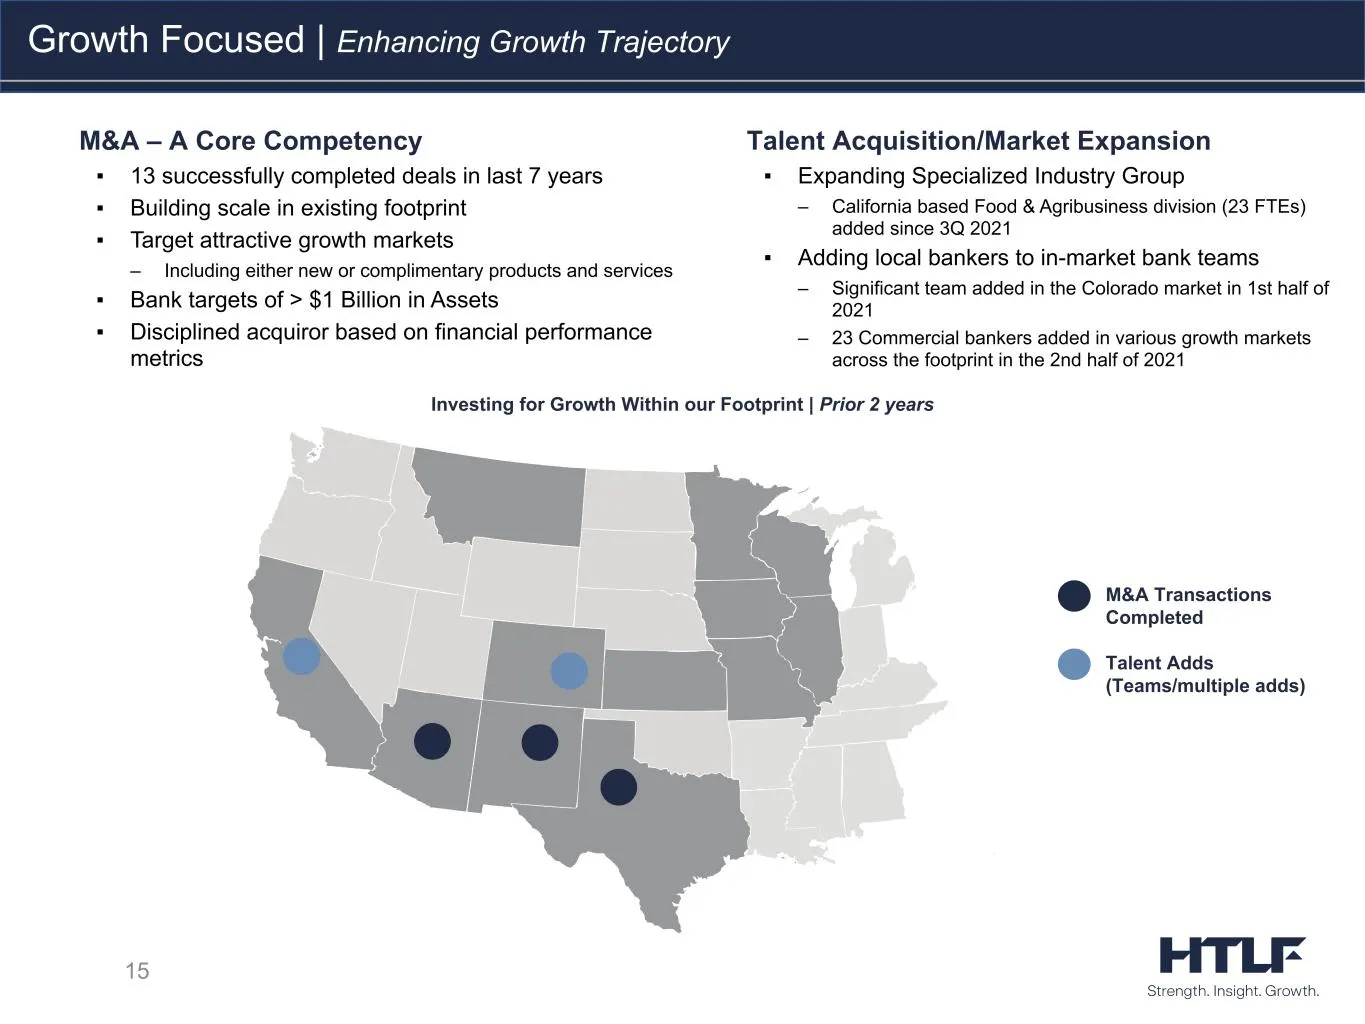
15 Growth Focused | Enhancing Growth Trajectory Talent Acquisition/Market Expansion ▪ Expanding Specialized Industry Group – California based Food & Agribusiness division (23 FTEs) added since 3Q 2021 ▪ Adding local bankers to in-market bank teams – Significant team added in the Colorado market in 1
Slide 16: HTLF Asset and Earnings Growth
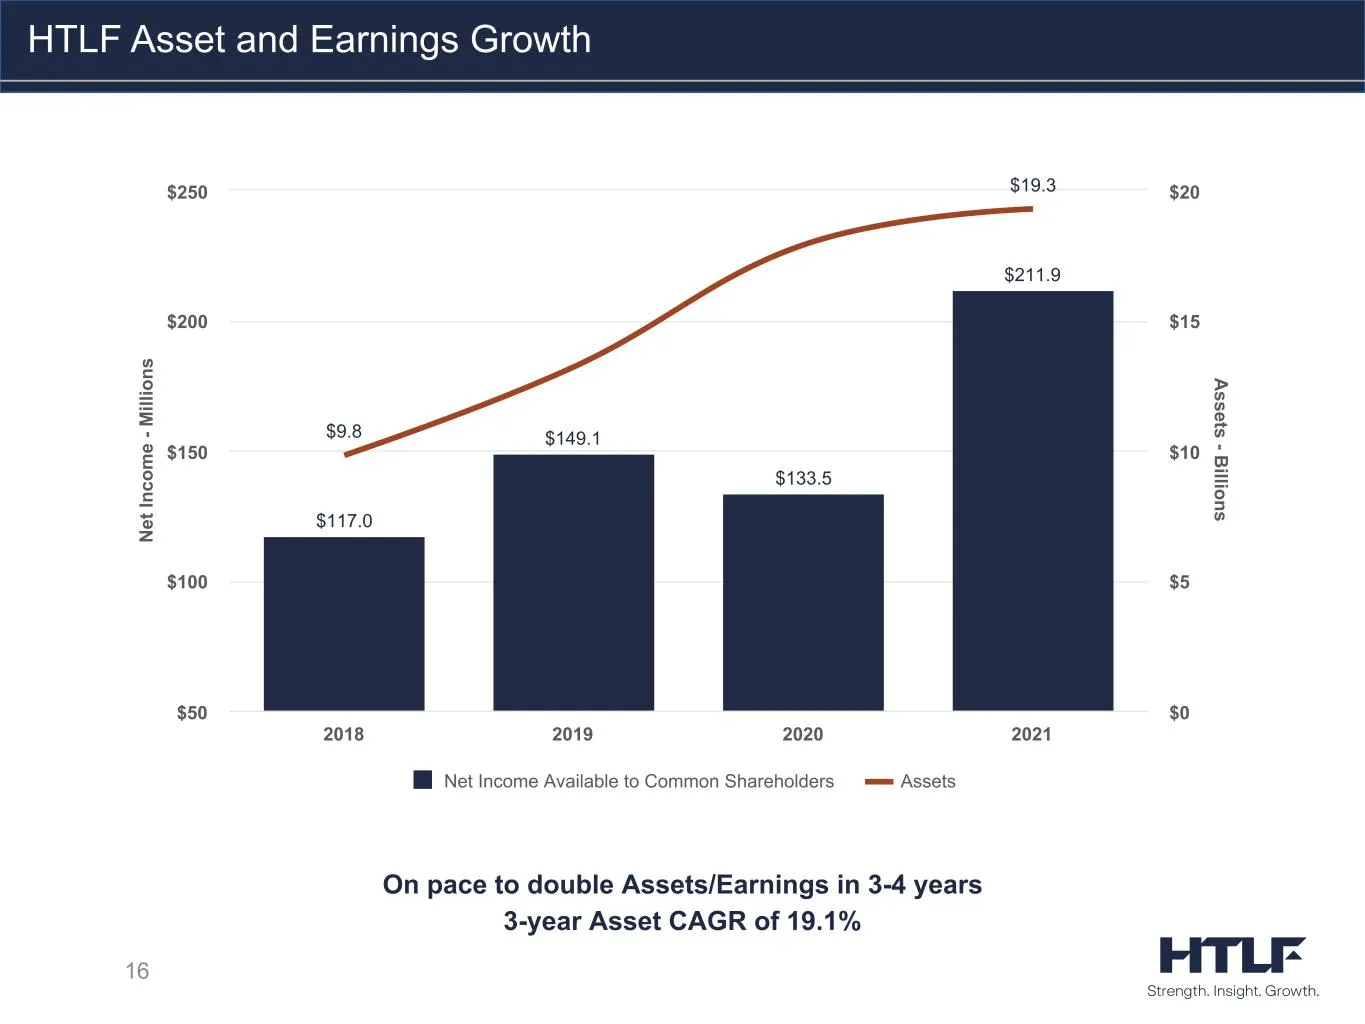
16 HTLF Asset and Earnings Growth On pace to double Assets/Earnings in 3-4 years 3-year Asset CAGR of 19.1% N et In co m e - M ill io ns A ssets - B illions $117.0 $149.1 $133.5 $211.9 $9.8 $19.3 Net Income Available to Common Shareholders Assets 2018 2019 2020 2021 $50 $100 $150 $200 $250 $0 $5 $10
Slide 17: HTLF Diluted EPS and Common Dividends
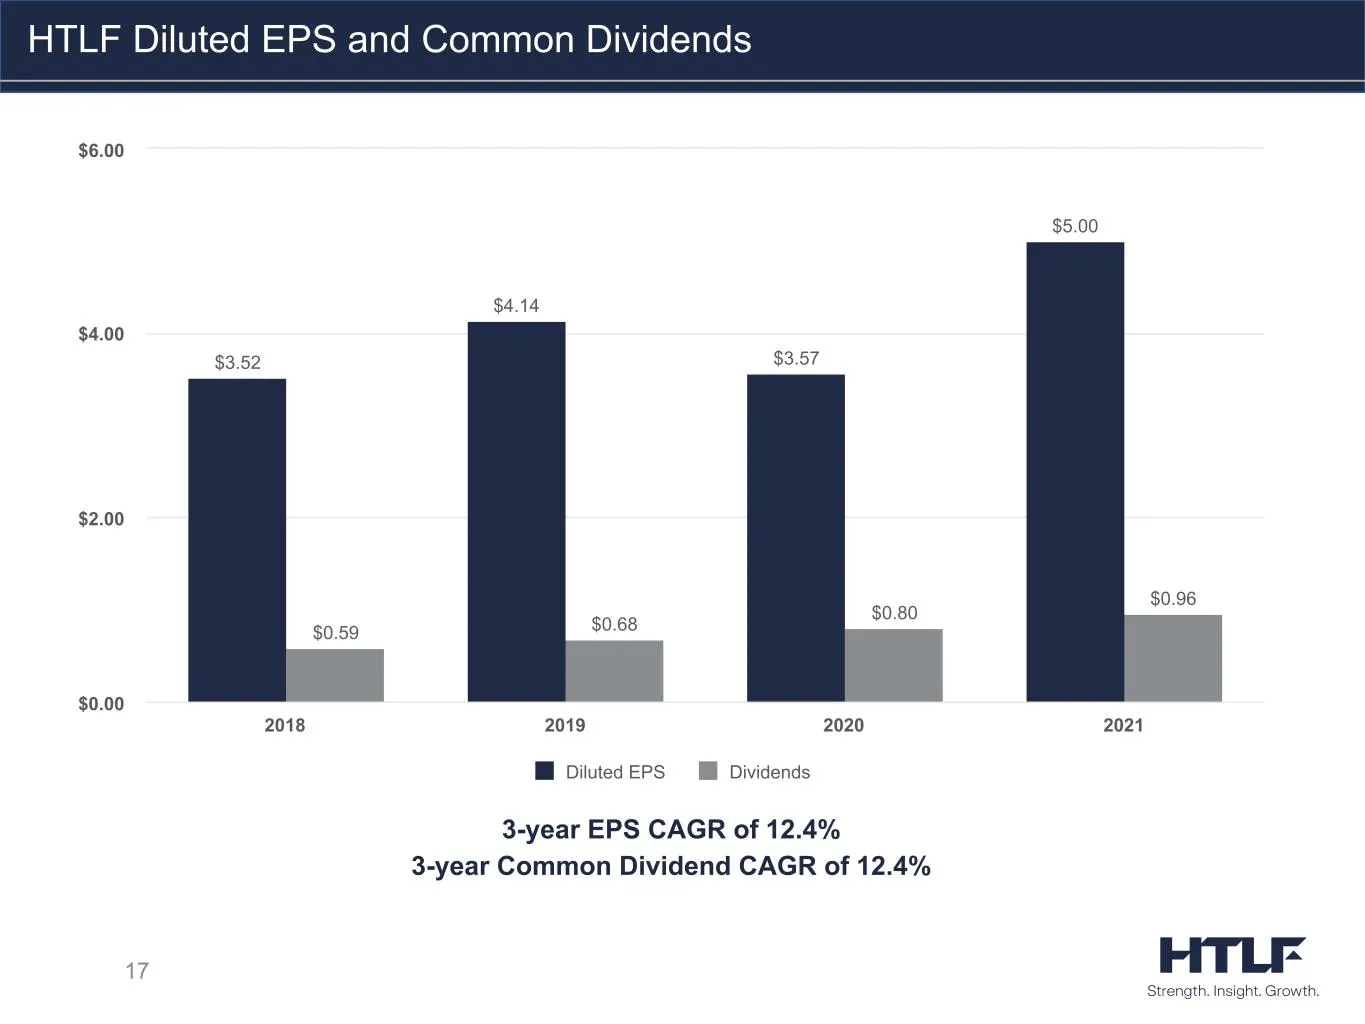
17 HTLF Diluted EPS and Common Dividends 3-year EPS CAGR of 12.4% 3-year Common Dividend CAGR of 12.4% $3.52 $4.14 $3.57 $5.00 $0.59 $0.68 $0.80 $0.96 Diluted EPS Dividends 2018 2019 2020 2021 $0.00 $2.00 $4.00 $6.00
Slide 18: Operating Efficiency | Improving by Leveraging Core Costs and Growth
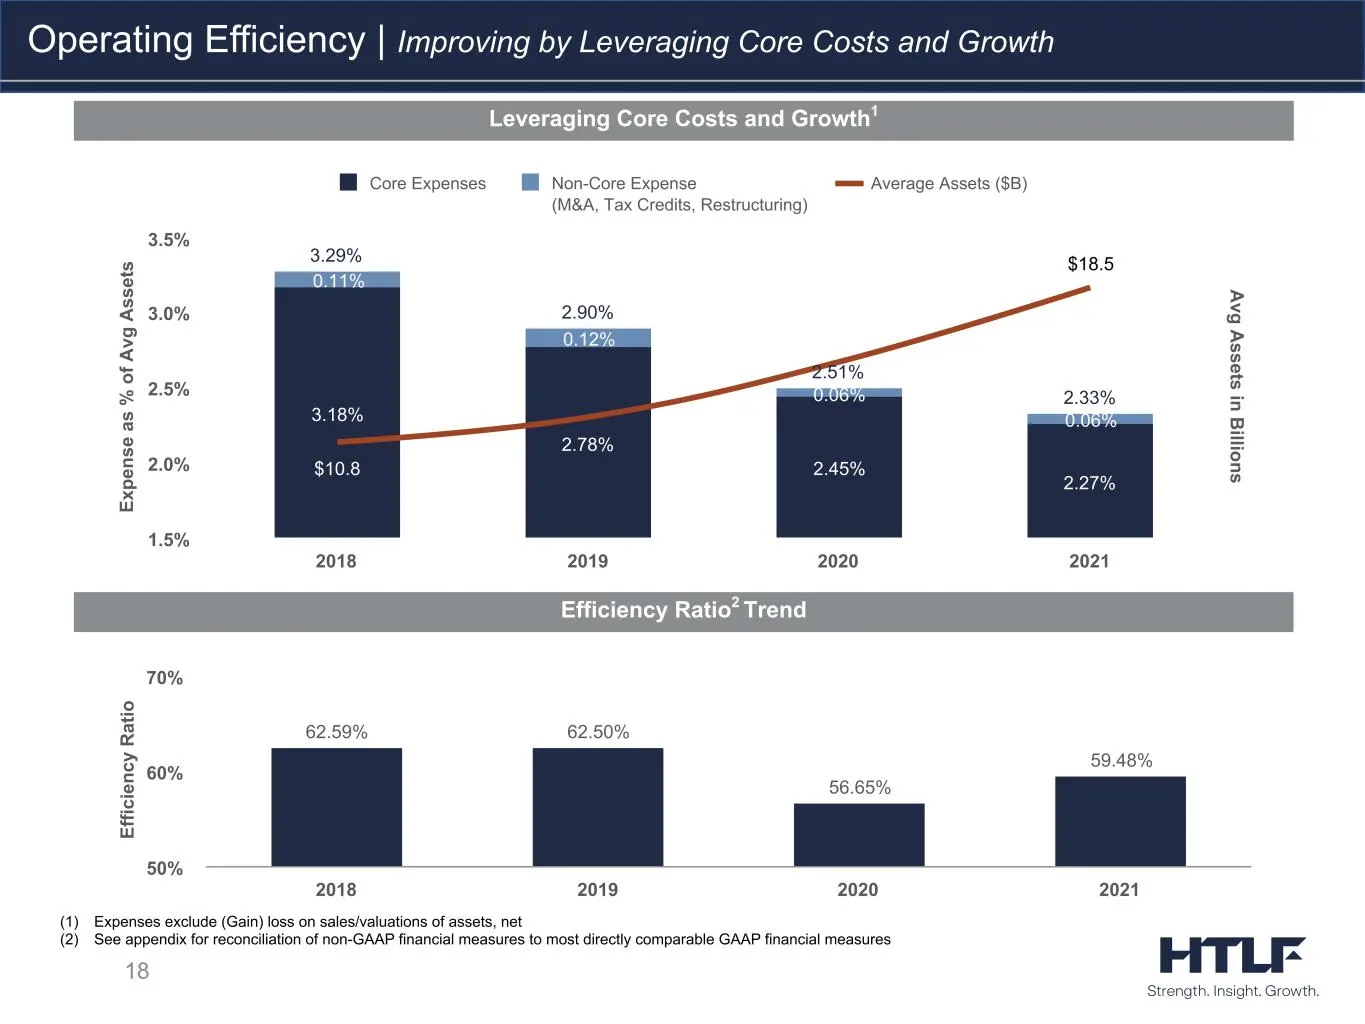
Efficiency Ratio2 Trend 18 Operating Efficiency | Improving by Leveraging Core Costs and Growth Leveraging Core Costs and Growth1 (1) Expenses exclude (Gain) loss on sales/valuations of assets, net (2) See appendix for reconciliation of non-GAAP financial measures to most directly comparable GAAP fi
Slide 19: Financial Summary
19 Financial Summary
Slide 20: Summary Balance Sheet Items
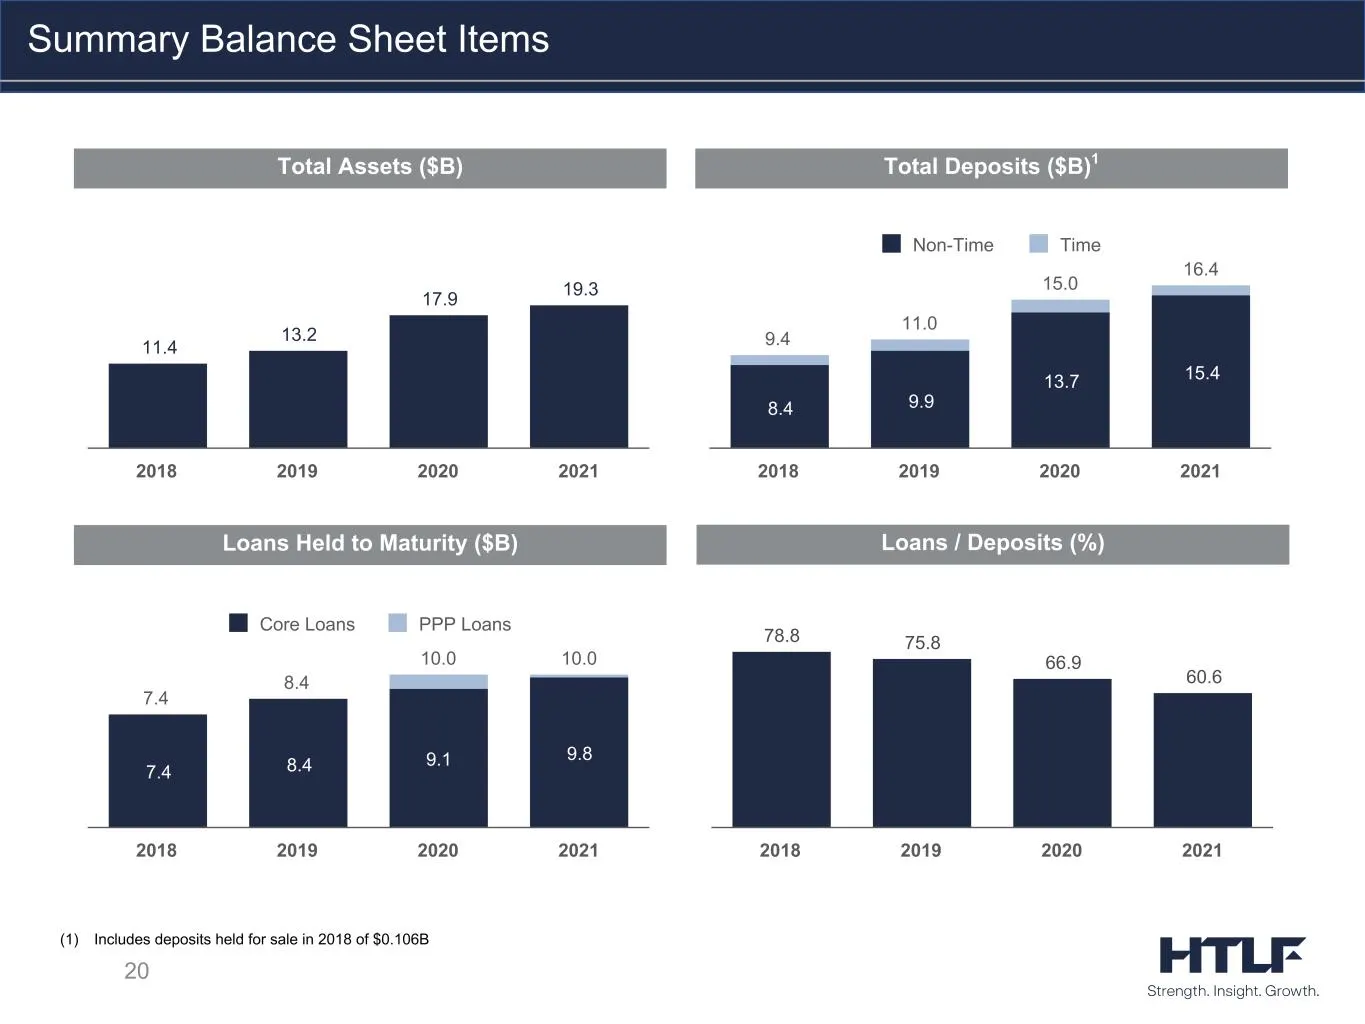
20 Total Assets ($B) Total Deposits ($B)1 Loans Held to Maturity ($B) Loans / Deposits (%) Summary Balance Sheet Items (1) Includes deposits held for sale in 2018 of $0.106B 11.4 13.2 17.9 19.3 2018 2019 2020 2021 9.4 11.0 15.0 16.4 8.4 9.9 13.7 15.4 Non-Time Time 2018 2019 2020 2021 7.4 8.4 10.0 10
Slide 21: Summary Profitability Items
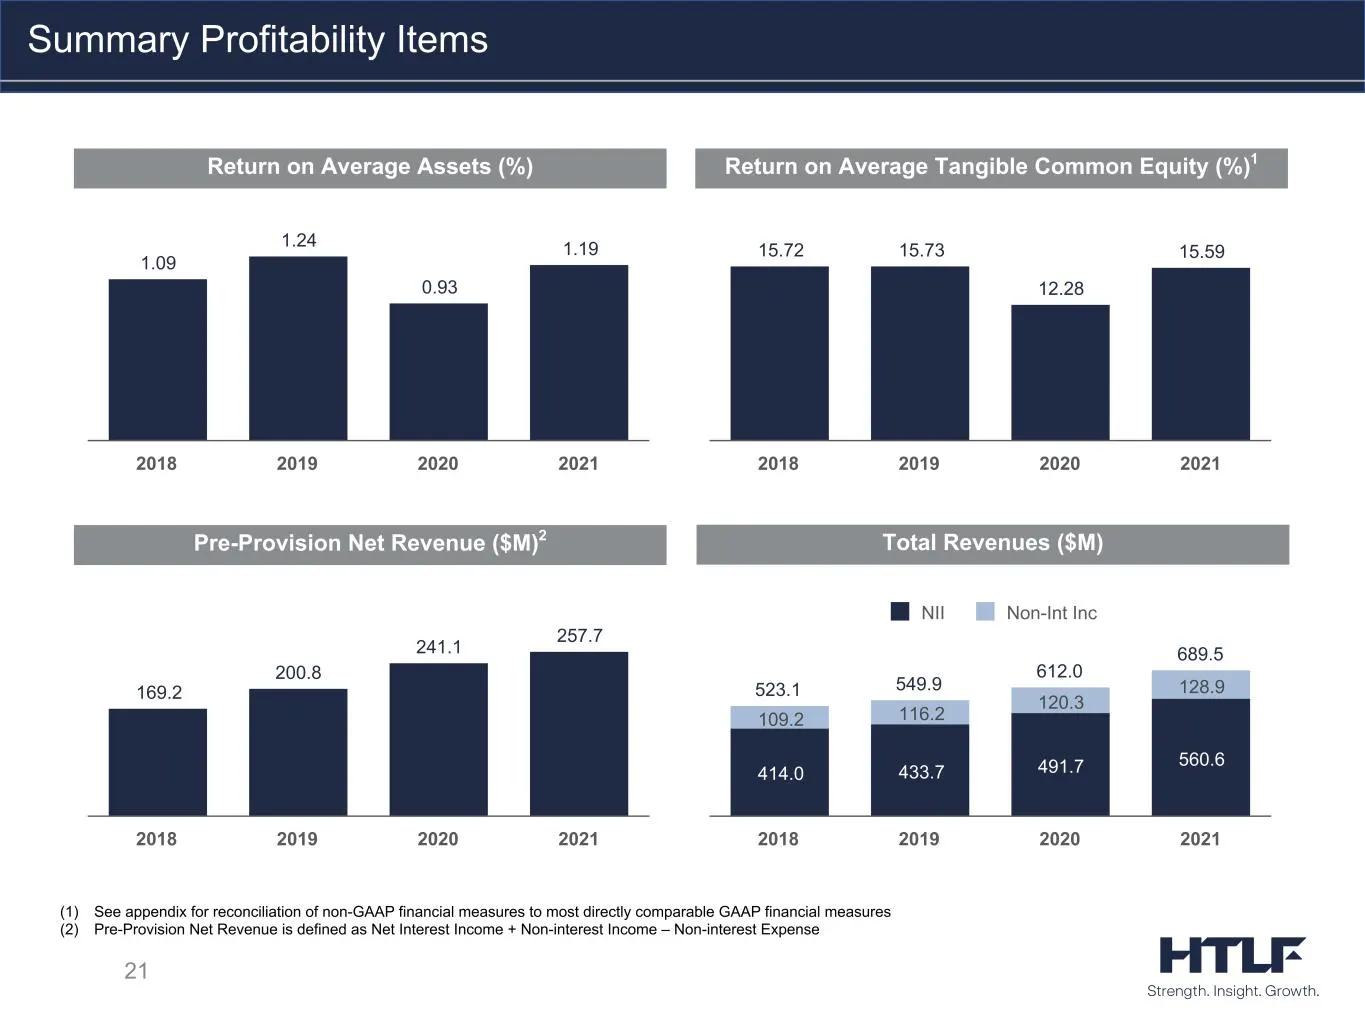
21 Summary Profitability Items (1) See appendix for reconciliation of non-GAAP financial measures to most directly comparable GAAP financial measures (2) Pre-Provision Net Revenue is defined as Net Interest Income + Non-interest Income – Non-interest Expense Return on Average Assets (%) Return on Av
Slide 22: Net Interest Margin (non-GAAP) Breakdown
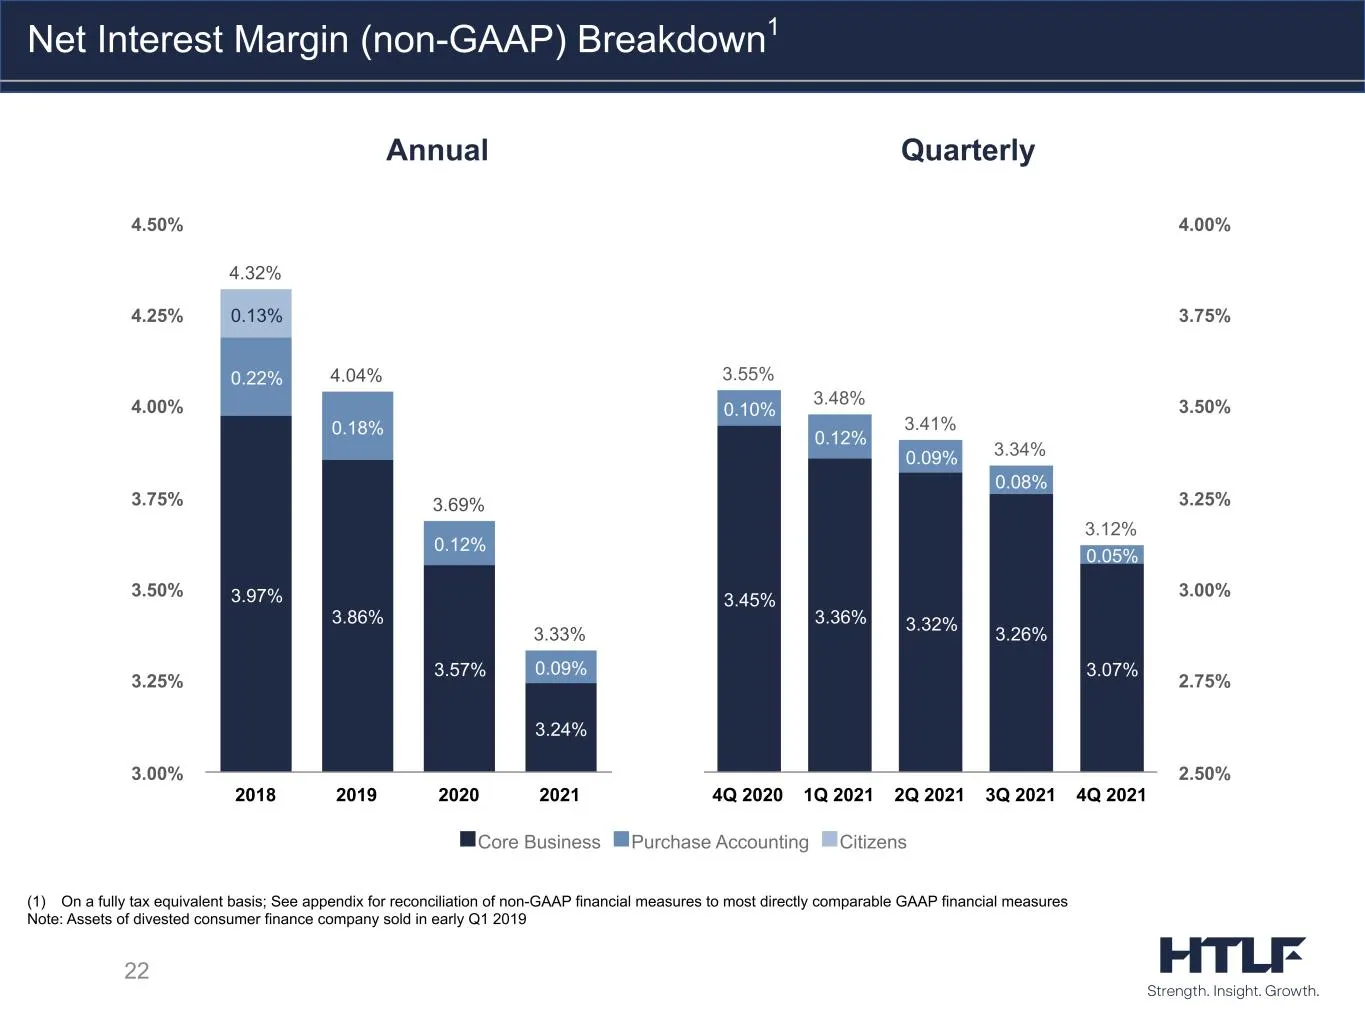
22 Net Interest Margin (non-GAAP) Breakdown1 QuarterlyAnnual (1) On a fully tax equivalent basis; See appendix for reconciliation of non-GAAP financial measures to most directly comparable GAAP financial measures Note: Assets of divested consumer finance company sold in early Q1 2019 4.32% 4.04% 3.6
Slide 23: Non-Interest Income Breakdown | YTD
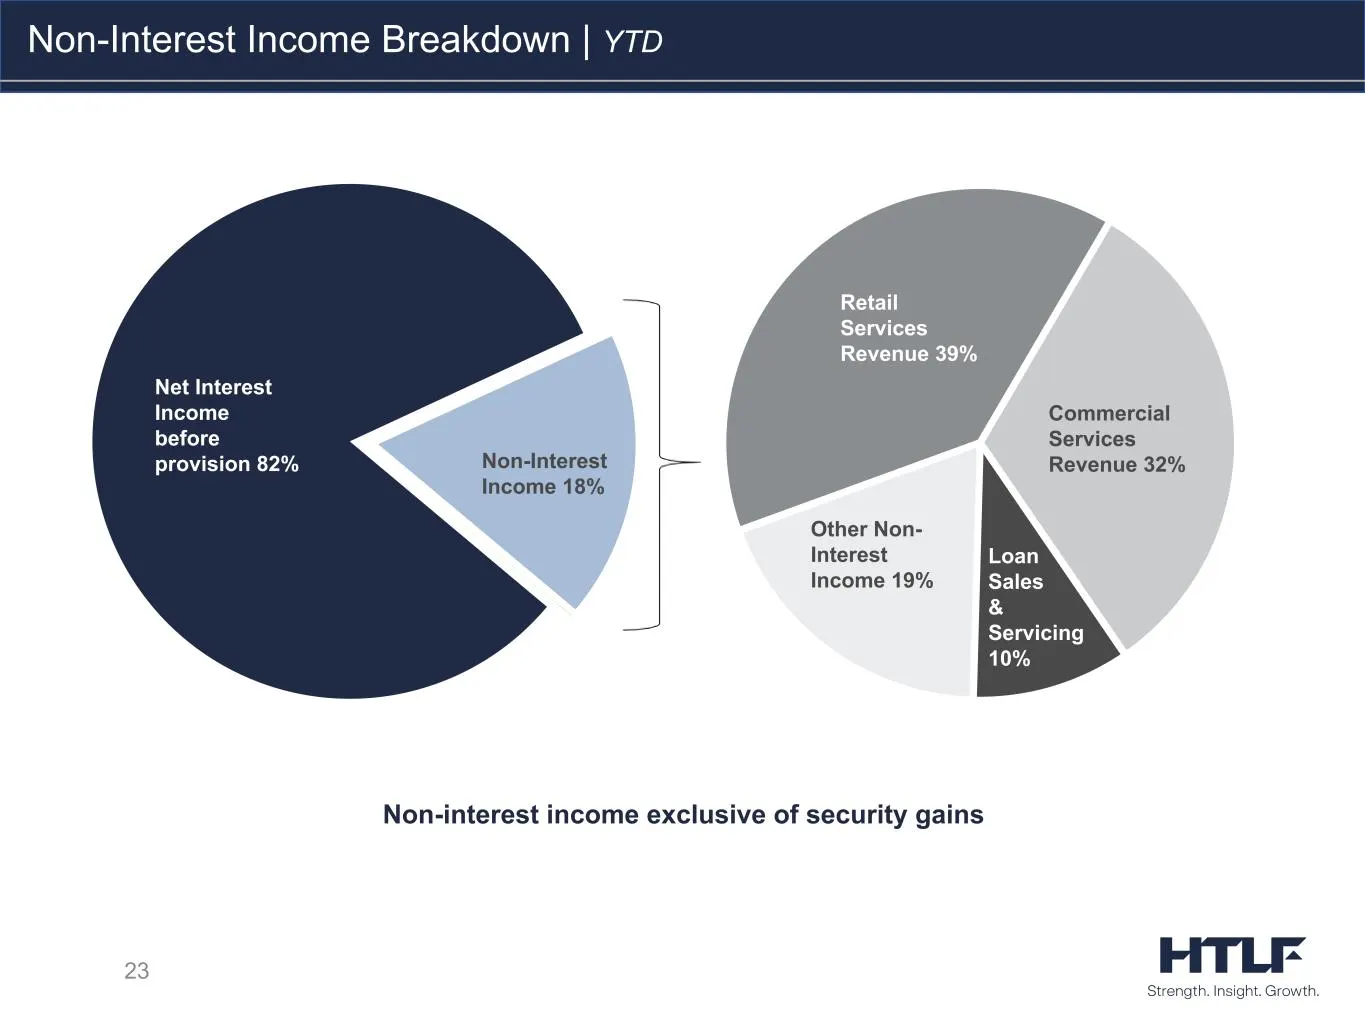
23 Non-interest income exclusive of security gains Non-Interest Income Breakdown | YTD Net Interest Income before provision 82% Non-Interest Income 18% Retail Services Revenue 39% Commercial Services Revenue 32% Loan Sales & Servicing 10% Other Non- Interest Income 19%
Slide 24: Commercial Services Revenue Trends
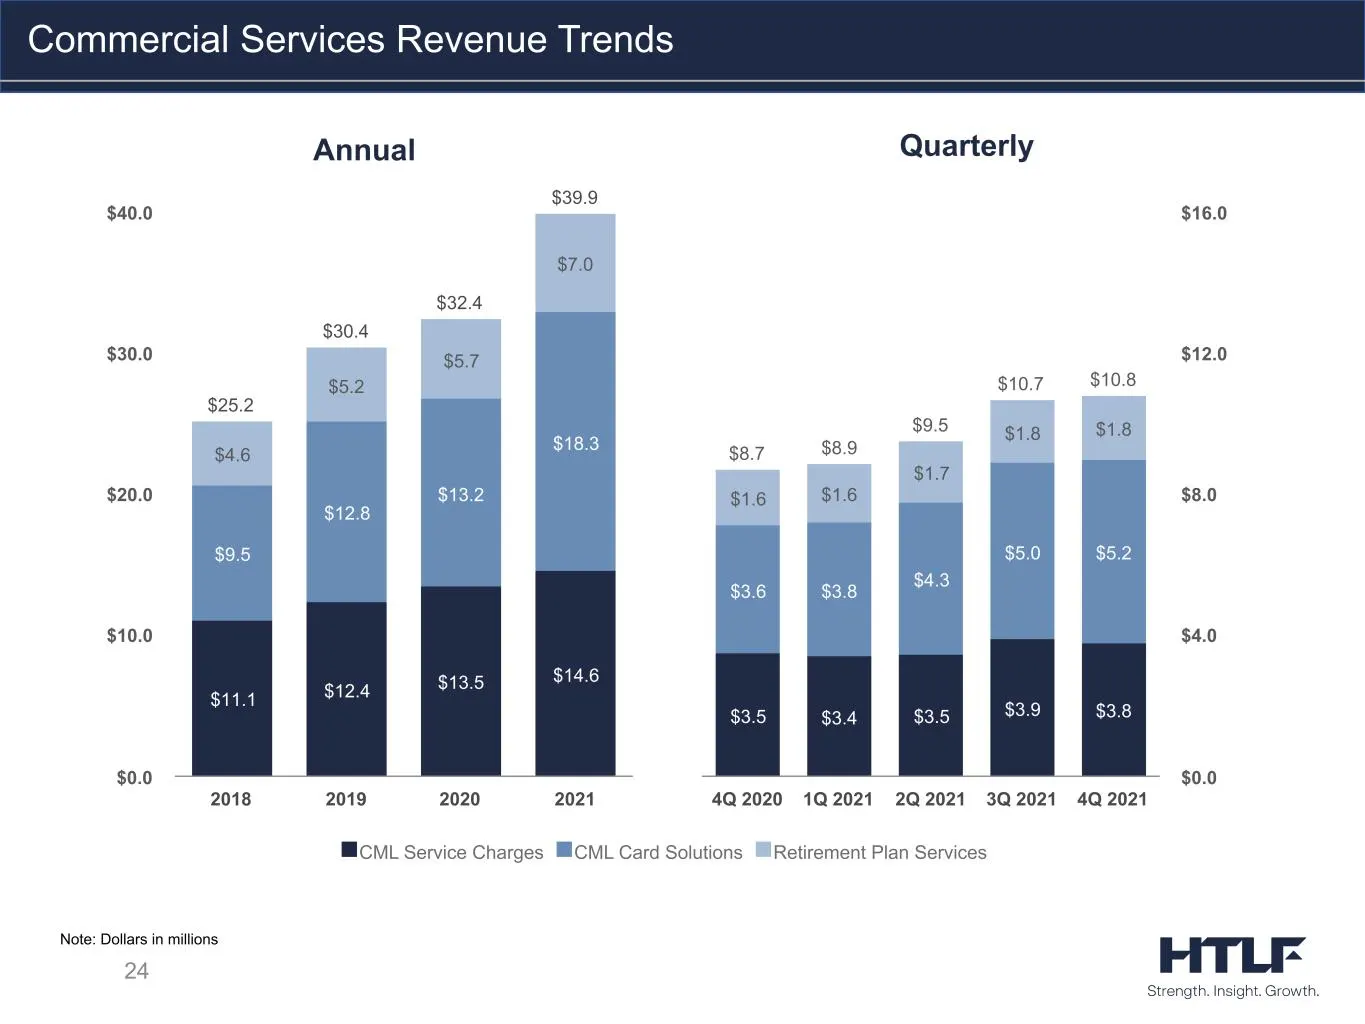
24 Commercial Services Revenue Trends Note: Dollars in millions QuarterlyAnnual $25.2 $30.4 $32.4 $39.9 $11.1 $12.4 $13.5 $14.6 $9.5 $12.8 $13.2 $18.3$4.6 $5.2 $5.7 $7.0 2018 2019 2020 2021 $0.0 $10.0 $20.0 $30.0 $40.0 $8.7 $8.9 $9.5 $10.7 $10.8 $3.5 $3.4 $3.5 $3.9 $3.8 $3.6 $3.8 $4.3 $5.0 $5.2 $1.6
Slide 25: Consumer Services Revenue Trends
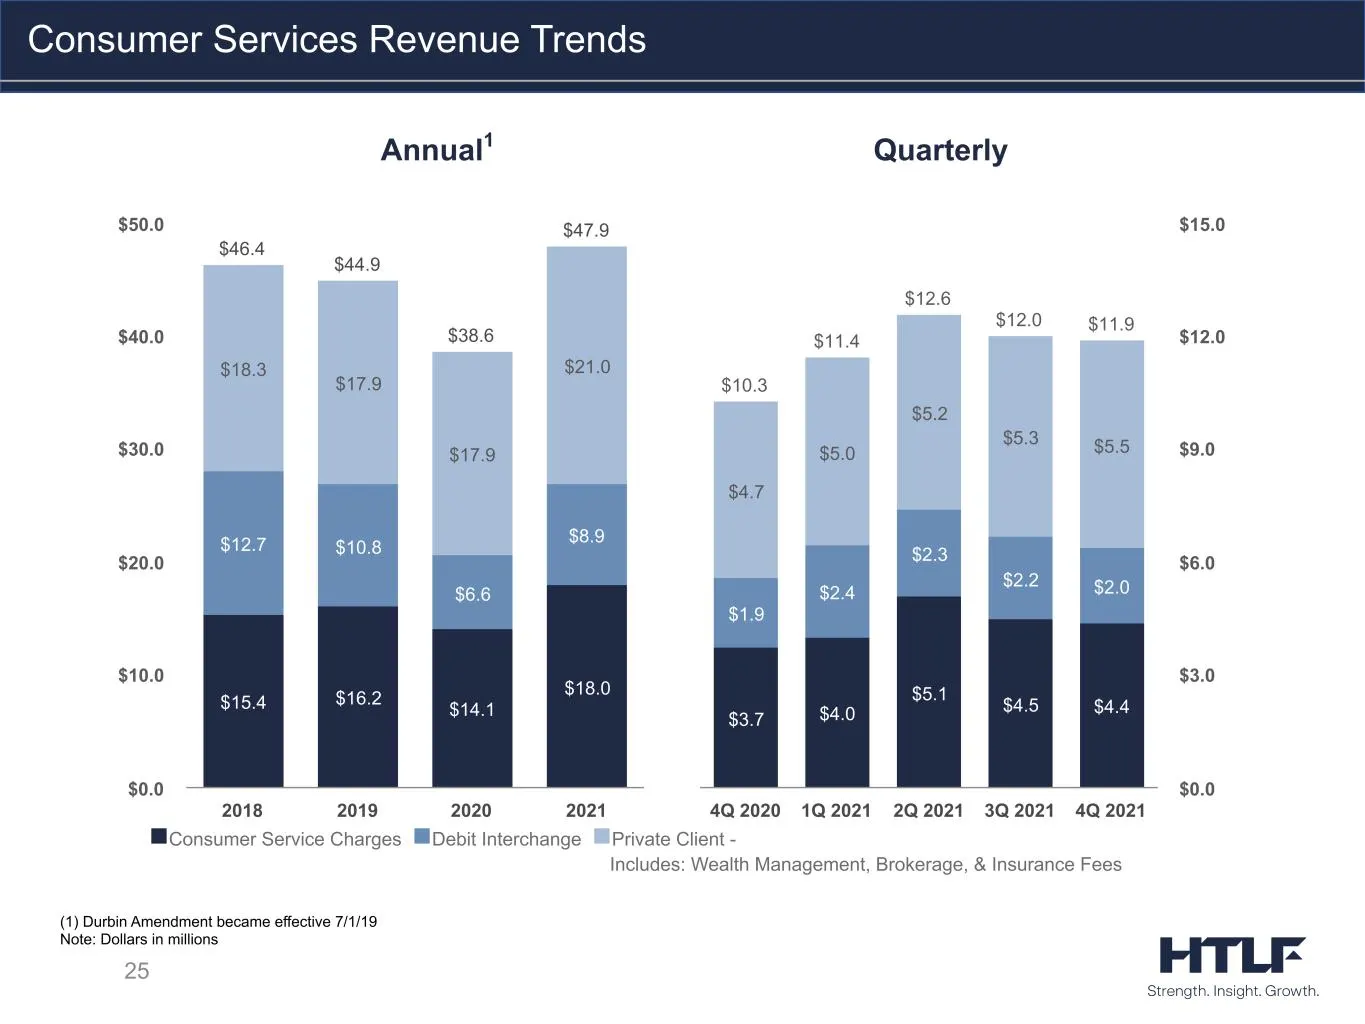
25 Consumer Services Revenue Trends (1) Durbin Amendment became effective 7/1/19 Note: Dollars in millions QuarterlyAnnual1 $46.4 $44.9 $38.6 $47.9 $15.4 $16.2 $14.1 $18.0 $12.7 $10.8 $6.6 $8.9 $18.3 $17.9 $17.9 $21.0 2018 2019 2020 2021 $0.0 $10.0 $20.0 $30.0 $40.0 $50.0 $10.3 $11.4 $12.6 $12.0 $11
Slide 26: Consolidated Capital Ratios
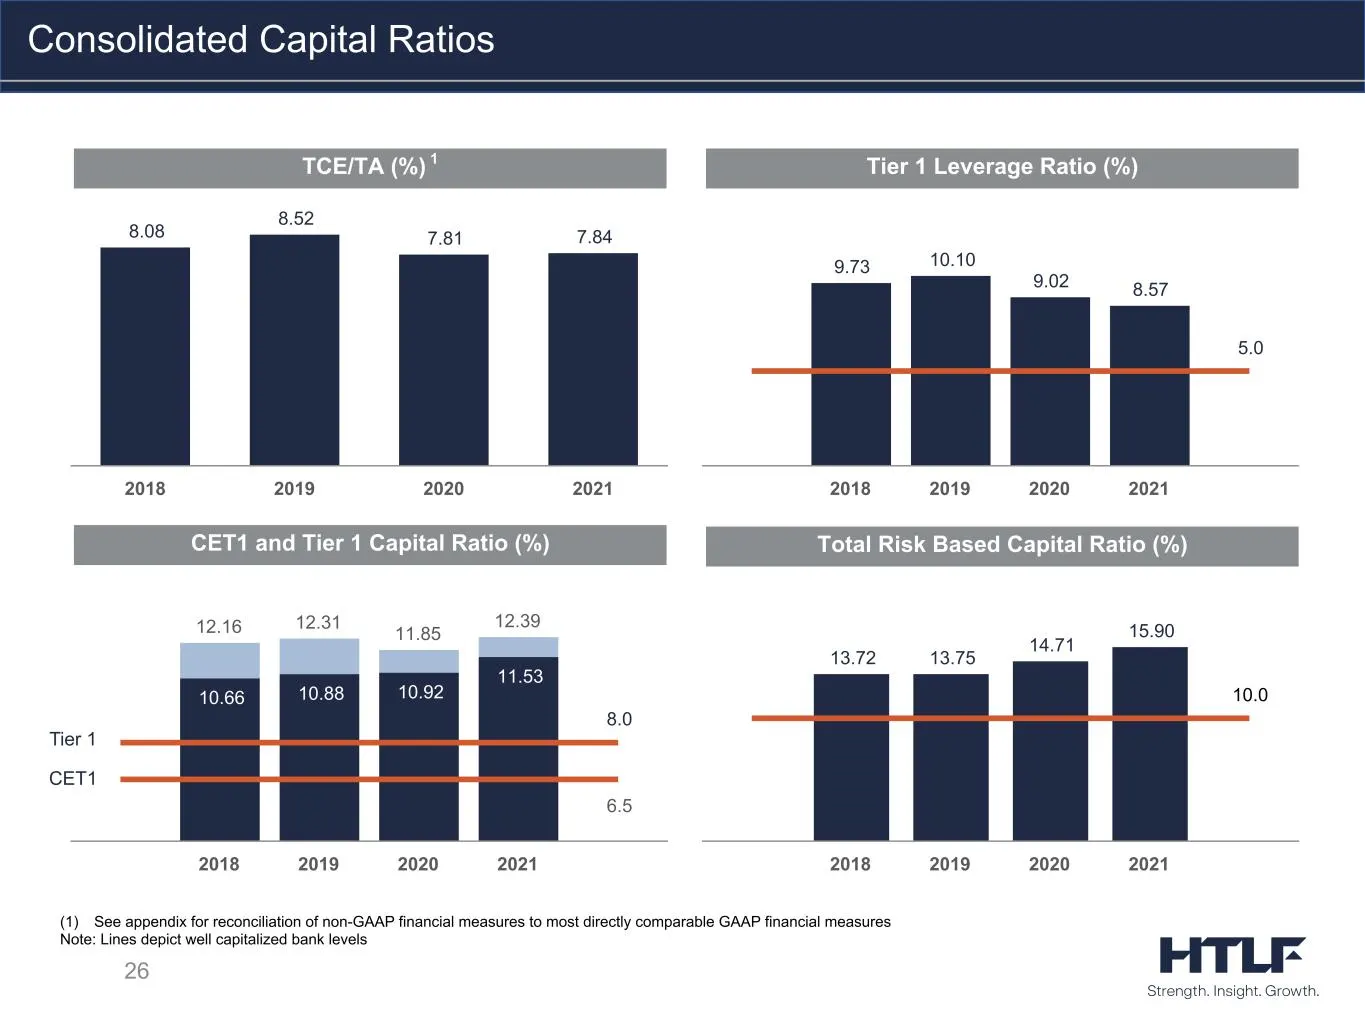
26 Consolidated Capital Ratios (1) See appendix for reconciliation of non-GAAP financial measures to most directly comparable GAAP financial measures Note: Lines depict well capitalized bank levels TCE/TA (%) 1 Tier 1 Leverage Ratio (%) CET1 and Tier 1 Capital Ratio (%) Total Risk Based Capital Rati
Slide 27: Loan Portfolio and Asset Quality
27 Loan Portfolio and Asset Quality
Slide 28: Diversified Loan Portfolio
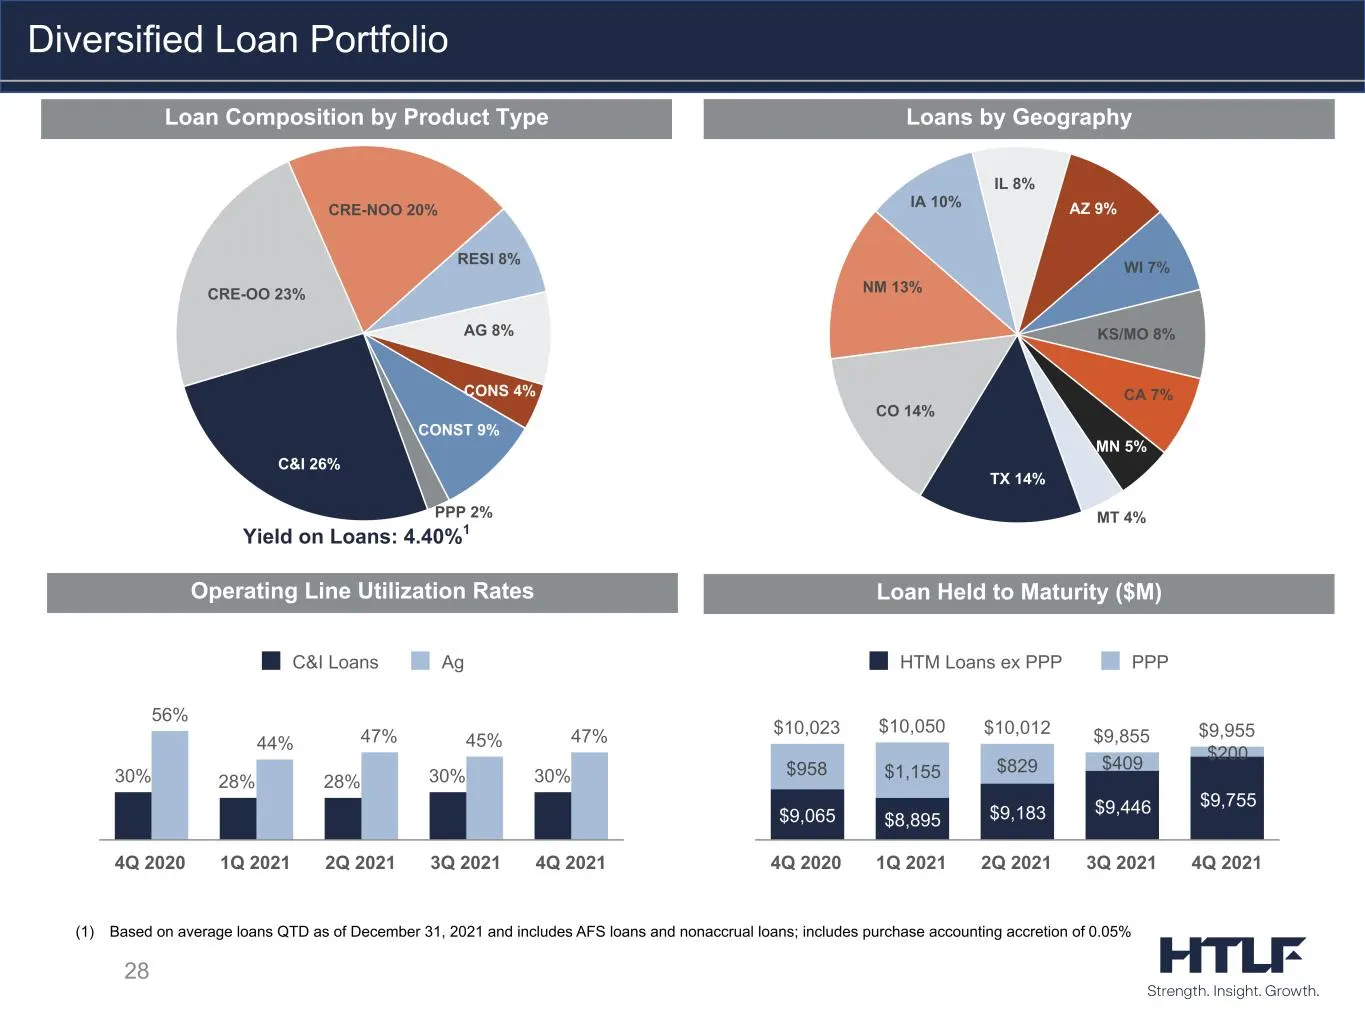
28 Loan Composition by Product Type Loans by Geography Loan Held to Maturity ($M) Diversified Loan Portfolio (1) Based on average loans QTD as of December 31, 2021 and includes AFS loans and nonaccrual loans; includes purchase accounting accretion of 0.05% Operating Line Utilization Rates C&I 26% CR
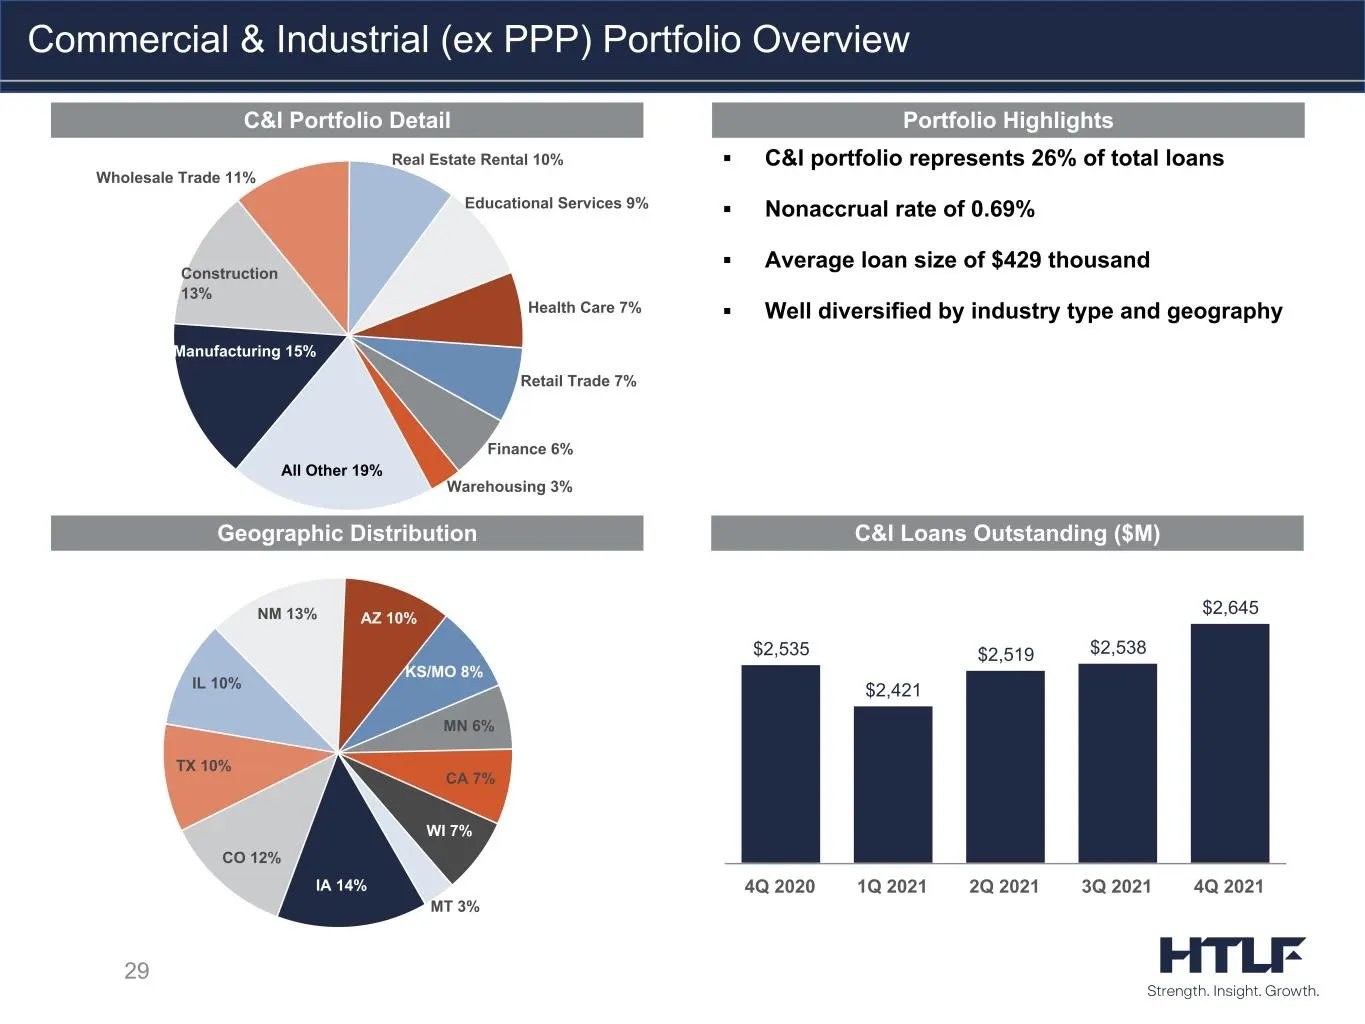
Slide 29: Commercial & Industrial (ex PPP) Portfolio Overview
Manufacturing 15% Construction 13% Wholesale Trade 11% Real Estate Rental 10% Educational Services 9% Health Care 7% Retail Trade 7% Finance 6% Warehousing 3% All Other 19% ▪ C&I portfolio represents 26% of total loans ▪ Nonaccrual rate of 0.69% ▪ Average loan size of $429 thousand ▪ Well diversifie
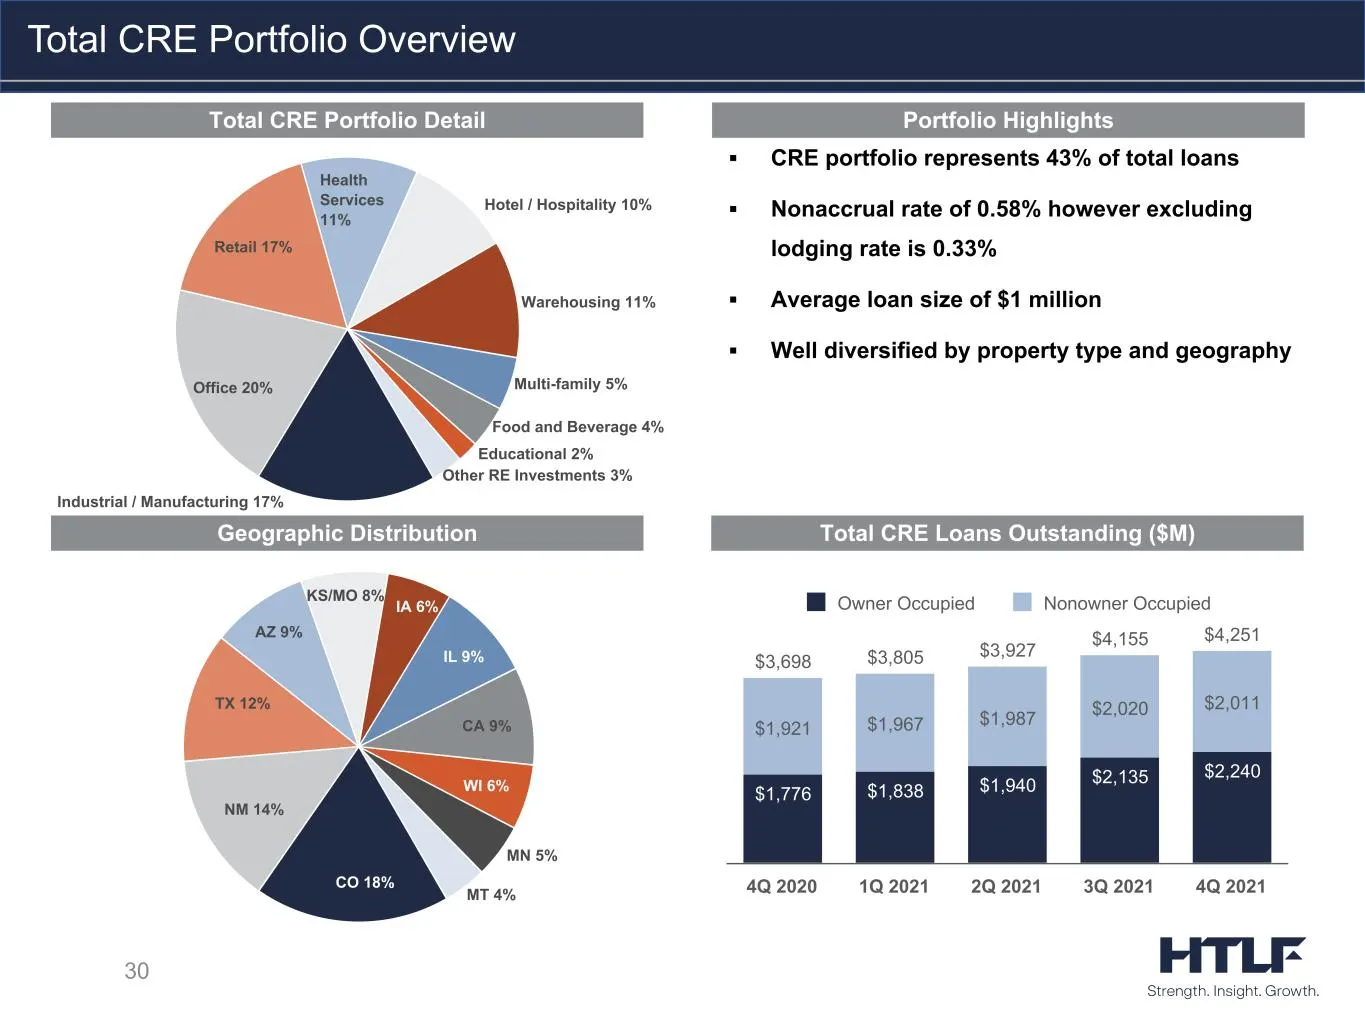
Slide 30: Total CRE Portfolio Overview
Industrial / Manufacturing 17% Office 20% Retail 17% Health Services 11% Hotel / Hospitality 10% Warehousing 11% Multi-family 5% Food and Beverage 4% Educational 2% Other RE Investments 3% ▪ CRE portfolio represents 43% of total loans ▪ Nonaccrual rate of 0.58% however excluding lodging rate is 0.33
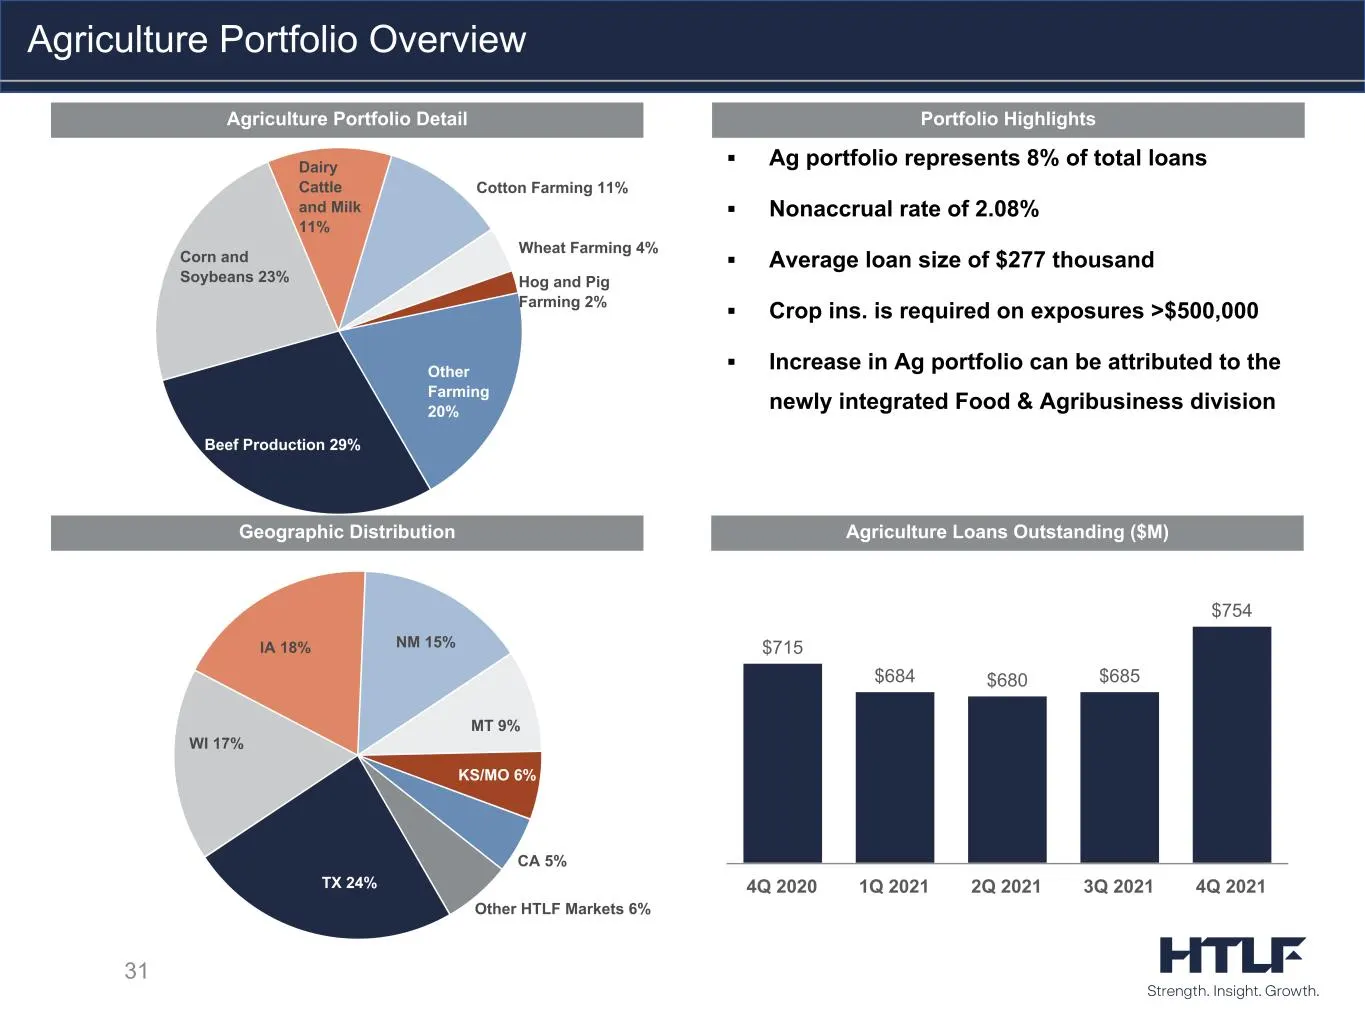
Slide 31: Agriculture Portfolio Overview
▪ Ag portfolio represents 8% of total loans ▪ Nonaccrual rate of 2.08% ▪ Average loan size of $277 thousand ▪ Crop ins. is required on exposures >$500,000 ▪ Increase in Ag portfolio can be attributed to the newly integrated Food & Agribusiness division 31 Agriculture Portfolio Overview Portfolio Hig
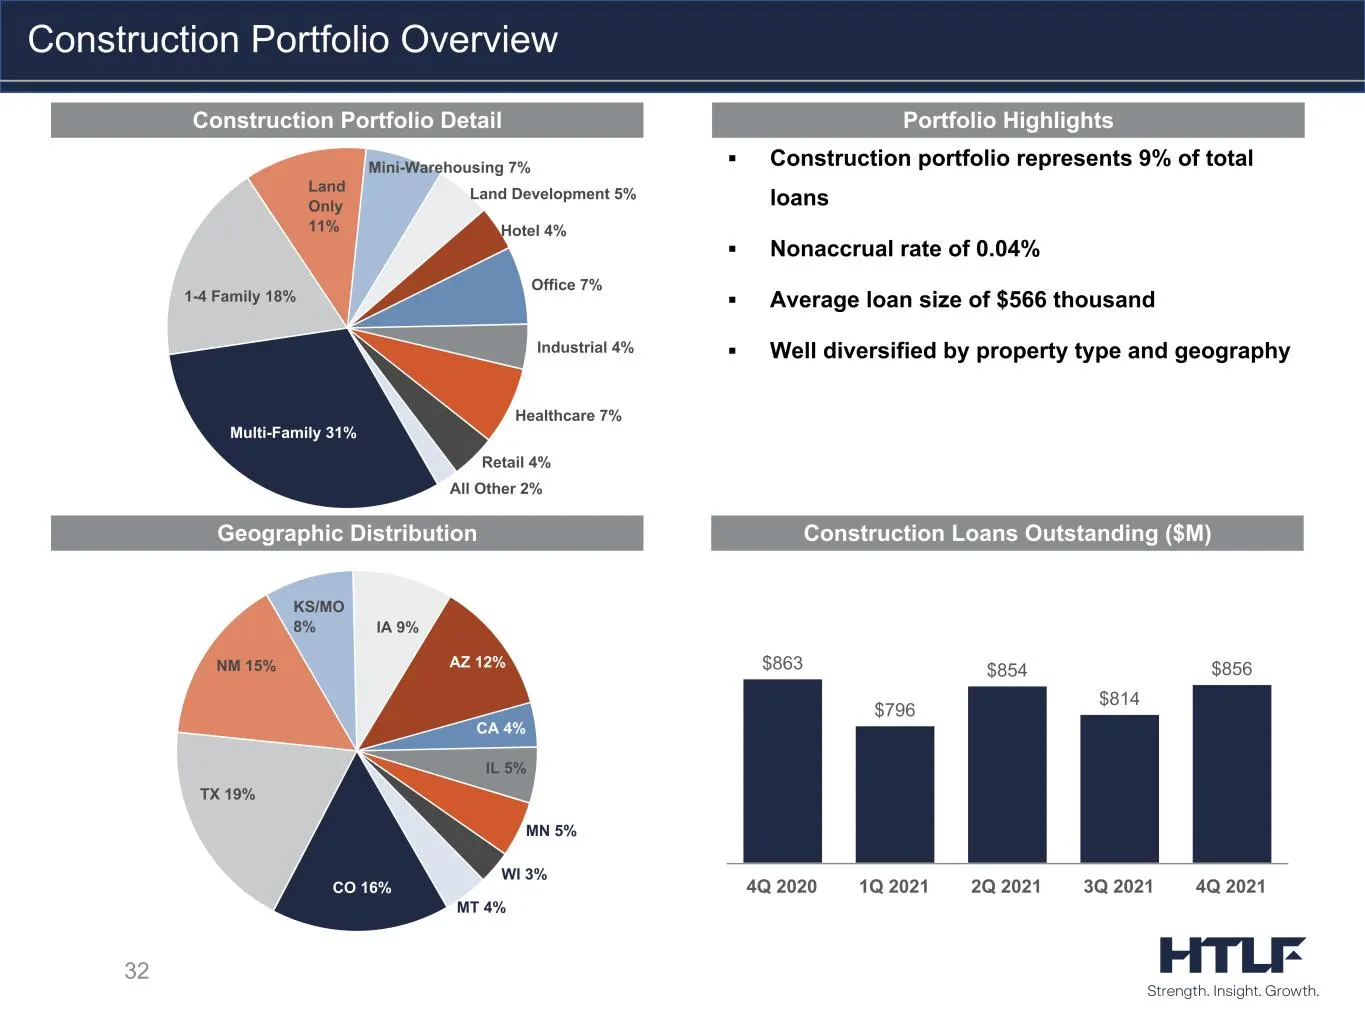
Slide 32: Construction Portfolio Overview
Multi-Family 31% 1-4 Family 18% Land Only 11% Mini-Warehousing 7% Land Development 5% Hotel 4% Office 7% Industrial 4% Healthcare 7% Retail 4% All Other 2% Portfolio HighlightsConstruction Portfolio Detail ▪ Construction portfolio represents 9% of total loans ▪ Nonaccrual rate of 0.04% ▪ Average loa
Slide 33: PPP Portfolio Overview
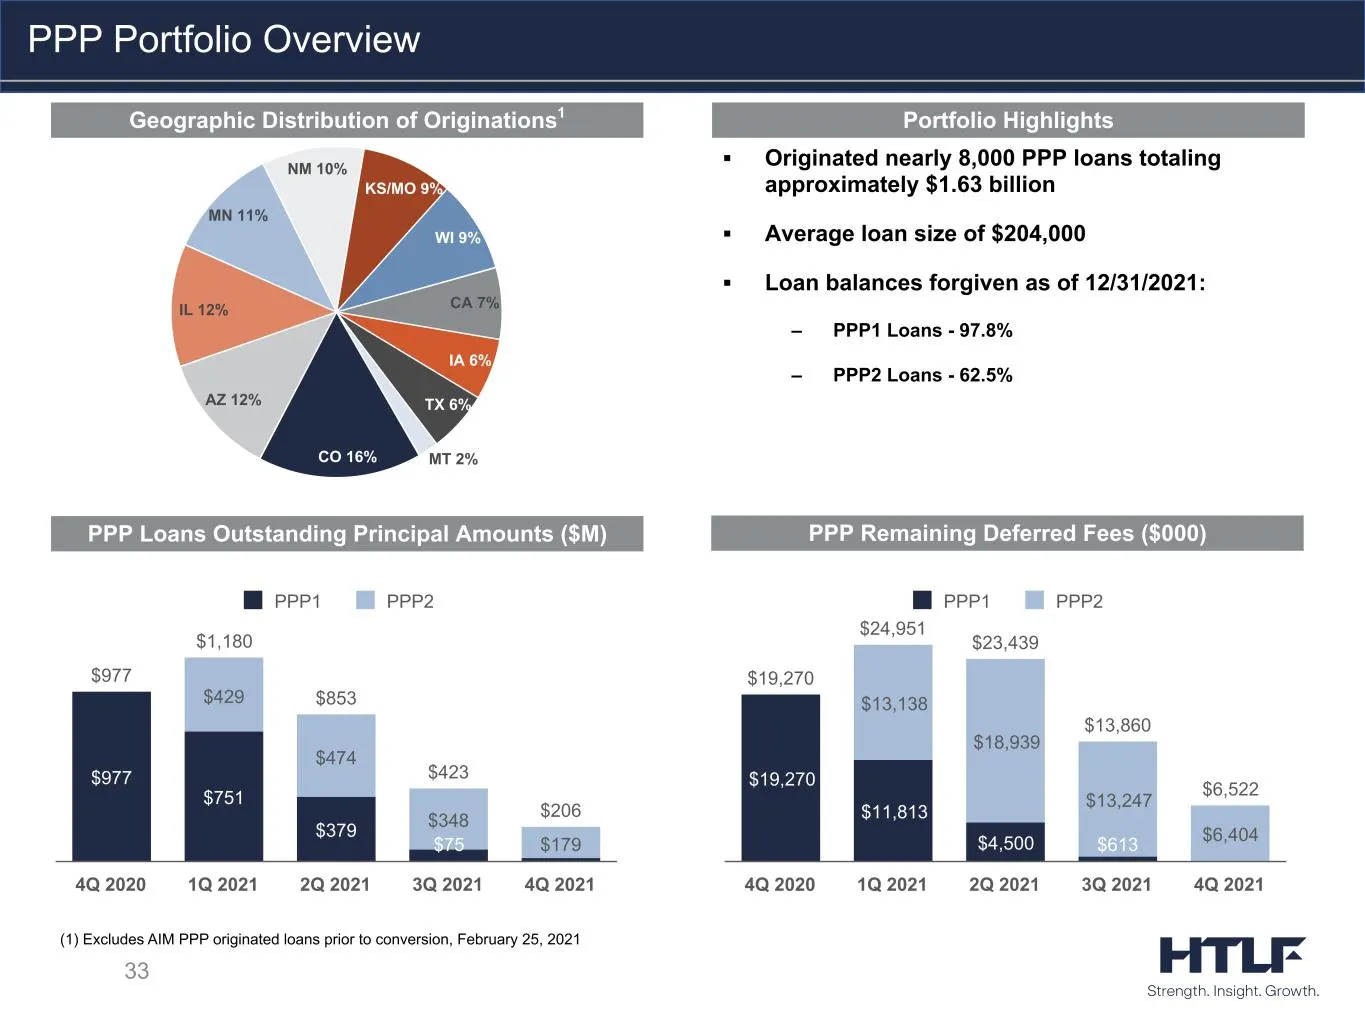
CO 16% AZ 12% IL 12% MN 11% NM 10% KS/MO 9% WI 9% CA 7% IA 6% TX 6% MT 2% ▪ Originated nearly 8,000 PPP loans totaling approximately $1.63 billion ▪ Average loan size of $204,000 ▪ Loan balances forgiven as of 12/31/2021: – PPP1 Loans - 97.8% – PPP2 Loans - 62.5% 33 PPP Portfolio Overview (1) Exclud
Slide 34: Allowance for Credit Related Losses
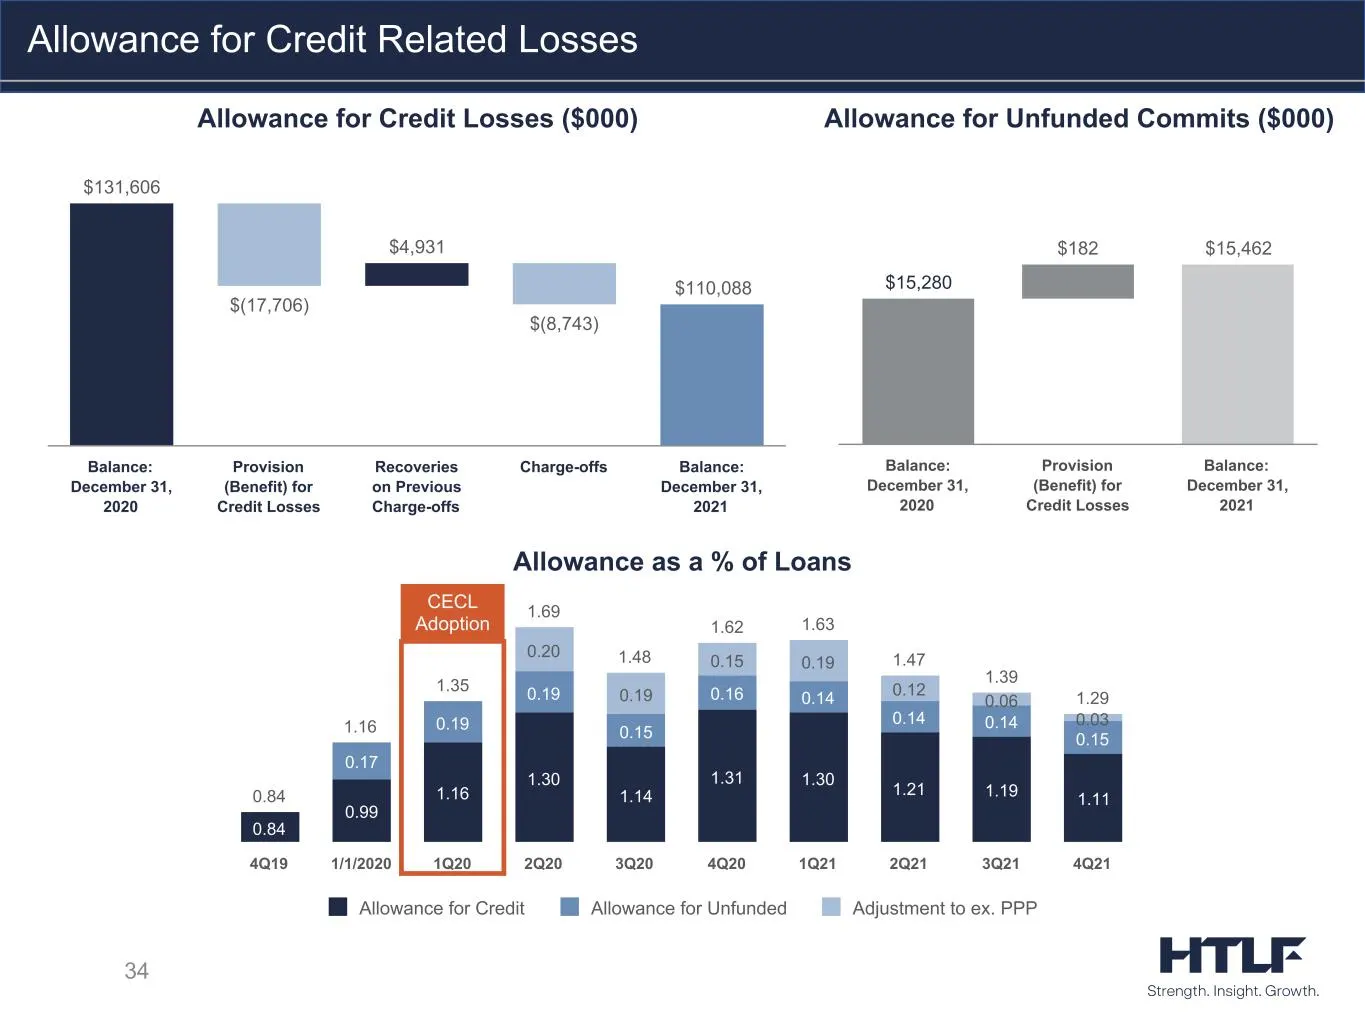
0.84 1.16 1.35 1.69 1.48 1.62 1.63 1.47 1.39 1.29 0.84 0.99 1.16 1.30 1.14 1.31 1.30 1.21 1.19 1.11 0.17 0.19 0.19 0.15 0.16 0.14 0.14 0.14 0.15 0.20 0.19 0.15 0.19 0.12 0.06 0.03 Allowance for Credit Allowance for Unfunded Adjustment to ex. PPP 4Q19 1/1/2020 1Q20 2Q20 3Q20 4Q20 1Q21 2Q21 3Q21 4Q21
Slide 35: Summary Asset Quality
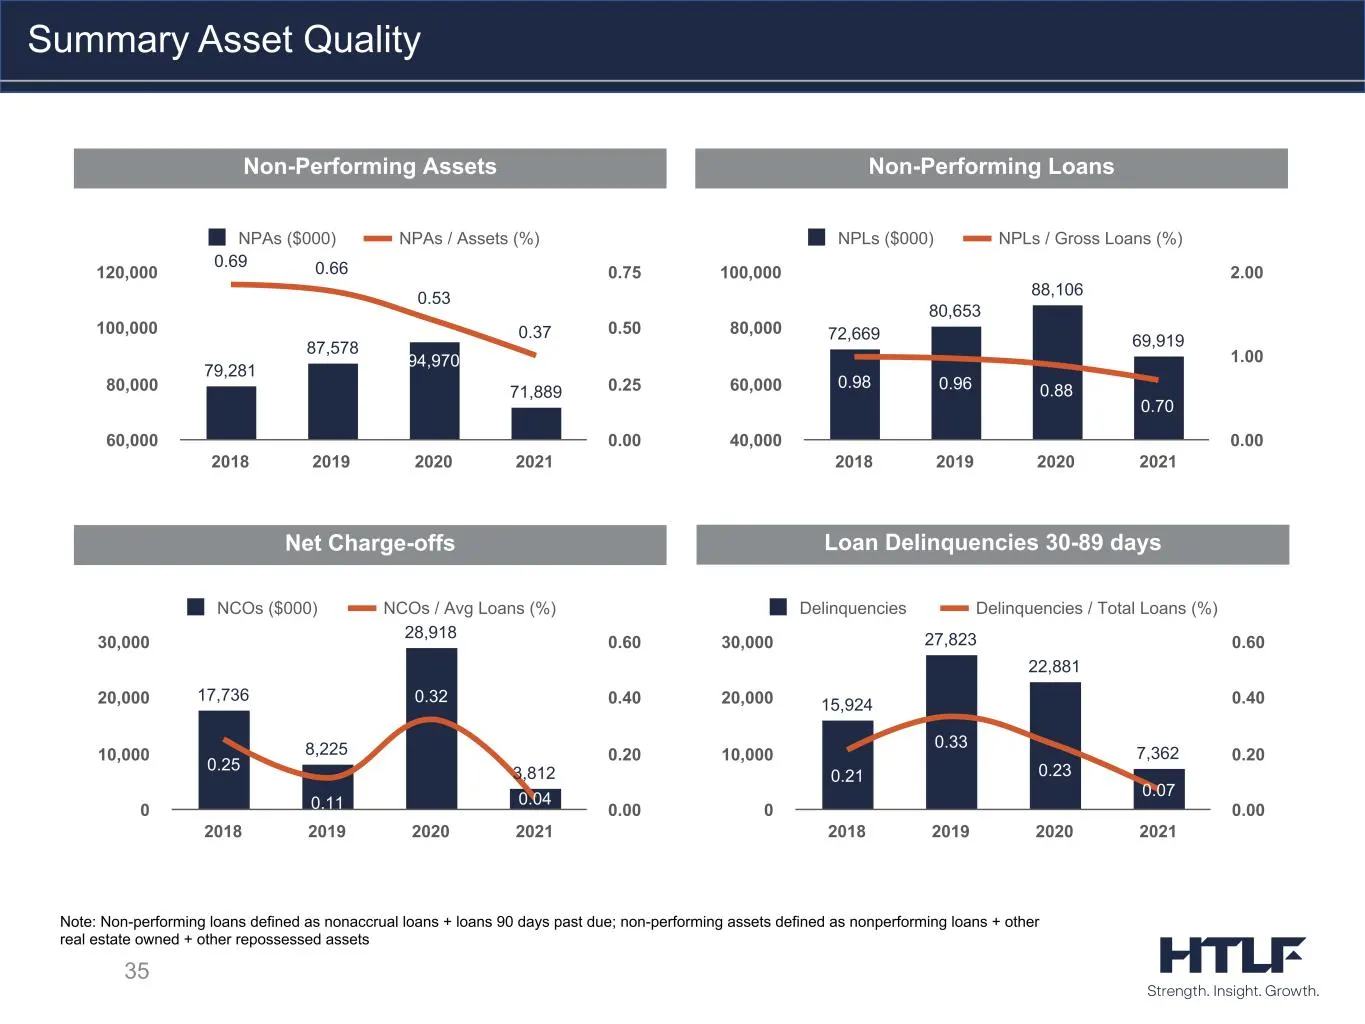
35 Summary Asset Quality Note: Non-performing loans defined as nonaccrual loans + loans 90 days past due; non-performing assets defined as nonperforming loans + other real estate owned + other repossessed assets Non-Performing Assets Non-Performing Loans Net Charge-offs Loan Delinquencies 30-89 days
Slide 36: Liquidity, Investments, Funding and Capital
36 Liquidity, Investments, Funding and Capital
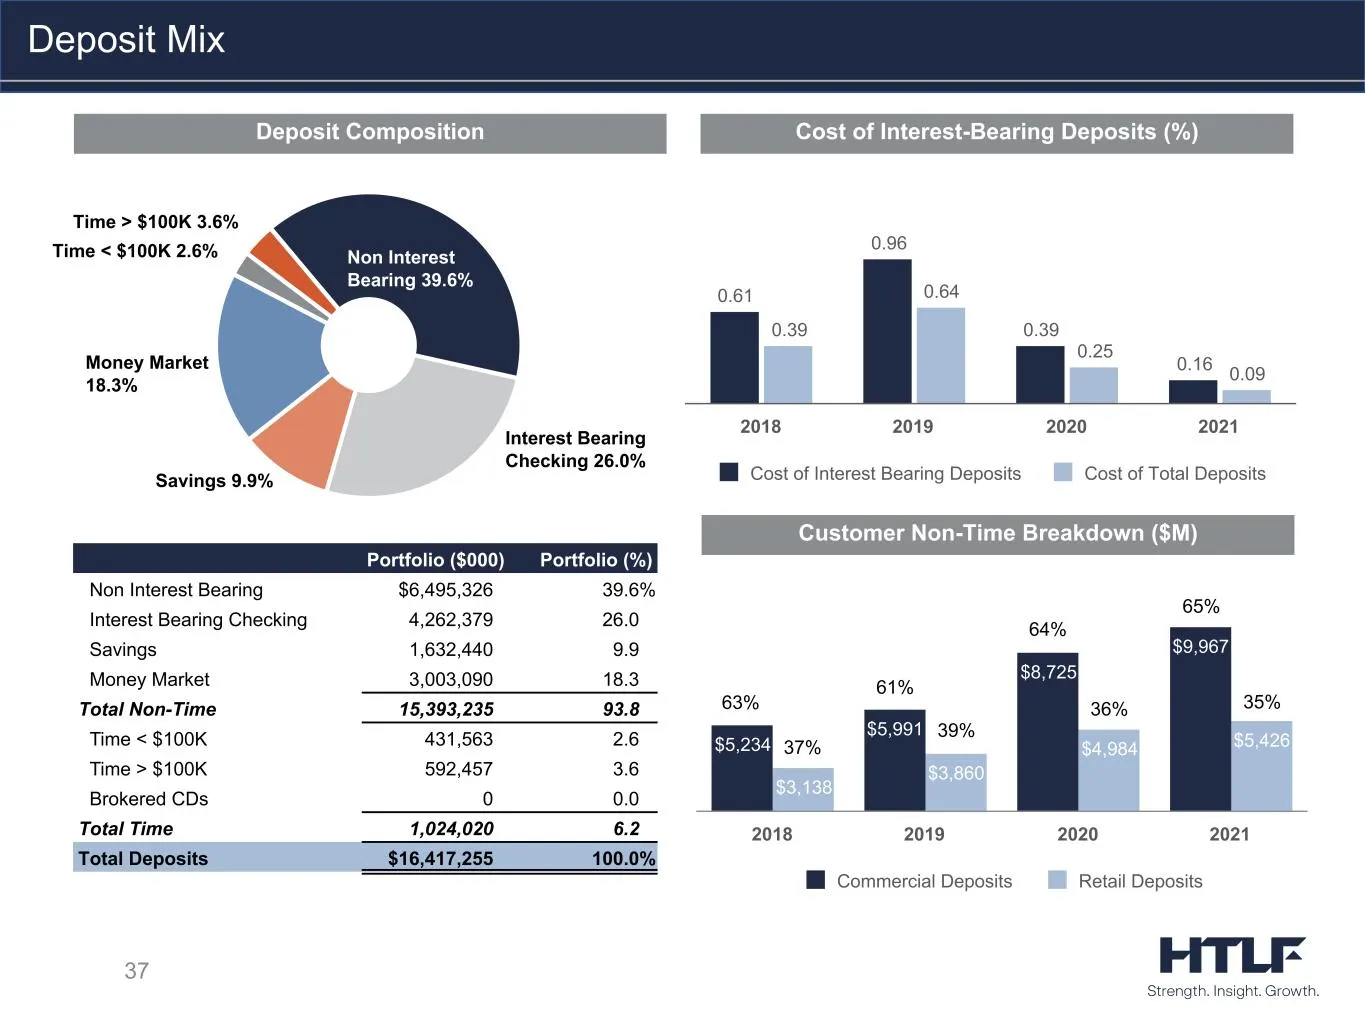
Slide 37: Deposit Composition
$5,234 $5,991 $8,725 $9,967 $3,138 $3,860 $4,984 $5,426 Commercial Deposits Retail Deposits 2018 2019 2020 2021 Deposit Composition Cost of Interest-Bearing Deposits (%) Customer Non-Time Breakdown ($M) 37 Deposit Mix Non Interest Bearing 39.6% Interest Bearing Checking 26.0% Savings 9.9% Money Mark
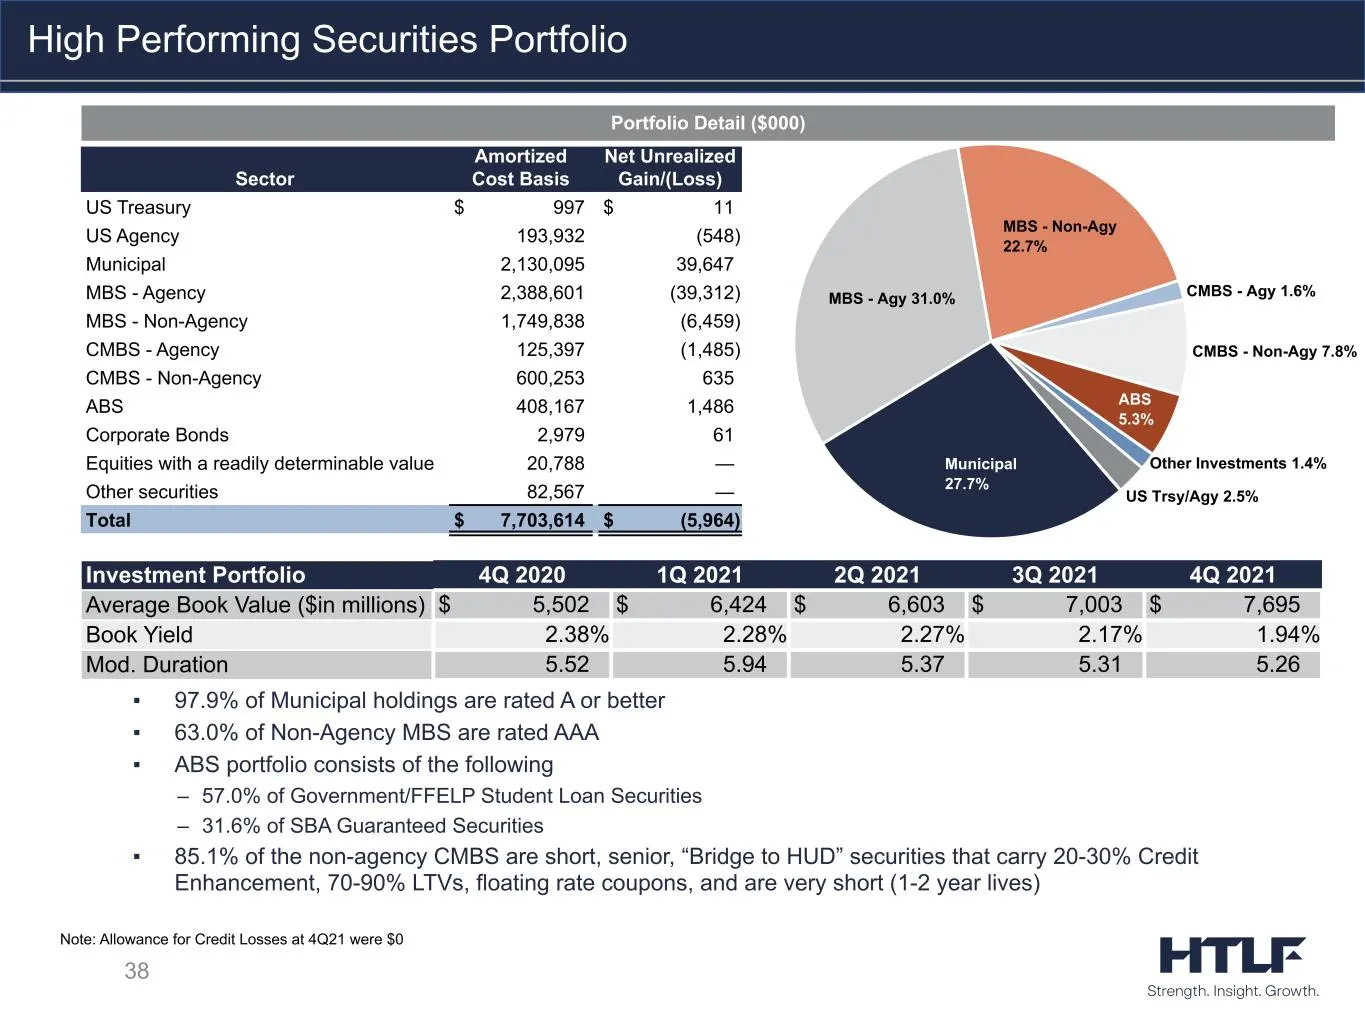
Slide 38: High Performing Securities Portfolio
38 ▪ 97.9% of Municipal holdings are rated A or better ▪ 63.0% of Non-Agency MBS are rated AAA ▪ ABS portfolio consists of the following – 57.0% of Government/FFELP Student Loan Securities – 31.6% of SBA Guaranteed Securities ▪ 85.1% of the non-agency CMBS are short, senior, “Bridge to HUD” securiti
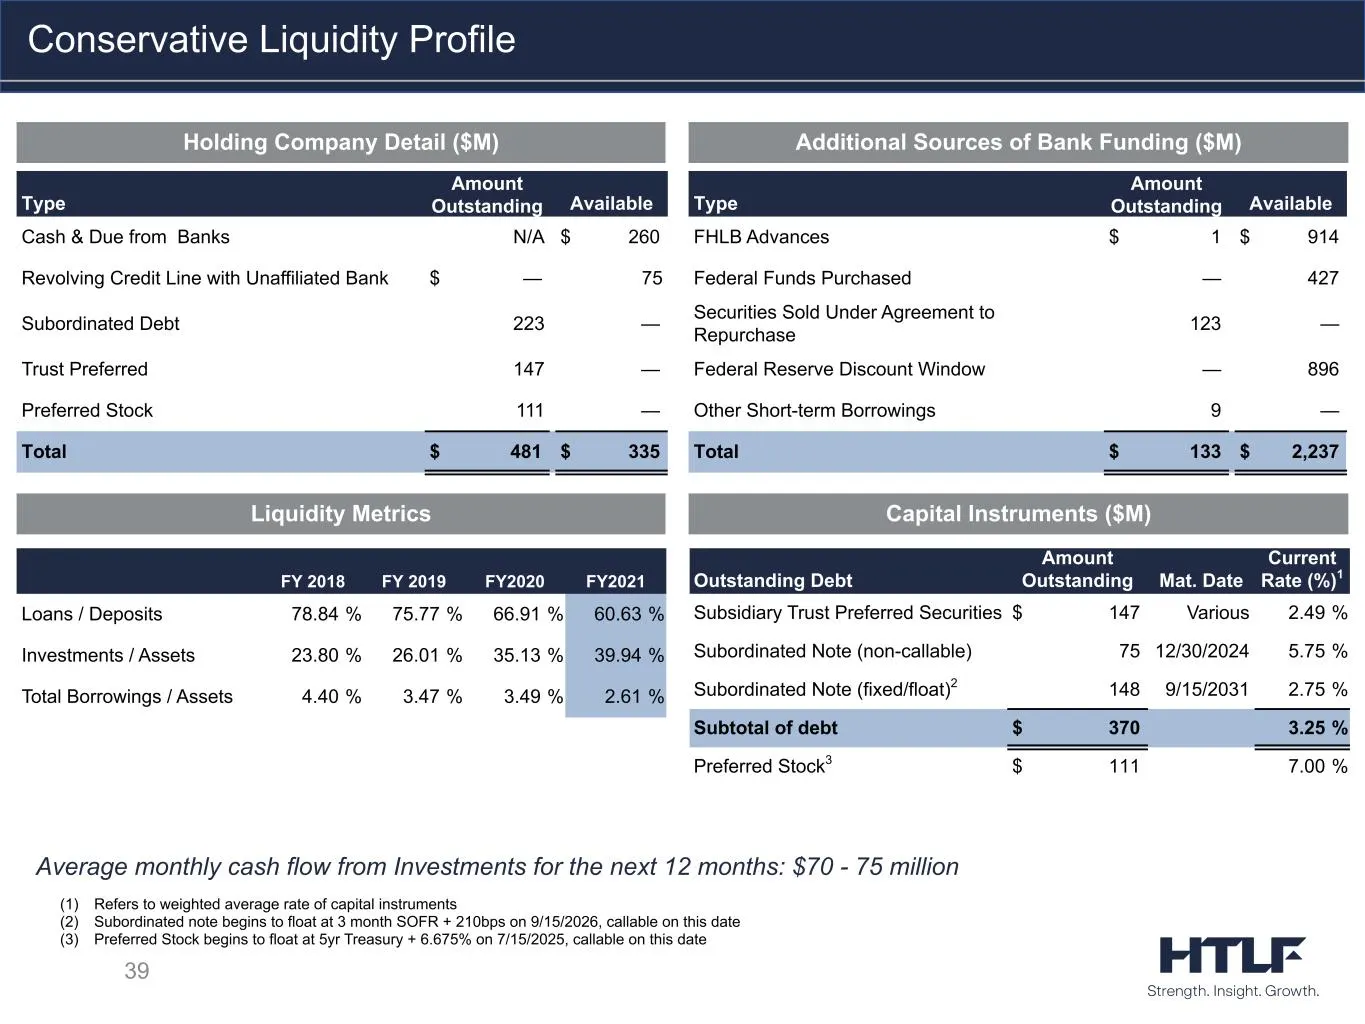
Slide 39: Conservative Liquidity Profile
39 Average monthly cash flow from Investments for the next 12 months: $70 - 75 million Capital Instruments ($M) Conservative Liquidity Profile Liquidity Metrics (1) Refers to weighted average rate of capital instruments (2) Subordinated note begins to float at 3 month SOFR + 210bps on 9/15/2026, cal
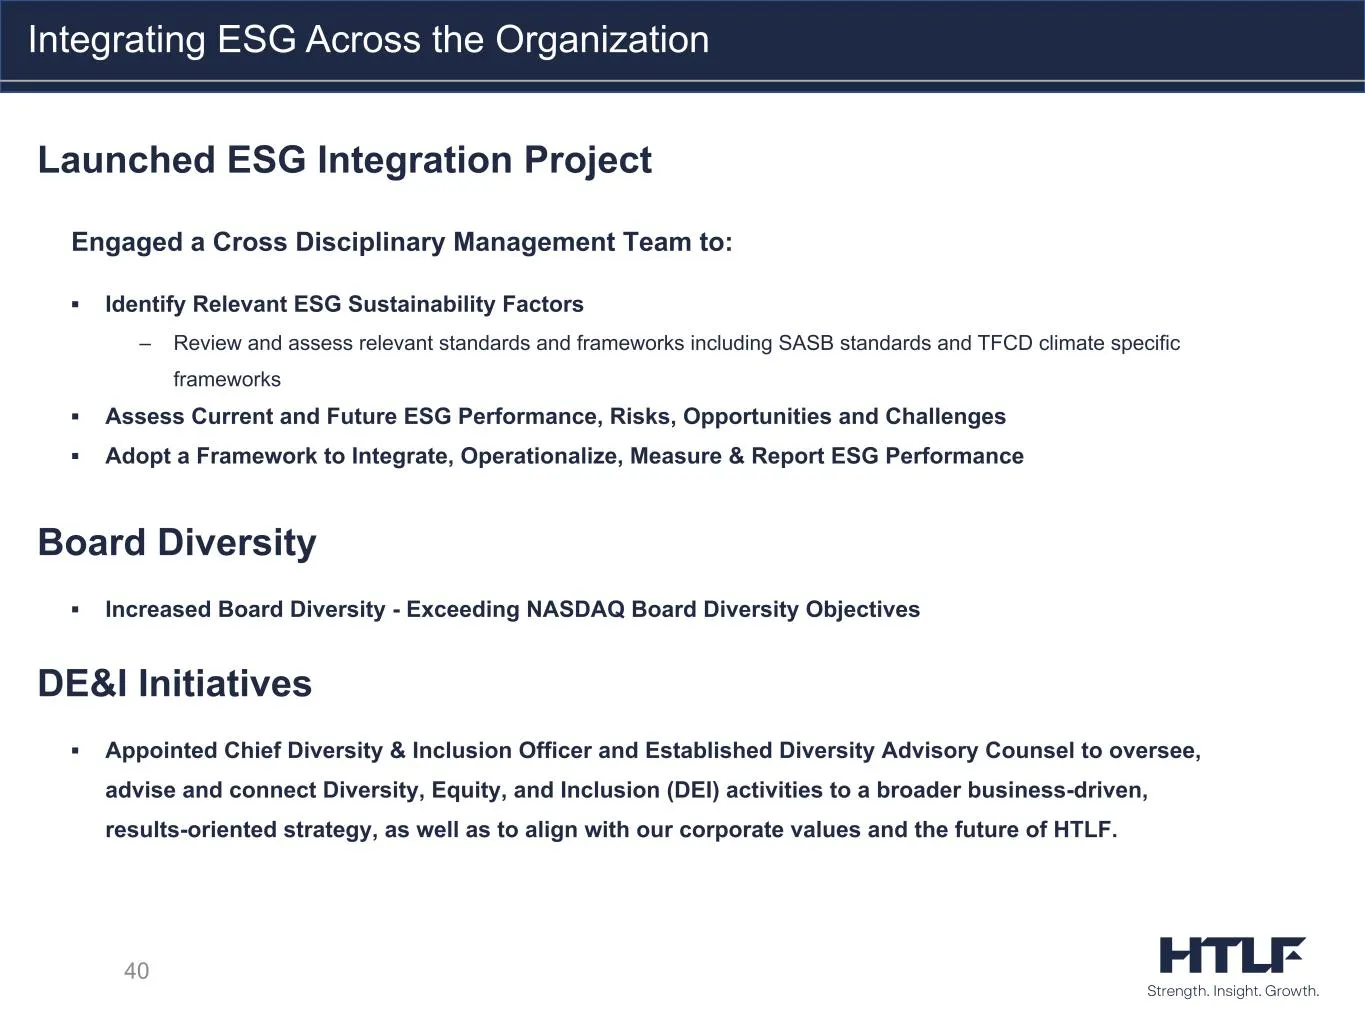
Slide 40: Integrating ESG Across the Organization
40 Integrating ESG Across the Organization Launched ESG Integration Project Engaged a Cross Disciplinary Management Team to: ▪ Identify Relevant ESG Sustainability Factors – Review and assess relevant standards and frameworks including SASB standards and TFCD climate specific frameworks ▪ Assess Cur
Slide 41: HTLF Investor Summary
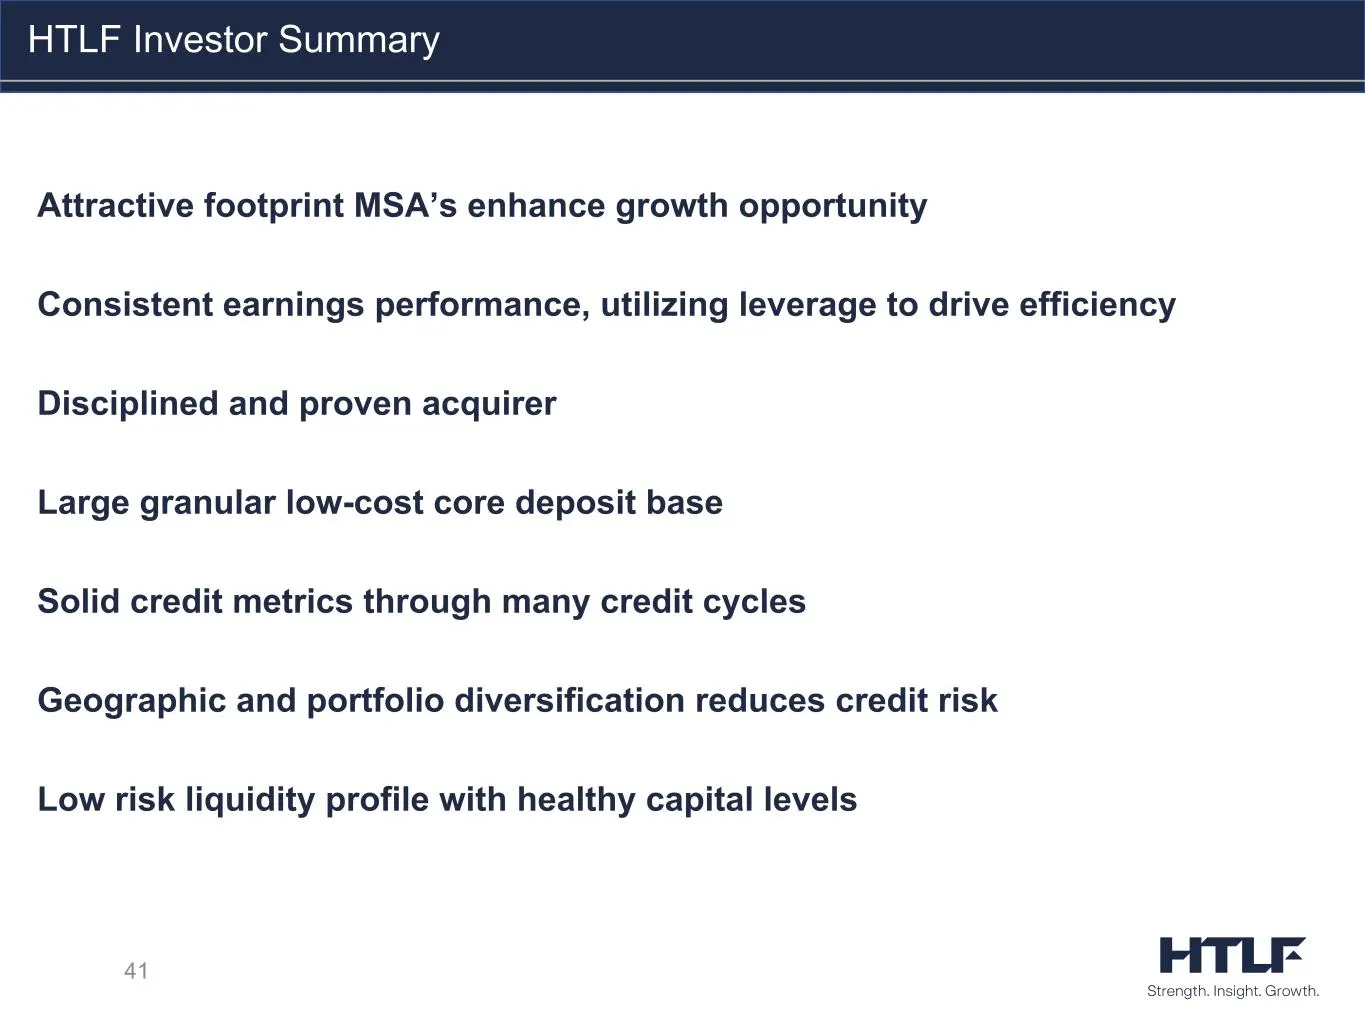
41 HTLF Investor Summary Attractive footprint MSA’s enhance growth opportunity Consistent earnings performance, utilizing leverage to drive efficiency Disciplined and proven acquirer Large granular low-cost core deposit base Solid credit metrics through many credit cycles Geographic and portfolio di
Slide 42: Contact Information
Contact Informatio HTLF 42 Strength. Insight. Growth.
Slide 43: Appendix
43 Appendix
Slide 44: Non-GAAP measure definitions
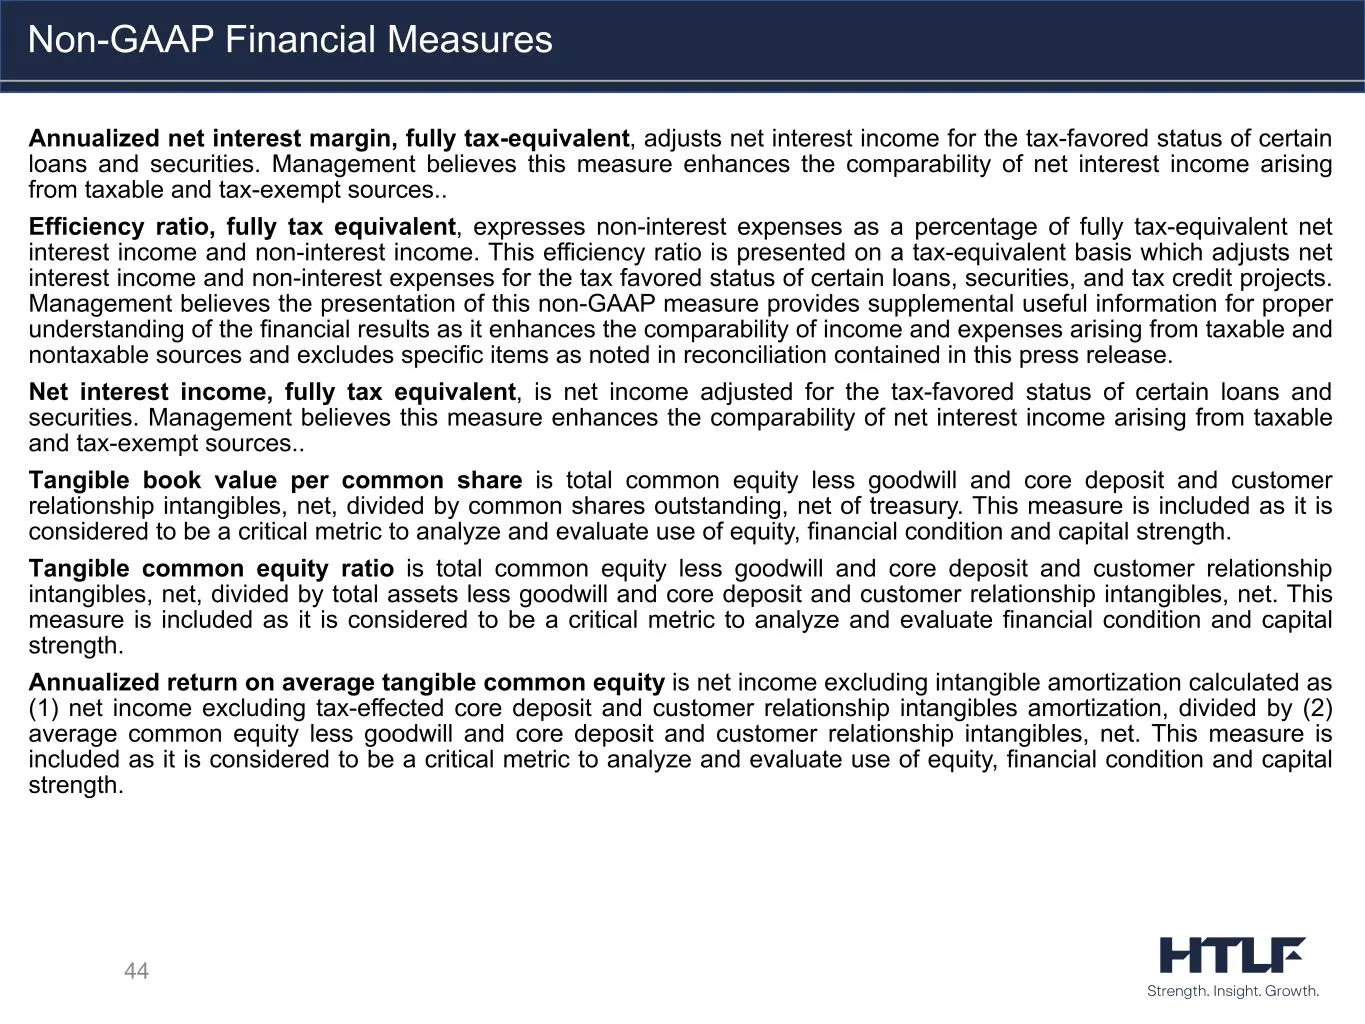
44 Annualized net interest margin, fully tax-equivalent, adjusts net interest income for the tax-favored status of certain loans and securities. Management believes this measure enhances the comparability of net interest income arising from taxable and tax-exempt sources.. Efficiency ratio, fully ta
Slide 45: Non-GAAP Reconciliations
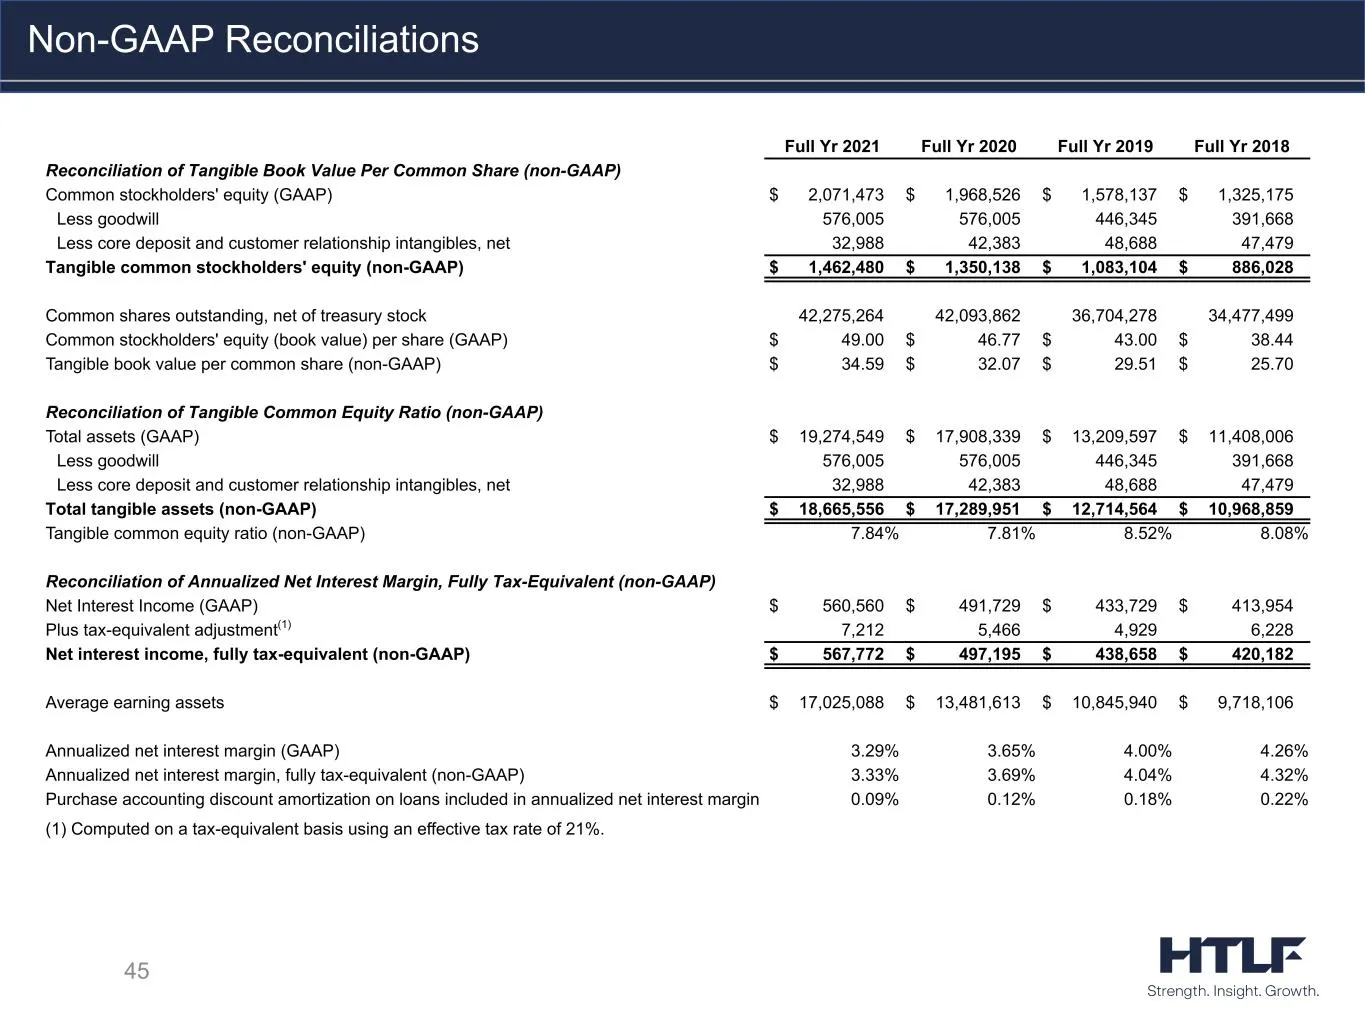
45 Non-GAAP Reconciliations Full Yr 2021 Full Yr 2020 Full Yr 2019 Full Yr 2018 Reconciliation of Tangible Book Value Per Common Share (non-GAAP) Common stockholders' equity (GAAP) $ 2,071,473 $ 1,968,526 $ 1,578,137 $ 1,325,175 Less goodwill 576,005 576,005 446,345 391,668 Less core deposit and cus
Slide 46: Non-GAAP Reconciliations (cont.)
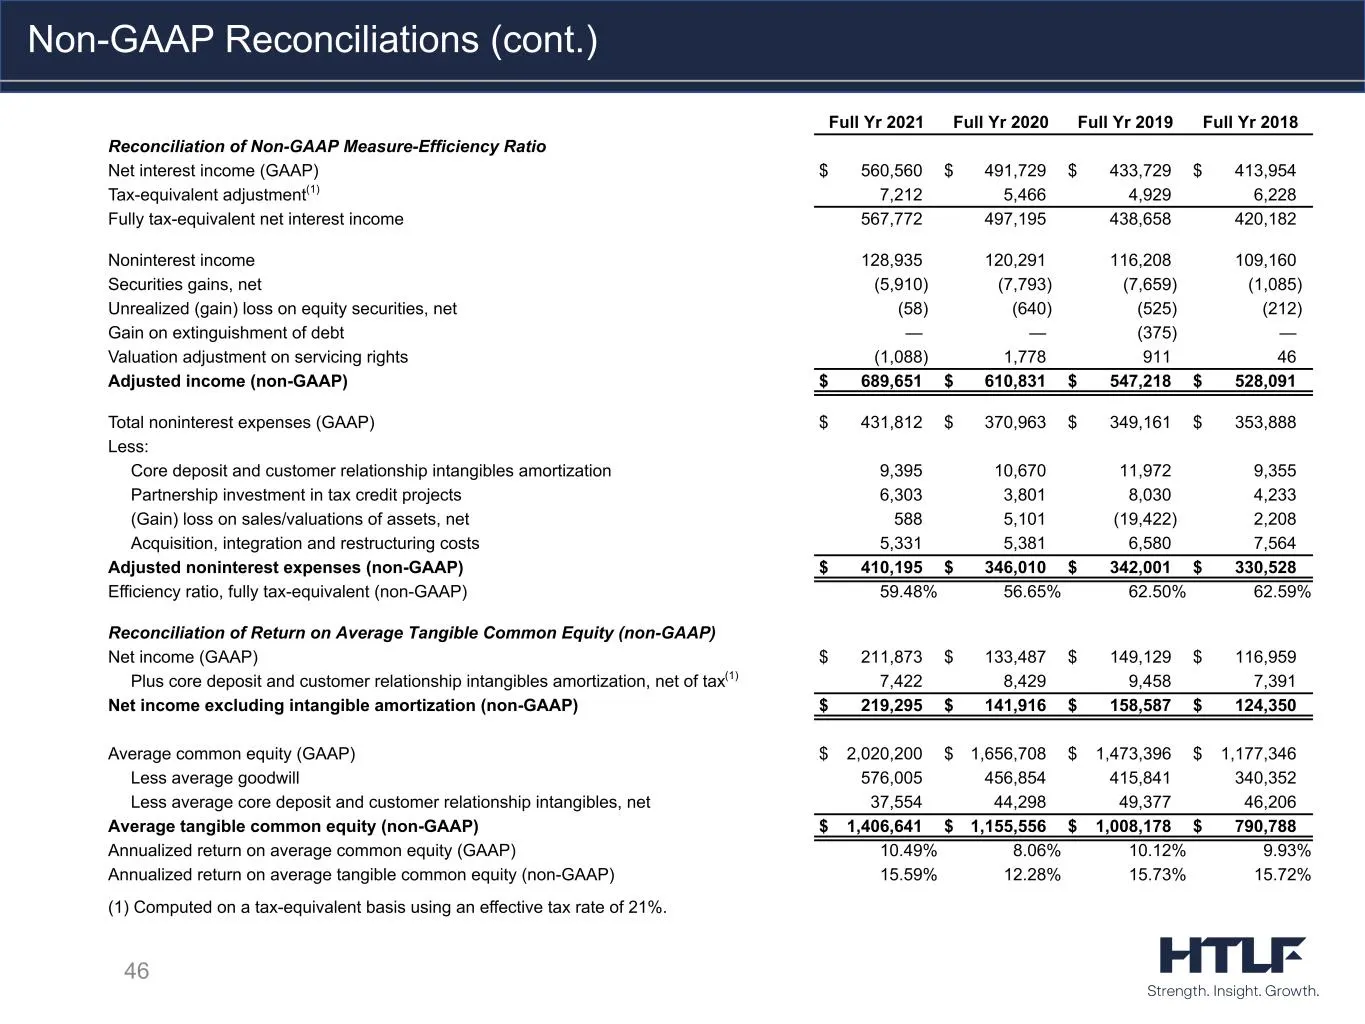
46 Non-GAAP Reconciliations (cont.) Full Yr 2021 Full Yr 2020 Full Yr 2019 Full Yr 2018 Reconciliation of Non-GAAP Measure-Efficiency Ratio Net interest income (GAAP) $ 560,560 $ 491,729 $ 433,729 $ 413,954 Tax-equivalent adjustment(1) 7,212 5,466 4,929 6,228 Fully tax-equivalent net interest income
Slide 47: Non-GAAP Reconciliations (cont.)
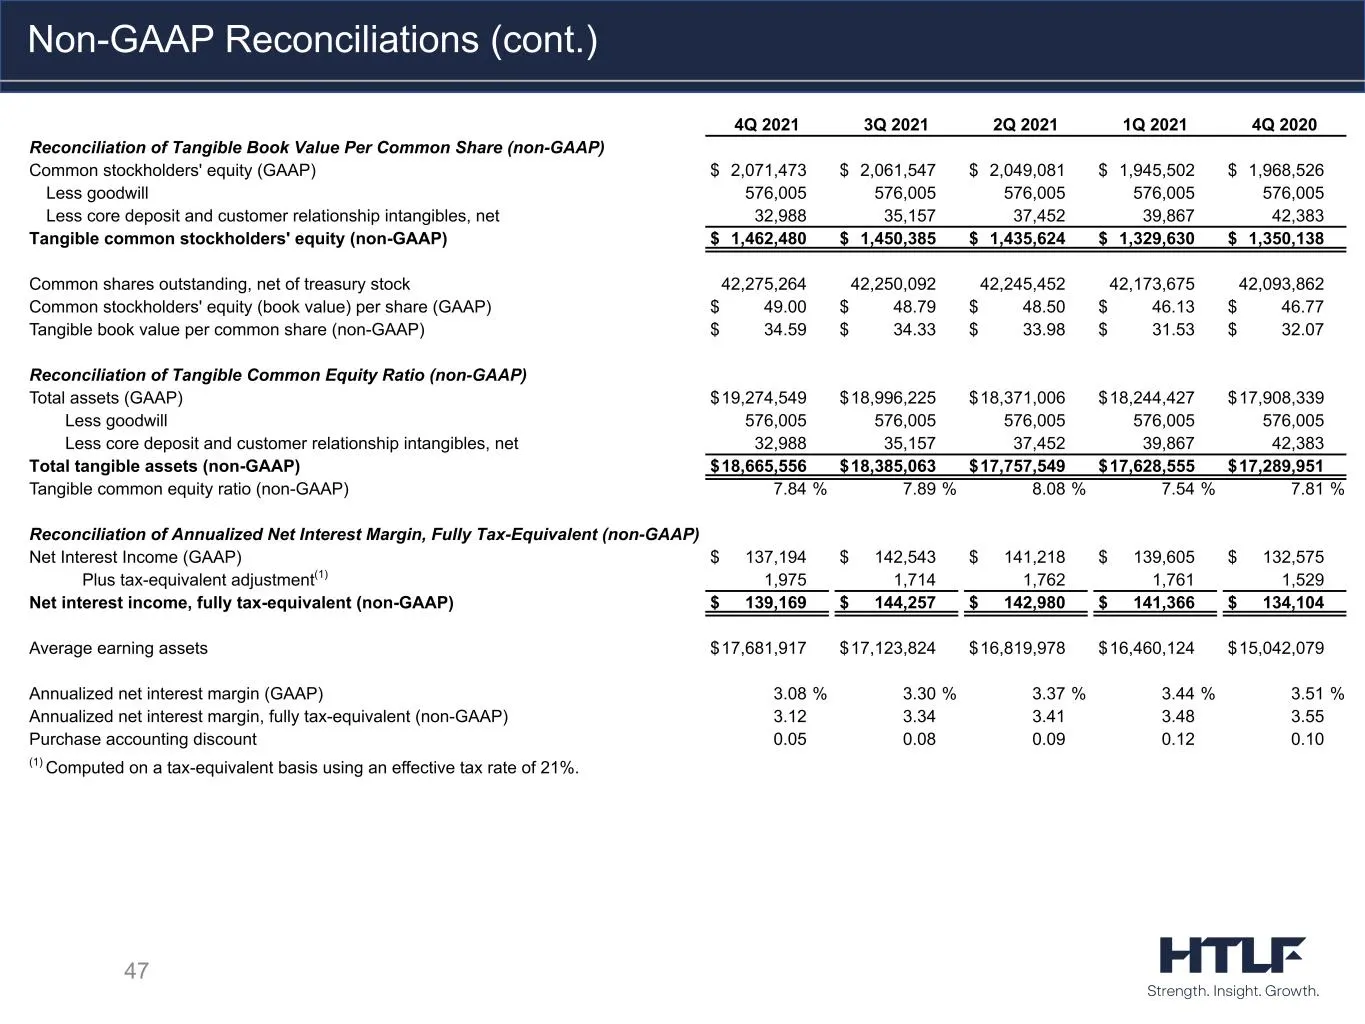
47 Non-GAAP Reconciliations (cont.) 4Q 2021 3Q 2021 2Q 2021 1Q 2021 4Q 2020 Reconciliation of Tangible Book Value Per Common Share (non-GAAP) Common stockholders' equity (GAAP) $ 2,071,473 $ 2,061,547 $ 2,049,081 $ 1,945,502 $ 1,968,526 Less goodwill 576,005 576,005 576,005 576,005 576,005 Less core
Slide 48: Non-GAAP Reconciliations (cont.)
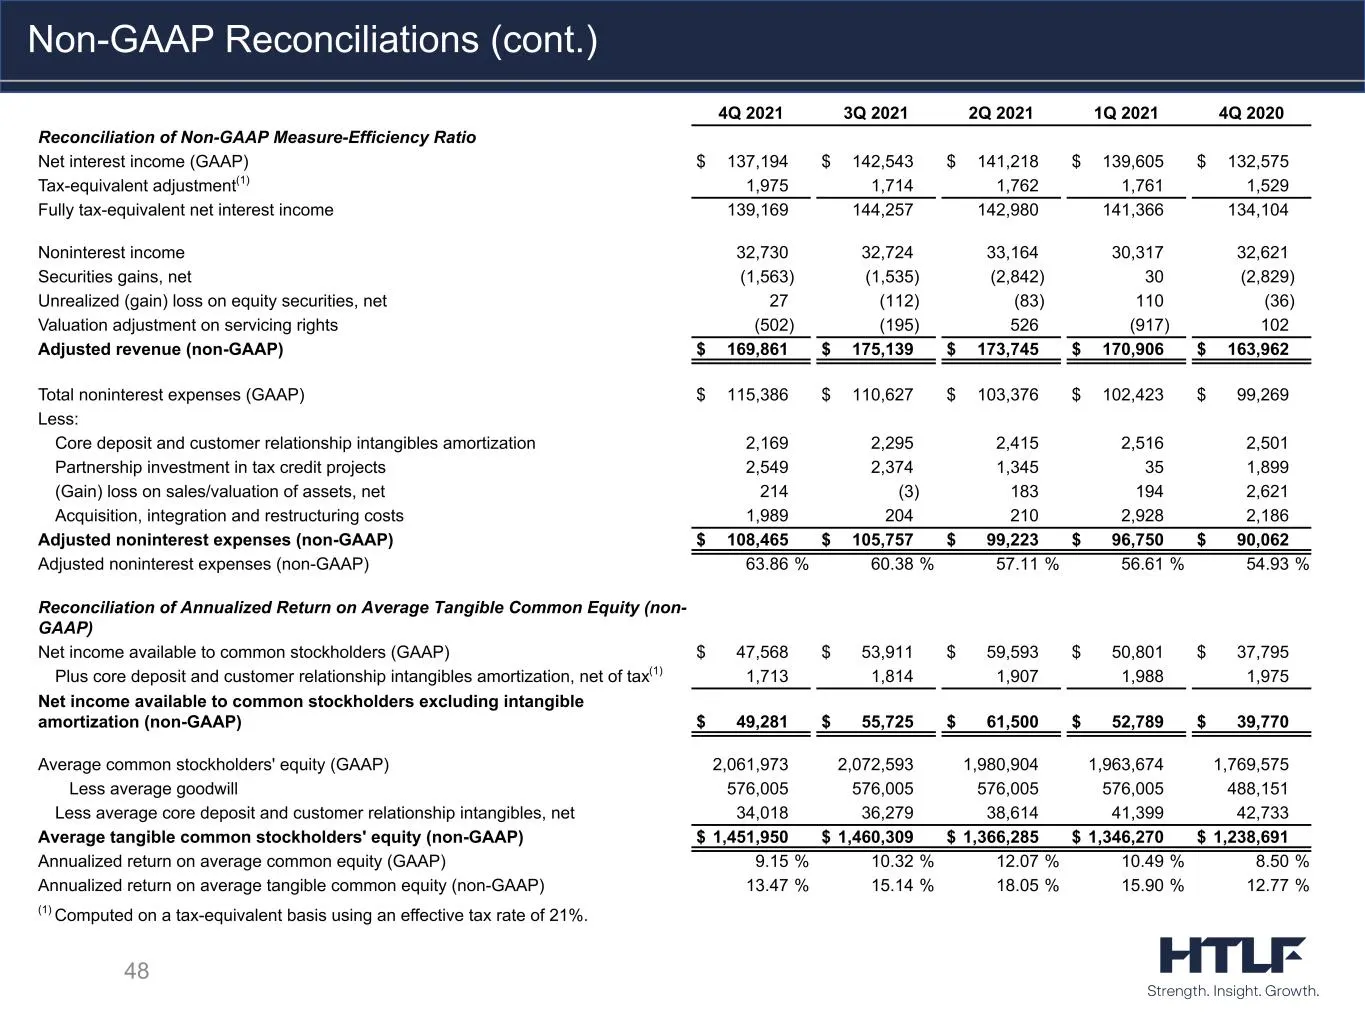
48 Non-GAAP Reconciliations (cont.) 4Q 2021 3Q 2021 2Q 2021 1Q 2021 4Q 2020 Reconciliation of Non-GAAP Measure-Efficiency Ratio Net interest income (GAAP) $ 137,194 $ 142,543 $ 141,218 $ 139,605 $ 132,575 Tax-equivalent adjustment(1) 1,975 1,714 1,762 1,761 1,529 Fully tax-equivalent net interest in
Source: SEC EDGAR · 8-K filed Jan 31, 2022
More decks from Heartland Financial USA Inc
 Merger or Acquisition (July 2024)6 slides · Jul 31, 2024
 Merger or Acquisition (May 2024)6 slides · May 2, 2024
 Merger or Acquisition (May 2024)27 slides · May 2, 2024
 Q4 2023 Earnings Presentation54 slides · Feb 13, 2024
 Q4 2023 Earnings Presentation35 slides · Jan 29, 2024
 Q3 2023 Earnings Presentation55 slides · Nov 15, 2023