PowerSecure International — Investor Presentation (November 2008)
27 slides from PowerSecure International's investor presentation, Nov 14, 2008

Slide 1: PowerSecure
Power Weatine November 14, 2008
Slide 2: Forward Looking Statements Safe Harbor
Forward Looking Statements Safe Harbor All forward-looking statements made in this presentation are made under the safe harbor provisions of the Private Securities Litigation Reform Act of 1995. Forward-looking statements, which are all statements other than statements of historical facts and includ
Slide 3: Who is PowerSecure?
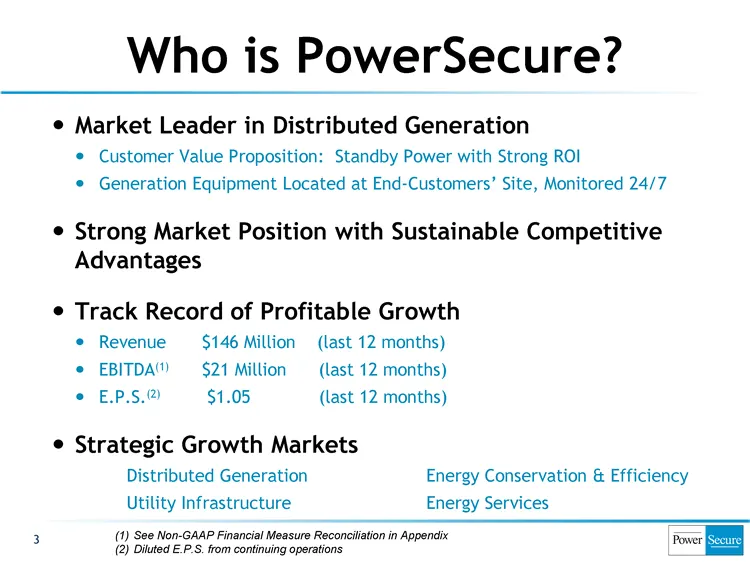
3 Who is PowerSecure? Market Leader in Distributed Generation Customer Value Proposition: Standby Power with Strong ROI Generation Equipment Located at End-Customers' Site, Monitored 24/7 Strong Market Position with Sustainable Competitive Advantages Track Record of Profitable Growth Revenue $146 Mi
Slide 4: The Electric-Power Industry Is Large and Growing
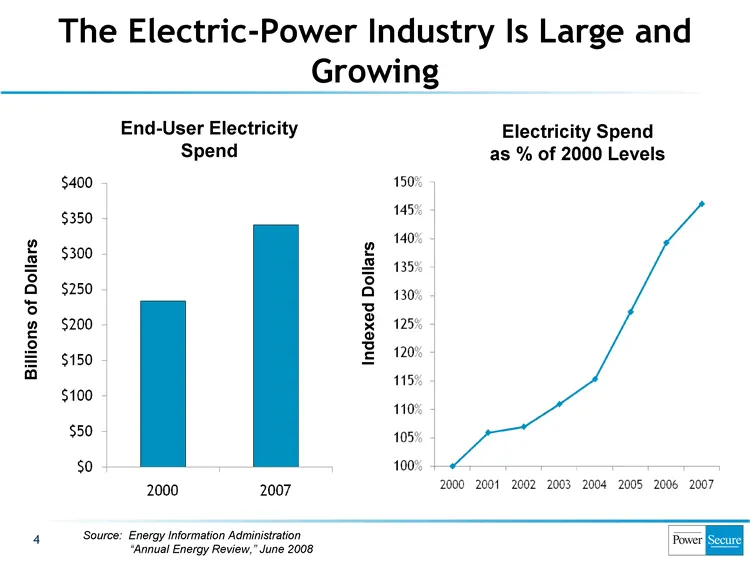
4 4 Indexed Dollars Source: Energy Information Administration “Annual Energy Review,” June 2008 Electricity Spend as % of 2000 Levels Billions of Dollars End-User Electricity Spend The Electric-Power Industry Is Large and Growing
Slide 5: But Electric Utilities Face Limits on How Quickly They Can Respond
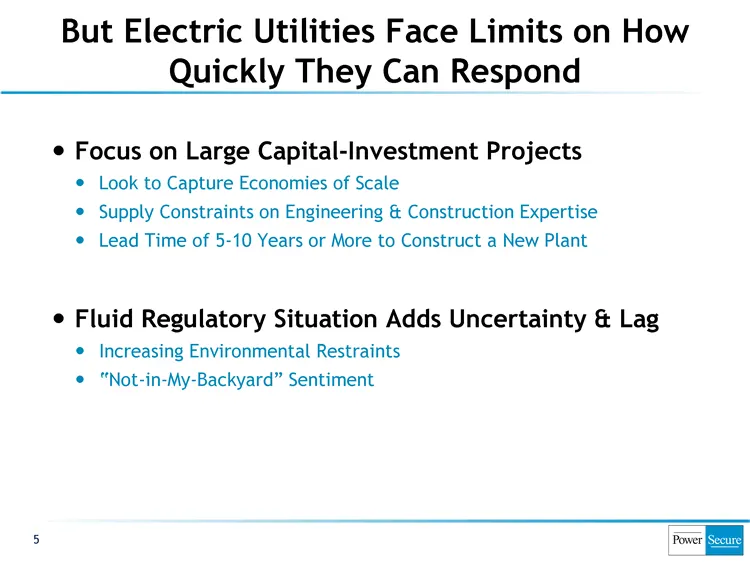
But Electric Utilities Face Limits on How Quickly They Can Respond Focus on Large Capital-Investment Projects Look to Capture Economies of Scale Supply Constraints on Engineering & Construction Expertise Lead Time of 5-10 Years or More to Construct a New Plant Fluid Regulatory Situation Adds Uncerta
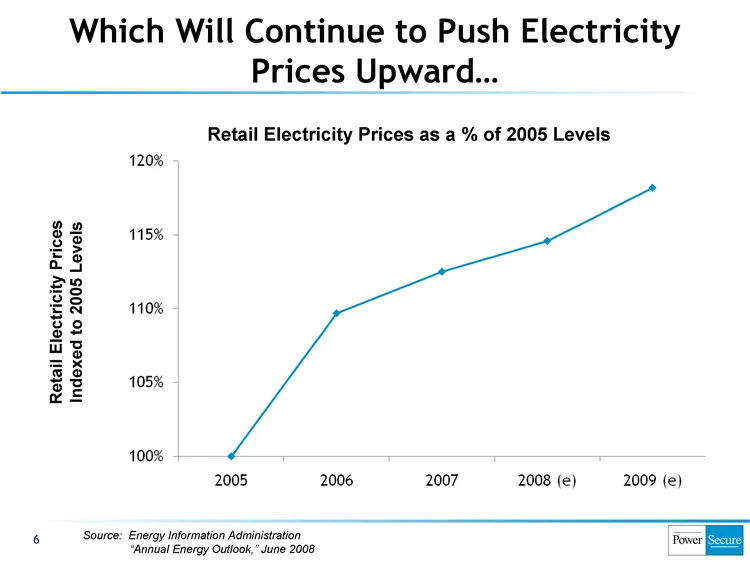
Slide 6: Which Will Continue to Push Electricity Prices Upward
6 Retail Electricity Prices as a % of 2005 Levels Retail Electricity Prices Indexed to 2005 Levels Source: Energy Information Administration "Annual Energy Outlook," June 2008 Which Will Continue to Push Electricity Prices Upward...
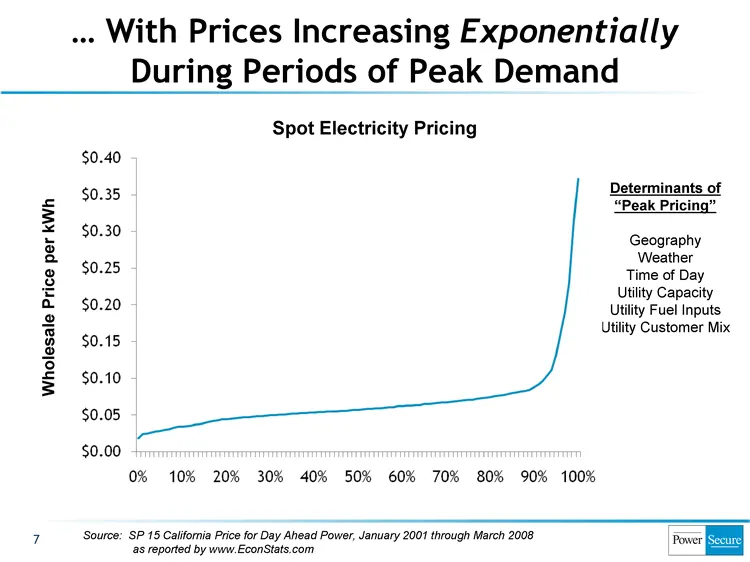
Slide 7: With Prices Increasing Exponentially During Periods of Peak Demand
Determinants of "Peak Pricing" Geography Weather Time of Day Utility Capacity Utility Fuel Inputs Utility Customer Mix 7 Spot Electricity Pricing Wholesale Price per kWh % of Time Price Level Exists Source: SP 15 California Price for Day Ahead Power, January 2001 through March 2008 as reported by ww
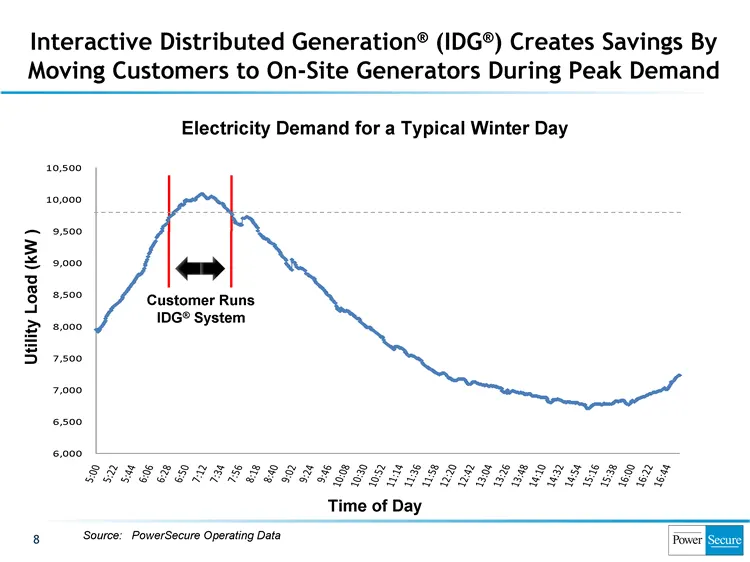
Slide 8: Interactive Distributed Generation Creates Savings By Moving Customers to On-Site Generators
8 Source: PowerSecure Operating Data Customer Runs IDG(r) System Utility Load (kW ) Time of Day Retail Electricity Prices Indexed to 2005 Levels Electricity Demand for a Typical Winter Day Interactive Distributed Generation(r) (IDG(r)) Creates Savings By Moving Customers to On-Site Generators During
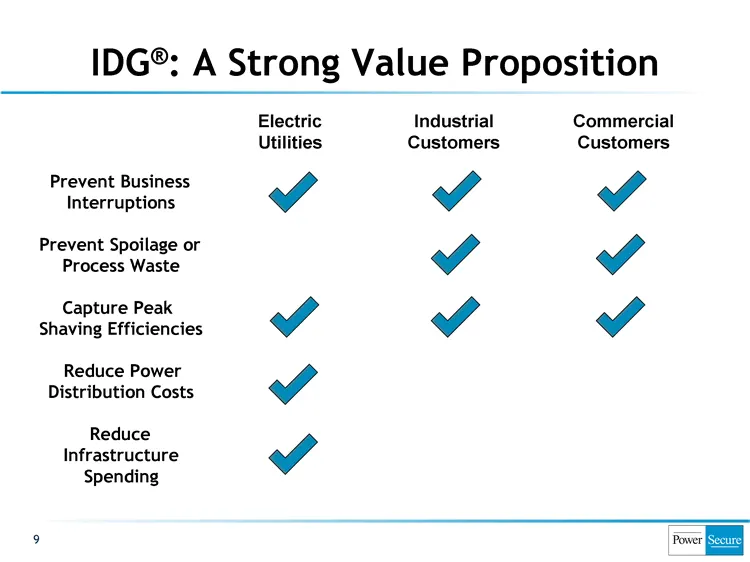
Slide 9: IDG: A Strong Value Proposition
9 Prevent Business Interruptions Prevent Spoilage or Process Waste Capture Peak Shaving Efficiencies Reduce Power Distribution Costs Reduce Infrastructure Spending Electric Utilities Industrial Customers Commercial Customers IDG(r): A Strong Value Proposition
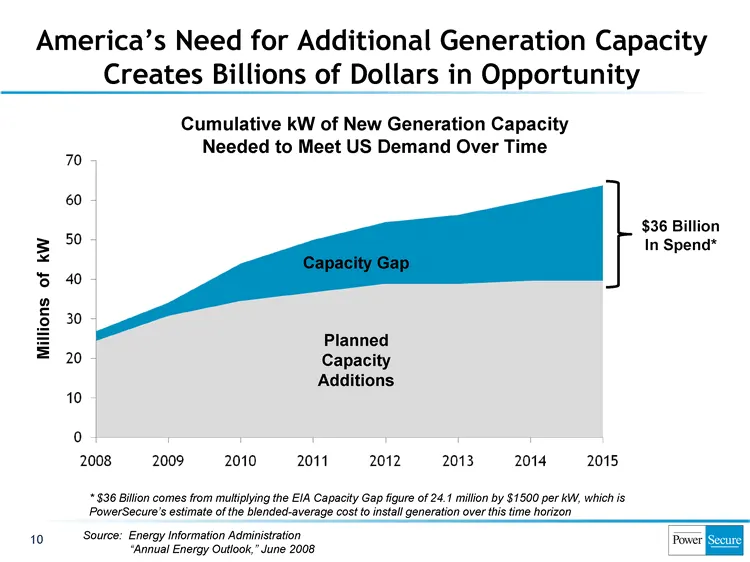
Slide 10: America's Need for Additional Generation Capacity Creates Billions in Opportunity
10 Cumulative kW of New Generation Capacity Needed to Meet US Demand Over Time Millions of kW America's Need for Additional Generation Capacity Creates Billions of Dollars in Opportunity Capacity Gap $36 Billion In Spend* * $36 Billion comes from multiplying the EIA Capacity Gap figure of 24.1 milli
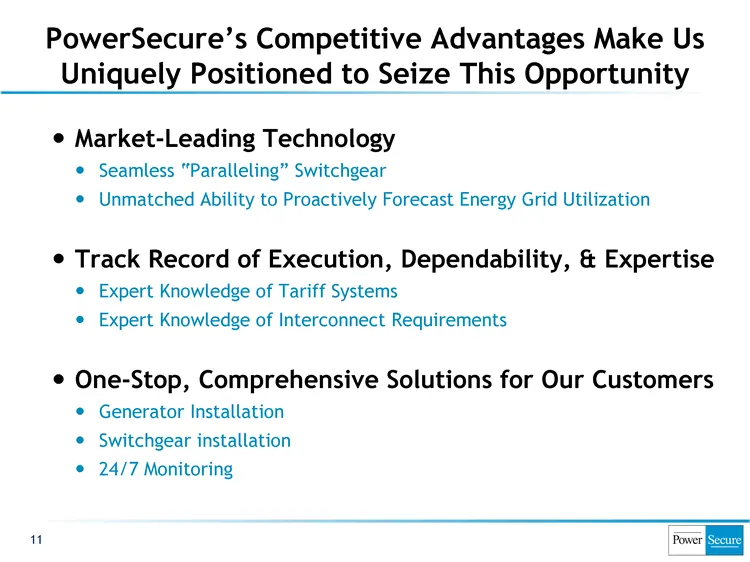
Slide 11: PowerSecure's Competitive Advantages Make Us Uniquely Positioned
11 Market-Leading Technology Seamless "Paralleling" Switchgear Unmatched Ability to Proactively Forecast Energy Grid Utilization Track Record of Execution, Dependability, & Expertise Expert Knowledge of Tariff Systems Expert Knowledge of Interconnect Requirements One-Stop, Comprehensive Solutions fo
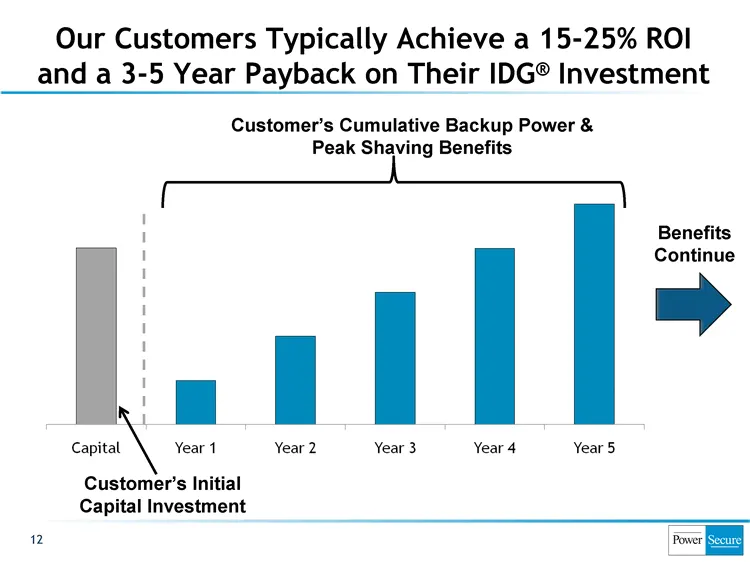
Slide 12: Customers Typically Achieve a 15-25% ROI and 3-5 Year Payback
Our Customers Typically Achieve a 15-25% ROI and a 3-5 Year Payback on Their IDG(r) Investment 12 Benefits Continue Customer's Cumulative Backup Power & Peak Shaving Benefits Customer's Initial Capital Investment
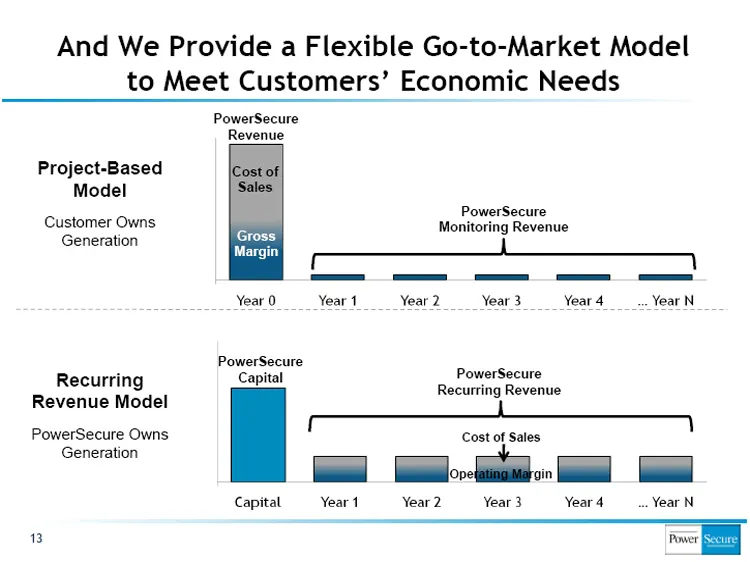
Slide 13: Flexible Go-to-Market Model: Recurring Revenue and Project-Based
13 Recurring Revenue Model PowerSecure Owns Generation PowerSecure Monitoring Revenue And We Provide a Flexible Go-to-Market Model to Meet Customers' Economic Needs Project-Based Model Customer Owns Generation PowerSecure Recurring Revenue PowerSecure Revenue Cost of Sales Gross Margin PowerSecure C
Slide 14: Established a Strong Track Record of Market Leadership
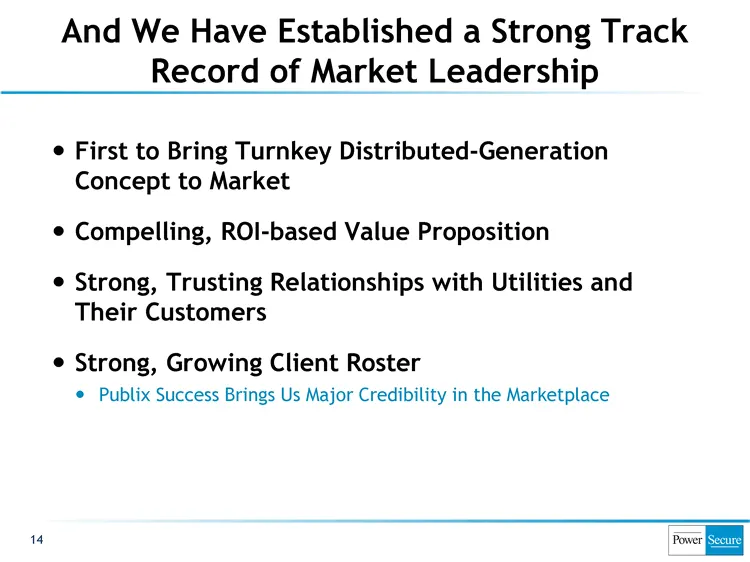
First to Bring Turnkey Distributed-Generation Concept to Market Compelling, ROI-based Value Proposition Strong, Trusting Relationships with Utilities and Their Customers Strong, Growing Client Roster Publix Success Brings Us Major Credibility in the Marketplace 14 And We Have Established a Strong Tr
Slide 15: Successfully Diversified Our Customer Base
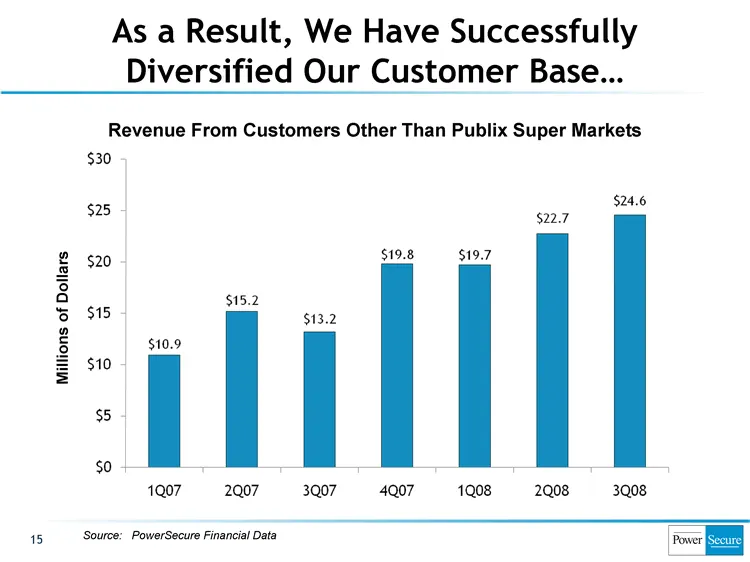
15 Revenue From Customers Other Than Publix Super Markets Millions of Dollars As a Result, We Have Successfully Diversified Our Customer Base... Source: PowerSecure Financial Data
Slide 16: Built a Portfolio of Complementary Businesses
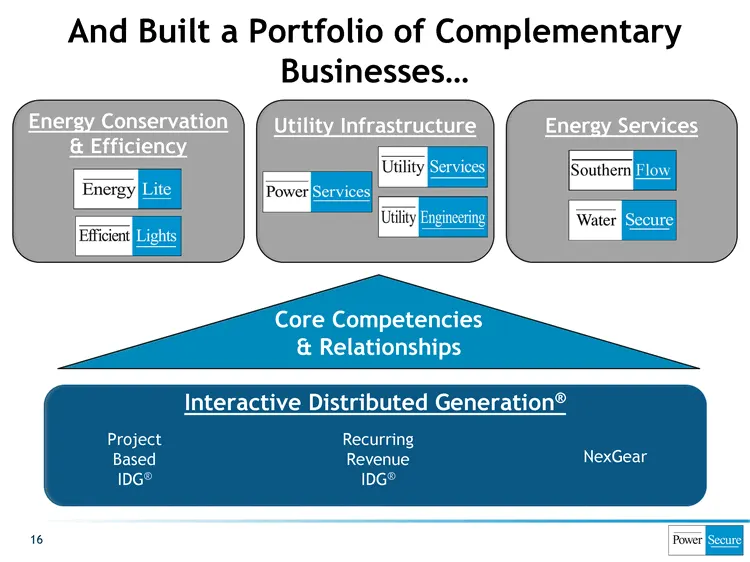
16 Interactive Distributed Generation(r) Core Competencies & Relationships Energy Conservation & Efficiency Energy Services Project Based IDG(r) Recurring Revenue IDG(r) NexGear And Built a Portfolio of Complementary Businesses... Utility Infrastructure
Slide 17: While Demonstrating Profitable Growth
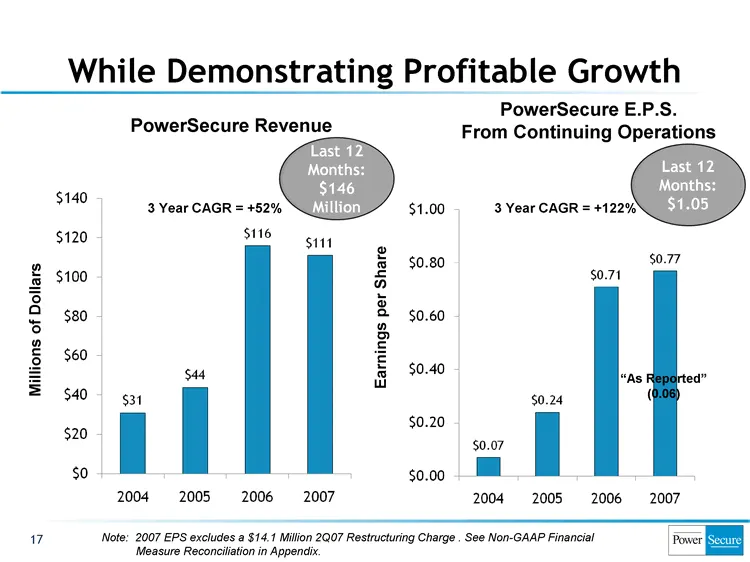
Note: 2007 EPS excludes a $14.1 Million 2Q07 Restructuring Charge . See Non-GAAP Financial Measure Reconciliation in Appendix. 17 PowerSecure Revenue PowerSecure E.P.S. From Continuing Operations Millions of Dollars Earnings per Share 3 Year CAGR = +52% 3 Year CAGR = +122% "As Reported" (0.06) While
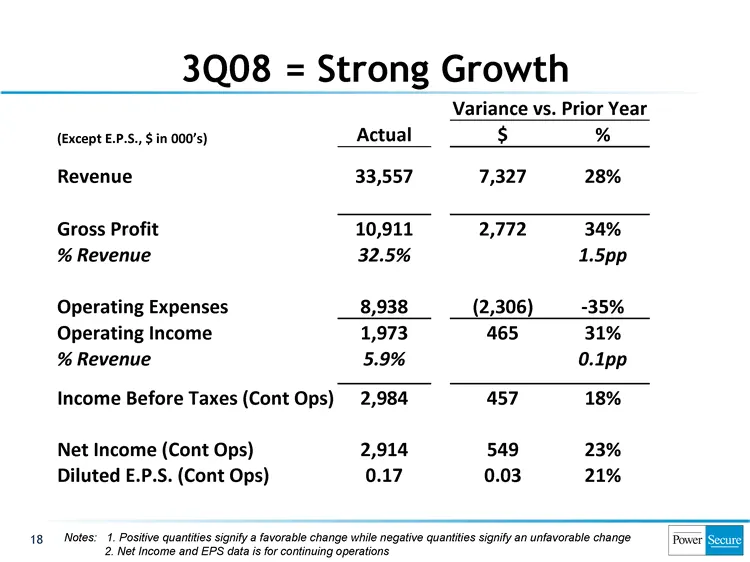
Slide 18: 3Q08 = Strong Growth
3Q08 = Strong Growth 18 Notes: 1. Positive quantities signify a favorable change while negative quantities signify an unfavorable change 2. Net Income and EPS data is for continuing operations Variance vs. Prior Year Variance vs. Prior Year (Except E.P.S., $ in 000's) Actual $ % Revenue 33,557 7,327
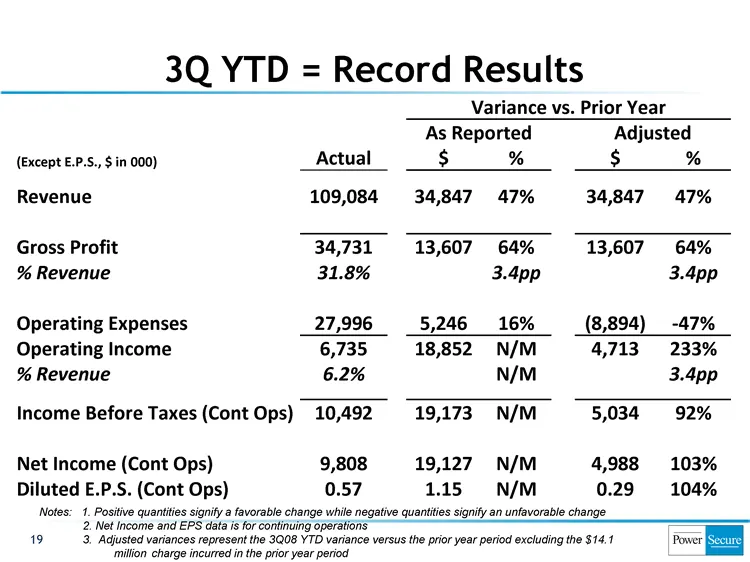
Slide 19: 3Q YTD = Record Results
3Q YTD = Record Results 19 Variance vs. Prior Year Variance vs. Prior Year Variance vs. Prior Year Variance vs. Prior Year Variance vs. Prior Year As Reported As Reported Adjusted Adjusted (Except E.P.S., $ in 000) Actual $ % $ % Revenue 109,084 34,847 47% 34,847 47% Gross Profit 34,731 13,607 64% 1
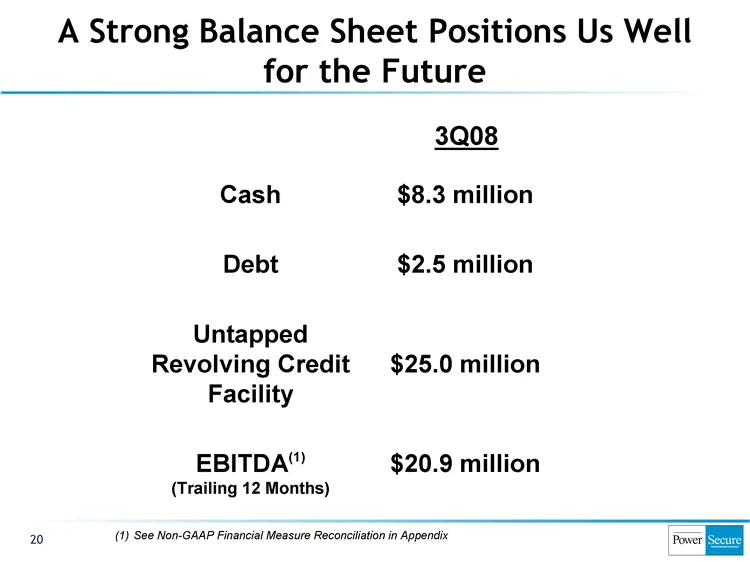
Slide 20: A Strong Balance Sheet Positions Us Well for the Future
20 A Strong Balance Sheet Positions Us Well for the Future Cash Debt Untapped Revolving Credit Facility EBITDA(1) (Trailing 12 Months) $8.3 million $2.5 million $25.0 million $20.9 million See Non-GAAP Financial Measure Reconciliation in Appendix 3Q08
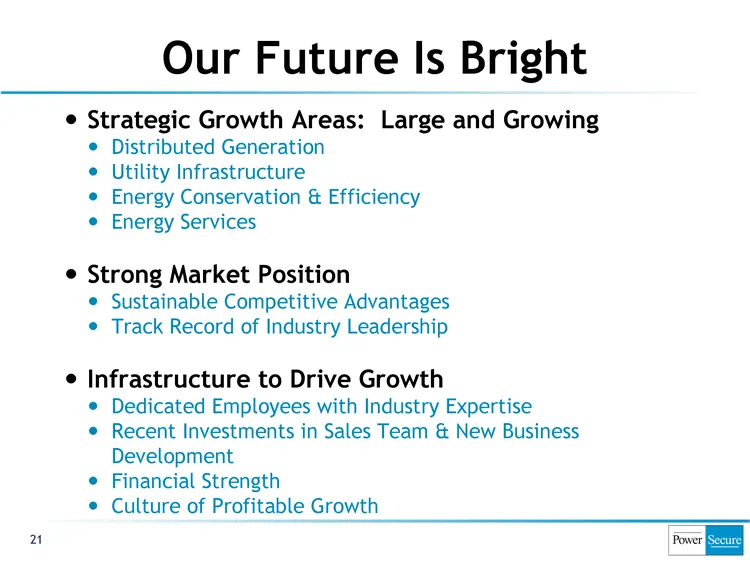
Slide 21: Our Future Is Bright
21 Strategic Growth Areas: Large and Growing Distributed Generation Utility Infrastructure Energy Conservation & Efficiency Energy Services Strong Market Position Sustainable Competitive Advantages Track Record of Industry Leadership Infrastructure to Drive Growth Dedicated Employees with Industry E

Slide 22: Questions?
NSADAQ: POWR (919) 556 3056 www.PowerSecure.com 22 Questions?
Slide 23: Appendix (Non-GAAP Measures)
Appendix (Non-GAAP Measures) 23
Slide 24: Non-GAAP Reconciliation: Income and E.P.S.
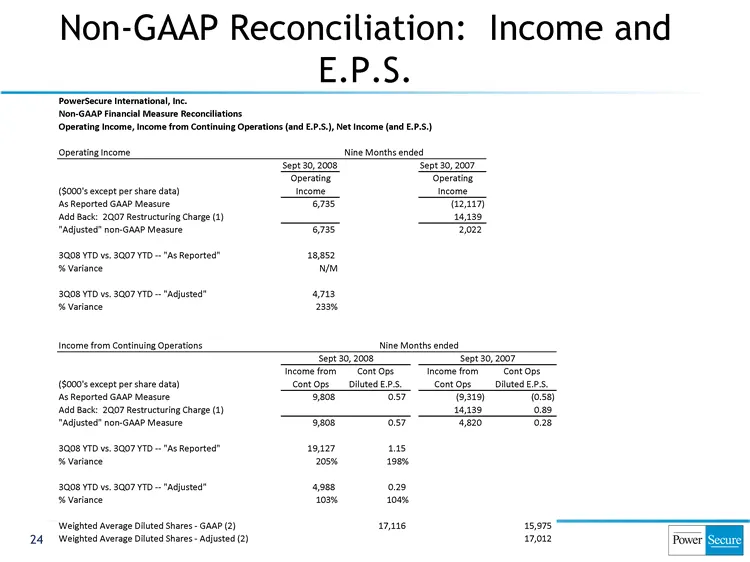
Non-GAAP Reconciliation: Income and E.P.S. 24 Operating Income, Income from Continuing Operations (and E.P.S.), Net Income (and E.P.S.) Operating Income Nine Months ended Sept 30, 2008 Sept 30, 2007 Operating Operating ($000's except per share data) Income Income As Reported GAAP Measure 6,735 (12,1
Slide 25: Non-GAAP Reconciliation: Income and E.P.S. (Cont'd)
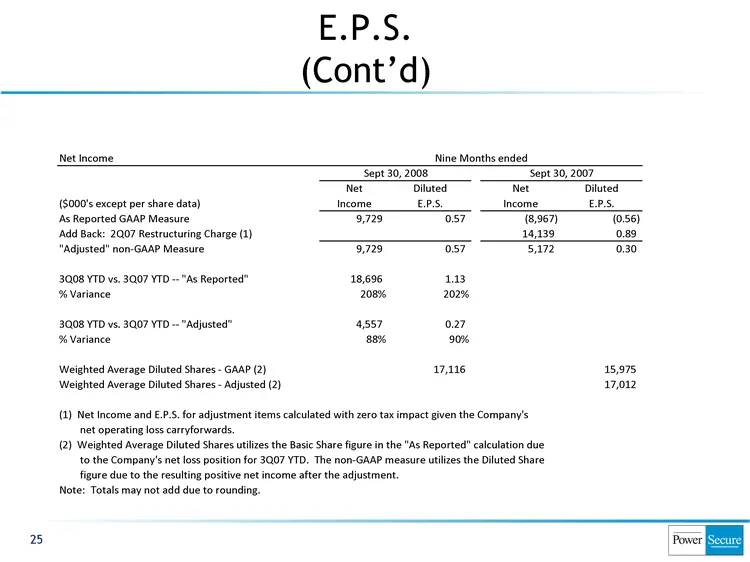
Non-GAAP Reconciliation: Income and E.P.S. (Cont'd) E.P.S. (Cont’d) 25 Net Income Nine Months ended Sept 30, 2008 Sept 30, 2007 Net Diluted Net Diluted ($000's except per share data) Income E.P.S. Income E.P.S. As Reported GAAP Measure 9,729 0.57 (8,967) (0.56) Add Back: 2Q07 Restructuring Charge (1
Slide 26: Non-GAAP Reconciliation: EBITDA
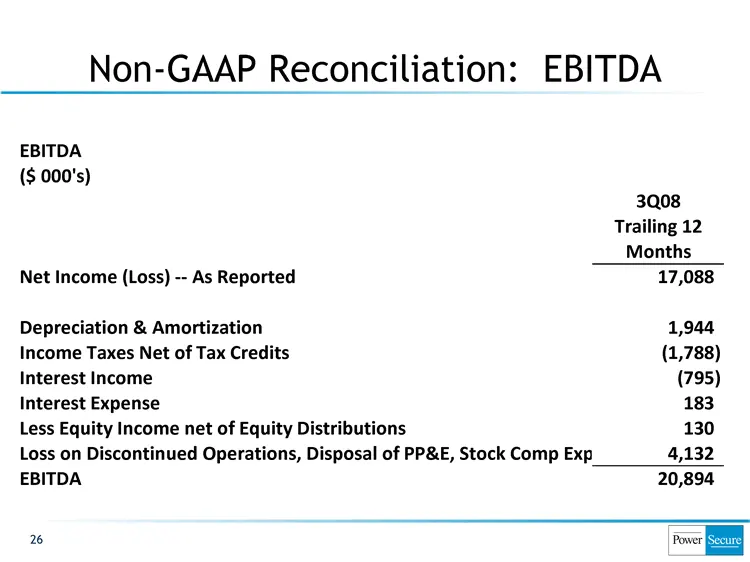
Non-GAAP Reconciliation: EBITDA Non-GAAP Reconciliation: EBITDA 26 EBITDA ($ 000's) 3Q08 Trailing 12 Months Net Income (Loss) -- As Reported 17,088 Depreciation & Amortization 1,944 Income Taxes Net of Tax Credits (1,788) Interest Income (795) Interest Expense 183 Less Equity Income net of Equity Di
Slide 27: Non-GAAP Financial Measures Definitions
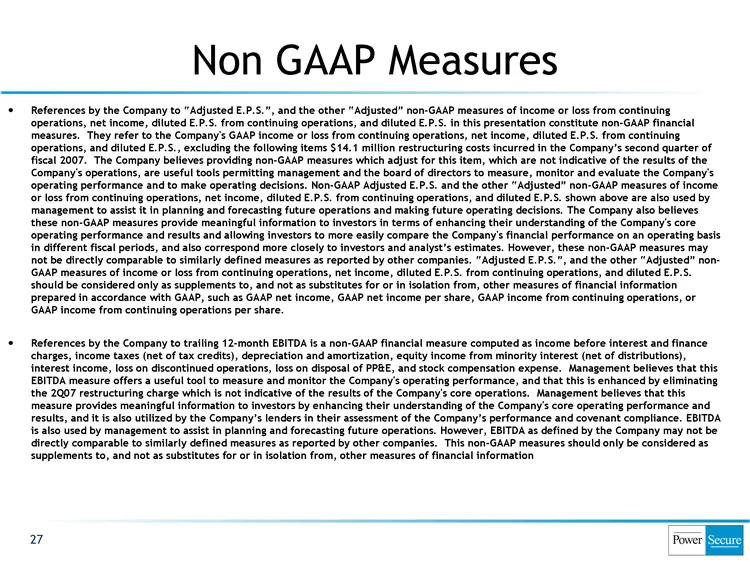
References by the Company to "Adjusted E.P.S.", and the other "Adjusted" non-GAAP measures of income or loss from continuing operations, net income, diluted E.P.S. from continuing operations, and diluted E.P.S. in this presentation constitute non-GAAP financial measures. They refer to the Company's
Source: SEC EDGAR · 8-K filed Nov 14, 2008
More decks from PowerSecure International Inc
 Investor Presentation (January 2016)19 slides · Jan 13, 2016
 Q3 2015 Earnings Presentation19 slides · Nov 9, 2015
 Investor Presentation (September 2015)19 slides · Sep 2, 2015
 Investor Presentation (August 2015)16 slides · Aug 10, 2015
 Investor Presentation (May 2015)21 slides · May 26, 2015
 Investor Presentation (May 2015)18 slides · May 6, 2015