Sterling Financial Corp
Sterling Financial — Q2 2013 Earnings Presentation
8 slides from Sterling Financial's earnings presentation, Jul 25, 2013
Slide 1: Earnings Release Supplement For the Quarter Ended June 30, 2013
Earnings Release Supplement For the Quarter Ended June 30, 2013 July 25, 2013
Slide 2: Safe Harbor
Safe Harbor (1) The Reform Act defines the term "forward-looking statements" to include: statements of management plans and objectives, statements regarding the future economic performance, and projections of revenues and other financial data, among others. The Reform Act precludes liability for ora
Slide 3: Mortgage Banking Operations
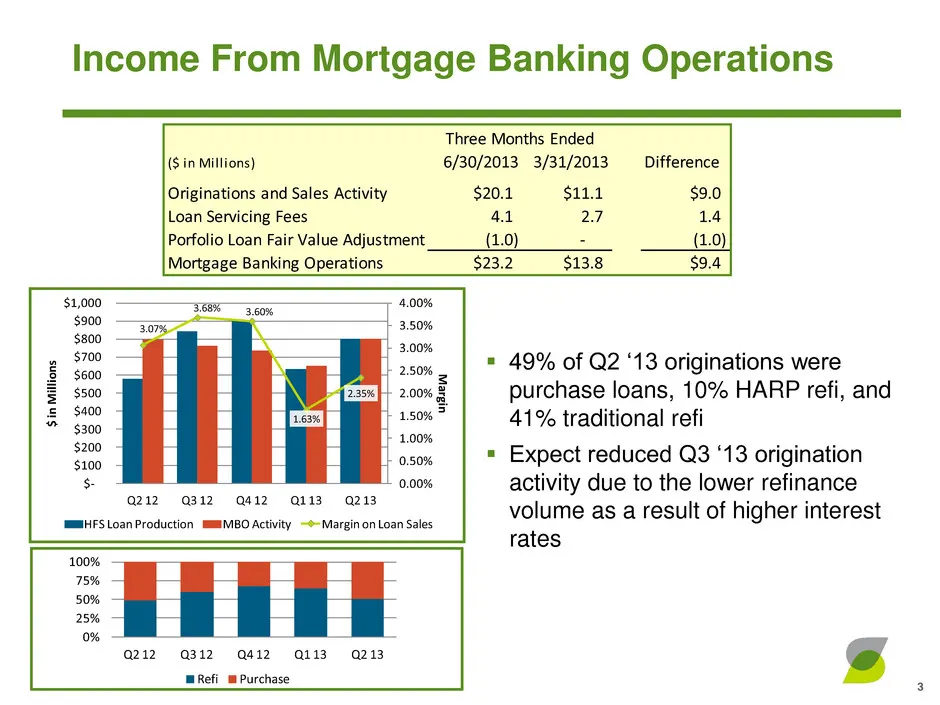
($ in Millions) 6/30/2013 3/31/2013 Difference Originations and Sales Activity $20.1 $11.1 $9.0 Loan Servicing Fees 4.1 2.7 1.4 Porfolio Loan Fair Value Adjustment (1.0) - (1.0) Mortgage Banking Operations $23.2 $13.8 $9.4 Three Months Ended 3.07% 3.68% 3.60% 1.63% 2.35% 0.00% 0.50% 1.00% 1.50% 2.00
Slide 4: Personnel Expense
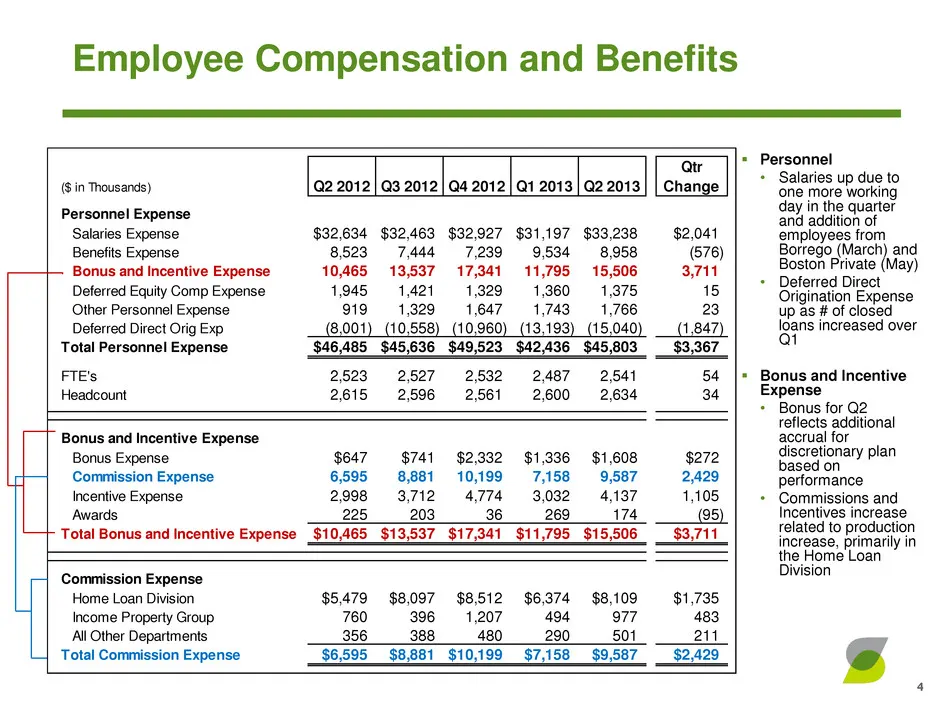
($ in Thousands) Q2 2012 Q3 2012 Q4 2012 Q1 2013 Q2 2013 Qtr Change Personnel Expense Salaries Expense $32,634 $32,463 $32,927 $31,197 $33,238 $2,041 Benefits Expense 8,523 7,444 7,239 9,534 8,958 (576) Bonus and Incentive Expense 10,465 13,537 17,341 11,795 15,506 3,711 Deferred Equity Comp Expense
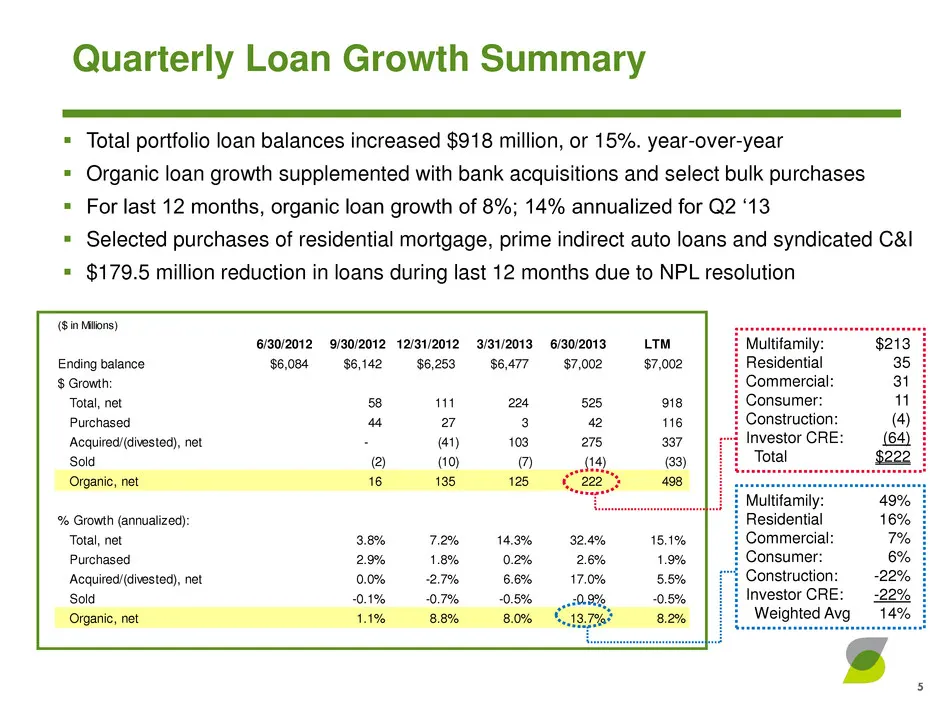
Slide 5: Quarterly Loan Growth Summary
($ in Millions) 6/30/2012 9/30/2012 12/31/2012 3/31/2013 6/30/2013 LTM Ending balance $6,084 $6,142 $6,253 $6,477 $7,002 $7,002 $ Growth: Total, net 58 111 224 525 918 Purchased 44 27 3 42 116 Acquired/(divested), net - (41) 103 275 337 Sold (2) (10) (7) (14) (33) Organic, net 16 135 125 222 498 % G
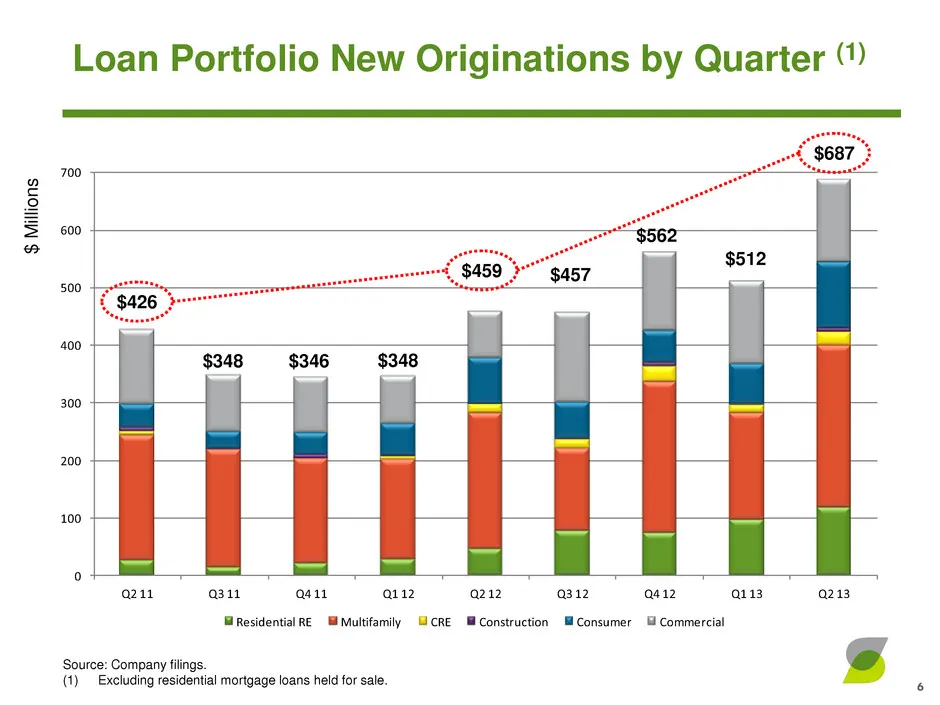
Slide 6: Loan Portfolio New Originations by Quarter
0 100 200 300 400 500 600 700 Q2 11 Q3 11 Q4 11 Q1 12 Q2 12 Q3 12 Q4 12 Q1 13 Q2 13 Residential RE Multifamily CRE Construction Consumer Commercial 6 $348 $346 $348 $426 Source: Company filings. (1) Excluding residential mortgage loans held for sale. Loan Portfolio New Originations by Quarter (1) $5
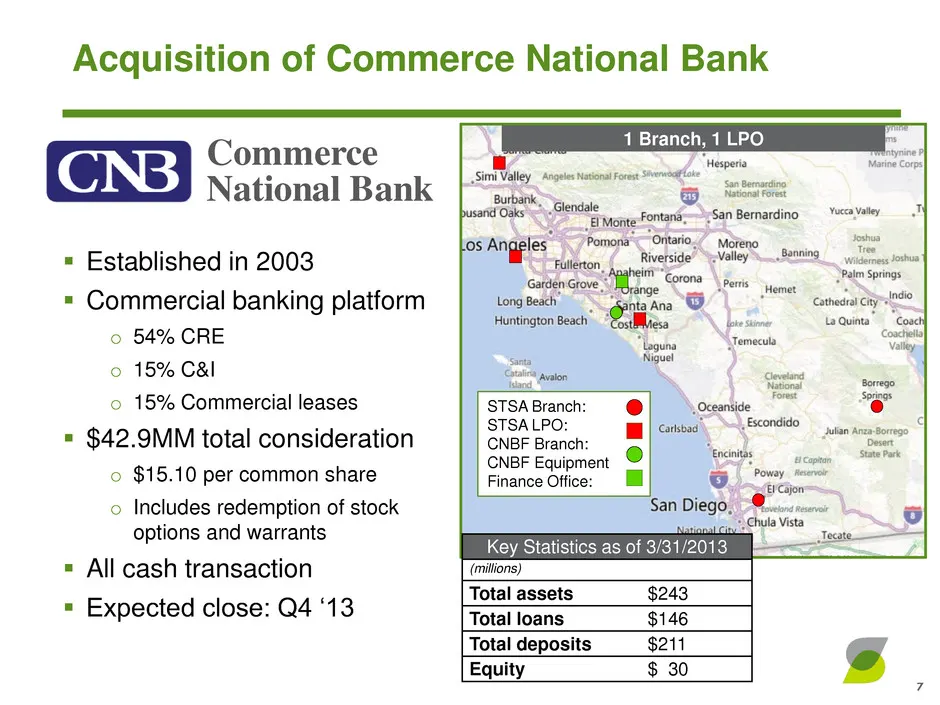
Slide 7: Acquisition of Commerce National Bank
Key Statistics as of 3/31/2013 (millions) Total assets $243 Total loans $146 Total deposits $211 Equity $ 30 Acquisition of Commerce National Bank 7 Established in 2003 Commercial banking platform o 54% CRE o 15% C&I o 15% Commercial leases $42.9MM total consideration o $15.10 per common share
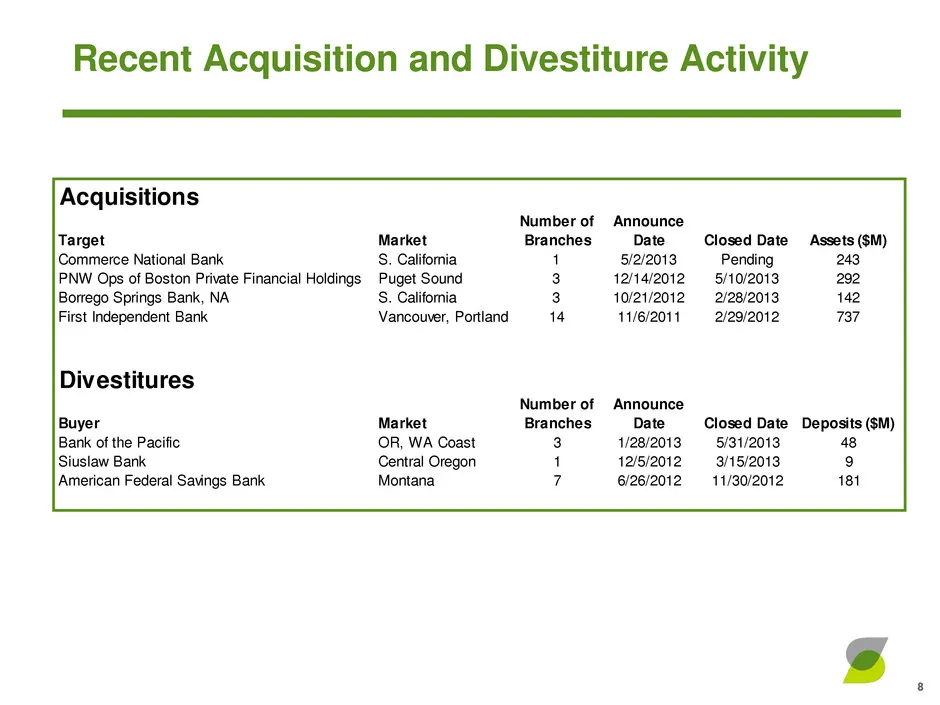
Slide 8: Recent Acquisition and Divestiture Activity
Acquisitions Target Market Number of Branches Announce Date Closed Date Assets ($M) Commerce National Bank S. California 1 5/2/2013 Pending 243 PNW Ops of Boston Private Financial Holdings Puget Sound 3 12/14/2012 5/10/2013 292 Borrego Springs Bank, NA S. California 3 10/21/2012 2/28/2013 142 First
Source: SEC EDGAR · 8-K filed Jul 25, 2013
More decks from Sterling Financial Corp
 Q3 2013 Earnings Presentation6 slides · Oct 24, 2013
 Merger or Acquisition (September 2013)20 slides · Sep 12, 2013
 Merger or Acquisition (September 2013)20 slides · Sep 12, 2013
 Q2 2013 Earnings Presentation27 slides · Jul 30, 2013
 Q1 2013 Earnings Presentation30 slides · May 7, 2013
 Q1 2013 Earnings Presentation6 slides · Apr 24, 2013