Sterling Financial Corp
Sterling Financial — Q1 2013 Earnings Presentation
6 slides from Sterling Financial's earnings presentation, Apr 24, 2013
Slide 1: Earnings Release Supplement For the Quarter Ended March 31, 2013
Earnings Release Supplement For the Quarter Ended March 31, 2013 April 24, 2013
Slide 2: Safe Harbor
Safe Harbor (1) The Reform Act defines the term "forward-looking statements" to include: statements of management plans and objectives, statements regarding the future economic performance, and projections of revenues and other financial data, among others. The Reform Act precludes liability for ora
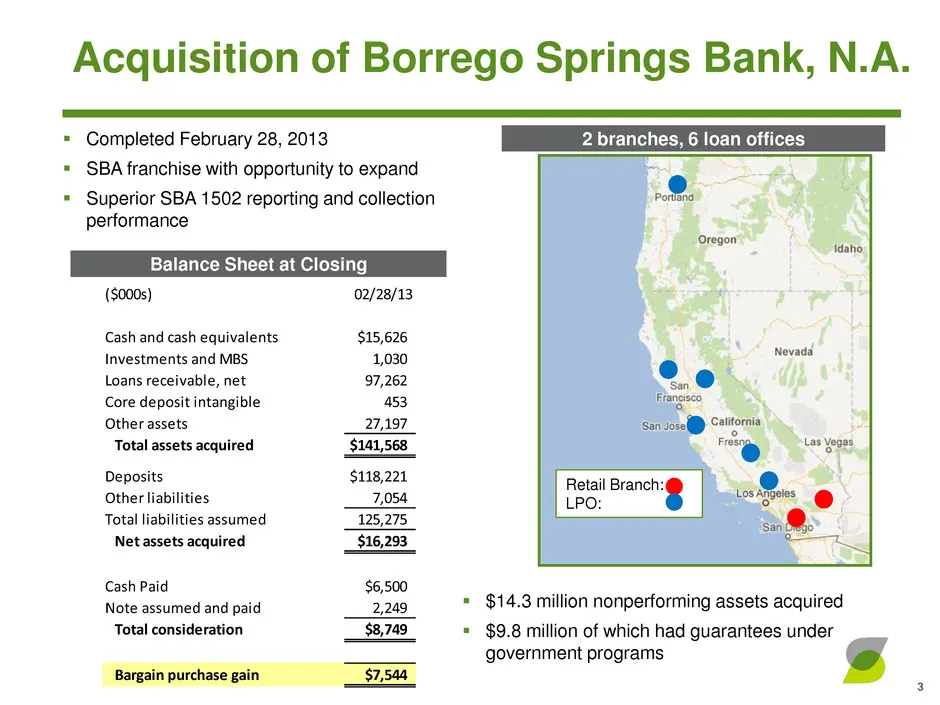
Slide 3: Acquisition of Borrego Springs Bank, N.A.
($000s) 02/28/13 Cash and cash equivalents $15,626 Investments and MBS 1,030 Loans receivable, net 97,262 Core deposit intangible 453 Other assets 27,197 Total assets acquired $141,568 Deposits $118,221 Other liabilities 7,054 Total liabilities assumed 125,275 Net assets acquired $16,293 Cash Paid $
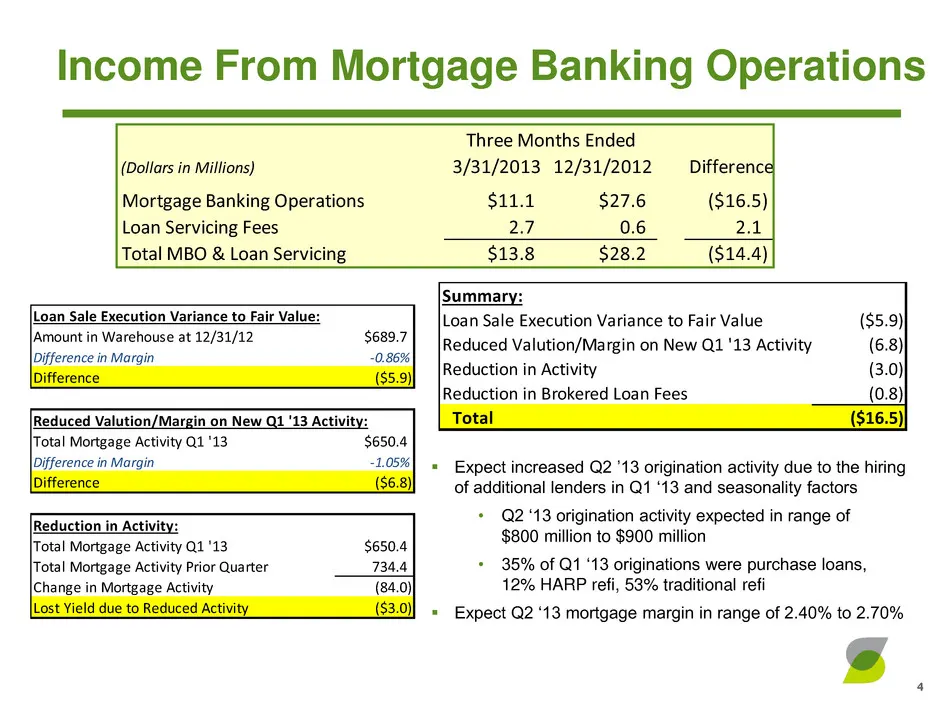
Slide 4: Income From Mortgage Banking Operations
Summary: Loan Sale Execution Variance to Fair Value ($5.9) Reduced Valution/Margin on New Q1 '13 Activity (6.8) Reduction in Activity (3.0) Reduction in Brokered Loan Fees (0.8) Total ($16.5) Income From Mortgage Banking Operations 4 (Dollars in Millions) 3/31/2013 12/31/2012 Difference Mortgage Ban
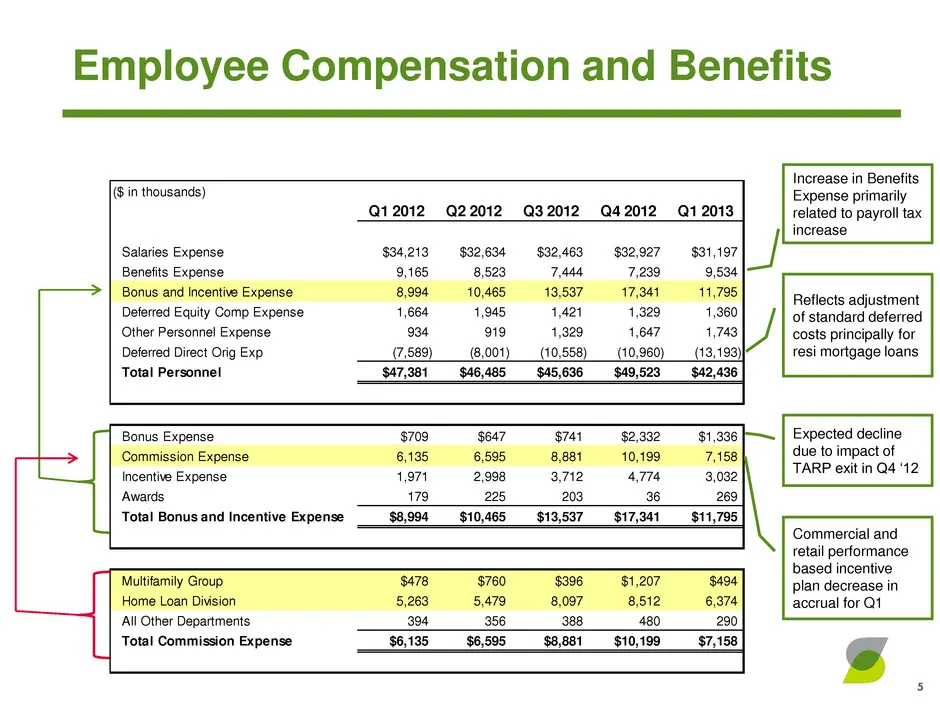
Slide 5: Personnel and Bonus Expense Detail
($ in thousands) Q1 2012 Q2 2012 Q3 2012 Q4 2012 Q1 2013 Salaries Expense $34,213 $32,634 $32,463 $32,927 $31,197 Benefits Expense 9,165 8,523 7,444 7,239 9,534 Bonus and Incentive Expense 8,994 10,465 13,537 17,341 11,795 Deferred Equity Comp Expense 1,664 1,945 1,421 1,329 1,360 Other Personnel Ex
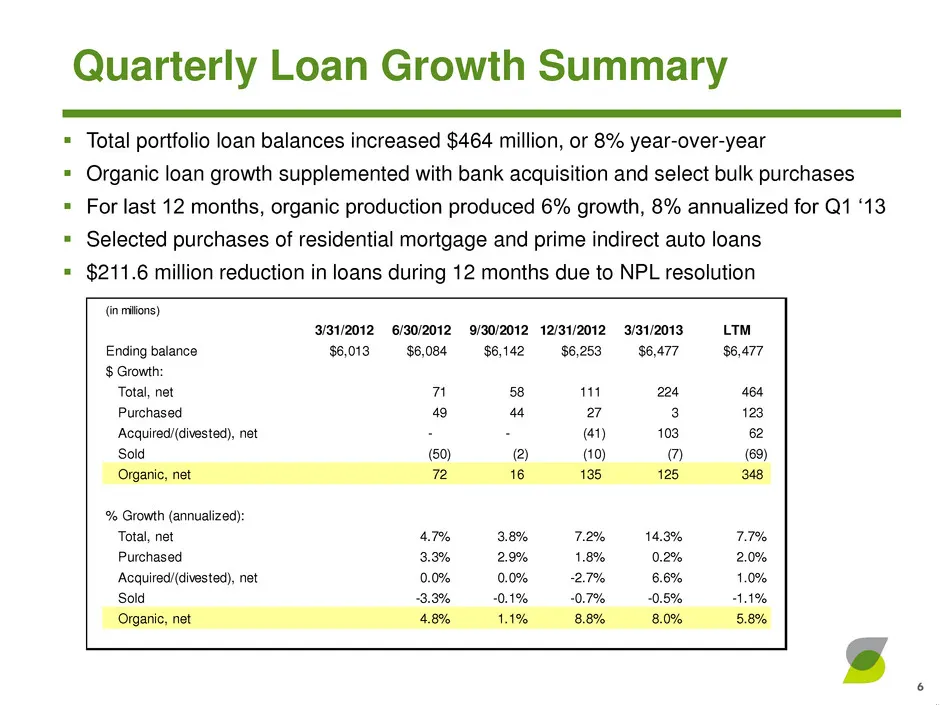
Slide 6: Quarterly Loan Growth Summary
(in millions) 3/31/2012 6/30/2012 9/30/2012 12/31/2012 3/31/2013 LTM Ending balance $6,013 $6,084 $6,142 $6,253 $6,477 $6,477 $ Growth: Total, net 71 58 111 224 464 Purchased 49 44 27 3 123 Acquired/(divested), net - - (41) 103 62 Sold (50) (2) (10) (7) (69) Organic, net 72 16 135 125 348 % Growth (
Source: SEC EDGAR · 8-K filed Apr 24, 2013
More decks from Sterling Financial Corp
 Q3 2013 Earnings Presentation6 slides · Oct 24, 2013
 Merger or Acquisition (September 2013)20 slides · Sep 12, 2013
 Merger or Acquisition (September 2013)20 slides · Sep 12, 2013
 Q2 2013 Earnings Presentation27 slides · Jul 30, 2013
 Q2 2013 Earnings Presentation8 slides · Jul 25, 2013
 Q1 2013 Earnings Presentation30 slides · May 7, 2013