Sterling Financial Corp
Sterling Financial — Q3 2013 Earnings Presentation
6 slides from Sterling Financial's earnings presentation, Oct 24, 2013
Slide 1: Earnings Release Supplement For the Quarter Ended September 30, 2013
Earnings Release Supplement For the Quarter Ended September 30, 2013 October 25, 2013
Slide 2: Important Information for Investors and Shareholders
Important Information for Investors and Shareholders 2 . This communication does not constitute an offer to sell or the solicitation of an offer to buy any securities or a solicitation of any vote or approval, nor shall there be any sale of securities in any jurisdiction in which such offer, solicit
Slide 3: Cautionary Statement Regarding Forward-Looking Statements
Cautionary Statement Regarding Forward-Looking Statements 3 This communication contains certain "forward-looking statements" within the meaning of the safe harbor provisions of the United States Private Securities Litigation Reform Act of 1995. Forward-looking statements may be identified by the use
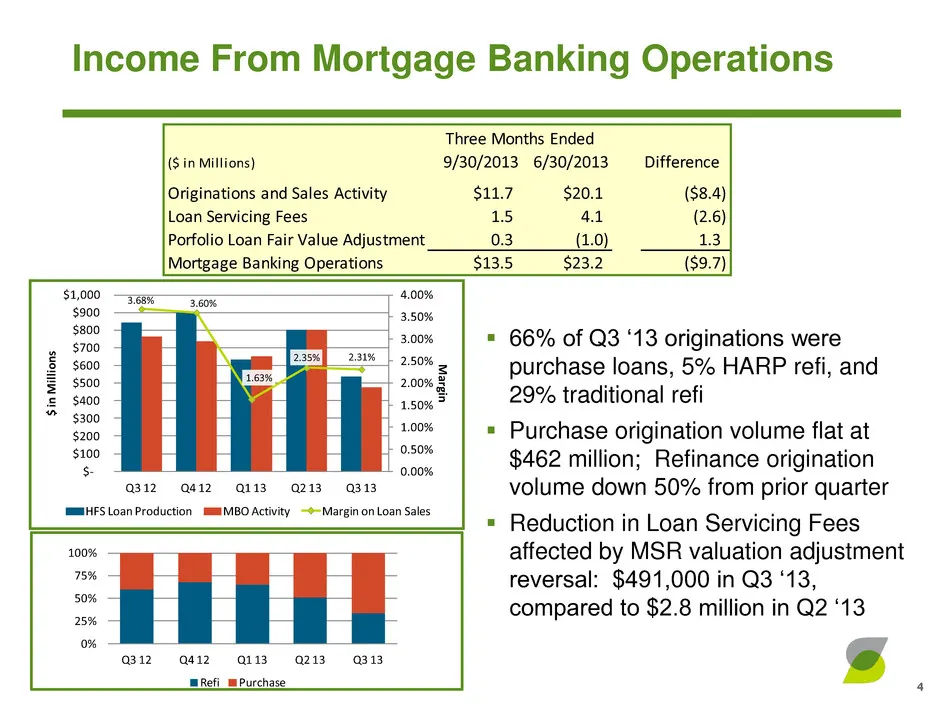
Slide 4: Income From Mortgage Banking Operations
0% 25% 50% 75% 100% Q3 12 Q4 12 Q1 13 Q2 13 Q3 13 Refi Purchase Q3 12 Q4 12 Q1 13 Q2 13 Q3 13 Refi Purchase 3.68% 3.60% 1.63% 2.35% 2.31% 0.00% 0.50% 1.00% 1.50% 2.00% 2.50% 3.00% 3.50% 4.00% $- $100 $200 $300 $400 $500 $600 $700 $800 $900 $1,000 Q3 12 Q4 12 Q1 13 Q2 13 Q3 13 M argin $ i n M illi on
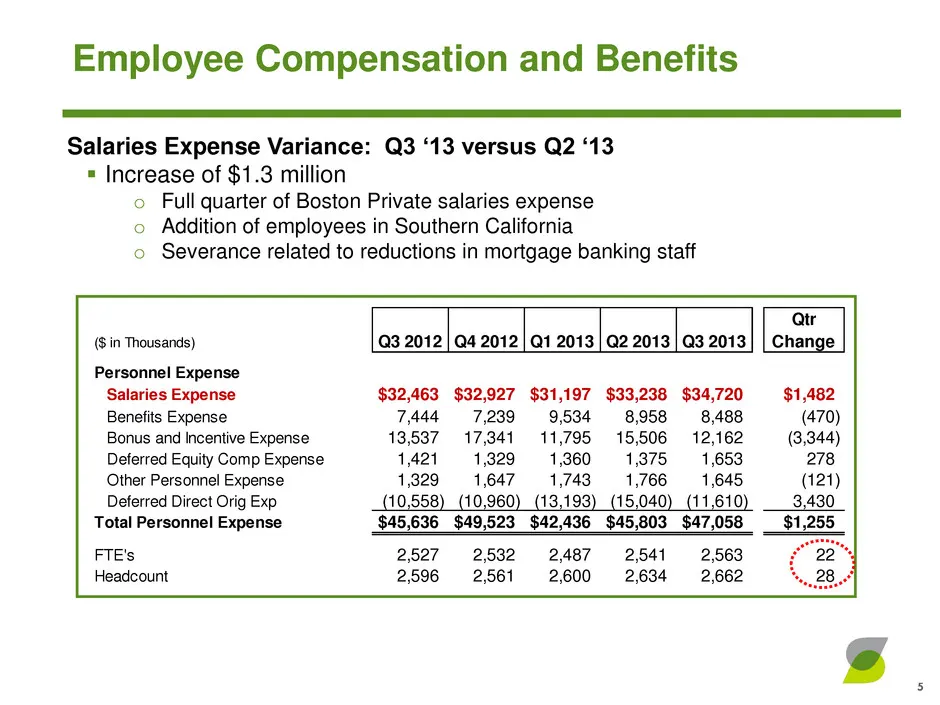
Slide 5: Employee Compensation and Benefits
($ in Thousands) Q3 2012 Q4 2012 Q1 2013 Q2 2013 Q3 2013 Qtr Change Personnel Expense Salaries Expense $32,463 $32,927 $31,197 $33,238 $34,720 $1,482 Benefits Expense 7,444 7,239 9,534 8,958 8,488 (470) Bonus and Incentive Expense 13,537 17,341 11,795 15,506 12,162 (3,344) Deferred Equity Comp Expen
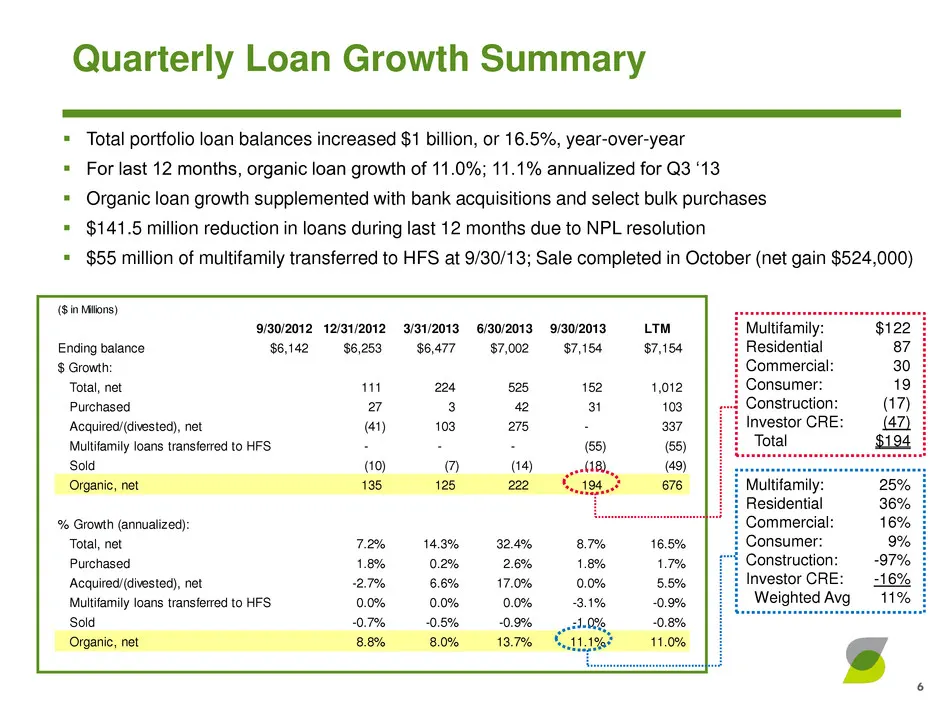
Slide 6: Quarterly Loan Growth Summary
($ in Millions) 9/30/2012 12/31/2012 3/31/2013 6/30/2013 9/30/2013 LTM Ending balance $6,142 $6,253 $6,477 $7,002 $7,154 $7,154 $ Growth: Total, net 111 224 525 152 1,012 Purchased 27 3 42 31 103 Acquired/(divested), net (41) 103 275 - 337 Multifamily loans transferred to HFS - - - (55) (55) Sold (1
Source: SEC EDGAR · 8-K filed Oct 24, 2013
More decks from Sterling Financial Corp
 Merger or Acquisition (September 2013)20 slides · Sep 12, 2013
 Merger or Acquisition (September 2013)20 slides · Sep 12, 2013
 Q2 2013 Earnings Presentation27 slides · Jul 30, 2013
 Q2 2013 Earnings Presentation8 slides · Jul 25, 2013
 Q1 2013 Earnings Presentation30 slides · May 7, 2013
 Q1 2013 Earnings Presentation6 slides · Apr 24, 2013