Astoria Financial — Merger or Acquisition (November 2015)
37 slides from Astoria Financial's merger presentation, Nov 18, 2015
Slide 1: Growing Earnings, Building Capital, and Creating Value: The Astoria Financial Merger
Investor Presentation November 18, 2015 Growing Earnings, Building Capital, and Creating Value: The Astoria Financial Merger Exhibit 99.1
Slide 2: Cautionary Statements: Additional Information and Where to Find It
Cautionary Statements Additional Information and Where to Find It These materials do not constitute an offer to sell or a solicitation of an offer to buy any securities or a solicitation of any vote or approval. New York Community Bancorp, Inc. (“NYCB”) will file a registration statement on Form S-4
Slide 3: Cautionary Statements: Forward-Looking Information
Cautionary Statements Forward-Looking Information The information presented herein, on the webcast, and in other related communications may contain certain “forward-looking statements” within the meaning of the Private Securities Litigation Reform Act of 1995. These statements include, but are not l
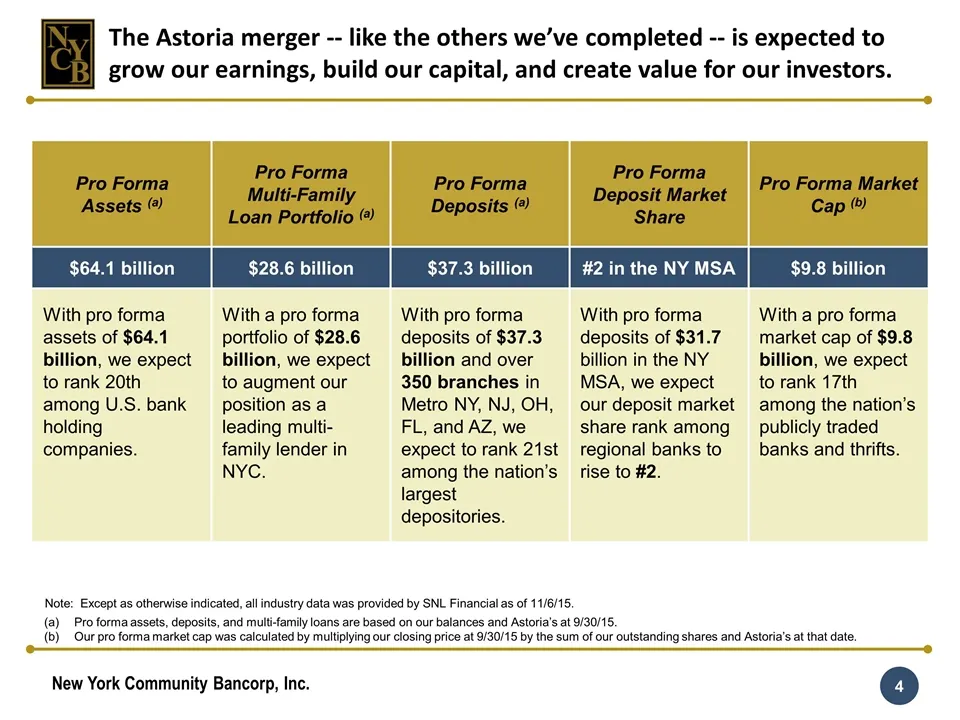
Slide 4: Pro forma assets, deposits, loans and market cap
Pro forma assets, deposits, and multi-family loans are based on our balances and Astoria’s at 9/30/15. Our pro forma market cap was calculated by multiplying our closing price at 9/30/15 by the sum of our outstanding shares and Astoria’s at that date. Pro Forma Assets (a) Pro Forma Multi-Family Loan
Slide 5: The Astoria merger is expected to significantly increase our earnings and strengthen our balance sheet
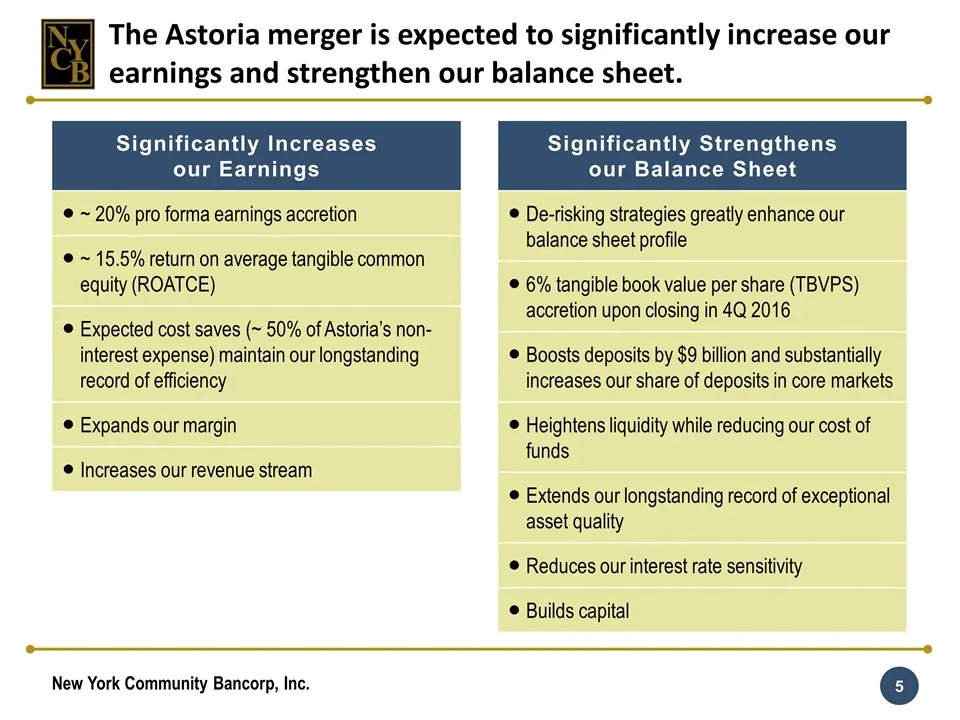
The Astoria merger is expected to significantly increase our earnings and strengthen our balance sheet. Significantly Increases our Earnings ~ 20% pro forma earnings accretion ~ 15.5% return on average tangible common equity (ROATCE) Expected cost saves (~ 50% of Astoria’s non-interest expense) main
Slide 6: Substantial upside potential relative to the purchase price
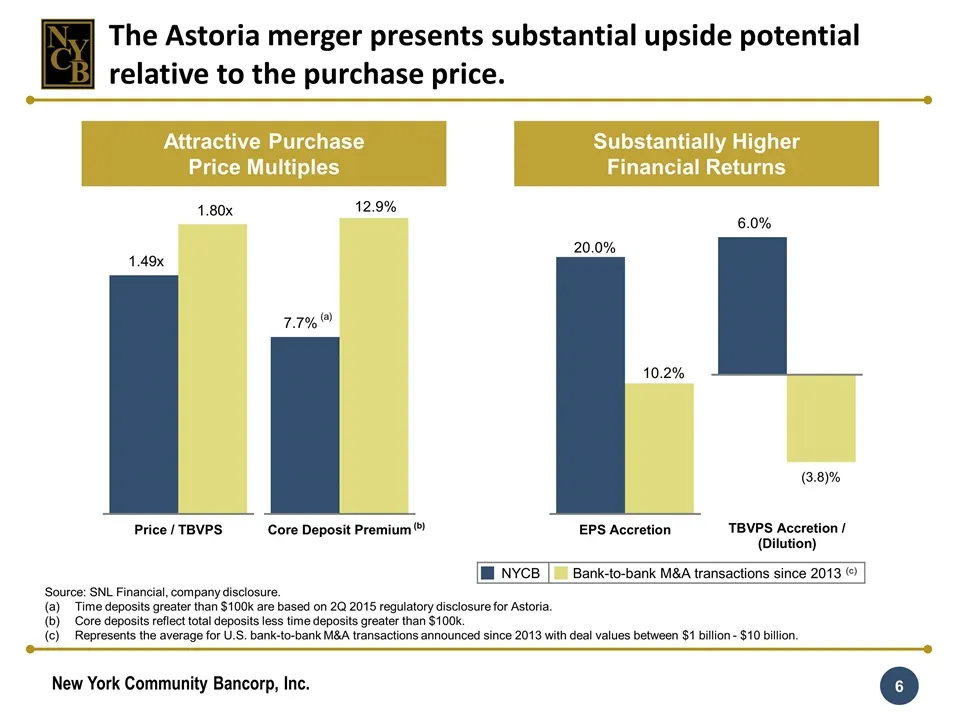
The Astoria merger presents substantial upside potential relative to the purchase price. Source: SNL Financial, company disclosure. Time deposits greater than $100k are based on 2Q 2015 regulatory disclosure for Astoria. Core deposits reflect total deposits less time deposits greater than $100k. Rep
Slide 7: The Astoria merger is expected to create New York's pre-eminent community bank
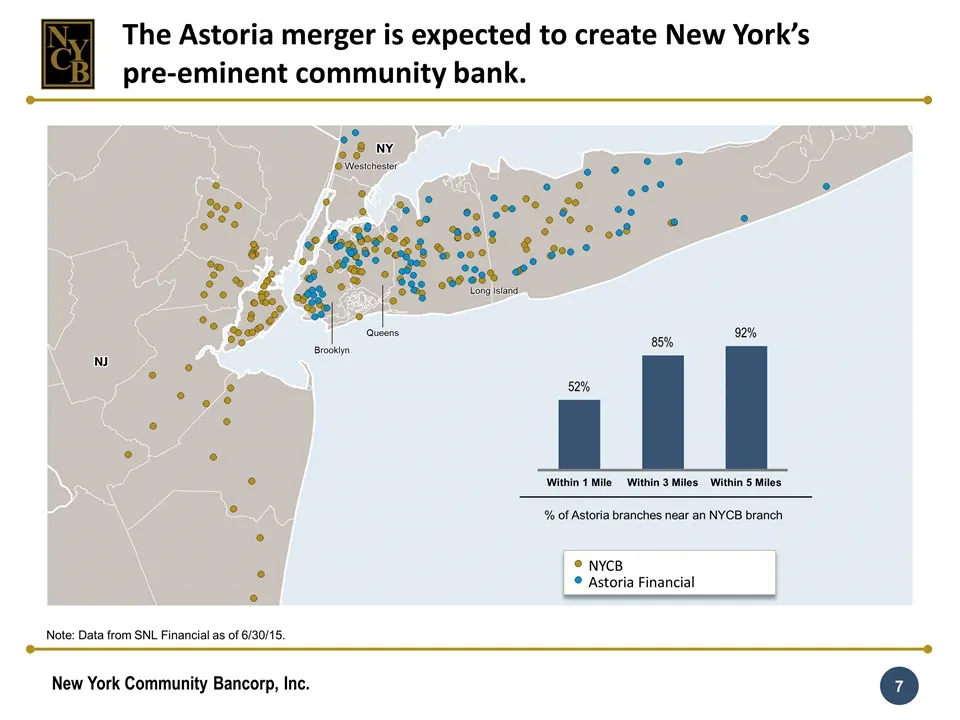
Note: Data from SNL Financial as of 6/30/15. Long Island Brooklyn Queens Westchester Astoria Financial NYCB % of Astoria branches near an NYCB branch The Astoria merger is expected to create New York’s pre-eminent community bank.
Slide 8: Increased share of deposits in the NY MSA
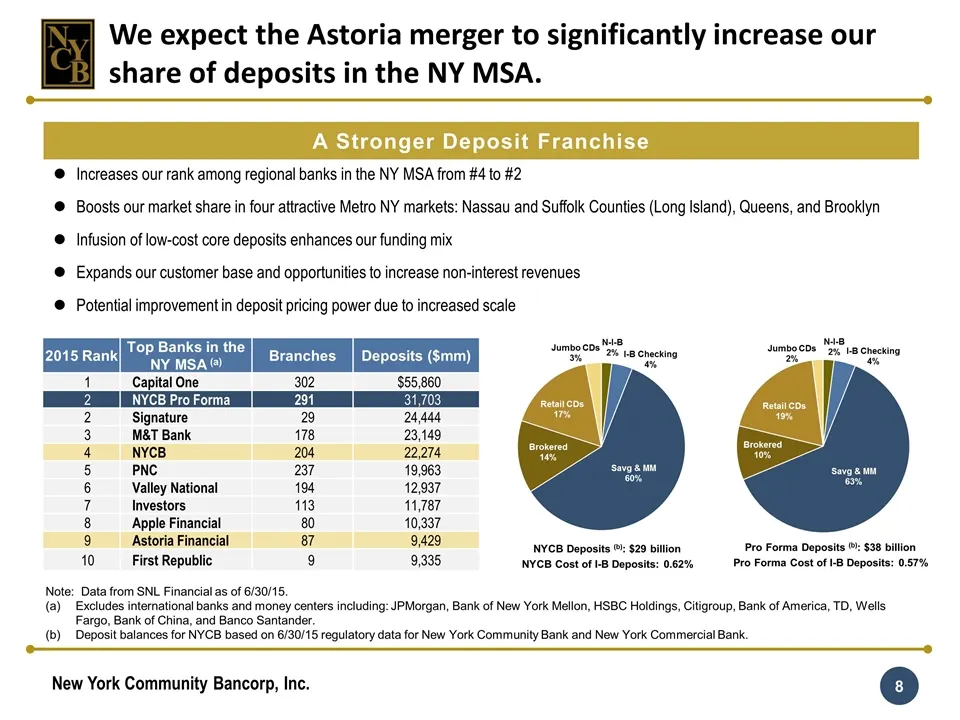
Increases our rank among regional banks in the NY MSA from #4 to #2 Boosts our market share in four attractive Metro NY markets: Nassau and Suffolk Counties (Long Island), Queens, and Brooklyn Infusion of low-cost core deposits enhances our funding mix Expands our customer base and opportunities to
Slide 9: Increased share of deposits in four highly attractive markets
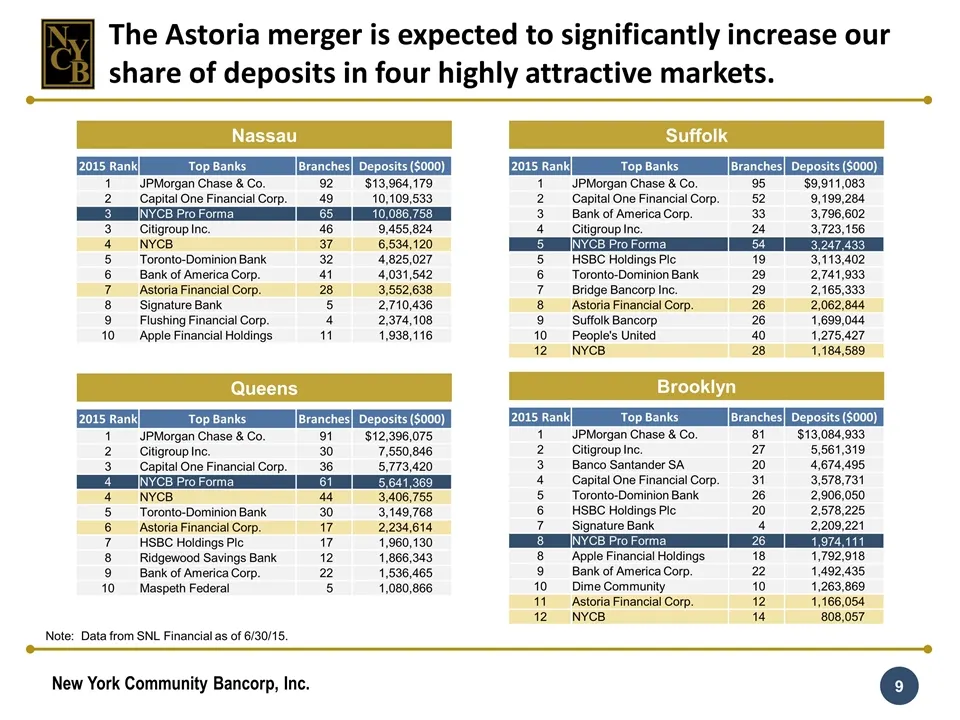
The Astoria merger is expected to significantly increase our share of deposits in four highly attractive markets. Nassau 2015 Rank Top Banks Branches Deposits ($000) 1 JPMorgan Chase & Co. 92 $13,964,179 2 Capital One Financial Corp. 49 10,109,533 3 NYCB Pro Forma 65 10,086,758 3 Citigroup Inc. 46 9
Slide 10: Summary Pro Forma Balance Sheet
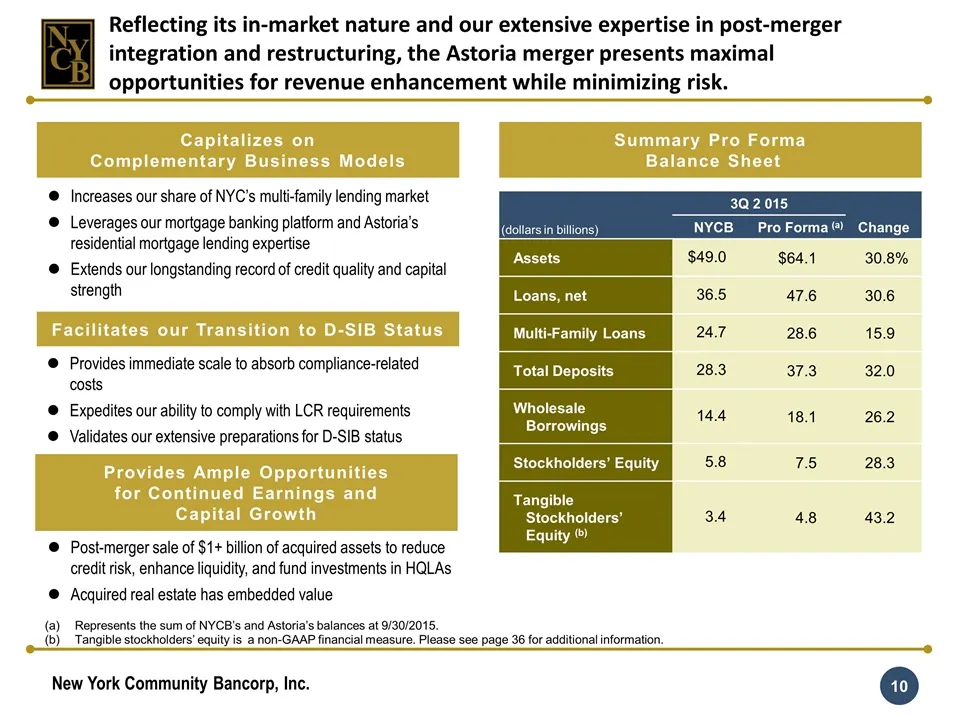
Represents the sum of NYCB’s and Astoria’s balances at 9/30/2015. Tangible stockholders’ equity is a non-GAAP financial measure. Please see page 36 for additional information. Summary Pro Forma Balance Sheet Increases our share of NYC’s multi-family lending market Leverages our mortgage banking plat
Slide 11: Enhanced asset and funding mix
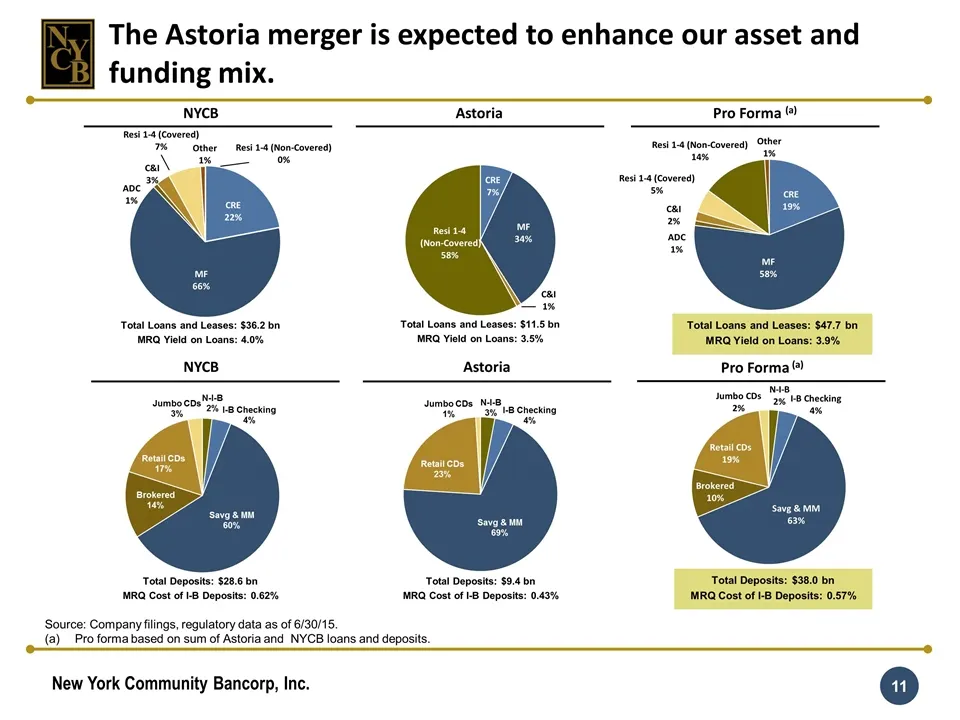
Source: Company filings, regulatory data as of 6/30/15. Pro forma based on sum of Astoria and NYCB loans and deposits. The Astoria merger is expected to enhance our asset and funding mix. NYCB Astoria Pro Forma (a) Total Loans and Leases: $36.2 bn MRQ Yield on Loans: 4.0% Total Loans and Leases: $11
Slide 12: Opportunities to drive profitable, sustainable, long-term asset growth
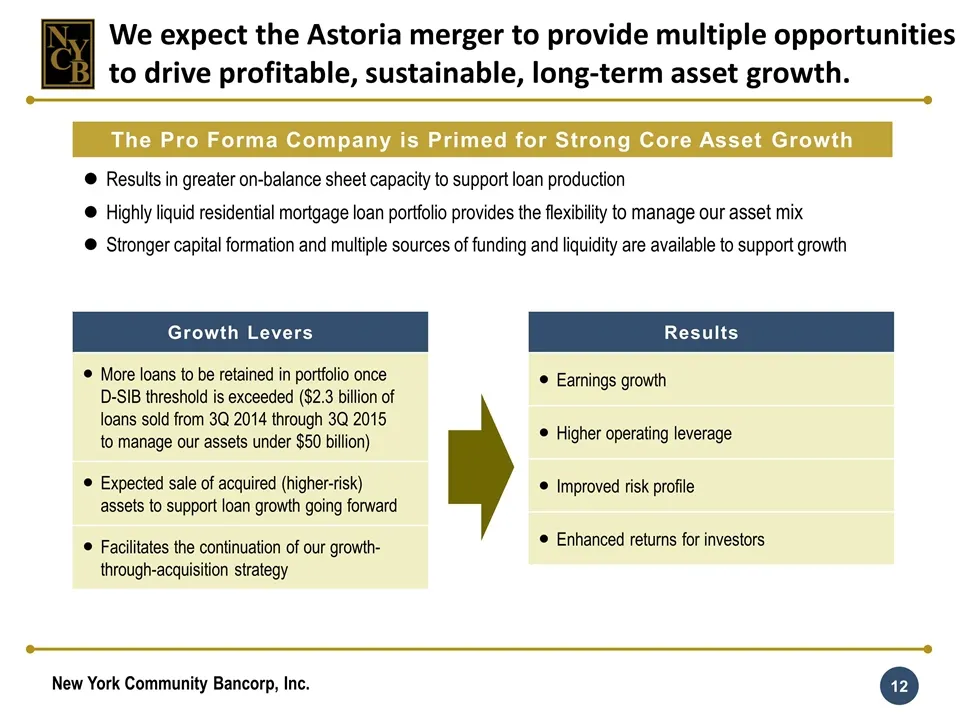
We expect the Astoria merger to provide multiple opportunities to drive profitable, sustainable, long-term asset growth. The Pro Forma Company is Primed for Strong Core Asset Growth Results in greater on-balance sheet capacity to support loan production Highly liquid residential mortgage loan portfo
Slide 13: De-risking our balance sheet
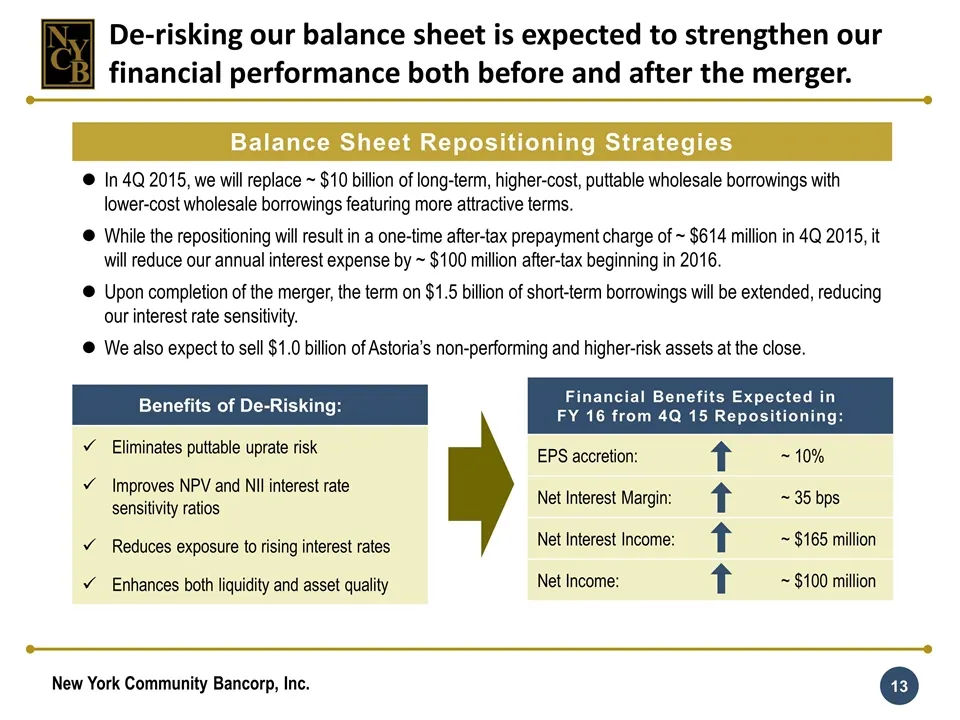
De-risking our balance sheet is expected to strengthen our financial performance both before and after the merger. Balance Sheet Repositioning Strategies In 4Q 2015, we will replace ~ $10 billion of long-term, higher-cost, puttable wholesale borrowings with lower-cost wholesale borrowings featuring
Slide 14: Enhancing our capital management strategy
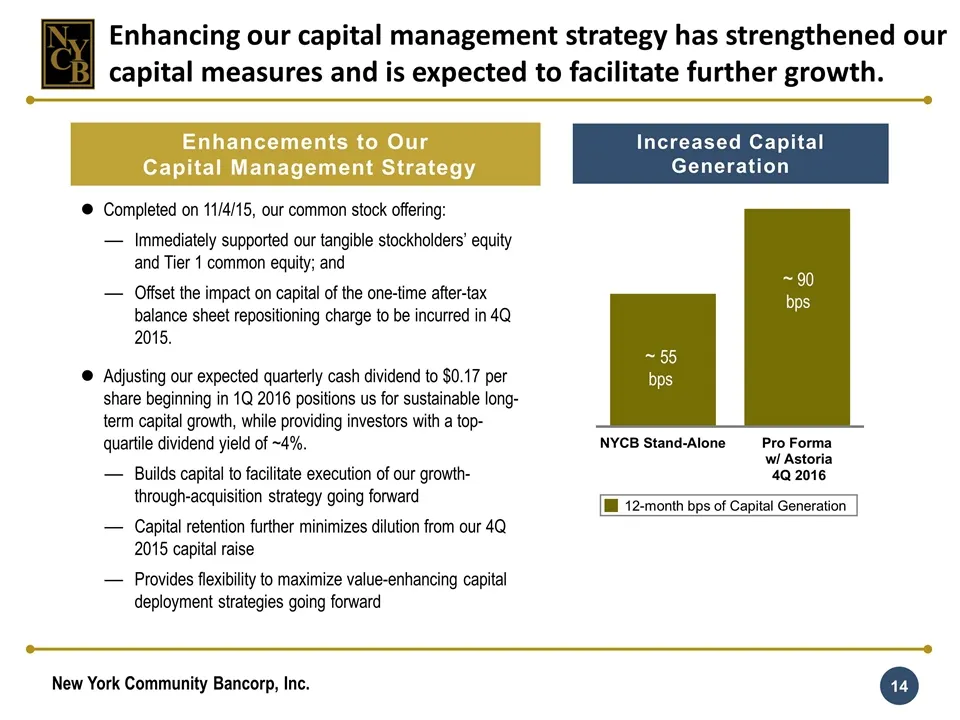
Enhancing our capital management strategy has strengthened our capital measures and is expected to facilitate further growth. Completed on 11/4/15, our common stock offering: Immediately supported our tangible stockholders’ equity and Tier 1 common equity; and Offset the impact on capital of the one
Slide 15: Preparing for D-SIB Status
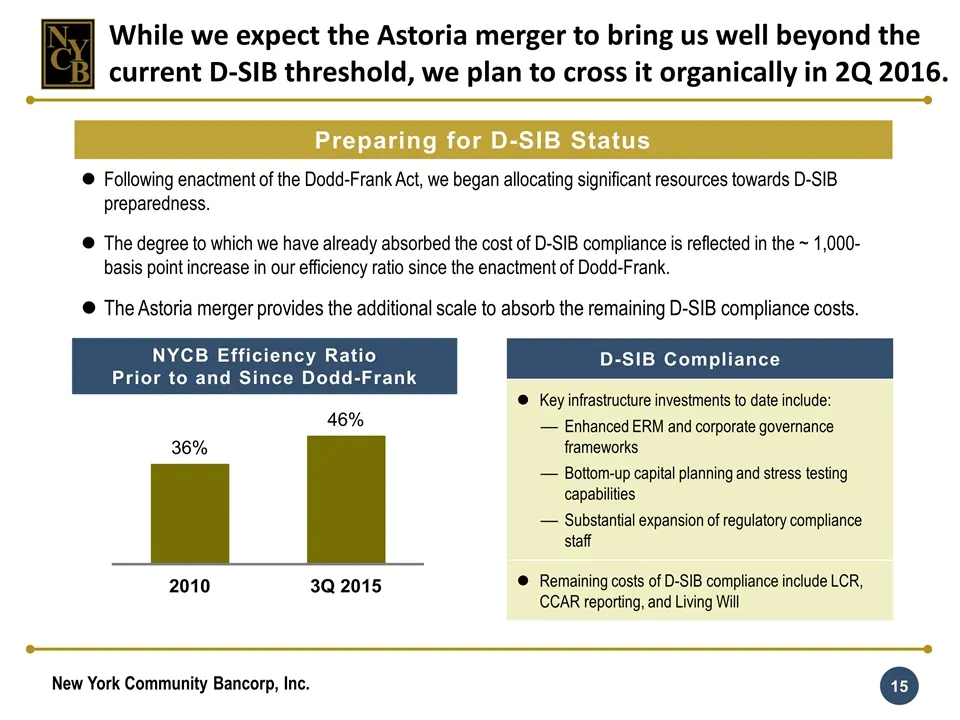
Following enactment of the Dodd-Frank Act, we began allocating significant resources towards D-SIB preparedness. The degree to which we have already absorbed the cost of D-SIB compliance is reflected in the ~ 1,000-basis point increase in our efficiency ratio since the enactment of Dodd-Frank. The A
Slide 16: Total payout ratio versus D-SIB peers
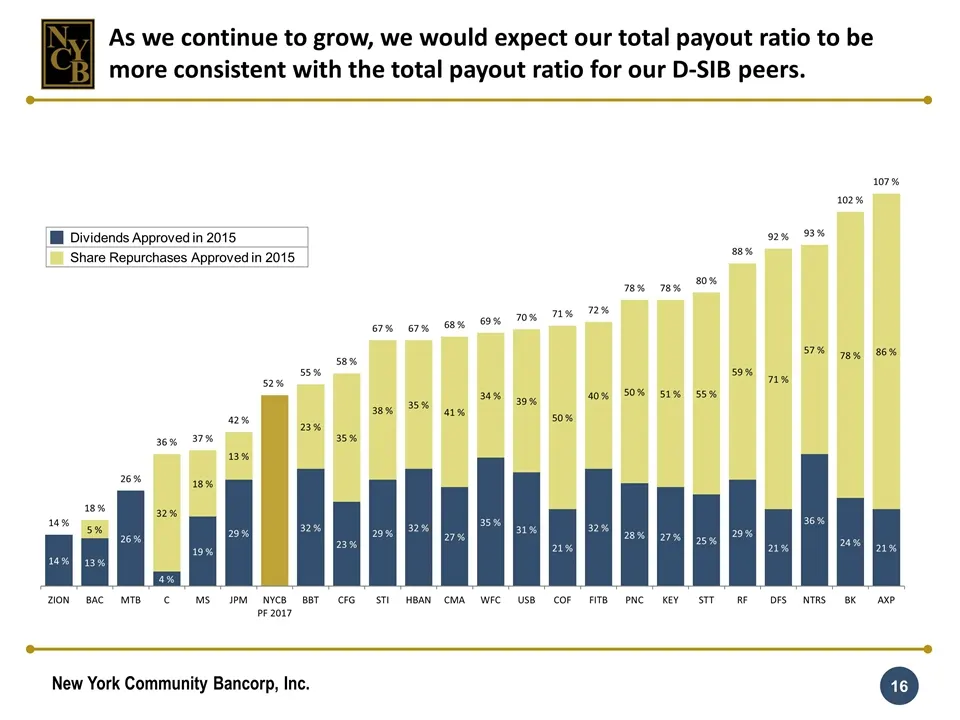
As we continue to grow, we would expect our total payout ratio to be more consistent with the total payout ratio for our D-SIB peers. Dividends Approved in 2015 Share Repurchases Approved in 2015
Slide 17: Core components of our business model enhanced by the Astoria merger
We Expect the Core Components of our Business Model to Be Enhanced by the Astoria Merger
Slide 18: Multi-family loan portfolio
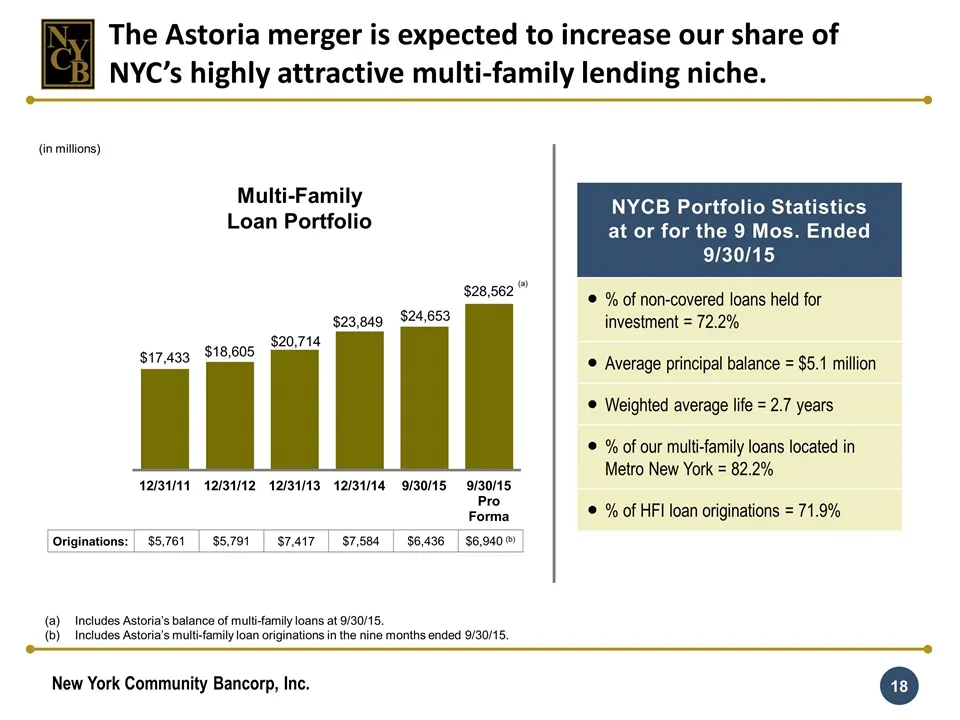
NYCB Portfolio Statistics at or for the 9 Mos. Ended 9/30/15 % of non-covered loans held for investment = 72.2% Average principal balance = $5.1 million Weighted average life = 2.7 years % of our multi-family loans located in Metro New York = 82.2% % of HFI loan originations = 71.9% Multi-Family Loa
Slide 19: Low net charge-offs in downward credit cycles
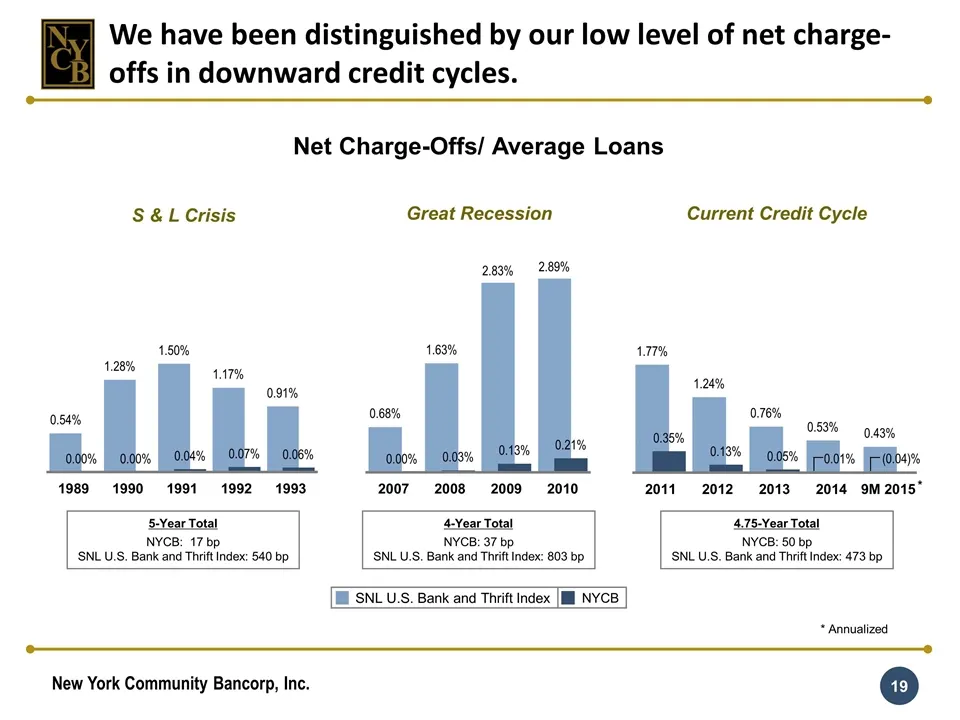
S & L Crisis Net Charge-Offs/ Average Loans 5-Year Total NYCB: 17 bp SNL U.S. Bank and Thrift Index: 540 bp 4-Year Total NYCB: 37 bp SNL U.S. Bank and Thrift Index: 803 bp SNL U.S. Bank and Thrift Index NYCB Great Recession Current Credit Cycle 4.75-Year Total NYCB: 50 bp SNL U.S. Bank and Thrift In
Slide 20: Non-performing loans to total loans
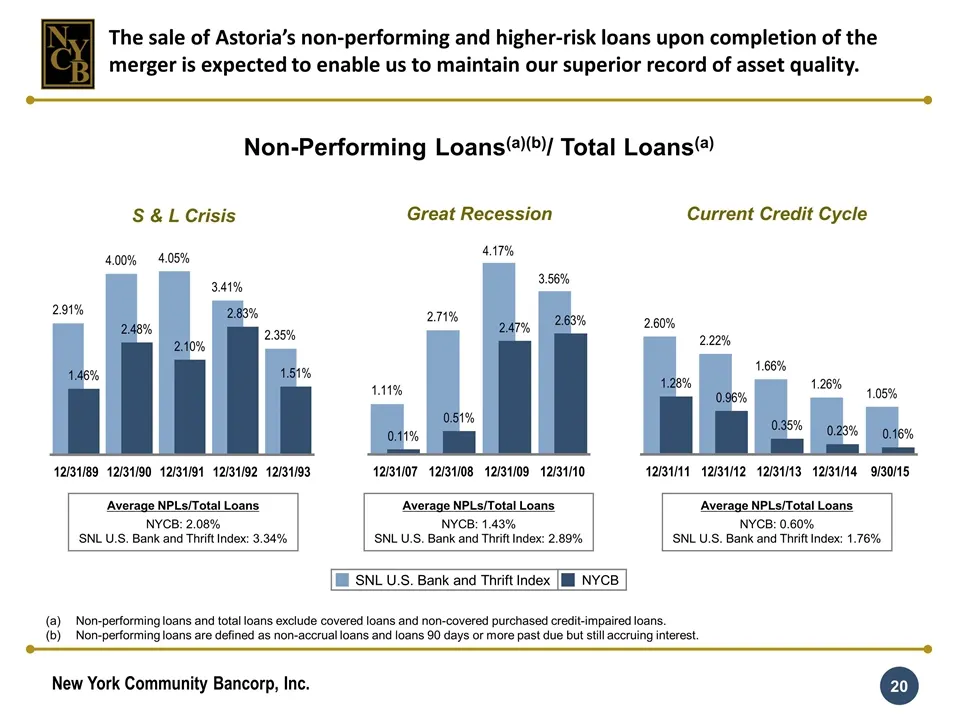
S & L Crisis Great Recession Current Credit Cycle Non-Performing Loans(a)(b)/ Total Loans(a) Non-performing loans and total loans exclude covered loans and non-covered purchased credit-impaired loans. Non-performing loans are defined as non-accrual loans and loans 90 days or more past due but still
Slide 21: Maintaining our record of superior efficiency
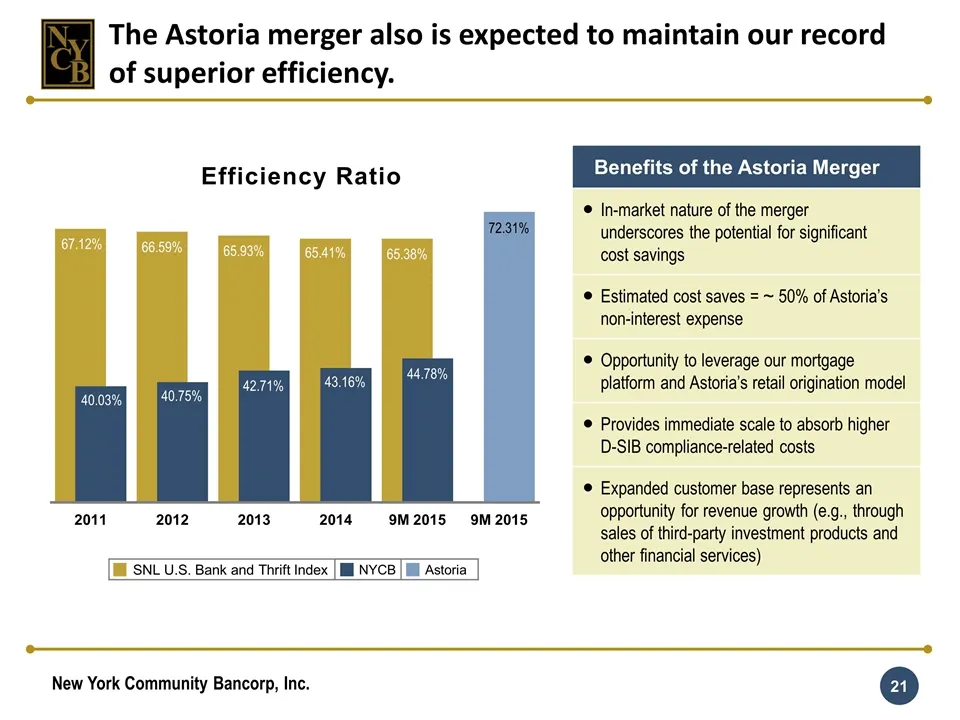
SNL U.S. Bank and Thrift Index NYCB Astoria The Astoria merger also is expected to maintain our record of superior efficiency. Benefits of the Astoria Merger In-market nature of the merger underscores the potential for significant cost savings Estimated cost saves = ~ 50% of Astoria’s non-interest e
Slide 22: Mortgage banking platform
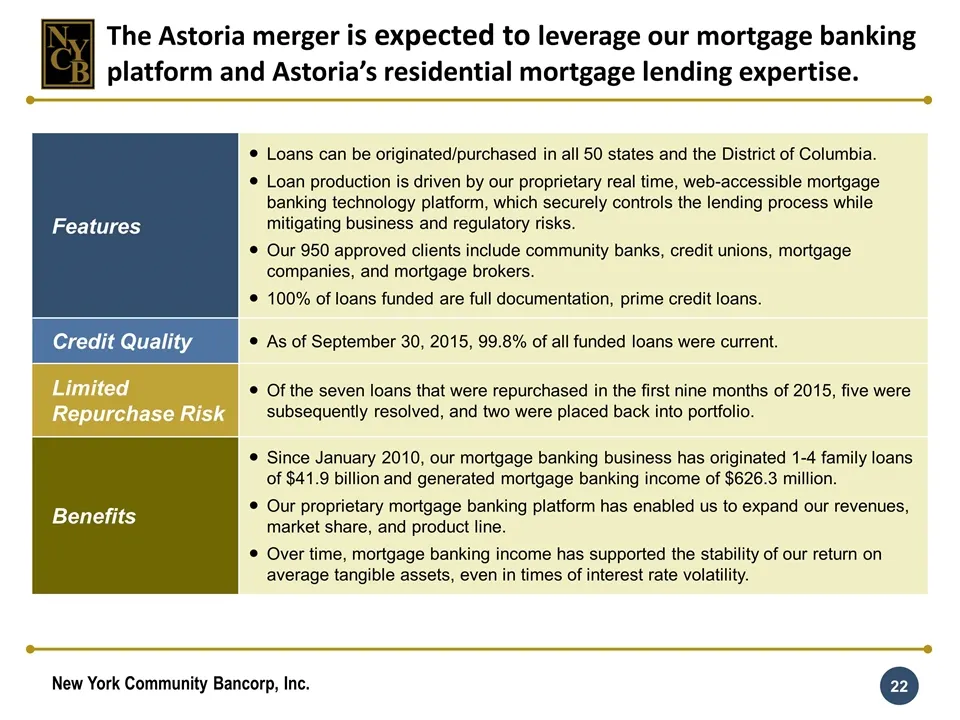
Features Loans can be originated/purchased in all 50 states and the District of Columbia. Loan production is driven by our proprietary real time, web-accessible mortgage banking technology platform, which securely controls the lending process while mitigating business and regulatory risks. Our 950 a
Slide 23: Total Return on Investment
Total Return on Investment
Slide 24: Total return on investment since IPO
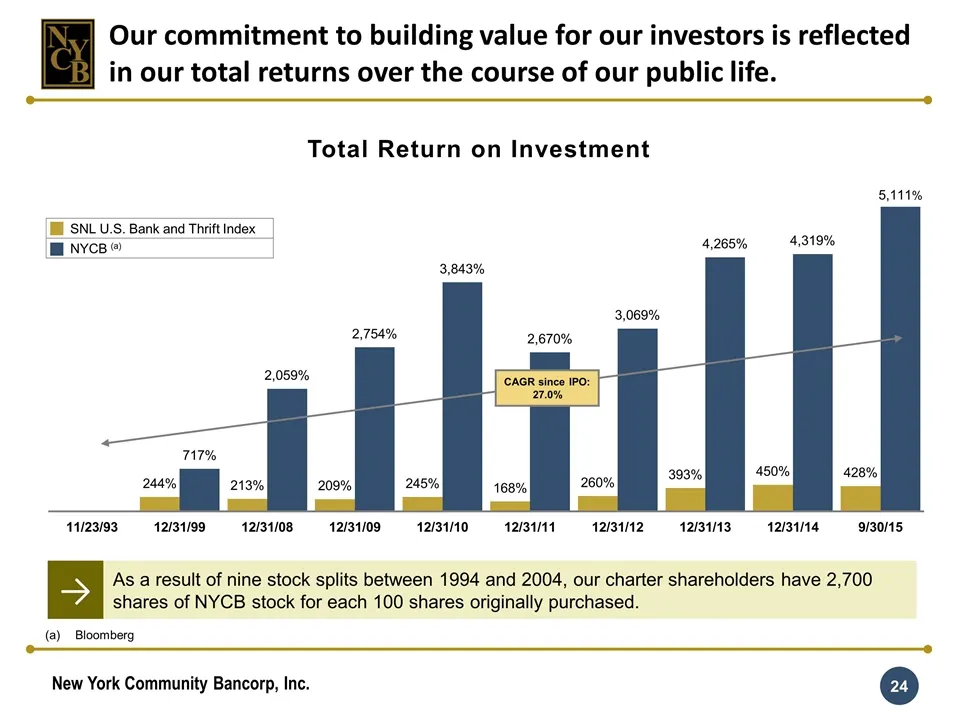
CAGR since IPO: 27.0% Bloomberg Total Return on Investment → As a result of nine stock splits between 1994 and 2004, our charter shareholders have 2,700 shares of NYCB stock for each 100 shares originally purchased. SNL U.S. Bank and Thrift Index NYCB (a) Our commitment to building value for our inv
Slide 25: For More Information
11/18/15 Visit our website: ir.myNYCB.com E-mail requests to: [email protected] Call Investor Relations at: (516) 683-4420 Write to: Investor Relations New York Community Bancorp, Inc. 615 Merrick Avenue Westbury, NY 11590 For More Information
Slide 26: Appendix A: Additional Information about the Proposed Astoria Merger
Appendix A: Additional Information about the Proposed Astoria Merger
Slide 27: Transaction Features
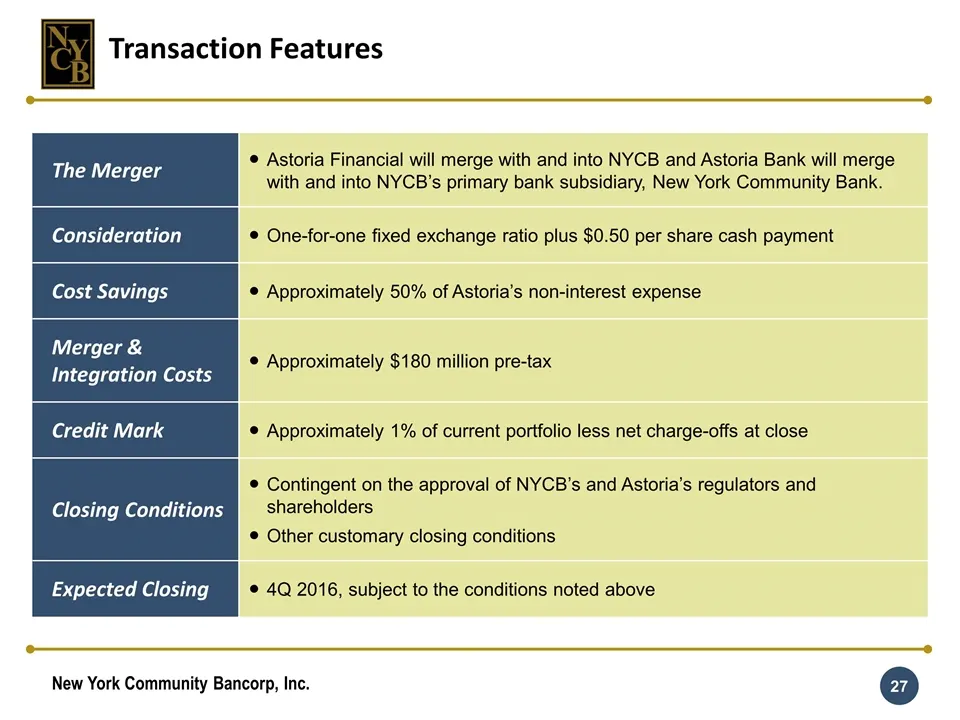
Transaction Features The Merger Astoria Financial will merge with and into NYCB and Astoria Bank will merge with and into NYCB’s primary bank subsidiary, New York Community Bank. Consideration One-for-one fixed exchange ratio plus $0.50 per share cash payment Cost Savings Approximately 50% of Astori
Slide 28: NYCB and Astoria Financial at a Glance
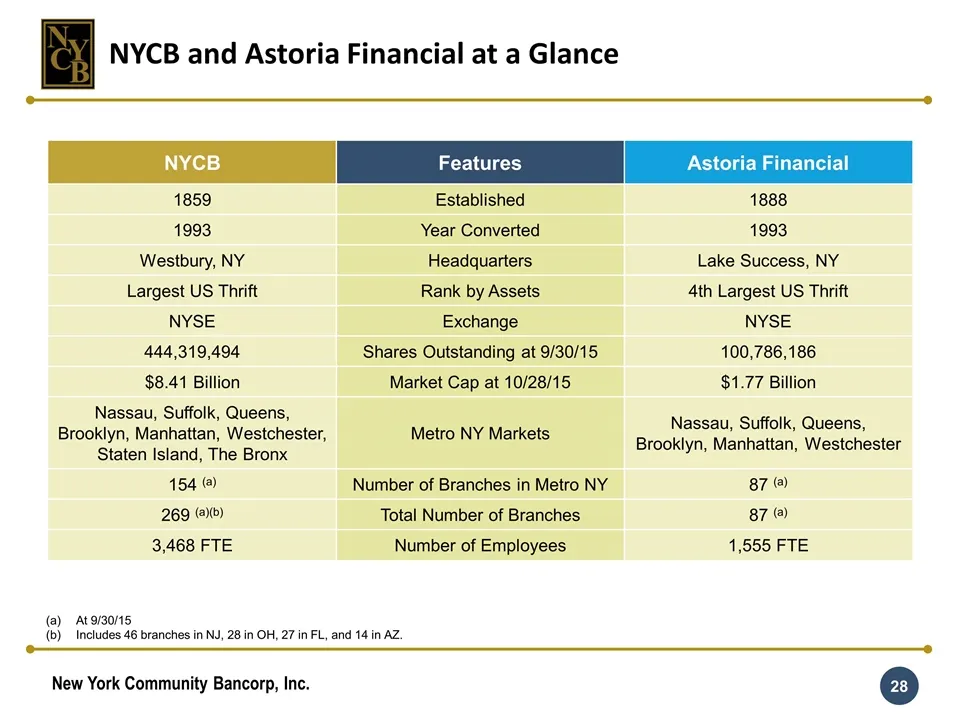
NYCB Features Astoria Financial 1859 Established 1888 1993 Year Converted 1993 Westbury, NY Headquarters Lake Success, NY Largest US Thrift Rank by Assets 4th Largest US Thrift NYSE Exchange NYSE 444,319,494 Shares Outstanding at 9/30/15 100,786,186 $8.41 Billion Market Cap at 10/28/15 $1.77 Billion
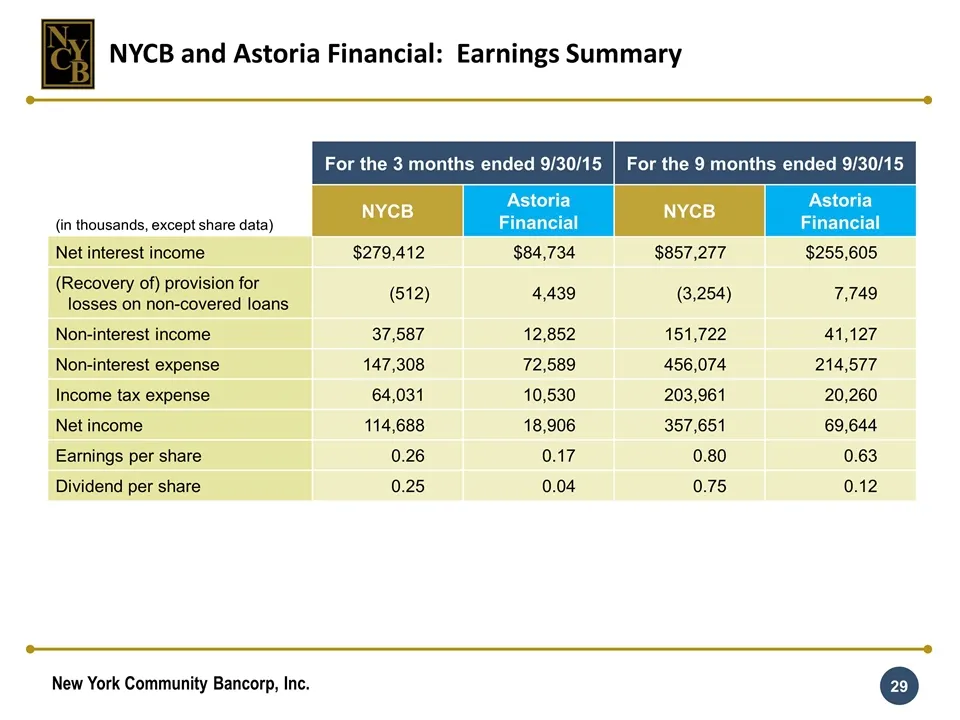
Slide 29: NYCB and Astoria Financial: Earnings Summary
NYCB and Astoria Financial: Earnings Summary For the 3 months ended 9/30/15 For the 9 months ended 9/30/15 (in thousands, except share data) NYCB Astoria Financial NYCB Astoria Financial Net interest income $279,412 $84,734 $857,277 $255,605 (Recovery of) provision for losses on non-covered loans (5
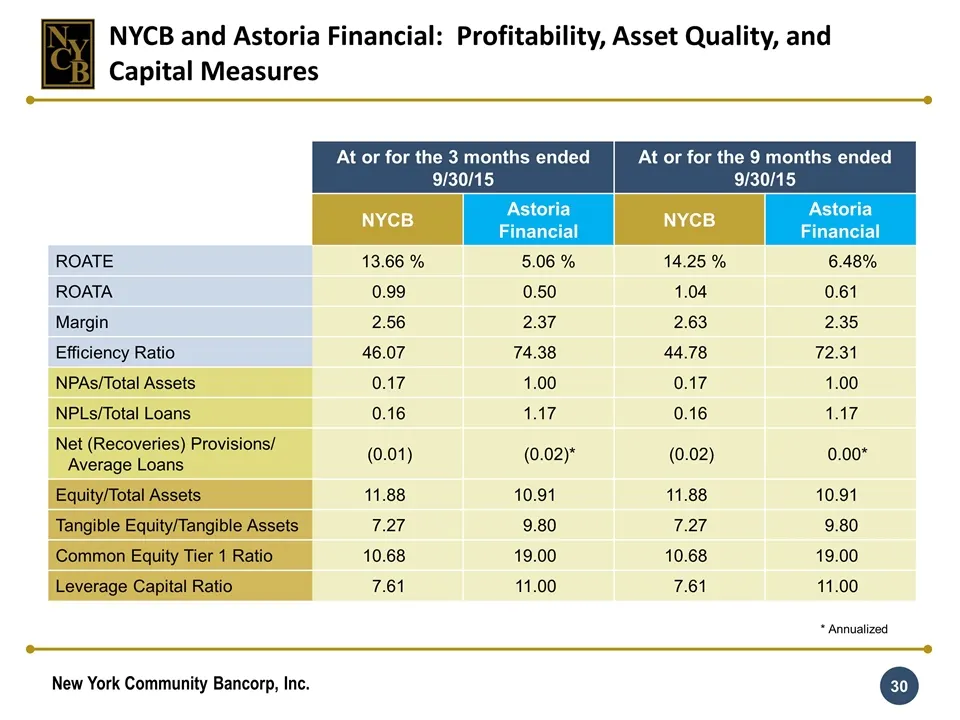
Slide 30: Profitability, Asset Quality, and Capital Measures
At or for the 3 months ended 9/30/15 At or for the 9 months ended 9/30/15 NYCB Astoria Financial NYCB Astoria Financial ROATE 13.66 % 5.06 % 14.25 % 6.48% ROATA 0.99 0.50 1.04 0.61 Margin 2.56 2.37 2.63 2.35 Efficiency Ratio 46.07 74.38 44.78 72.31 NPAs/Total Assets 0.17 1.00 0.17 1.00 NPLs/Total Lo
Slide 31: Appendix B: Historical Information about Our Merger Transactions
Appendix B: Historical Information about Our Merger Transactions
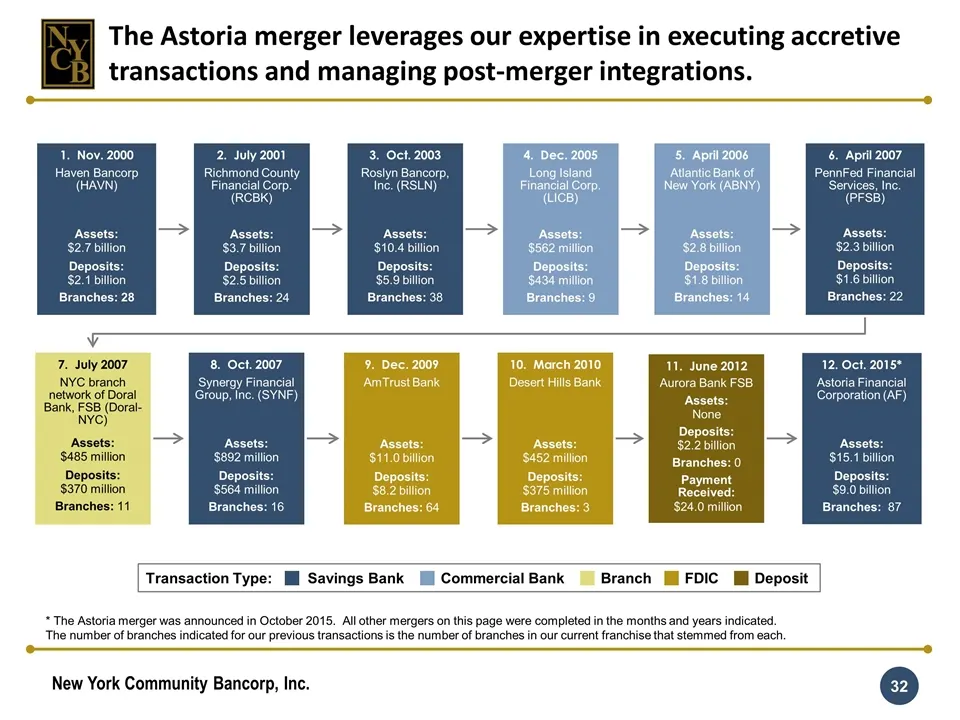
Slide 32: Our history of merger transactions
* The Astoria merger was announced in October 2015. All other mergers on this page were completed in the months and years indicated. The number of branches indicated for our previous transactions is the number of branches in our current franchise that stemmed from each. Transaction Type: Savings Ban
Slide 33: Deposit growth through mergers
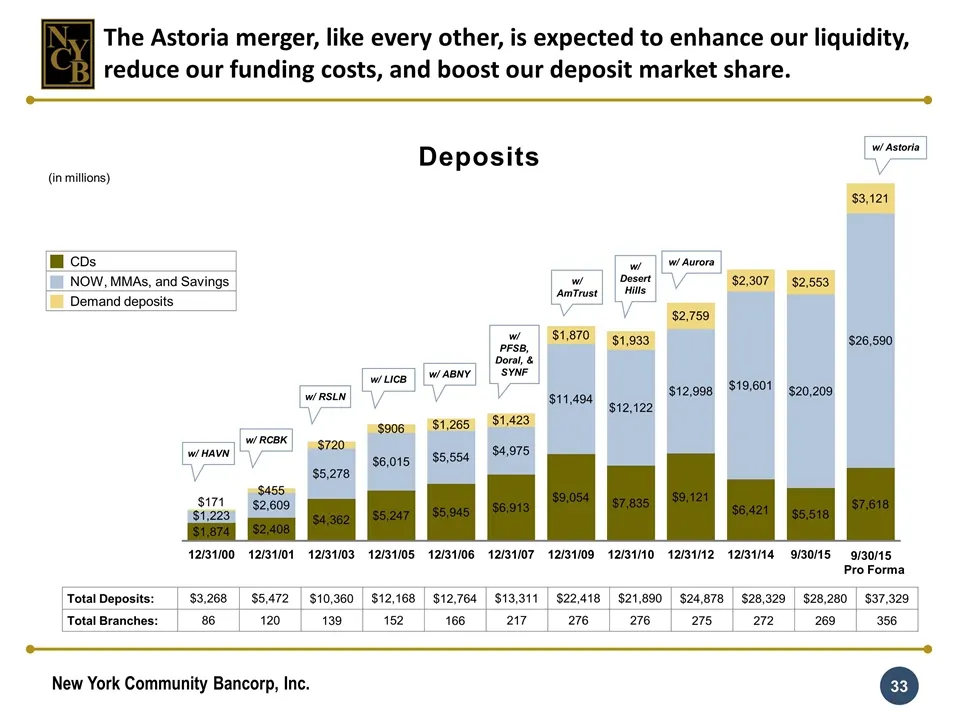
The Astoria merger, like every other, is expected to enhance our liquidity, reduce our funding costs, and boost our deposit market share. (in millions) Deposits w/ HAVN w/ RCBK w/ RSLN w/ LICB w/ ABNY w/ PFSB, Doral, & SYNF w/ AmTrust w/ Desert Hills w/ Astoria Total Deposits: $3,268 $5,472 $10,360
Slide 34: Held-for-investment loan portfolio growth
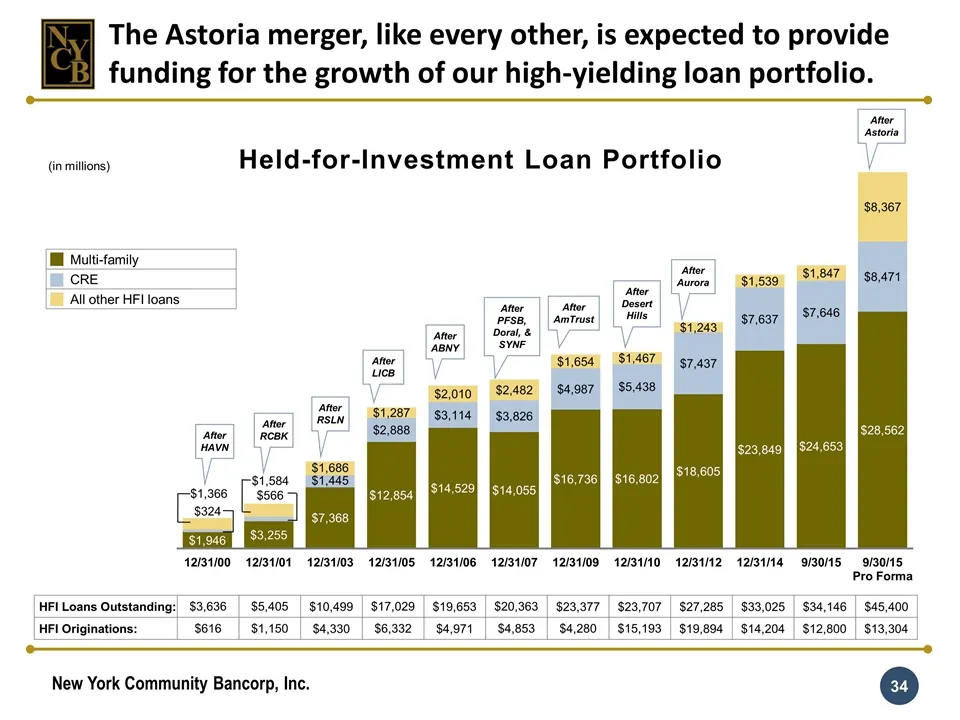
Held-for-Investment Loan Portfolio After HAVN After RCBK After RSLN After LICB After ABNY After PFSB, Doral, & SYNF After AmTrust After Desert Hills HFI Loans Outstanding: $3,636 $5,405 $10,499 $17,029 $19,653 $20,363 $23,377 $23,707 $27,285 $33,025 $34,146 $45,400 HFI Originations: $616 $1,150 $4,3
Slide 35: Appendix C: Reconciliations of GAAP and Non-GAAP Financial Measures
Appendix C: Reconciliations of GAAP and Non-GAAP Financial Measures
Slide 36: Reconciliations of GAAP and Non-GAAP Financial Measures
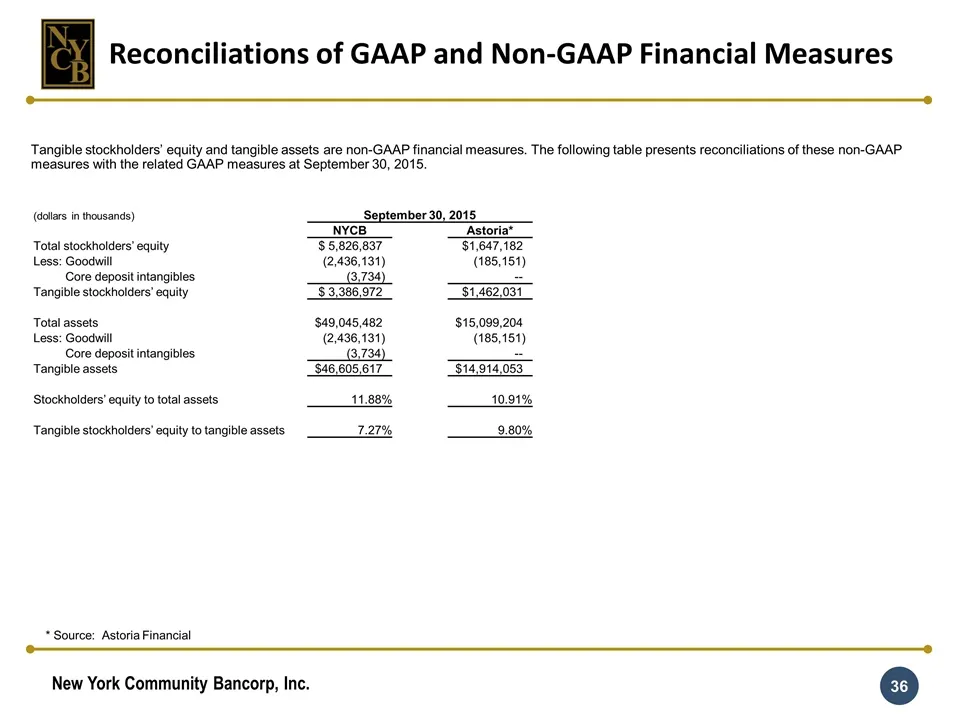
(dollars in thousands) September 30, 2015 NYCB Astoria* Total stockholders’ equity $ 5,826,837 $1,647,182 Less: Goodwill (2,436,131) (185,151) Core deposit intangibles (3,734) -- Tangible stockholders’ equity $ 3,386,972 $1,462,031 Total assets $49,045,482 $15,099,204 Less: Goodwill (2,436,131) (185
Slide 37: Reconciliations of GAAP and Non-GAAP Financial Measures
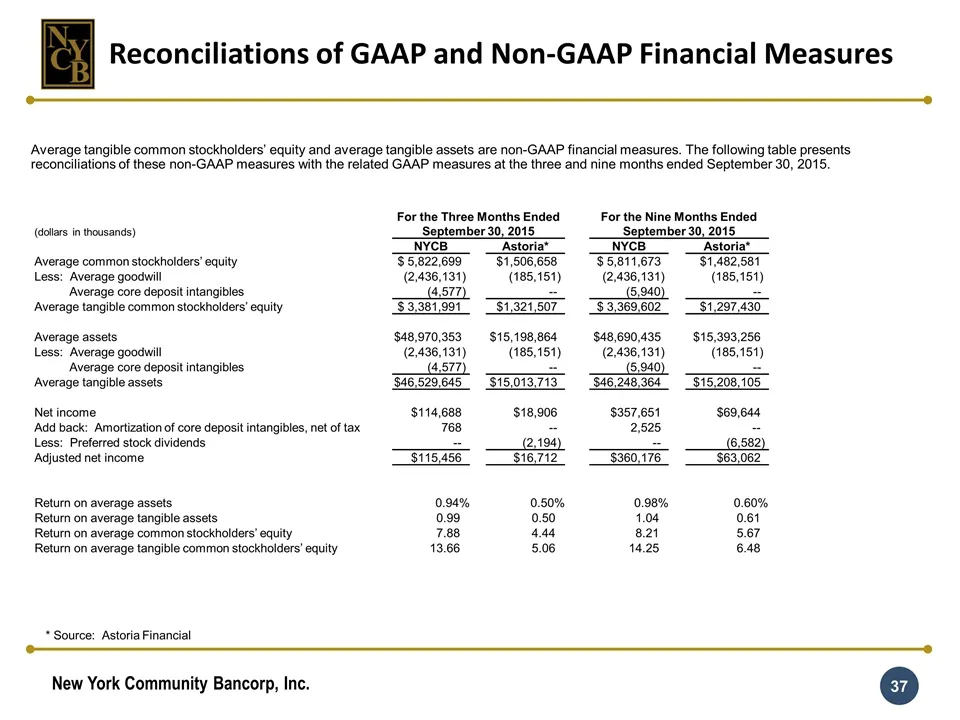
Average tangible common stockholders’ equity and average tangible assets are non-GAAP financial measures. The following table presents reconciliations of these non-GAAP measures with the related GAAP measures at the three and nine months ended September 30, 2015. Reconciliations of GAAP and Non-GAAP
Source: SEC EDGAR · 425 filed Nov 18, 2015
More decks from Astoria Financial Corp
 Q2 2017 Earnings Presentation33 slides · Aug 14, 2017
 IPO Roadshow (June 2017)26 slides · Jun 5, 2017
 Shareholder Meeting (May 2017)14 slides · May 23, 2017
 Q1 2017 Earnings Presentation33 slides · May 10, 2017
 Merger or Acquisition (March 2017)25 slides · Mar 7, 2017
 Q4 2016 Earnings Presentation32 slides · Feb 17, 2017