Consumers Energy Company · NYSE:CMS/PB
Consumers Energy — Credit Suisse Investor Meeting 2011
45 slides from Consumers Energy's conference presentation, Dec 12, 2011
Slide 1: Growing CMS Energy - Credit Suisse Investor Meeting, December 12, 2011
Exhibit 99.1 Growing Credit December Suisse Forward 12,Investor 2011 Meeting
Slide 2: Forward-Looking Statements and Risk Factors
guidance. This of CMS STATEMENTS results events The comparable Reported 1933, presentation presentation Energy’s or toas circumstances differ earnings amended, GAAPand materially AND also iscould Consumers measure made and includes INFORMATION” after vary relevant as from is of the because included
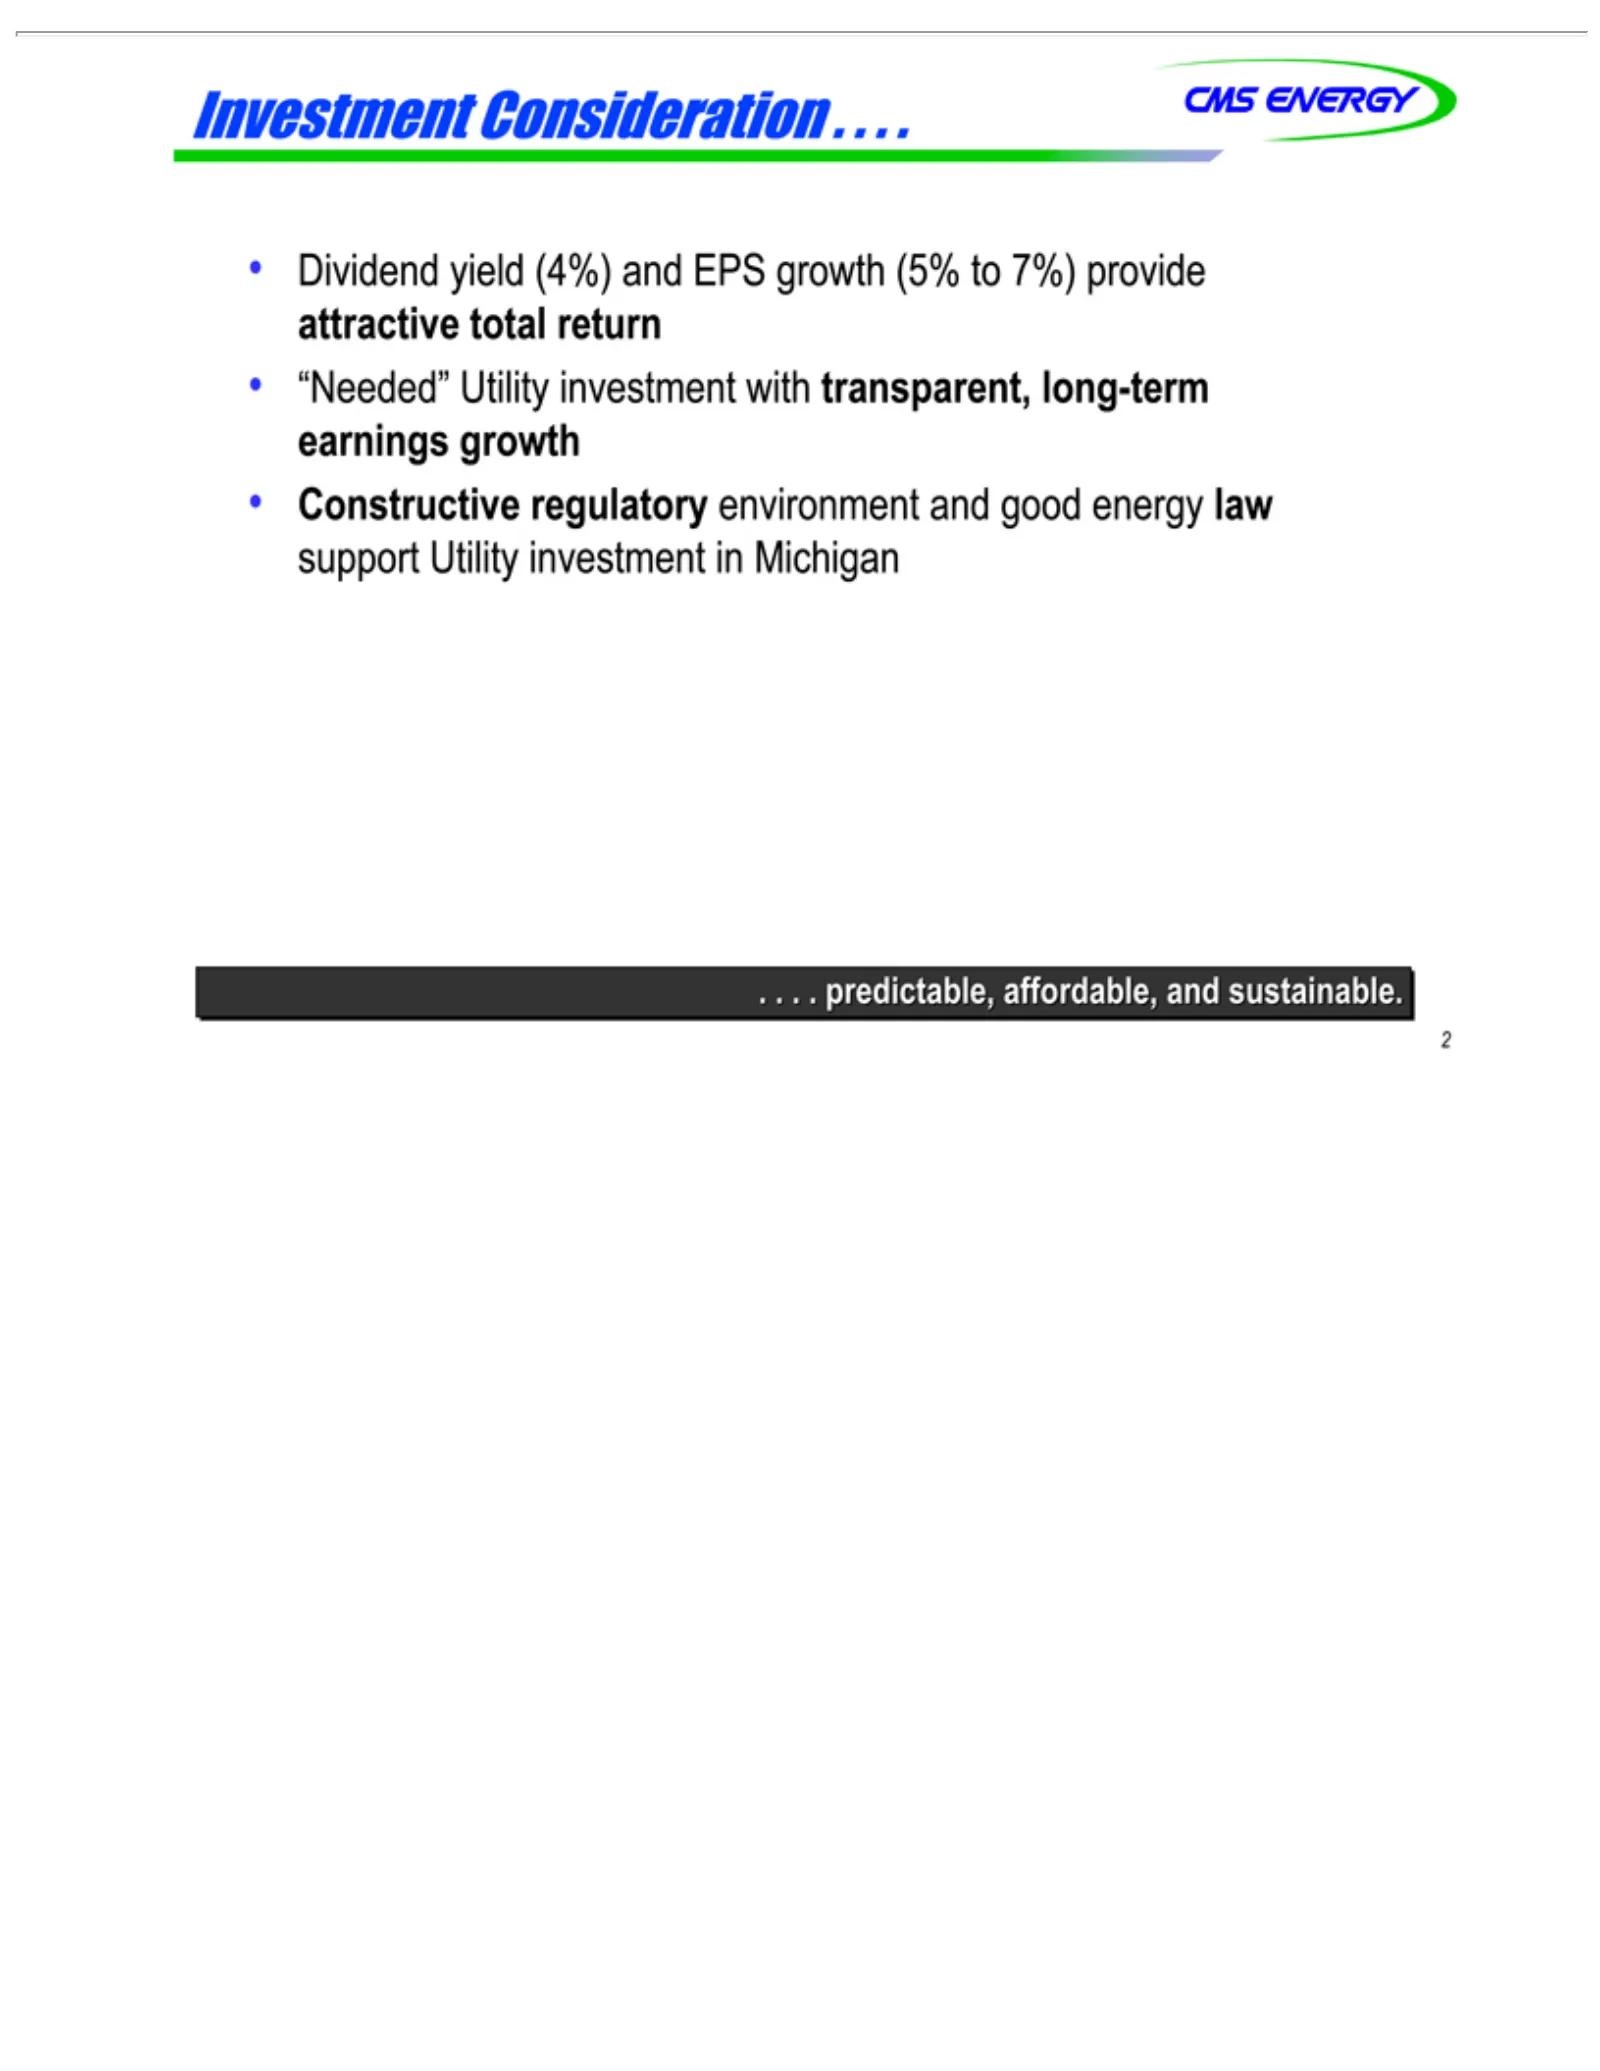
Slide 3: Investment Consideration
. . . . predictable,redictable, Investment Dividend “Needed” yield Utility Consideration (4%) investment and EPS . .affordable, .with .growth transparent, (5% andtosustainable. 7%) long-term provideearnings attractive growth total return Constructive regulatory environment and good energy law suppor
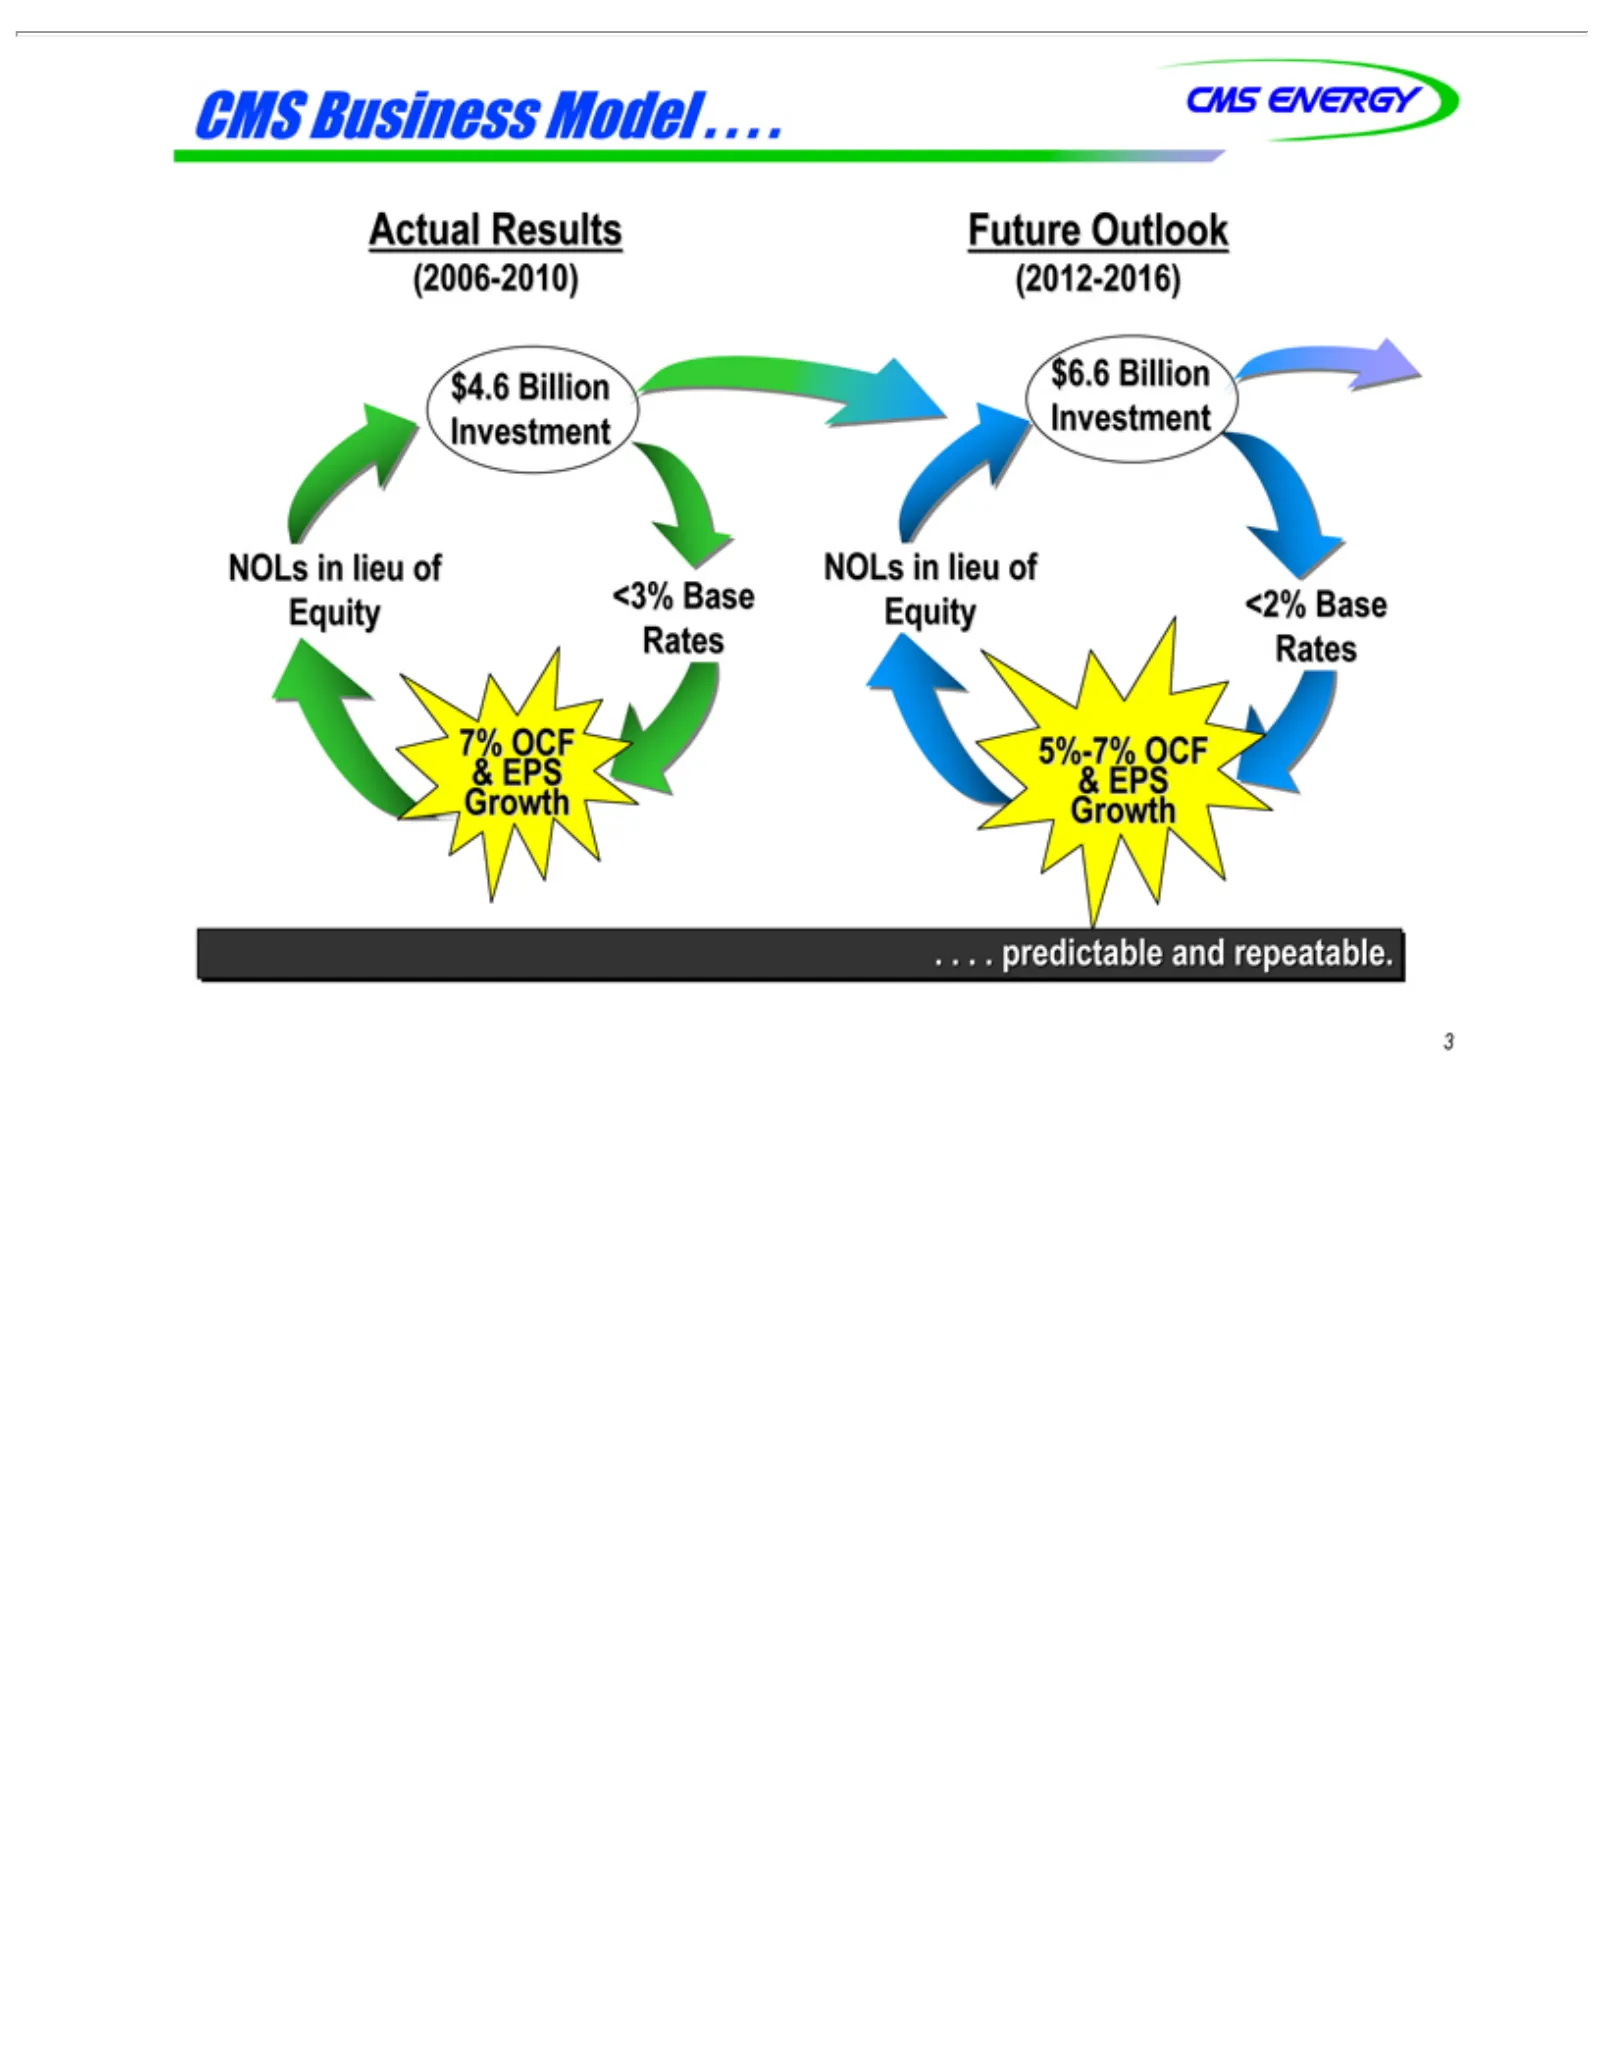
Slide 4: Business model and outlook
(2012-2016) CMS Actual $4.6 (2006-2010) NOLs Equity 7% & Future GrowthEPS OCF Billion Business in Outlook Results <3% lieuInvestment Base ofModel Rates. . . . $6.6 NOLs Investment Equity 5%-7% Rates .& Growth . .EPS Billion . predictable in <2% OCF lieuBase of and repeatable. 3
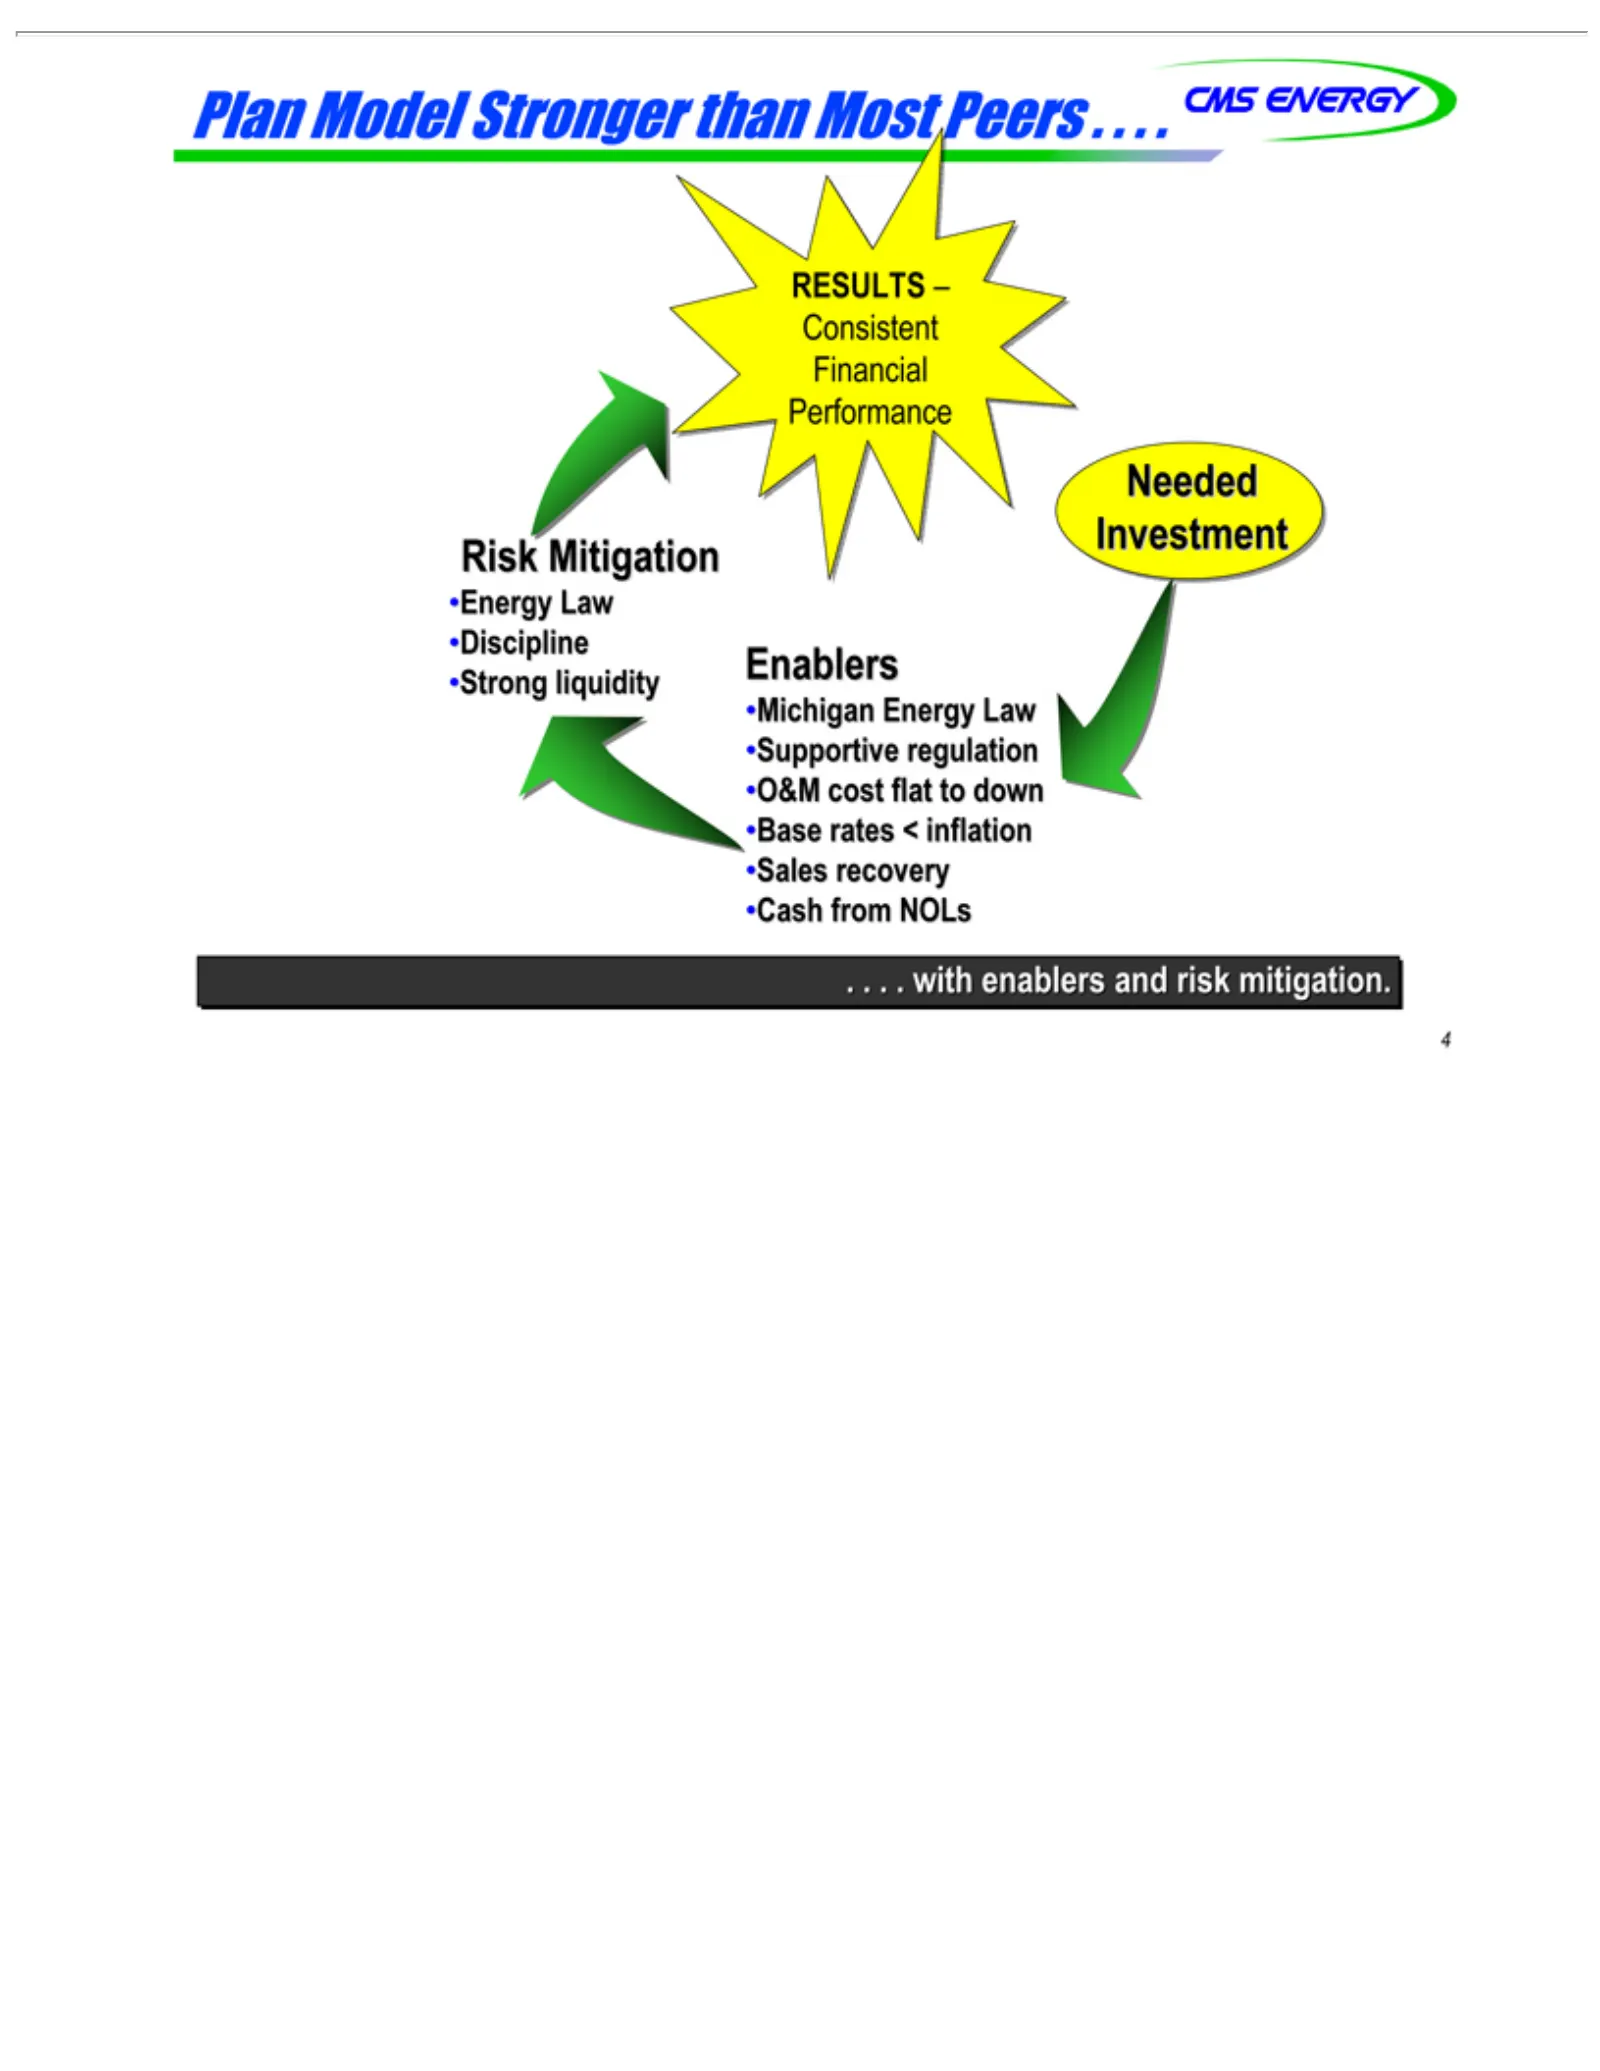
Slide 5: Consistent financial performance
Plan RESULTS Consistent Risk Energy Strong Discipline Michigan Enablers Supportive O&M Base Sales Cash .Needed 4 . . . with Model Mitigation rates from recovery cost liquidity Law Investment enablers Energy <NOLs Financial –flat regulation Stronger inflation to down Law and Performance than riskMost
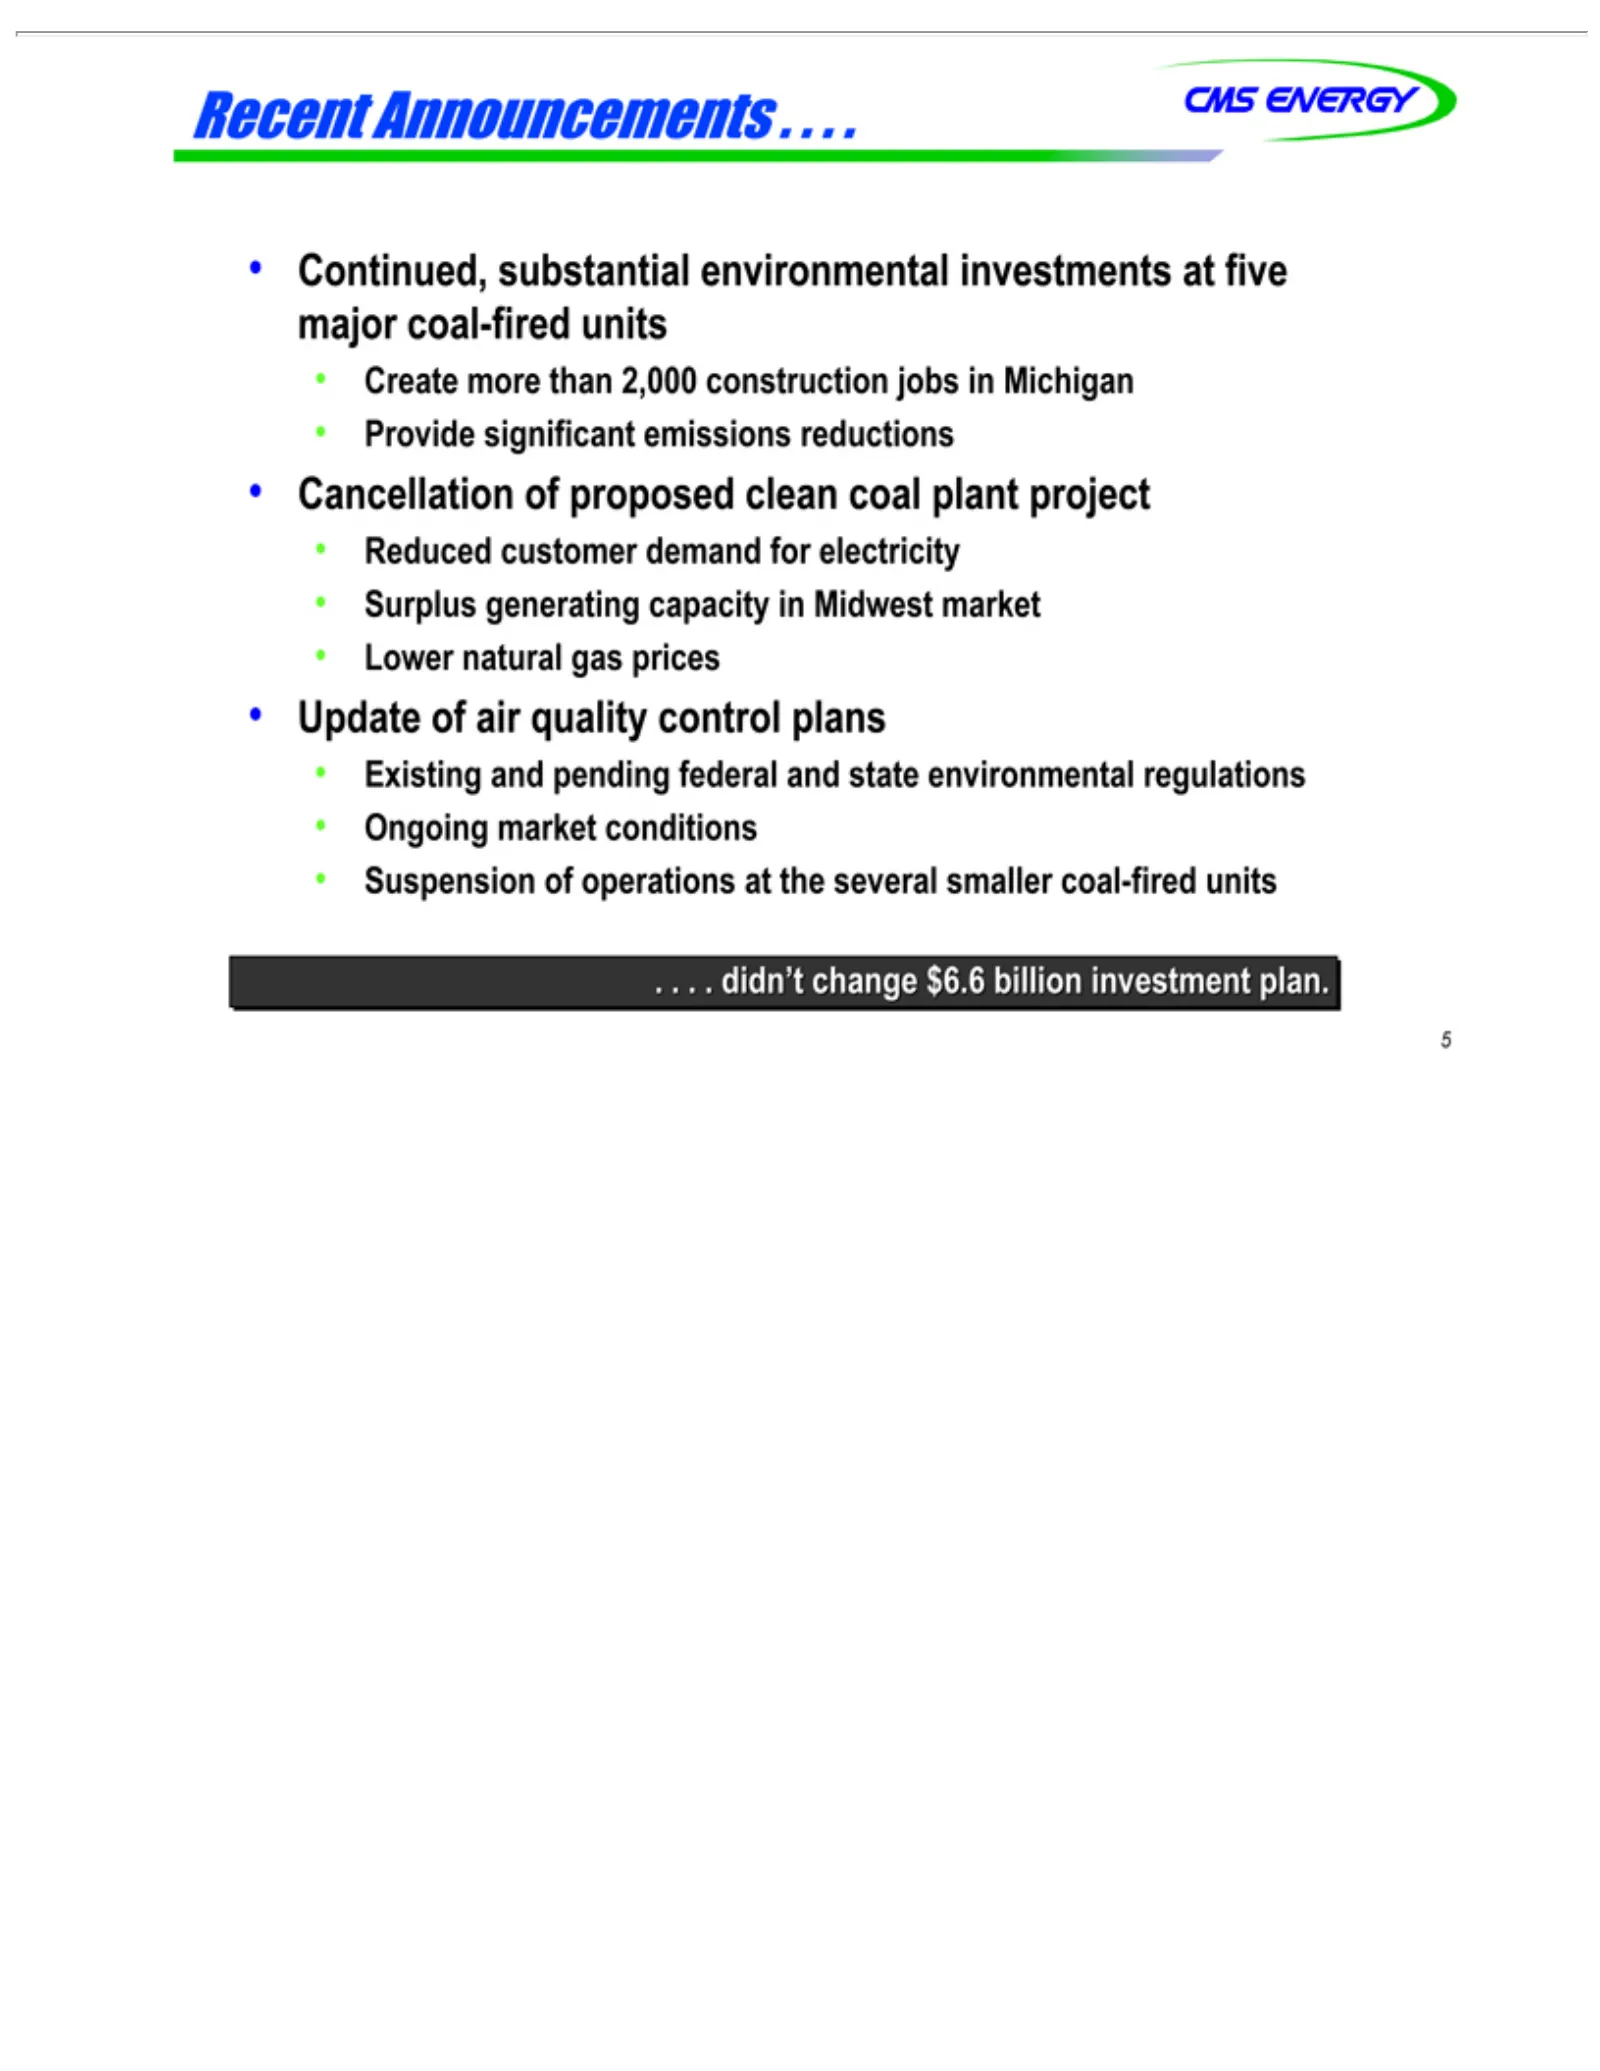
Slide 6: Recent announcements and market conditions
Recent Continued, Create Provide Cancellation Reduced Surplus Lower Update Existing Ongoing .Suspension 5 . . . didn’t more natural Announcements of generating significant and customer market air change substantial ofthan pending of quality gas operations proposed conditions 2,000 prices demand $6.6
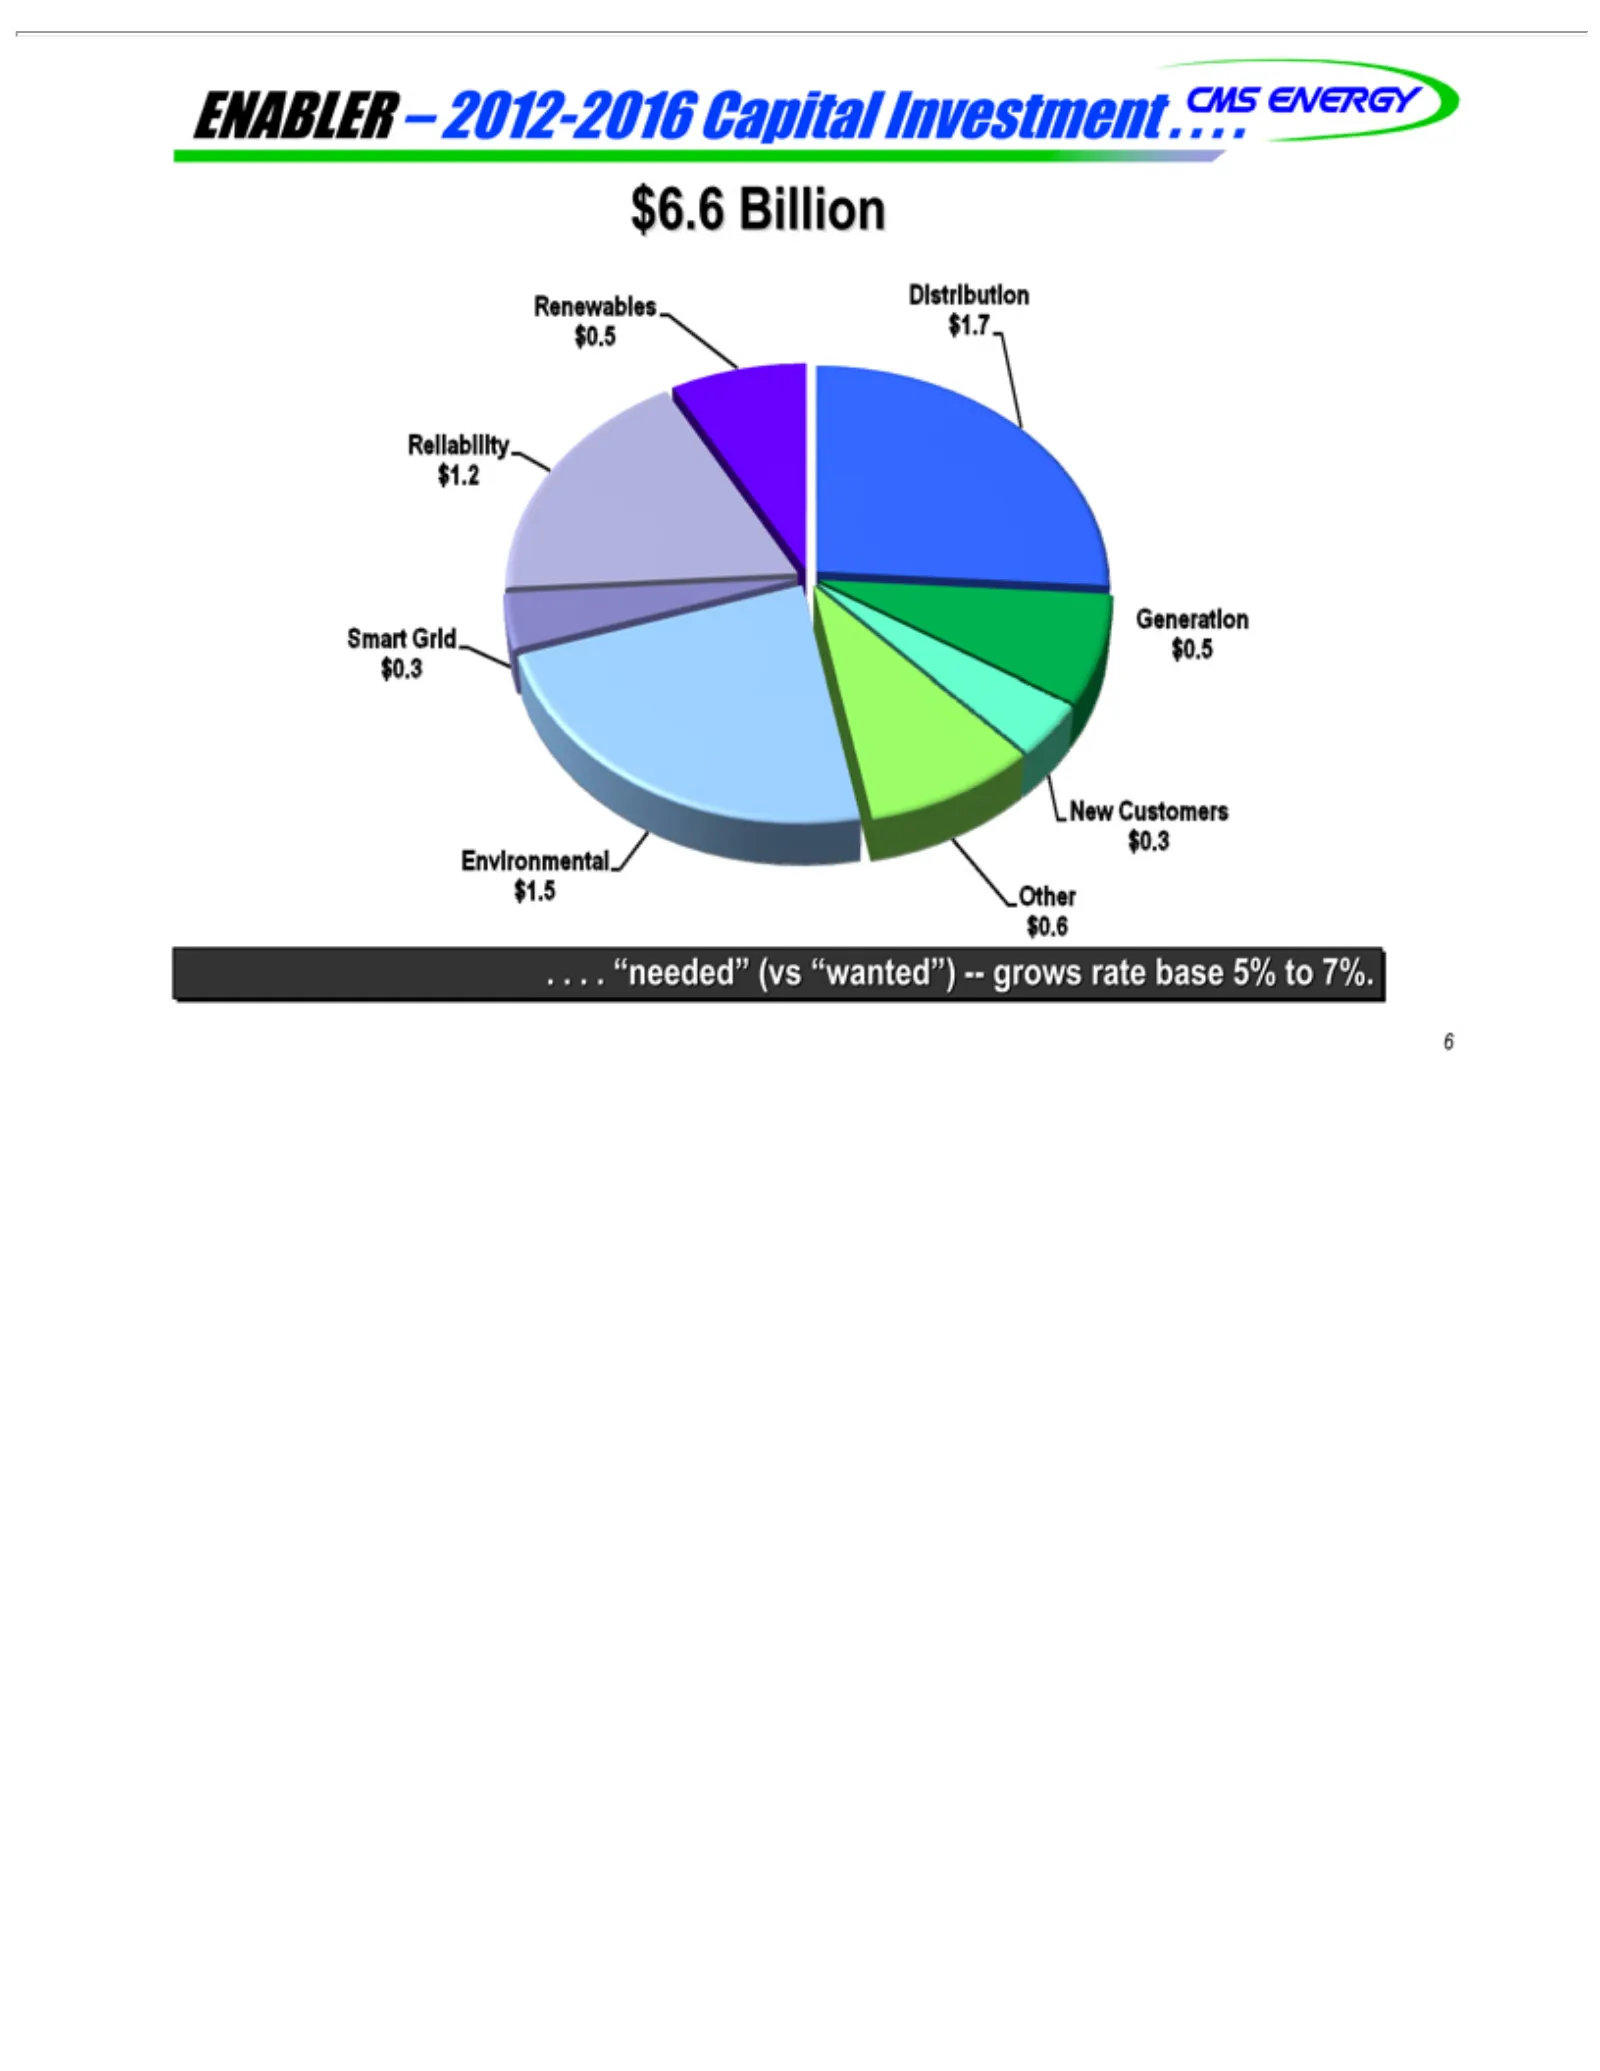
Slide 7: Capital investment 2012-2016 of $6.6 billion
ENABLER $6.6 Renewables $0.5 Smart $1.2 Billion Generation Reliability New $1.5 $1.7$0.5 Environmental $0.3 .6 $0.6 –Distribution Customers Grid Other . . . “needed” 2012-2016 Capital—Investment (vsvs “wanted”) grows rate. base . . . 5% to 7%.
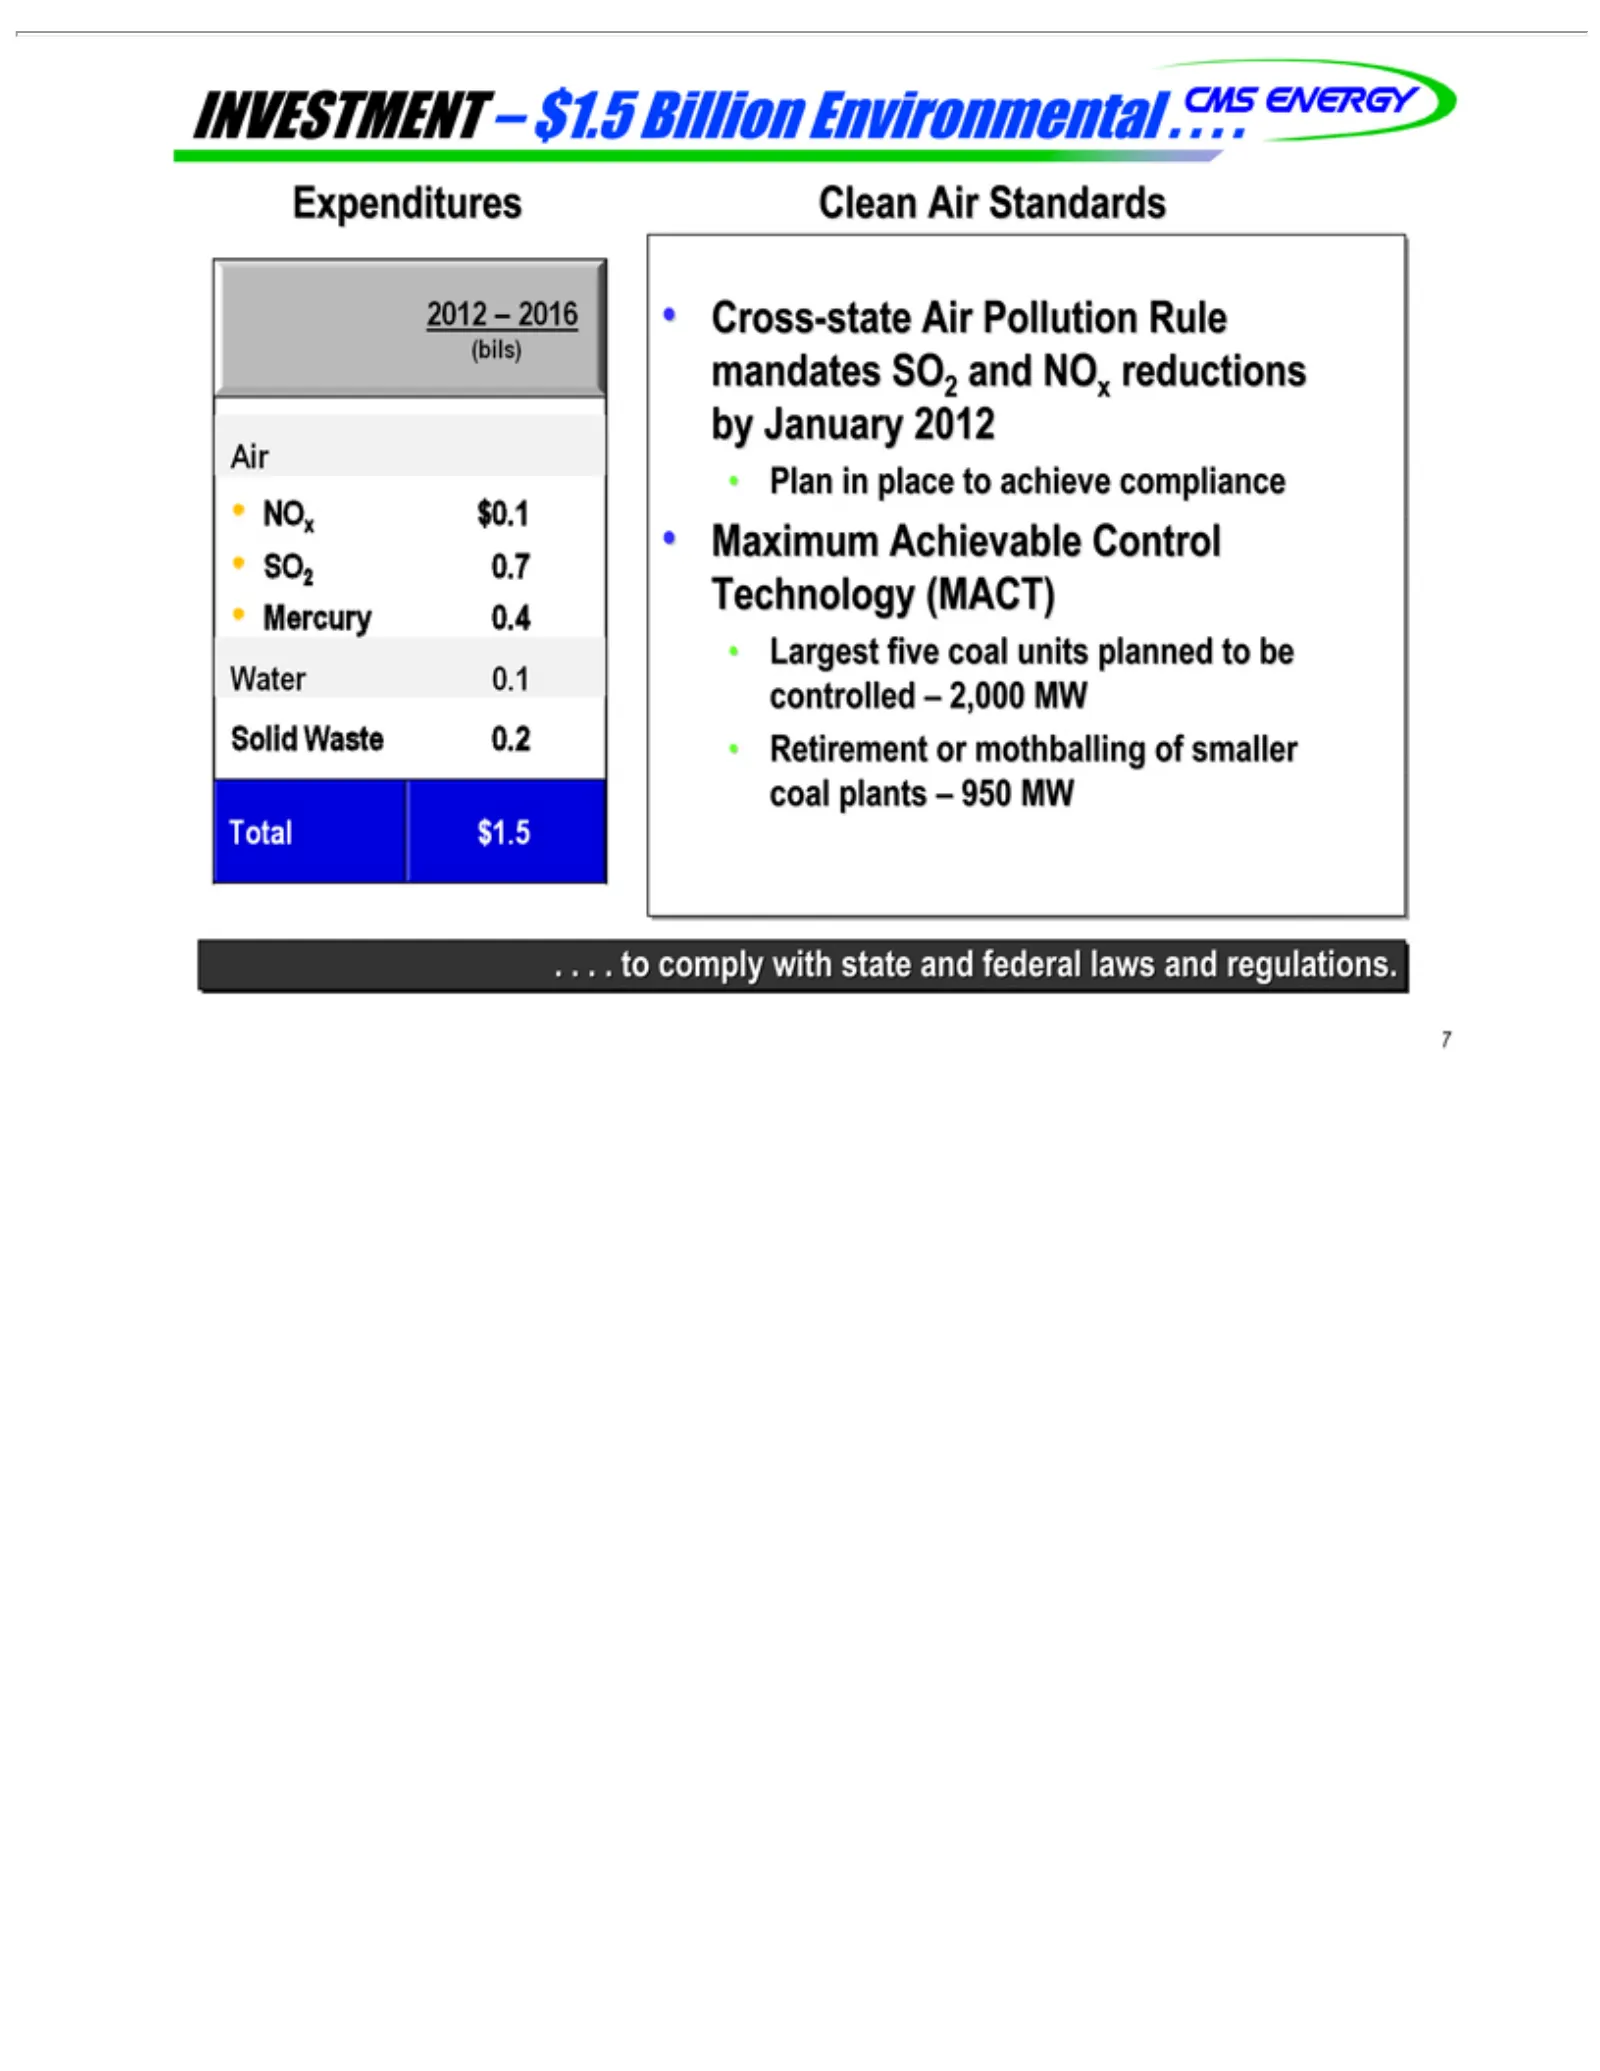
Slide 8: Environmental investment
. . . . to INVESTMENT 2012 Expenditures NOx Air (bils) SO2 Mercury Water Solid Total Clean Cross-state Plan Maximum Largest Retirement in 0.7 $0.1 –$1.5 Waste Air 0.1 2016 comply place five 0.4 Standards Achievable Air or0.2 coal tomothballing Pollution with achieve –units $1.5 state planned Control
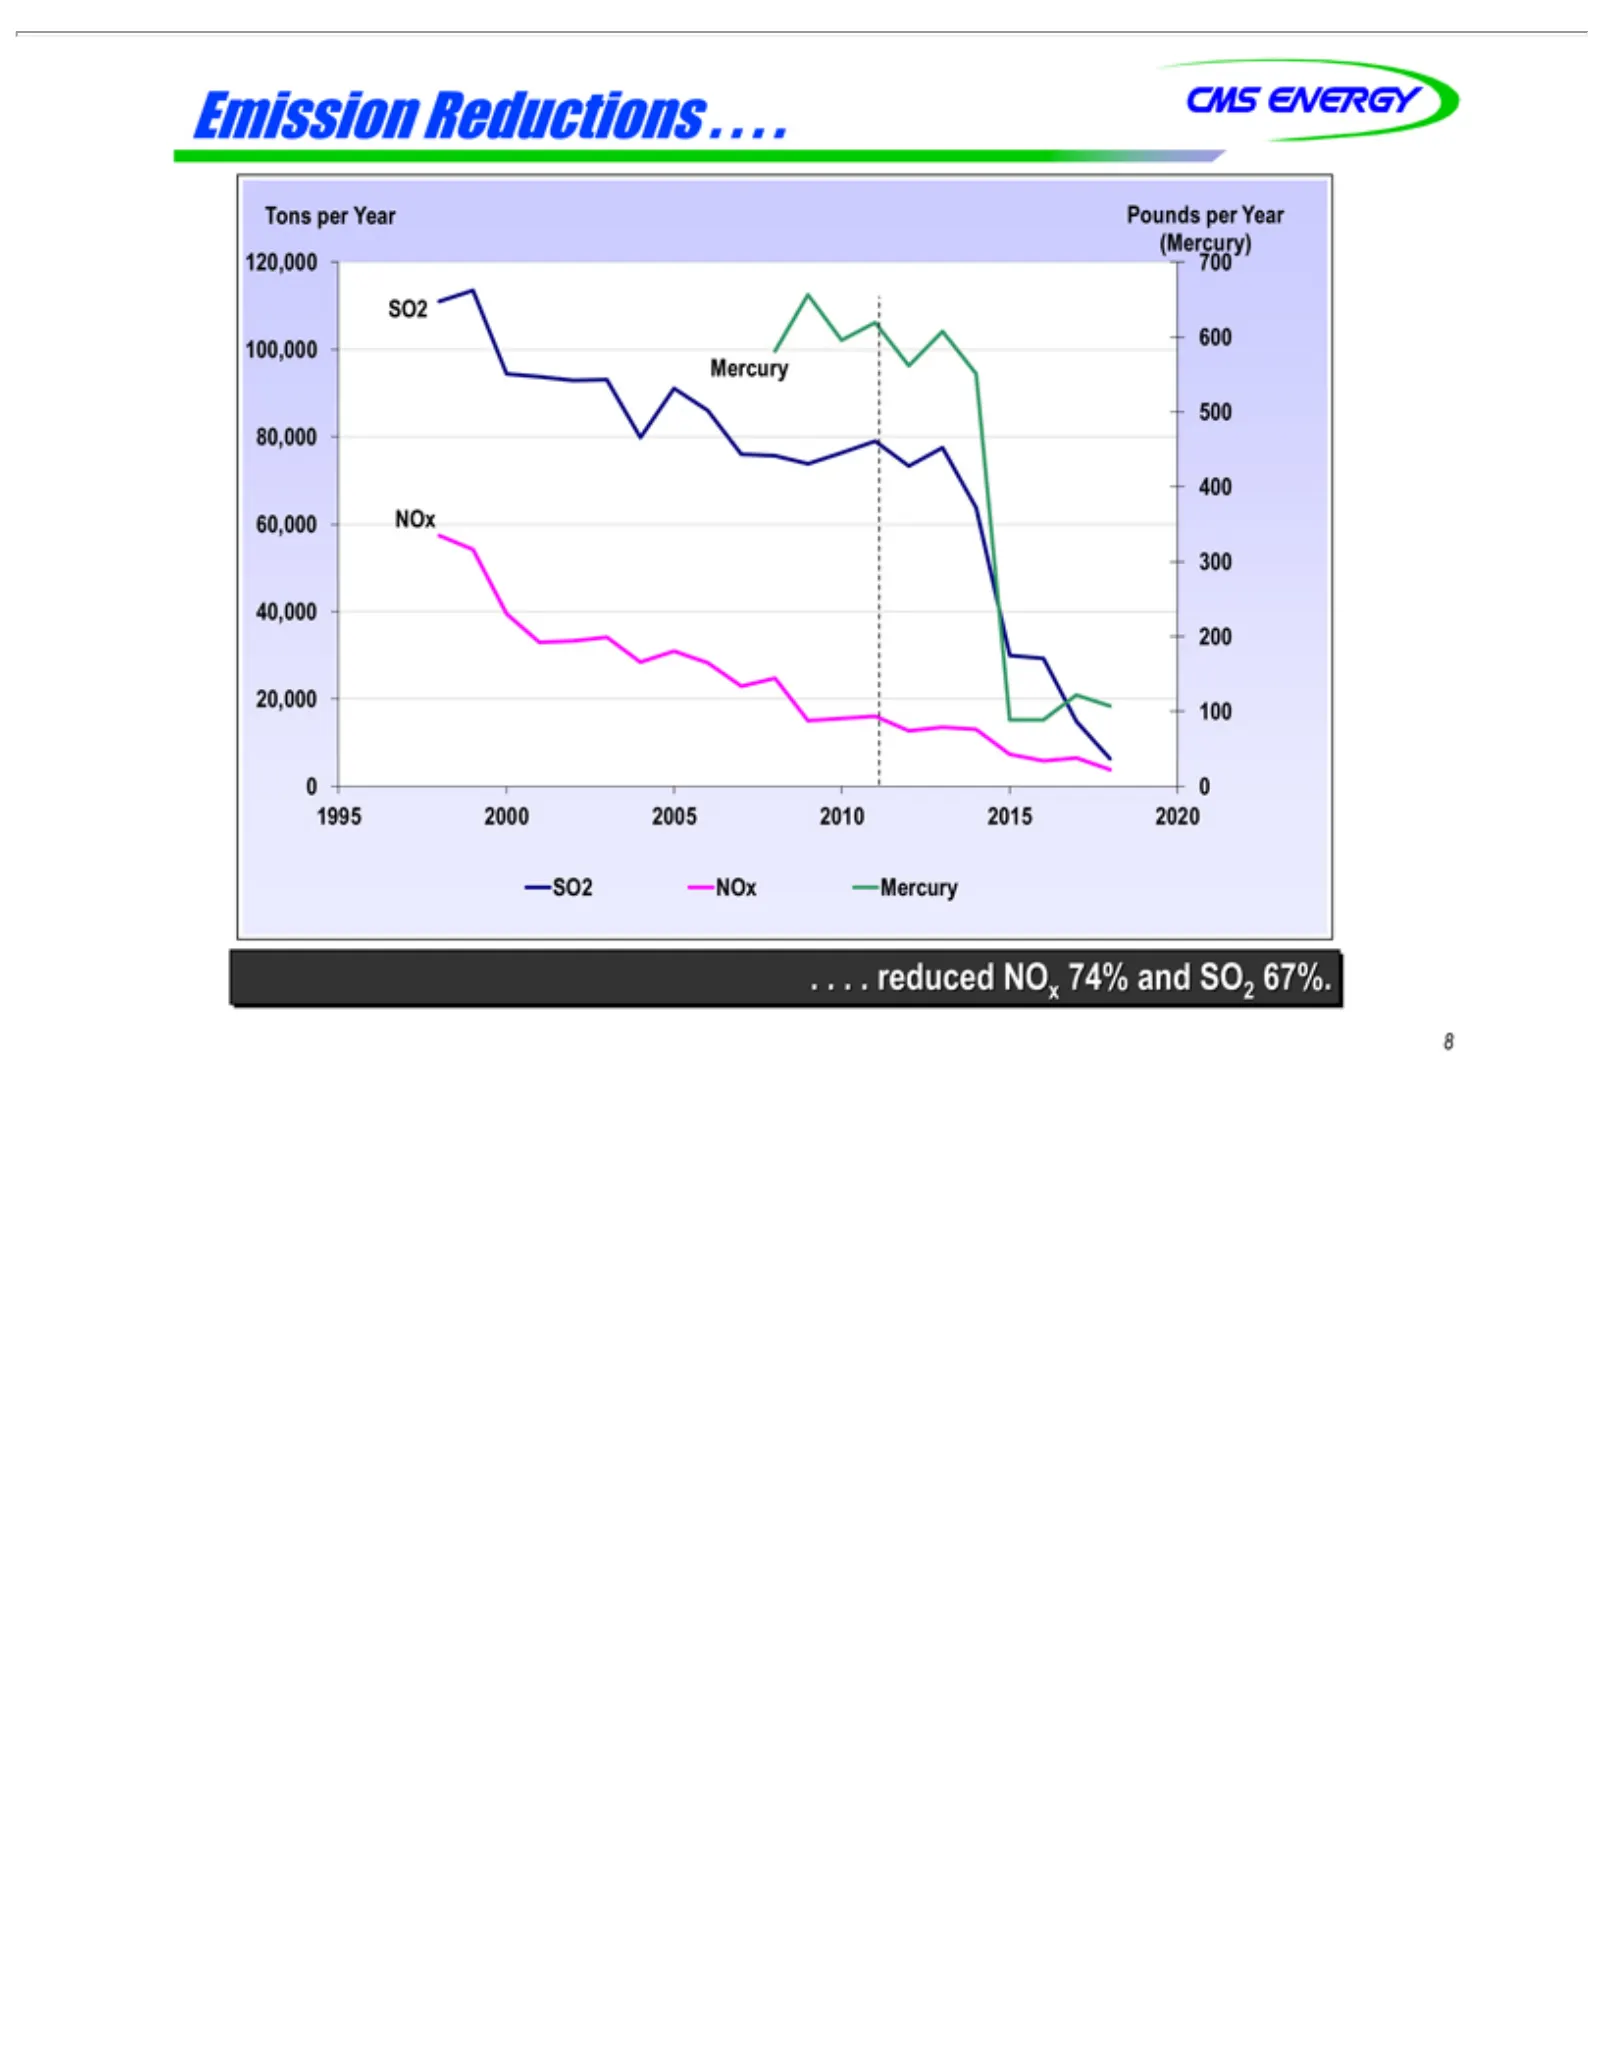
Slide 9: Emission reductions
Emission Tons 120,000 (Mercury) 100,000 60,000 400 80,000 500 Mercury 20,000 200 40,000 300 0 1995 SO2 reduced 8 0 NOx per 2000 NOx 100 NOx 700 600 Year Reductions Mercury 2005 74% Pounds 2010 and.per 2015 .SO2 . .Year 2020 67%.
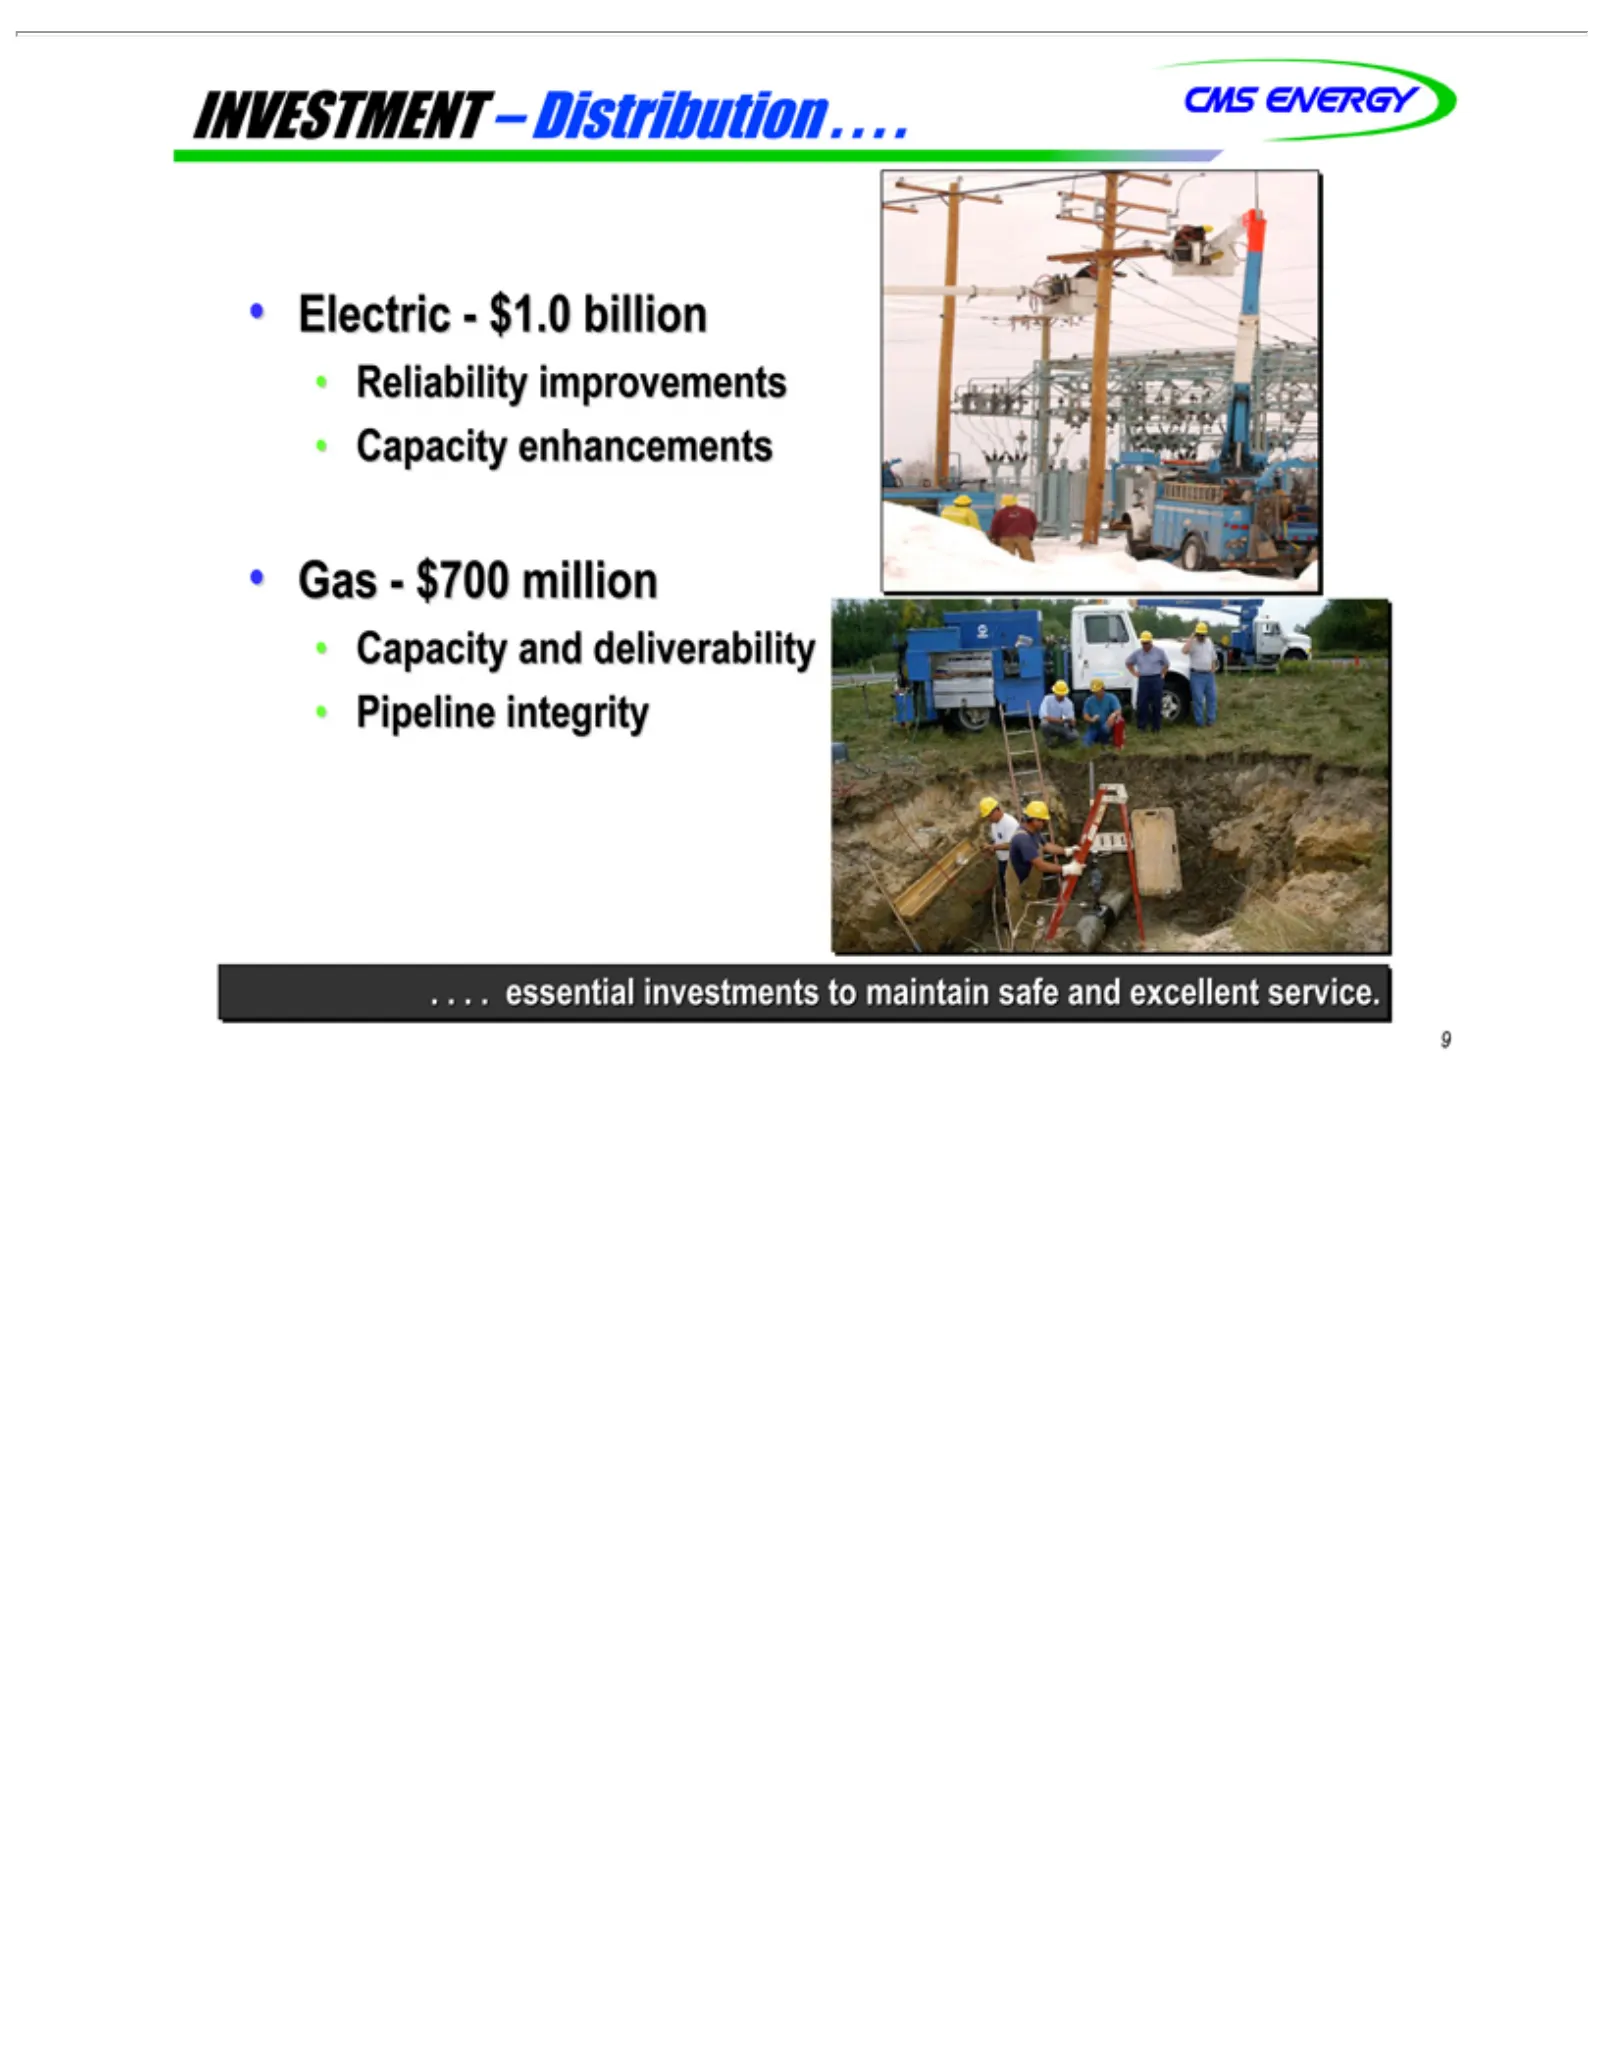
Slide 10: Investment: reliability and pipeline integrity
INVESTMENT Electric—$1.0 Reliability Gas—$700 Capacity .Pipeline 9 . . . essential integrity enhancements and improvements million deliverability investments billion – Distribution to maintain . . . . safe and excellent service.
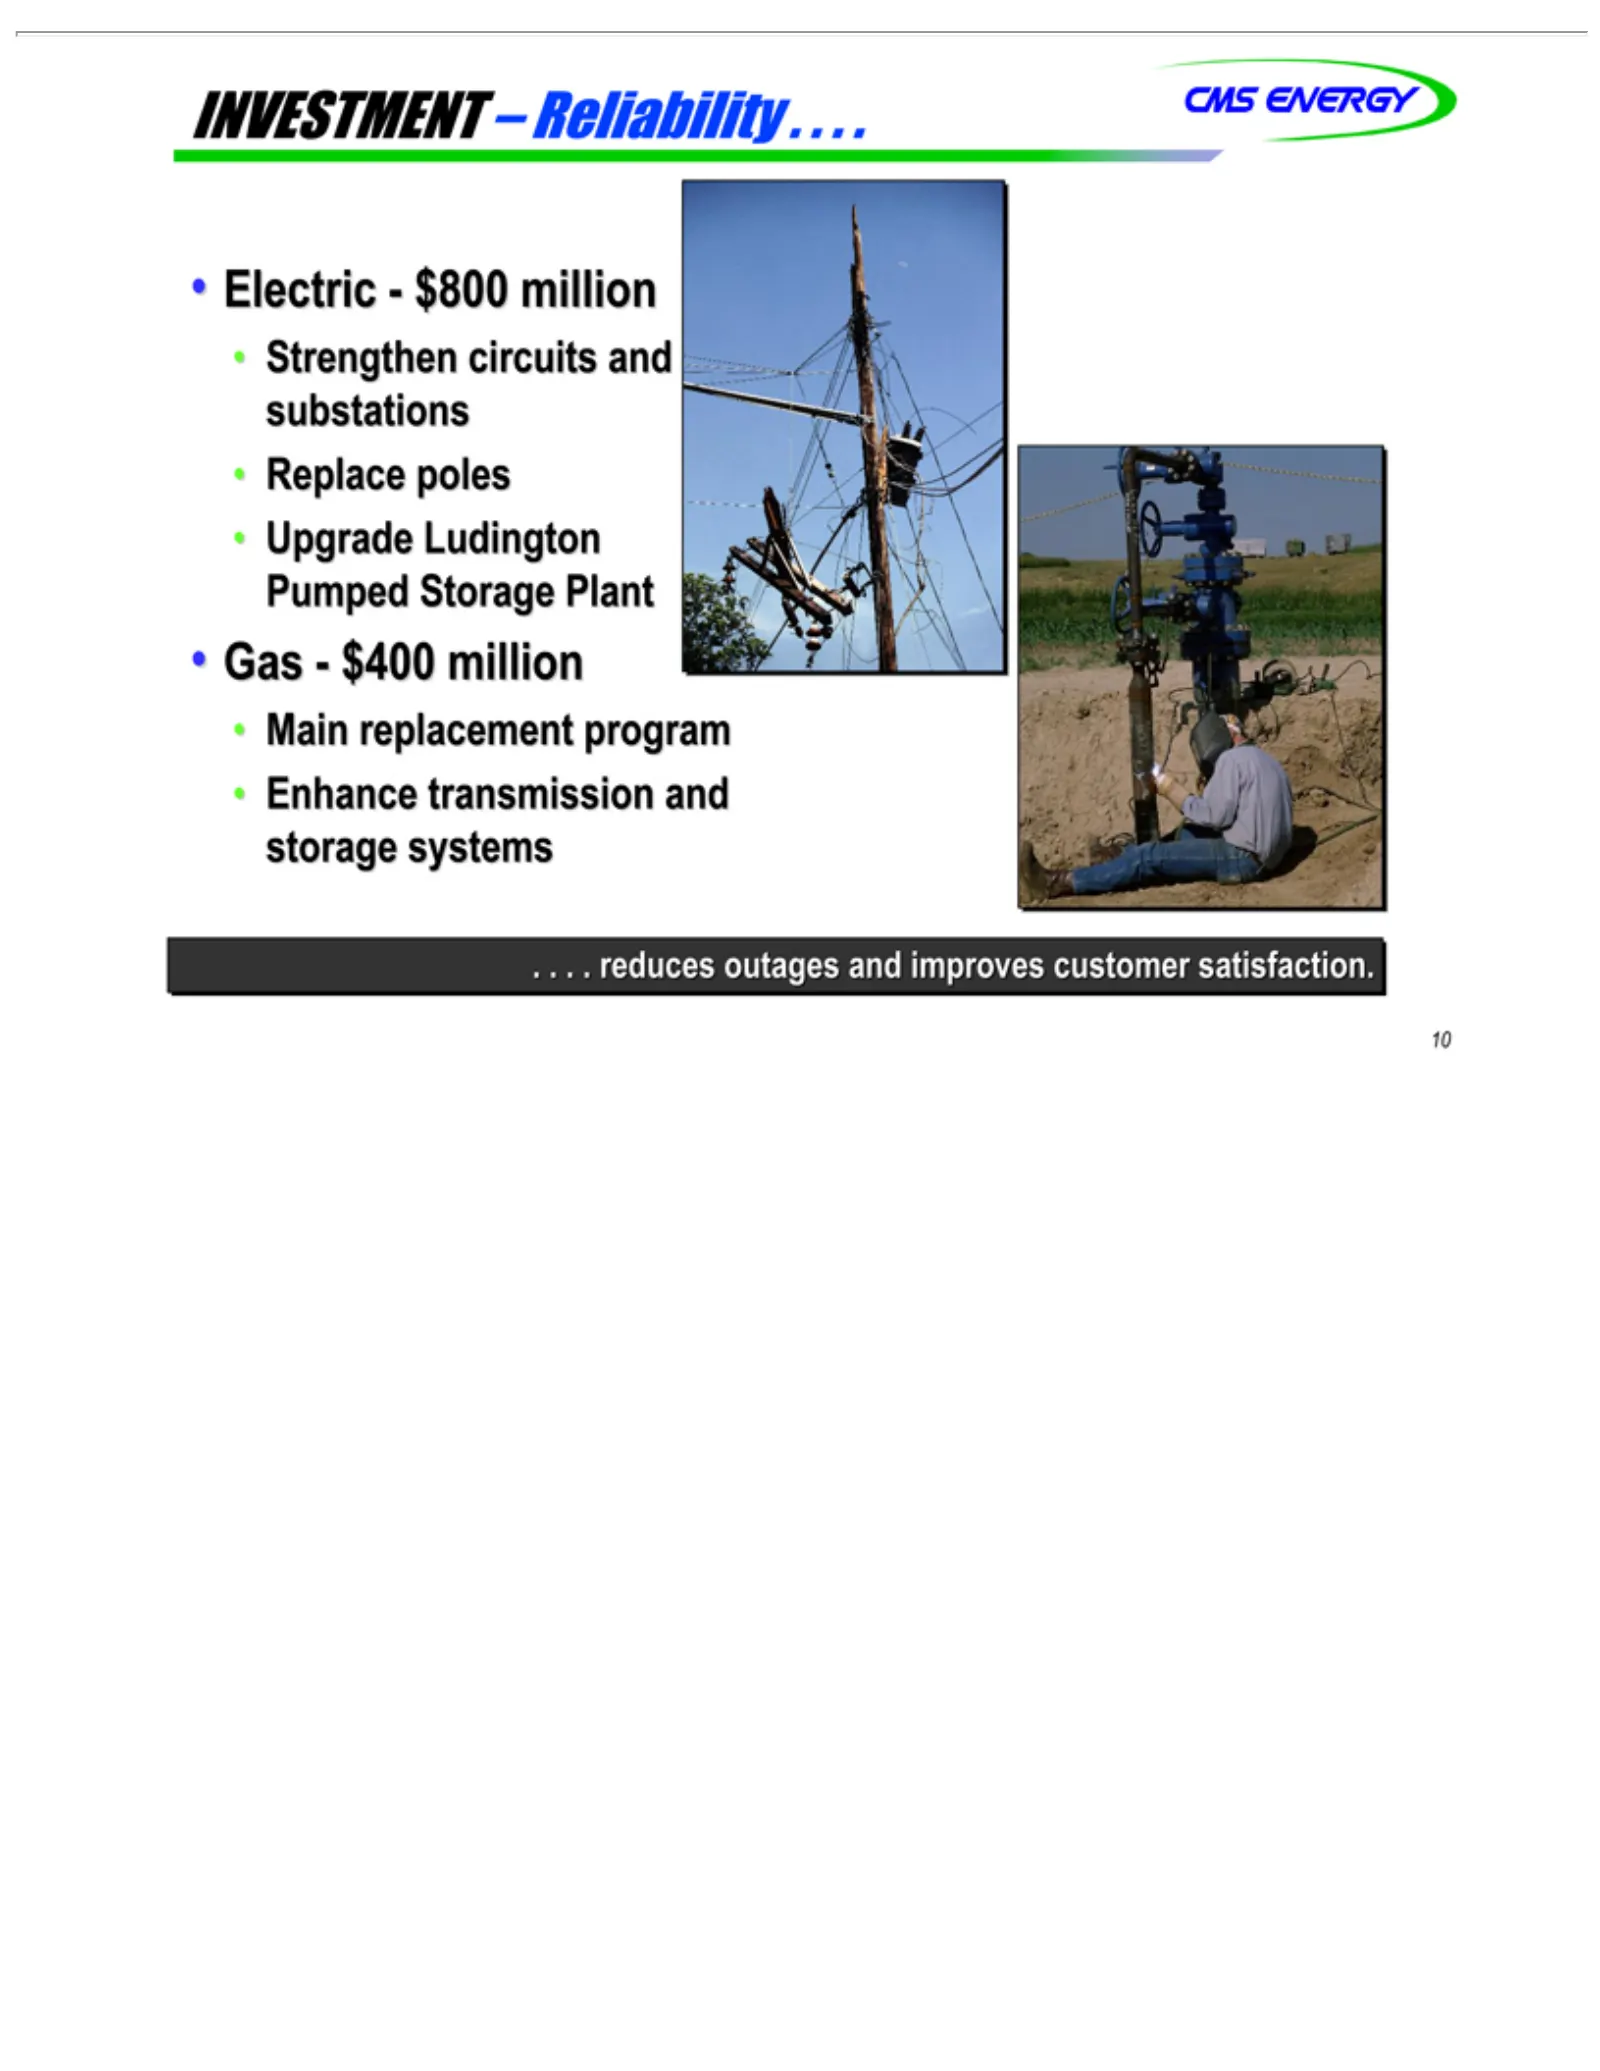
Slide 11: Investment: electric and gas reliability
INVESTMENT Electric—$800 Strengthen Replace Upgrade Gas—$400 Main .Enhance 10 . . . reduces replacement poles transmission Ludington circuits million outages million – Reliability program and Pumped and and substations improves storage Storage . . . . systems customer Plant satisfaction.
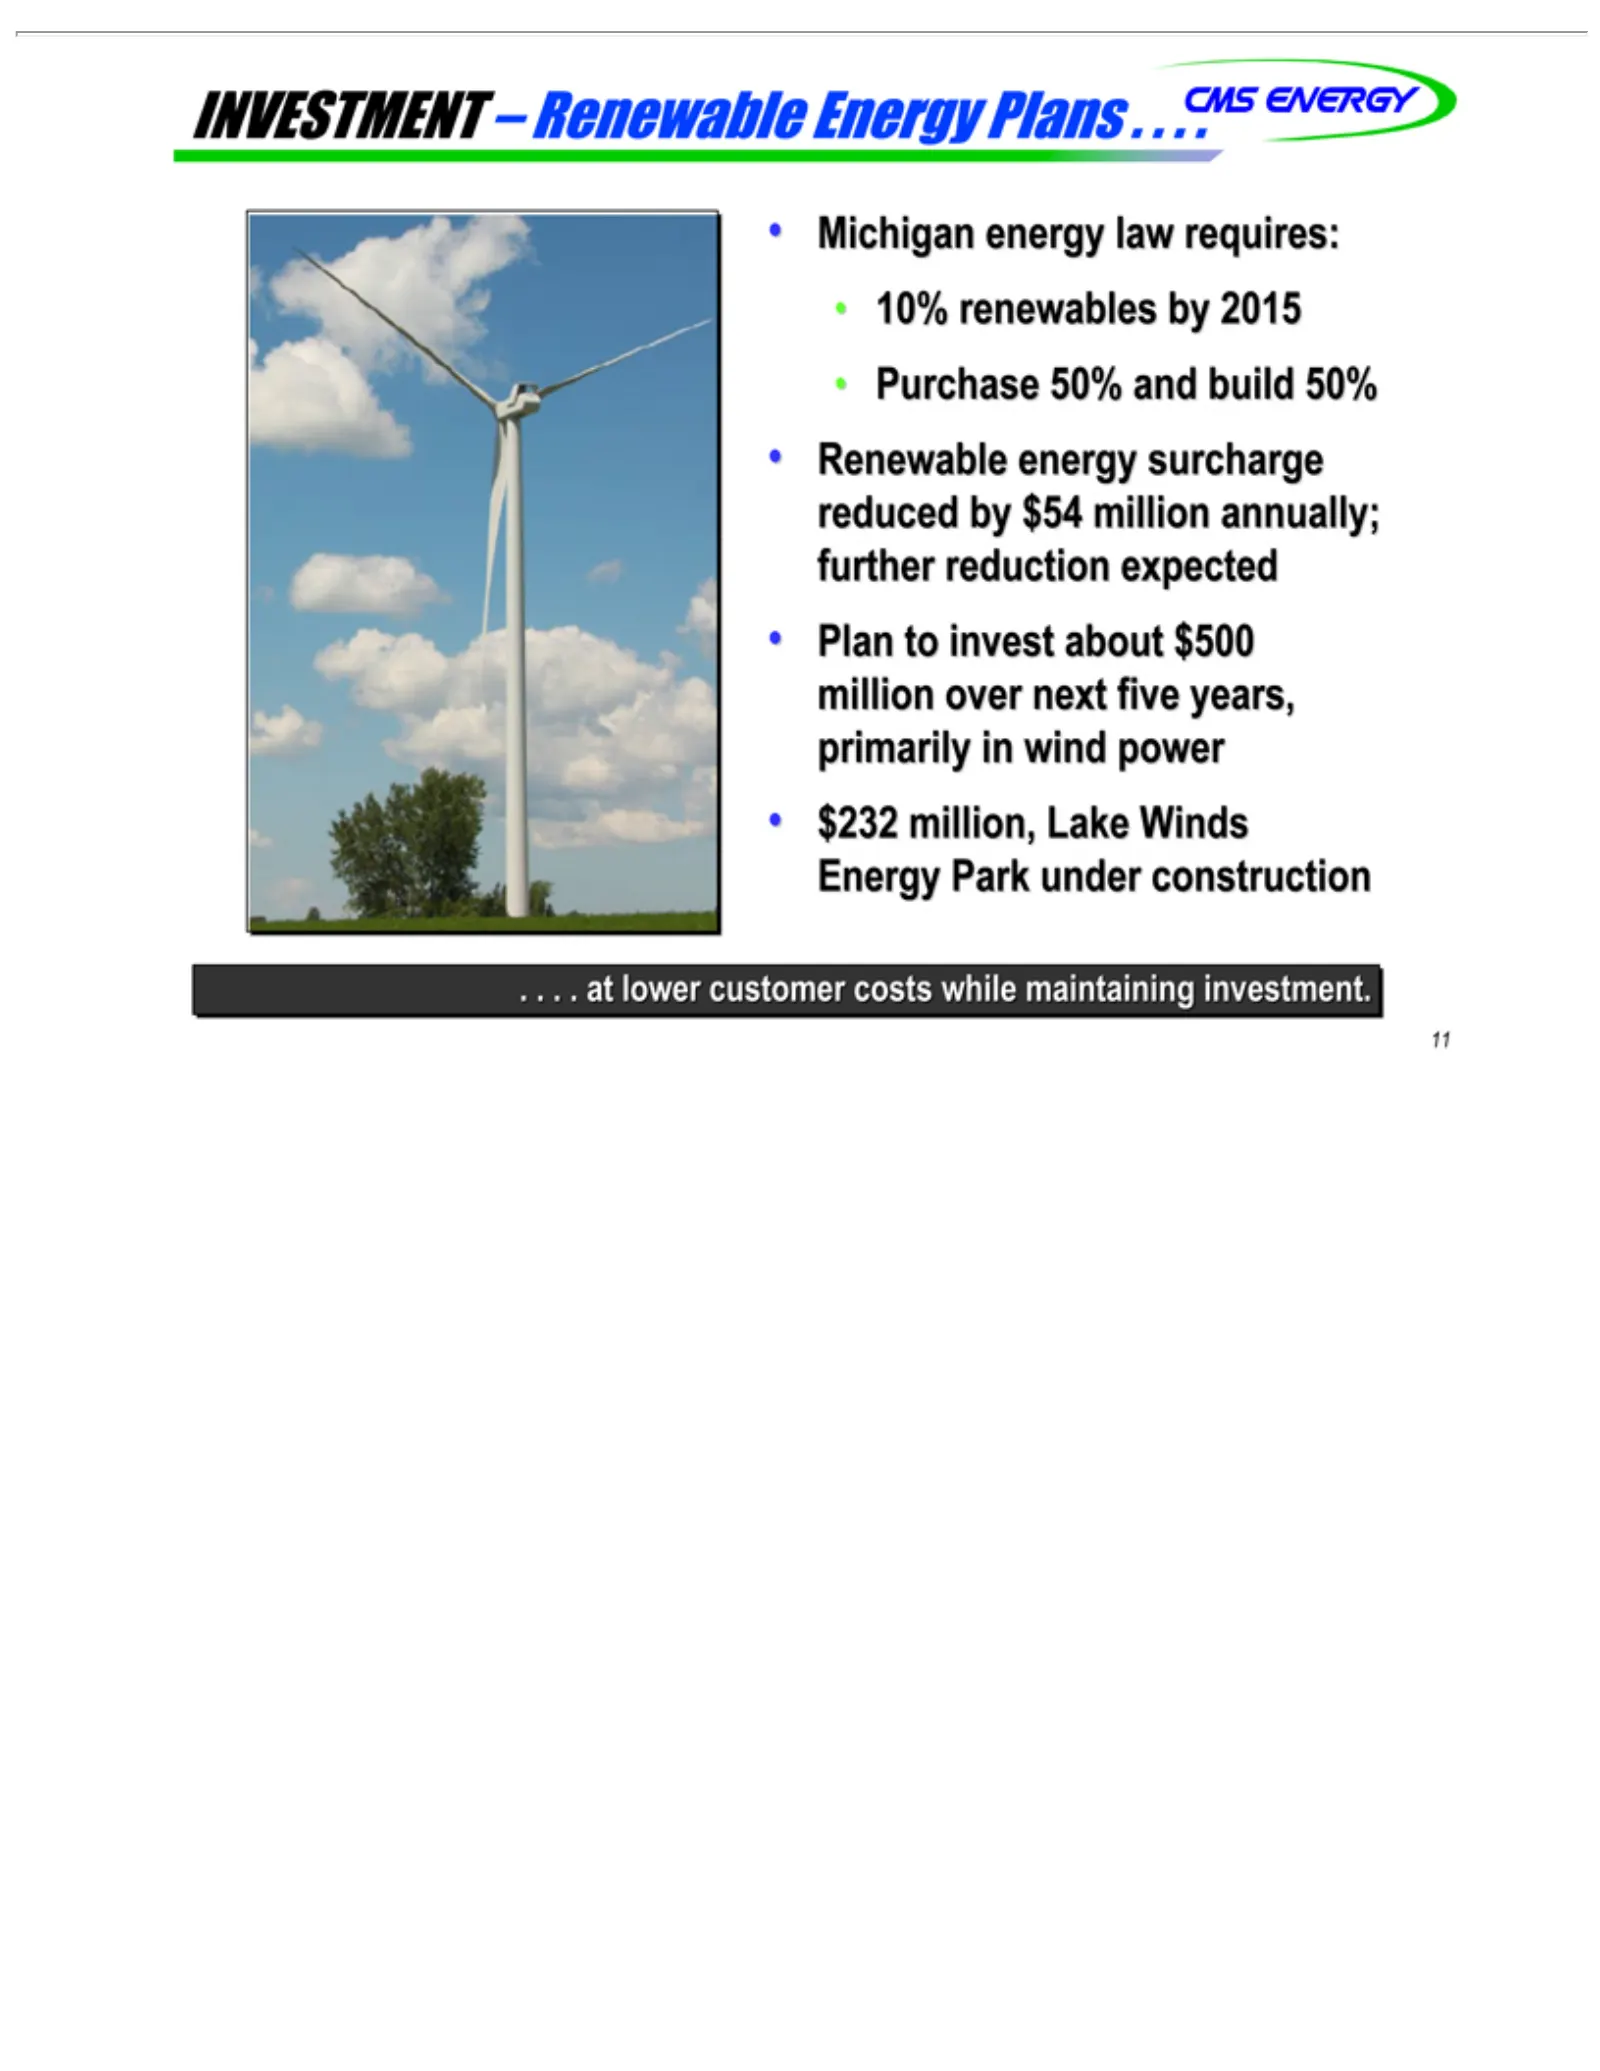
Slide 12: Investment: renewable energy
INVESTMENT Michigan 10% Purchase Renewable Plan .$232 11 . . . at to renewables million, lower invest 50% energy energy customer Lake about and –by law Renewable build surcharge Winds 2015 $500 requires: costs 50% million Energy while reduced Energy over Park maintaining by Plans next under $54five
Slide 13: Investment: smart grid
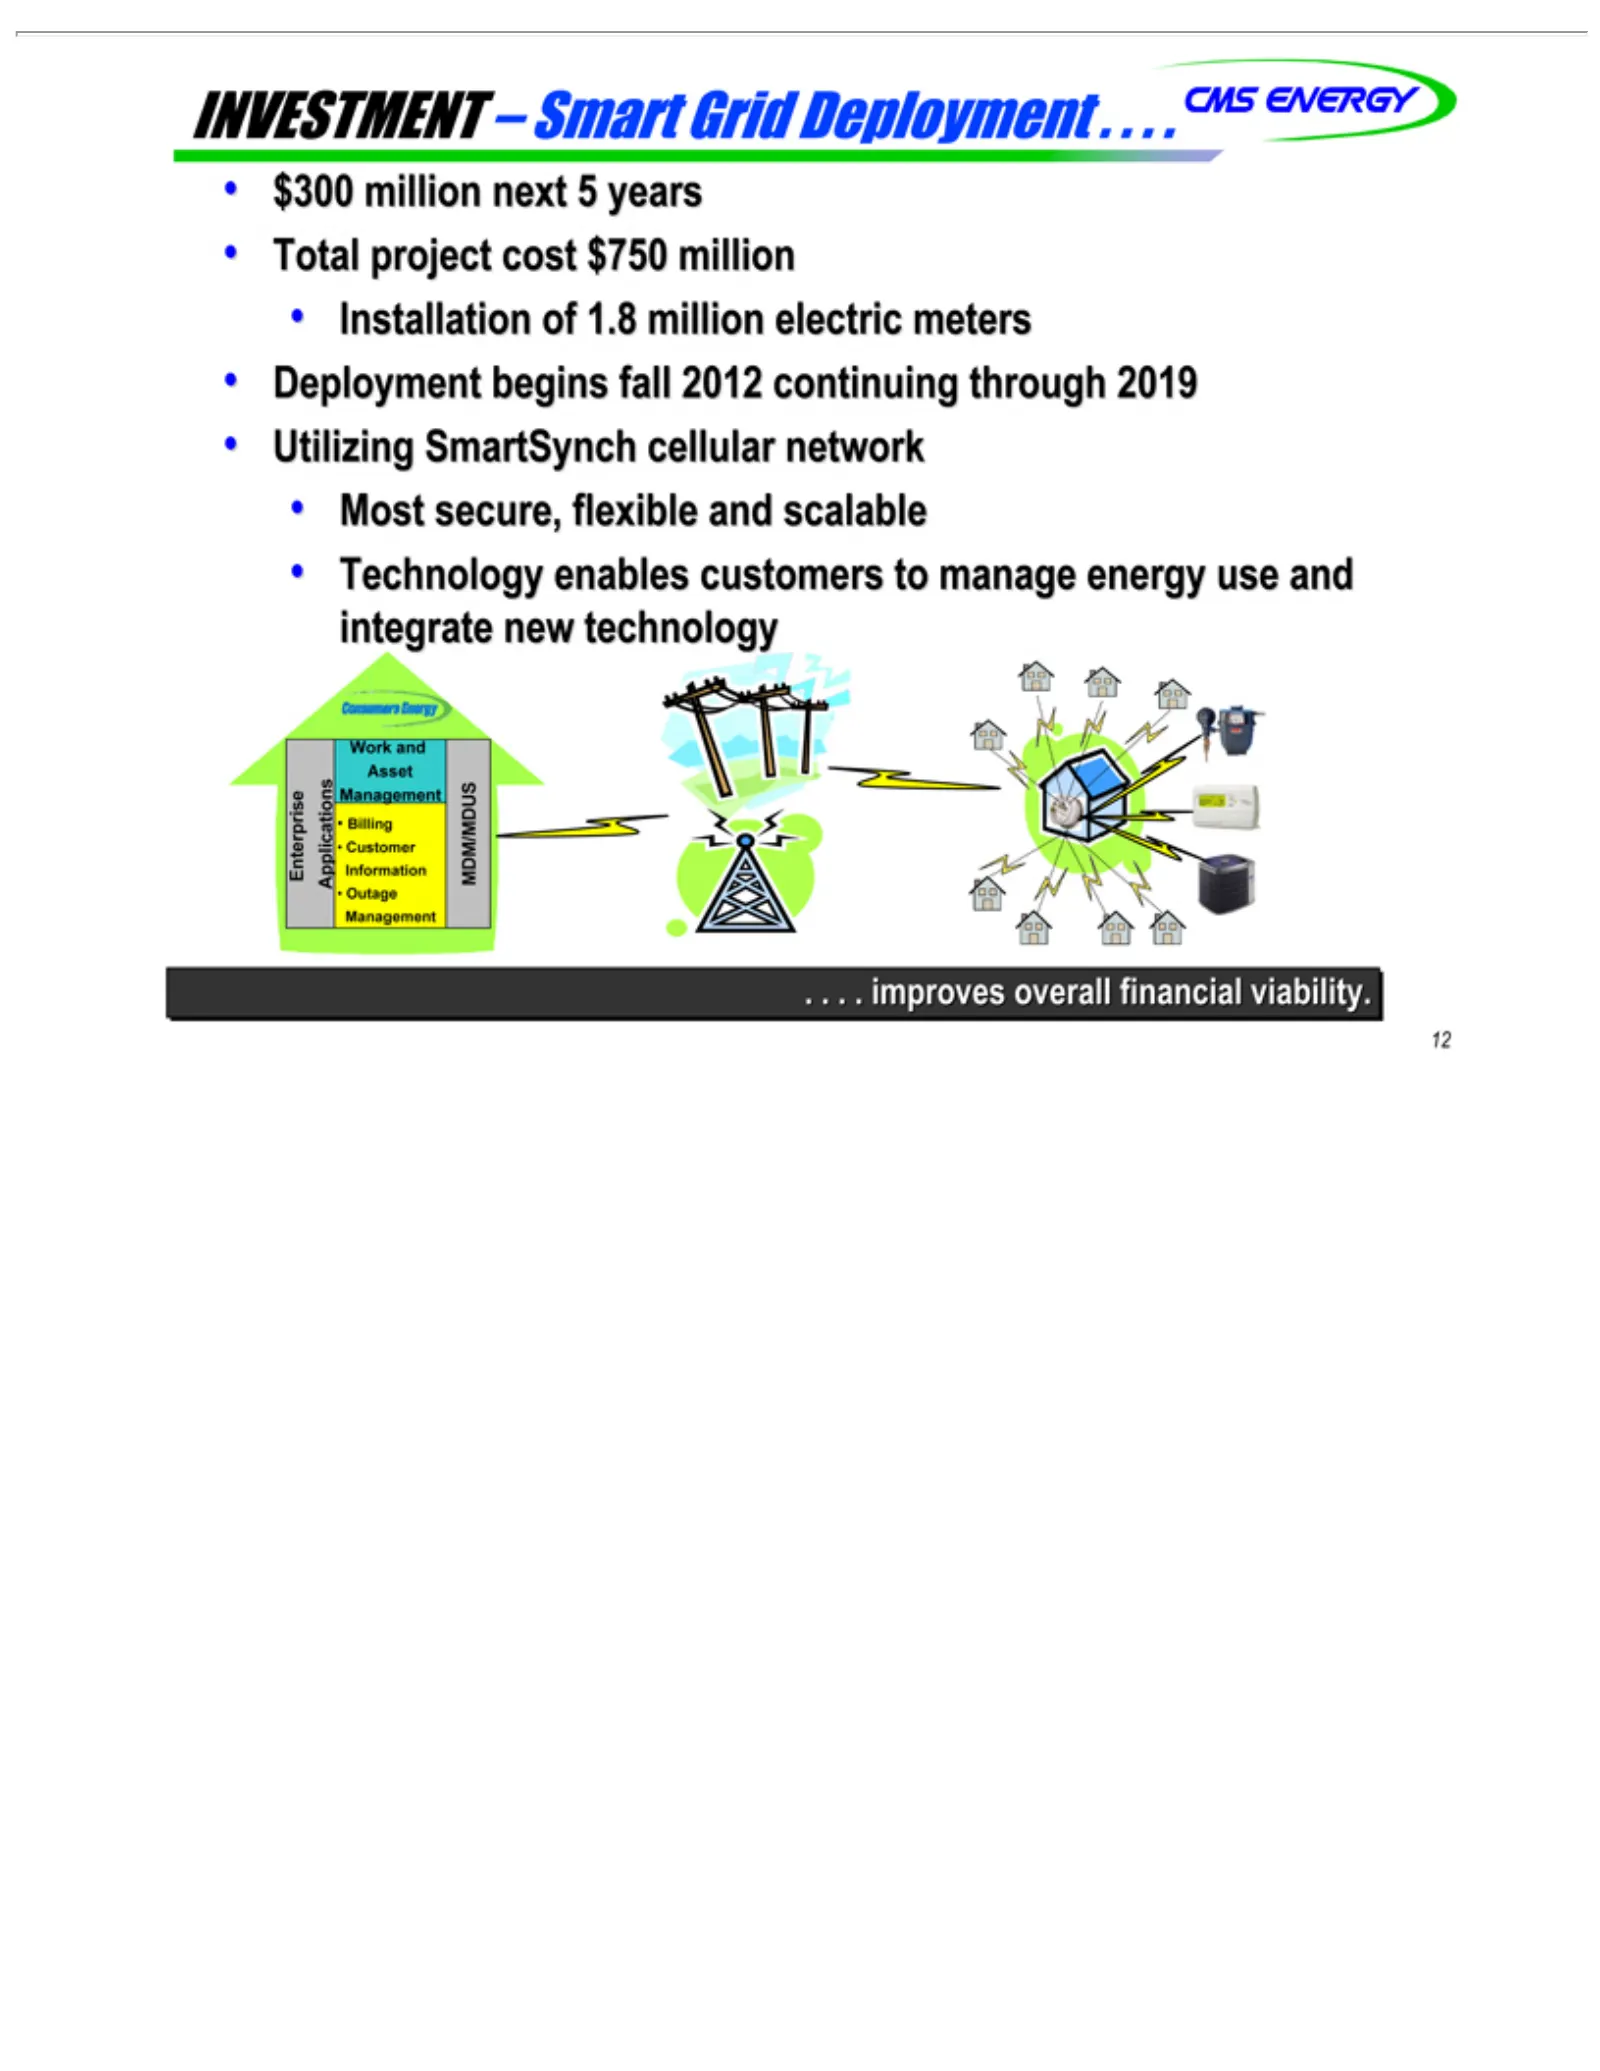
INVESTMENT $300 Total Installation Deployment Utilizing Most Technology integrate Enterprise Work .Billing MDM/MDUS 12 . . . improves million project secure, and Customer new SmartSynch Asset Applications of enables begins cost flexible next technology 1.8 overall Management – Information $750 milli
Slide 14: Customer plan and rate increases
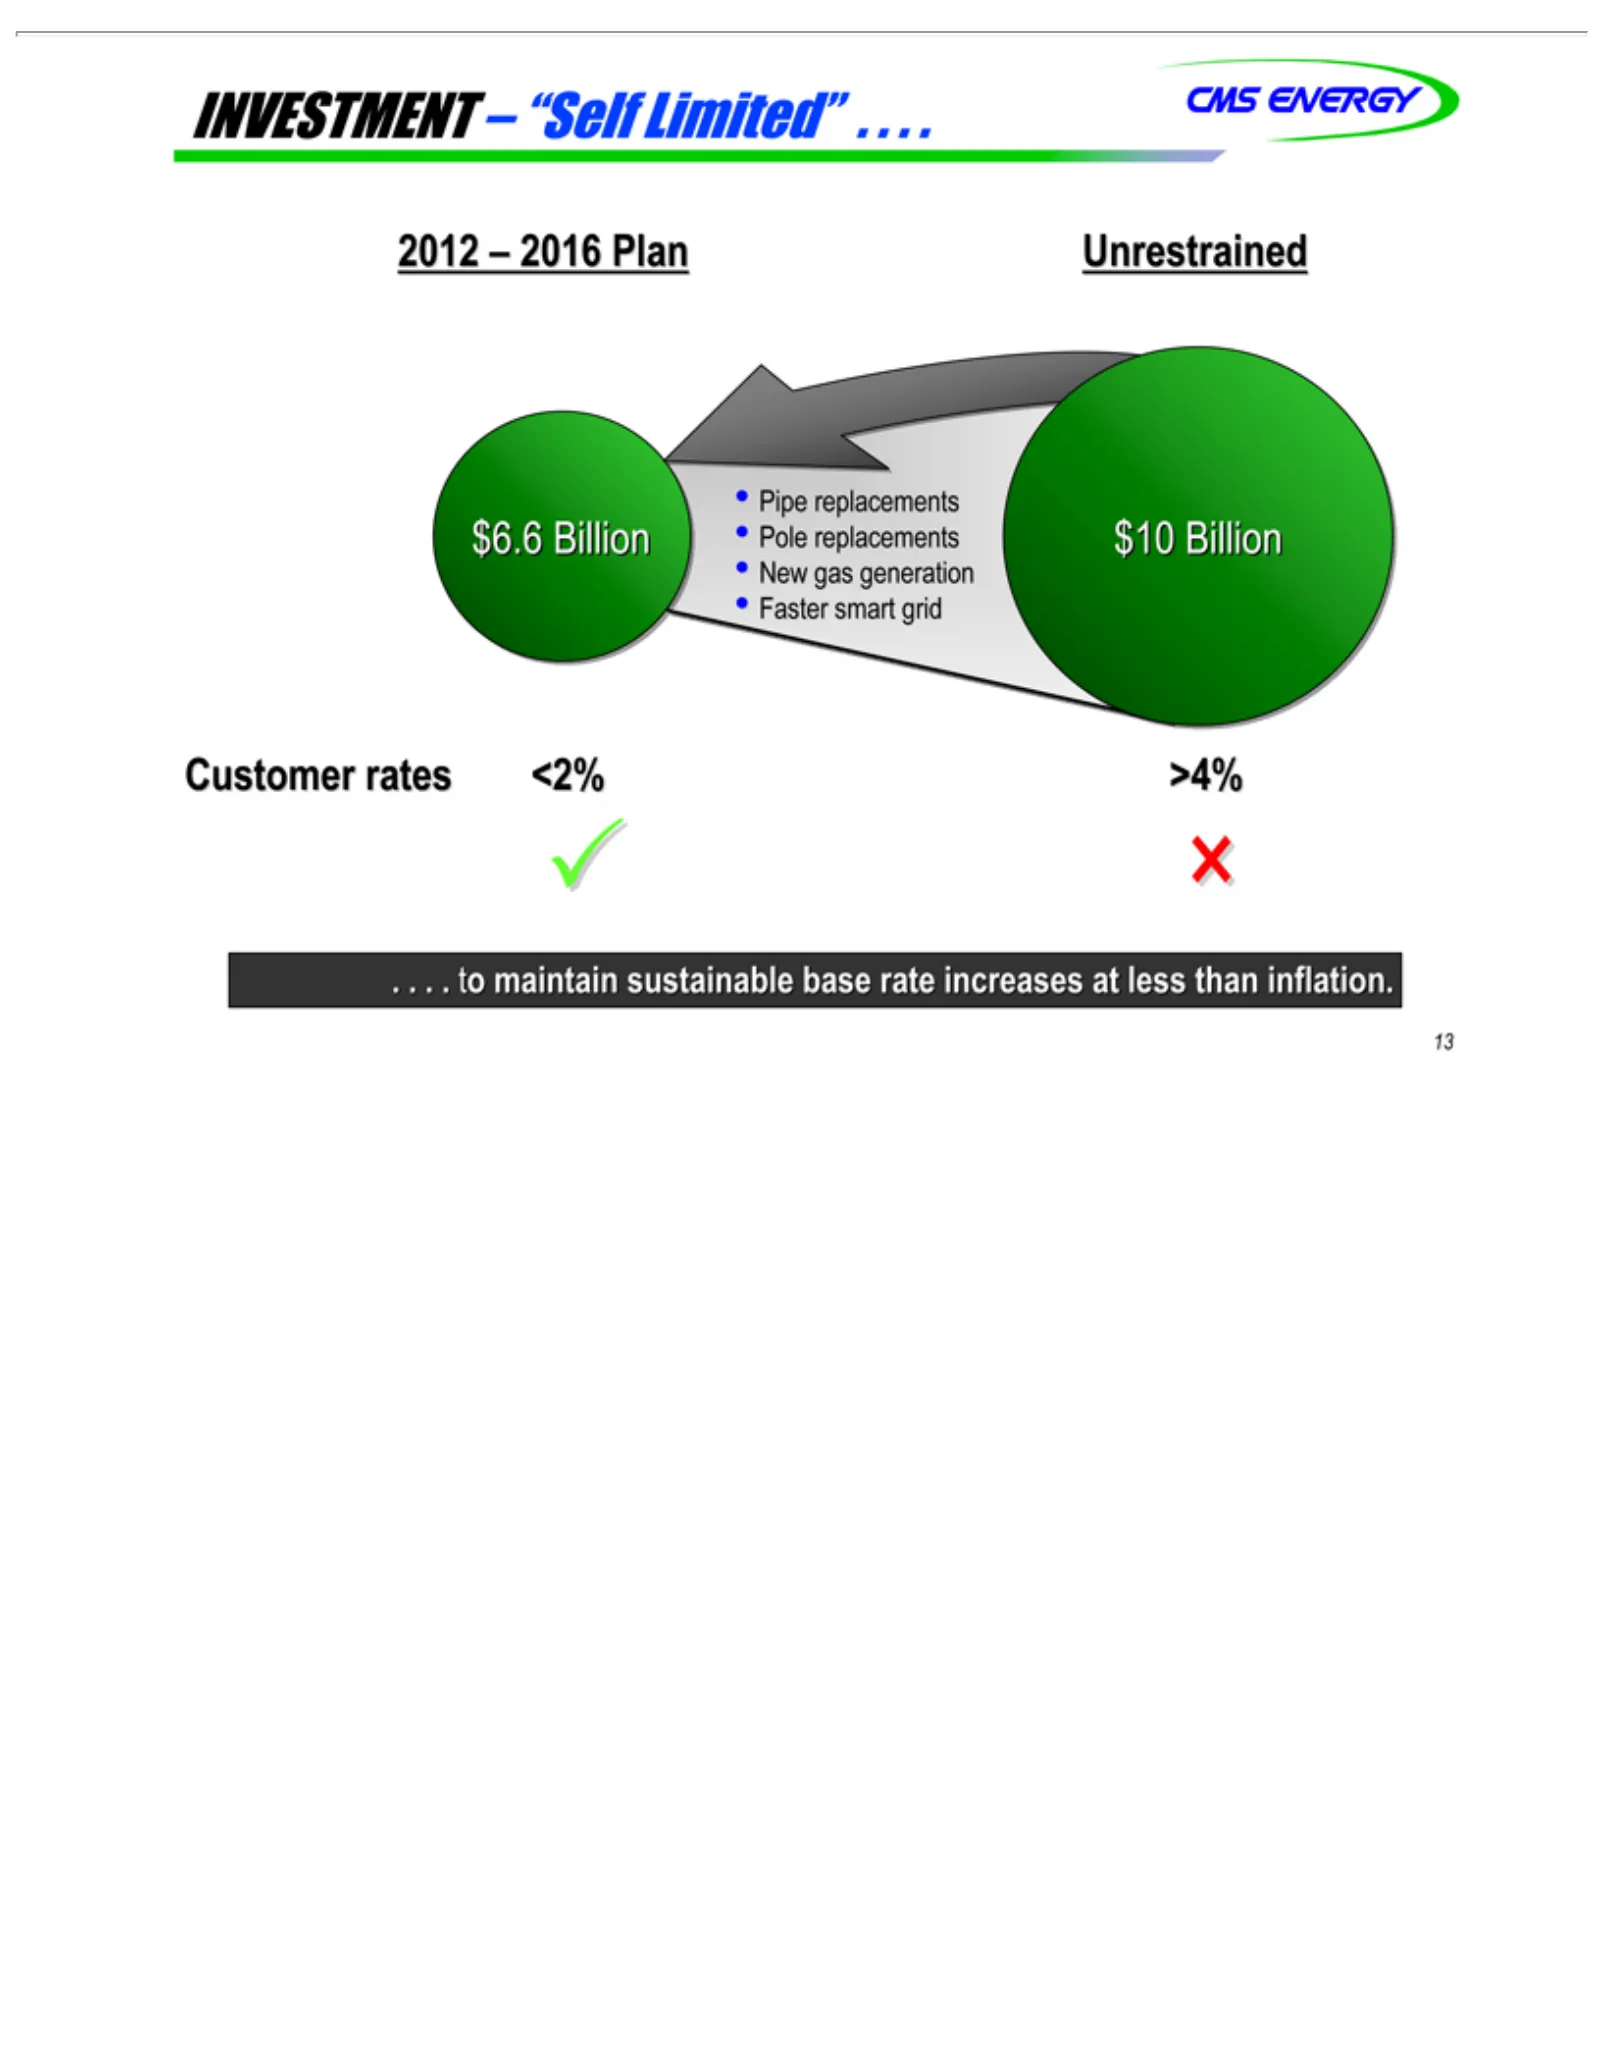
INVESTMENT 2012 Pipe Pole New Faster $10 .Customer 13 . . .Billion to replacements gas –smart 2016 maintain generation rates grid Plan <2% –sustainable Unrestrained “Self $6.6 >4%Billion Limited” base rate . . . .increases at less than inflation.
Slide 15: Michigan energy law and regulation
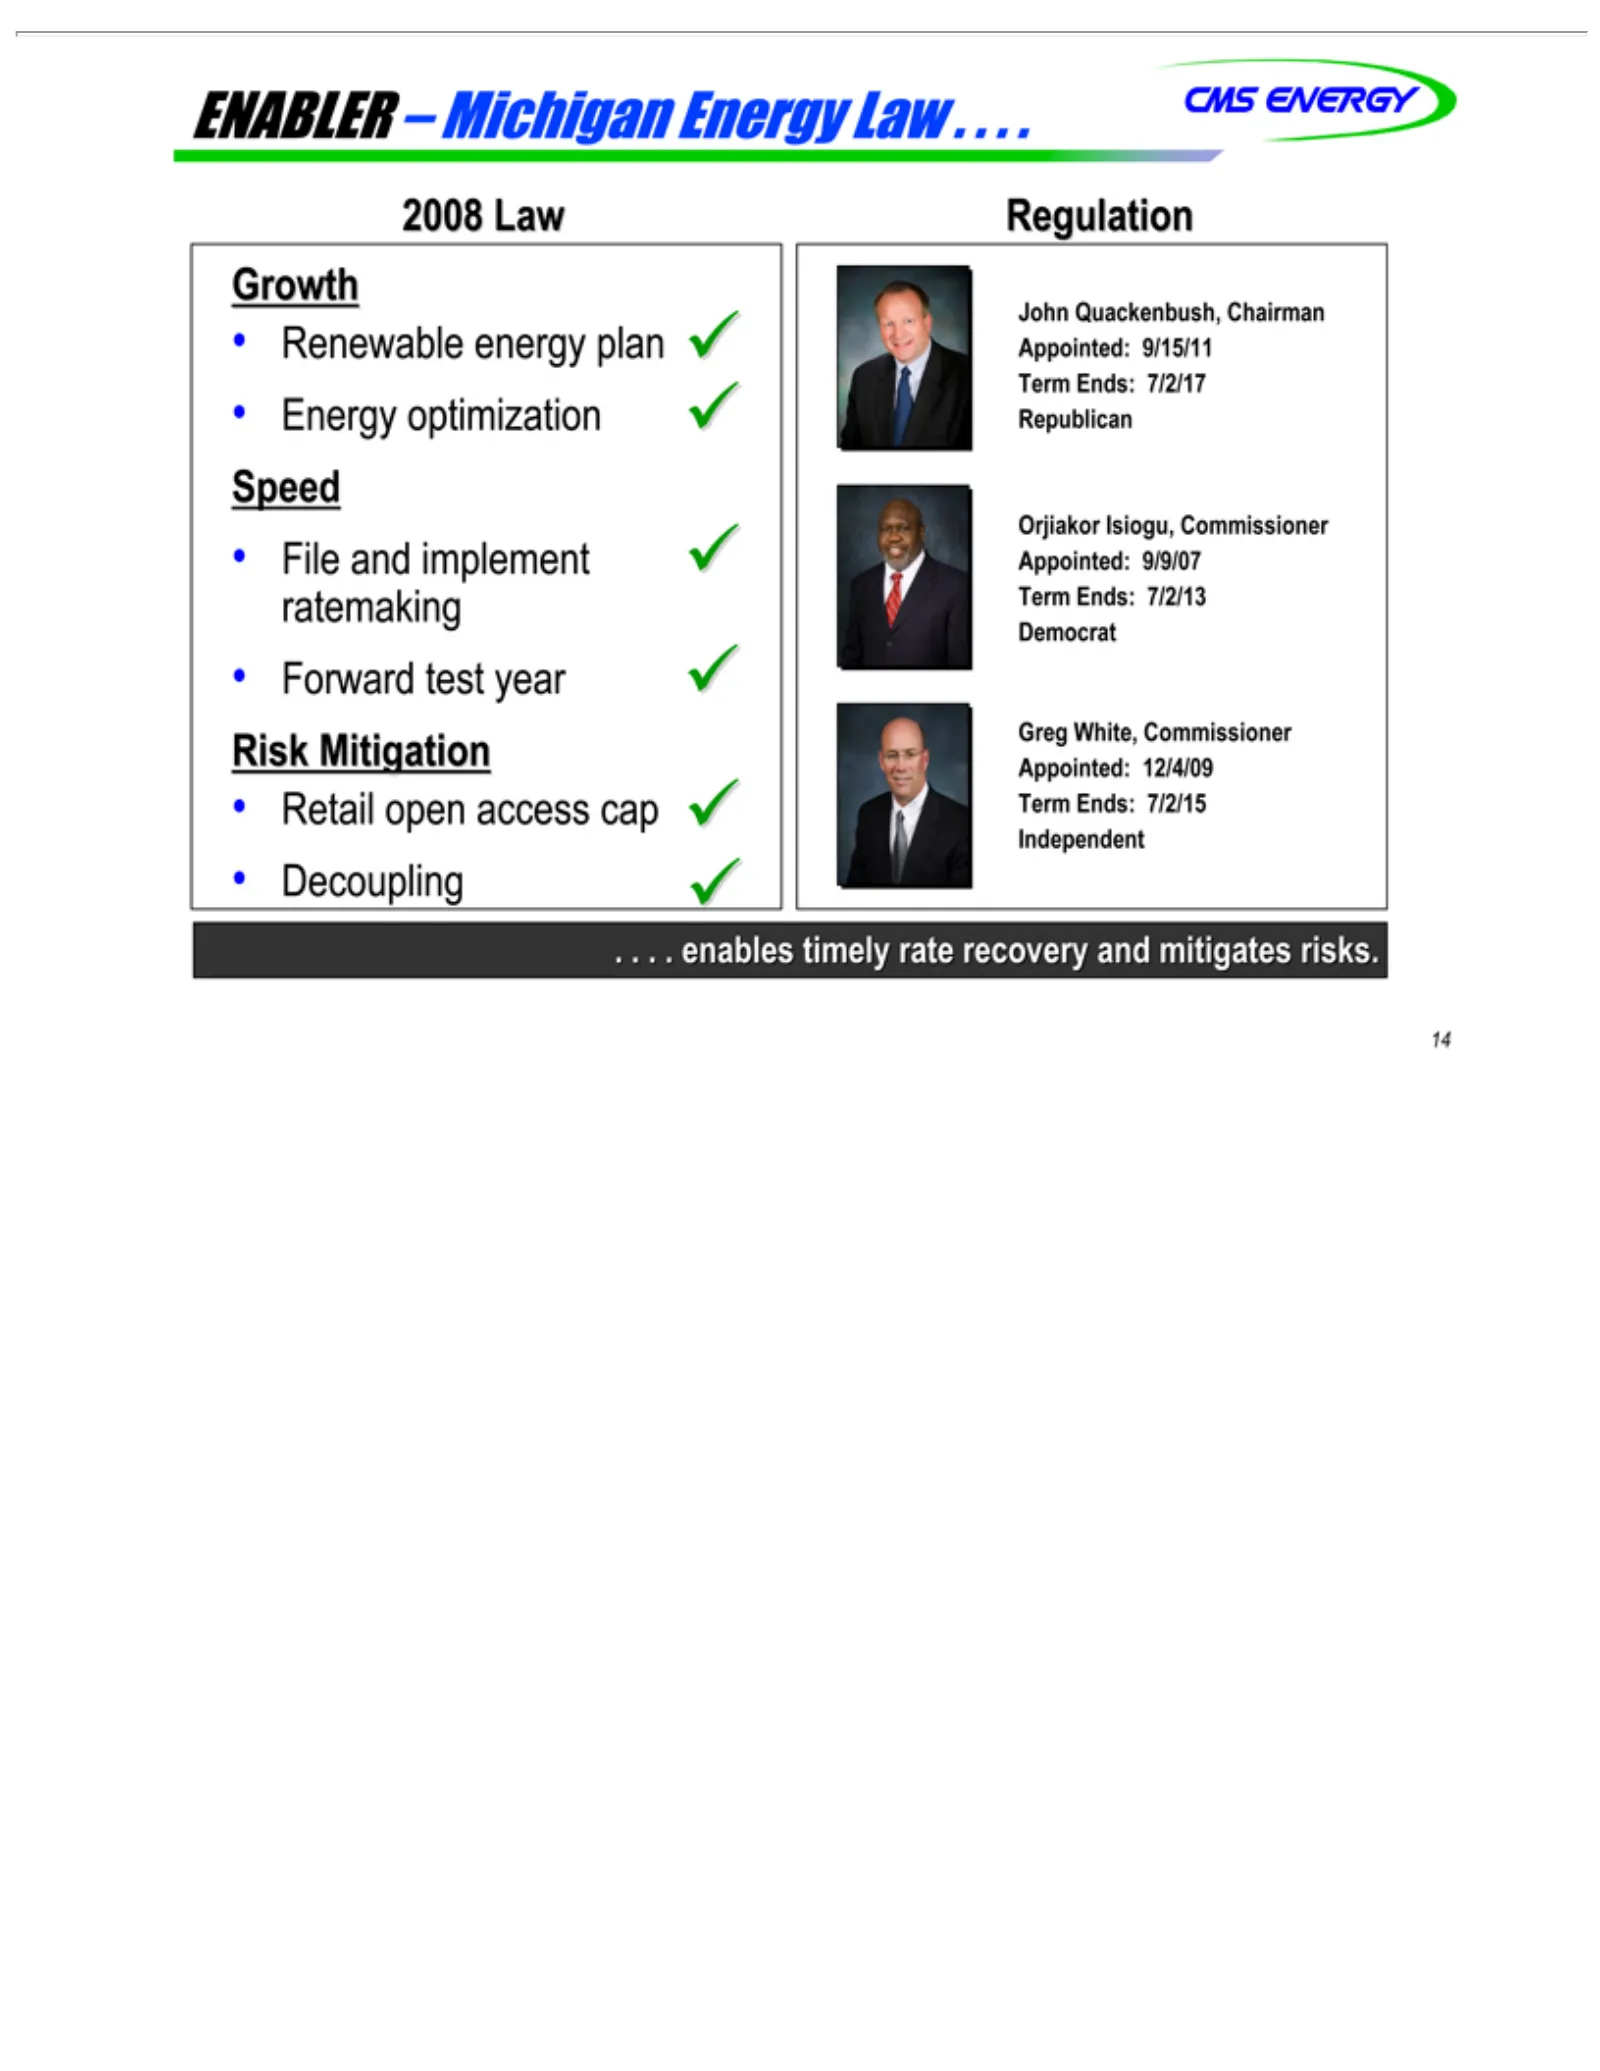
ENABLER 2008 Renewable Growth Energy File Speed Forward Risk Retail John Regulation Decoupling Orjiakor .Greg 14 . . . and enables Mitigation Quackenbush, White, Law open optimization implement Isiogu, testenergy access –Commissioner timely year Michigan Commissioner cap plan ratemaking rate Chairma
Slide 16: Regulatory timeline and rate filings
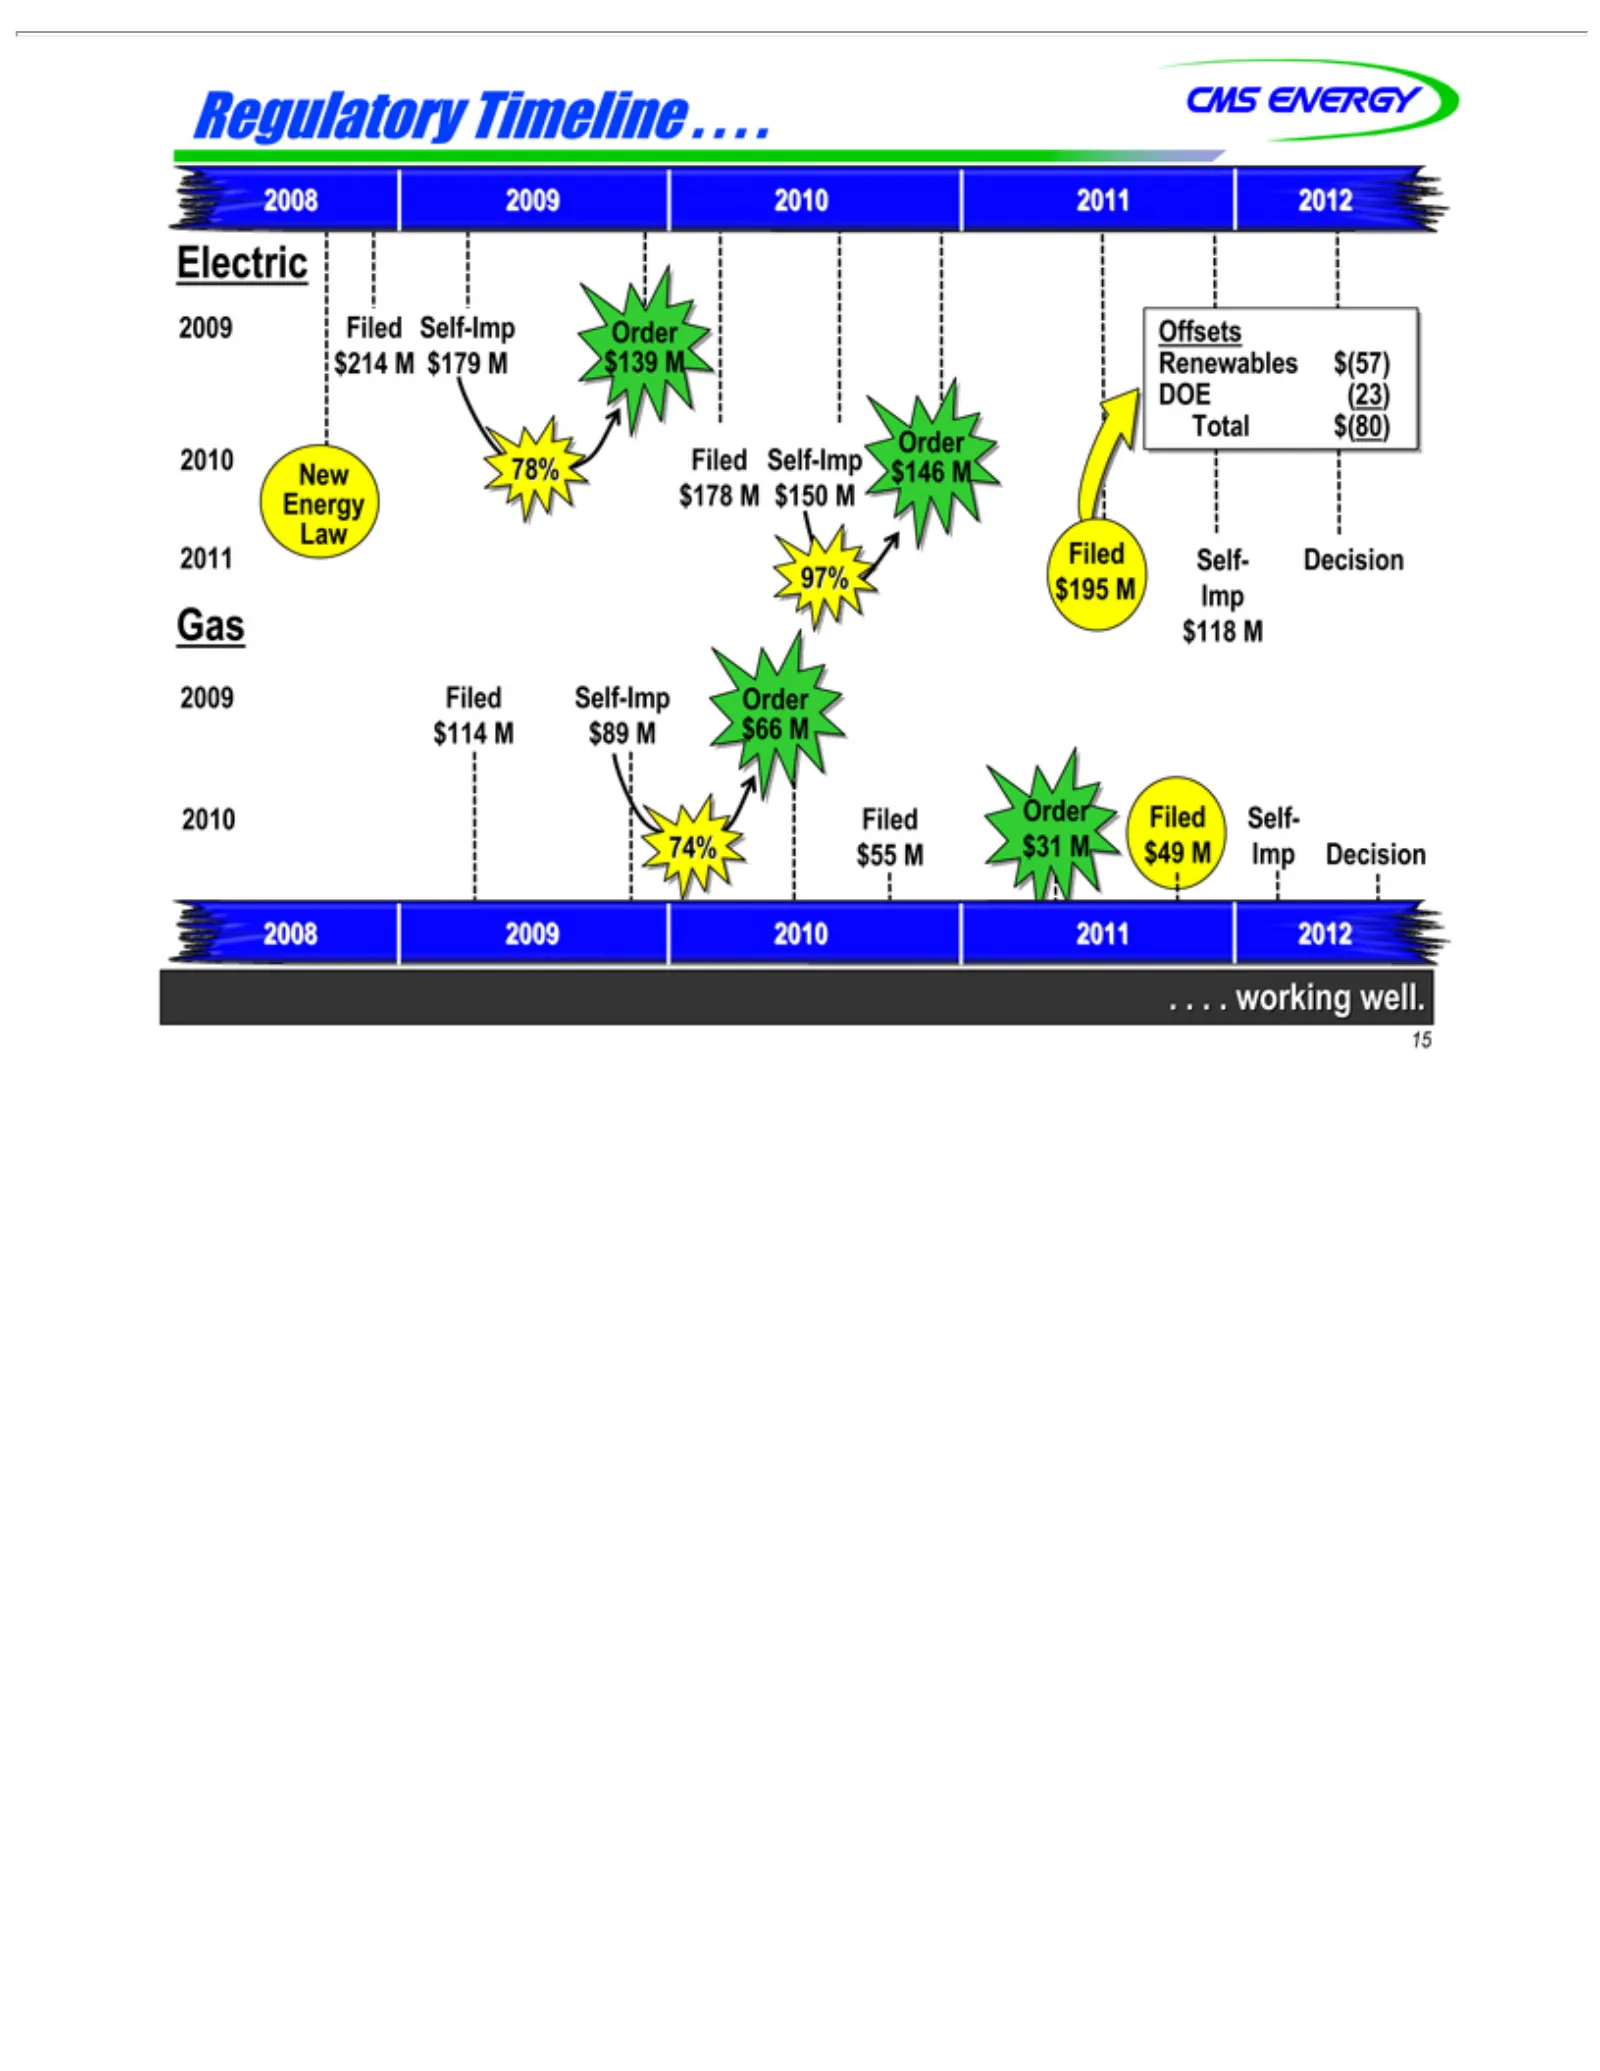
working Regulatory Electric $214 Order DOE(23) Energy 2011 Law 97%% Gas 2009 $114 2010 74% 2008$118 $55 Filed MNew 2009 Total $195 $178 $89 $179 well. M M78% 2010 Self- Self-Imp Order Timeline $(80) $31 MMM$66 Imp Filed $150 Decision M2011 $139 Filed $49 MOrder M Self-Imp 2012 MSelf- MRenewables Imp
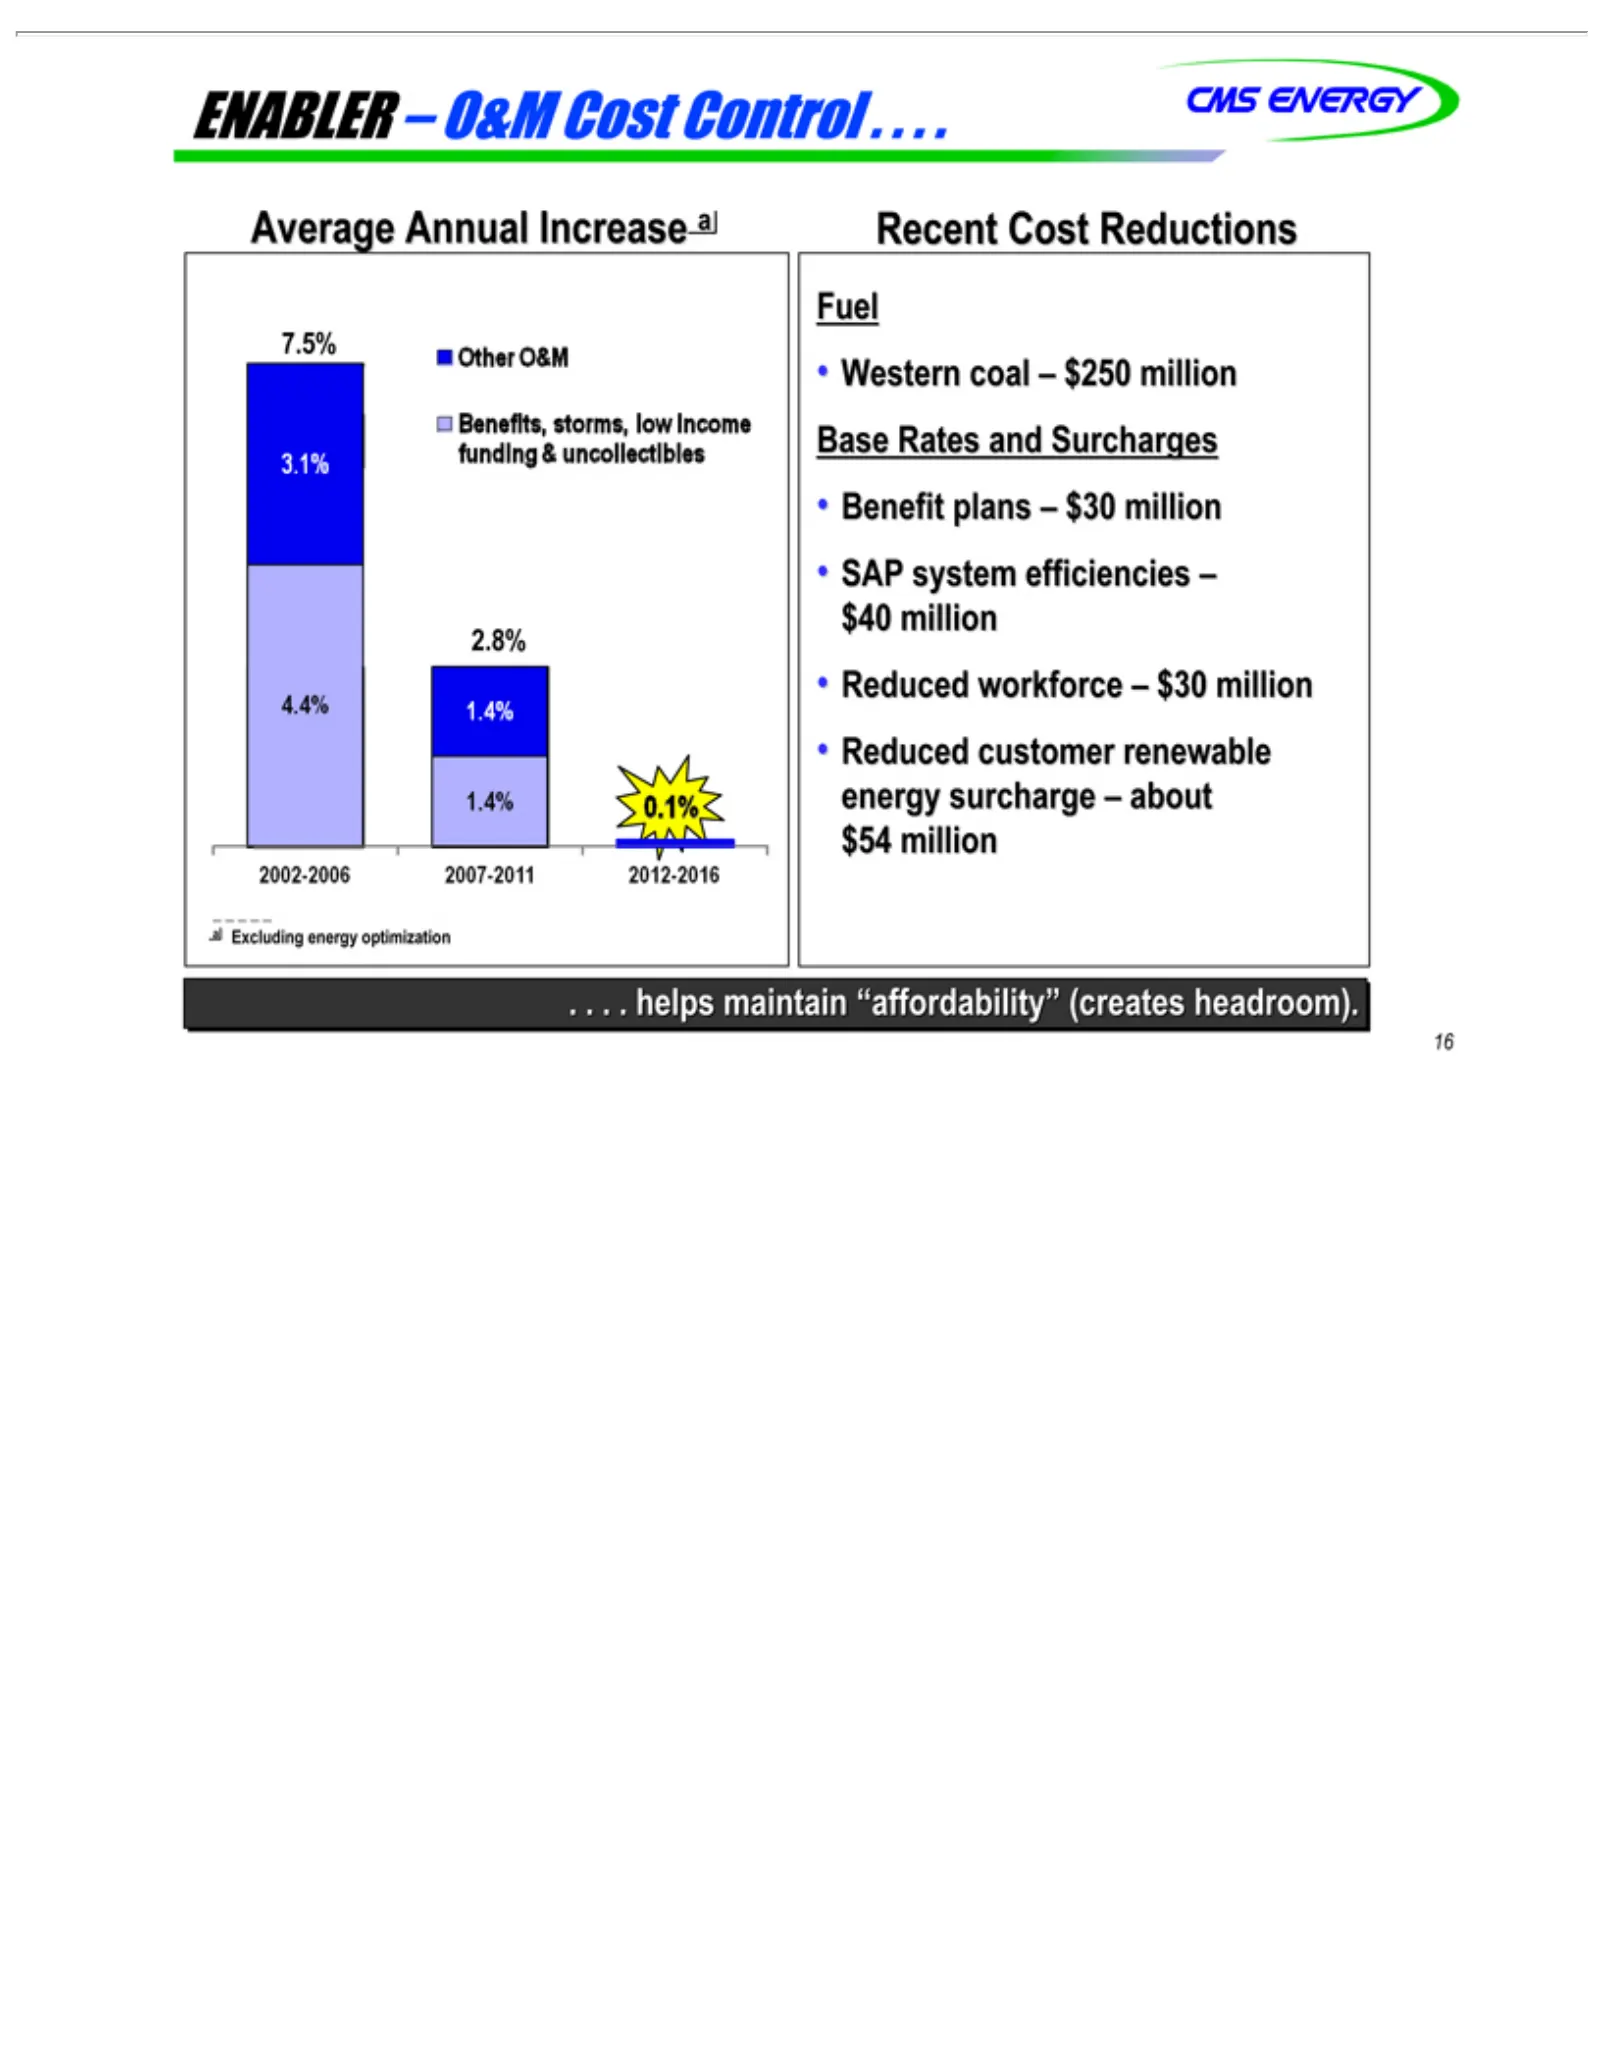
Slide 17: Cost reductions and benefits
ENABLER Average 7.5% Benefits, 3.1% 4.4% 2.8% a1.4% Recent Western Fuel Benefit SAP .Reduced 16 .Excluding . . helps system Other funding 1.4% 0.1% 2002-2006 Cost plans coal Annual workforce customer storms, maintain O&M –energy efficiencies Reductions ––O&M &$250 $30 Increase uncollectibles low _re
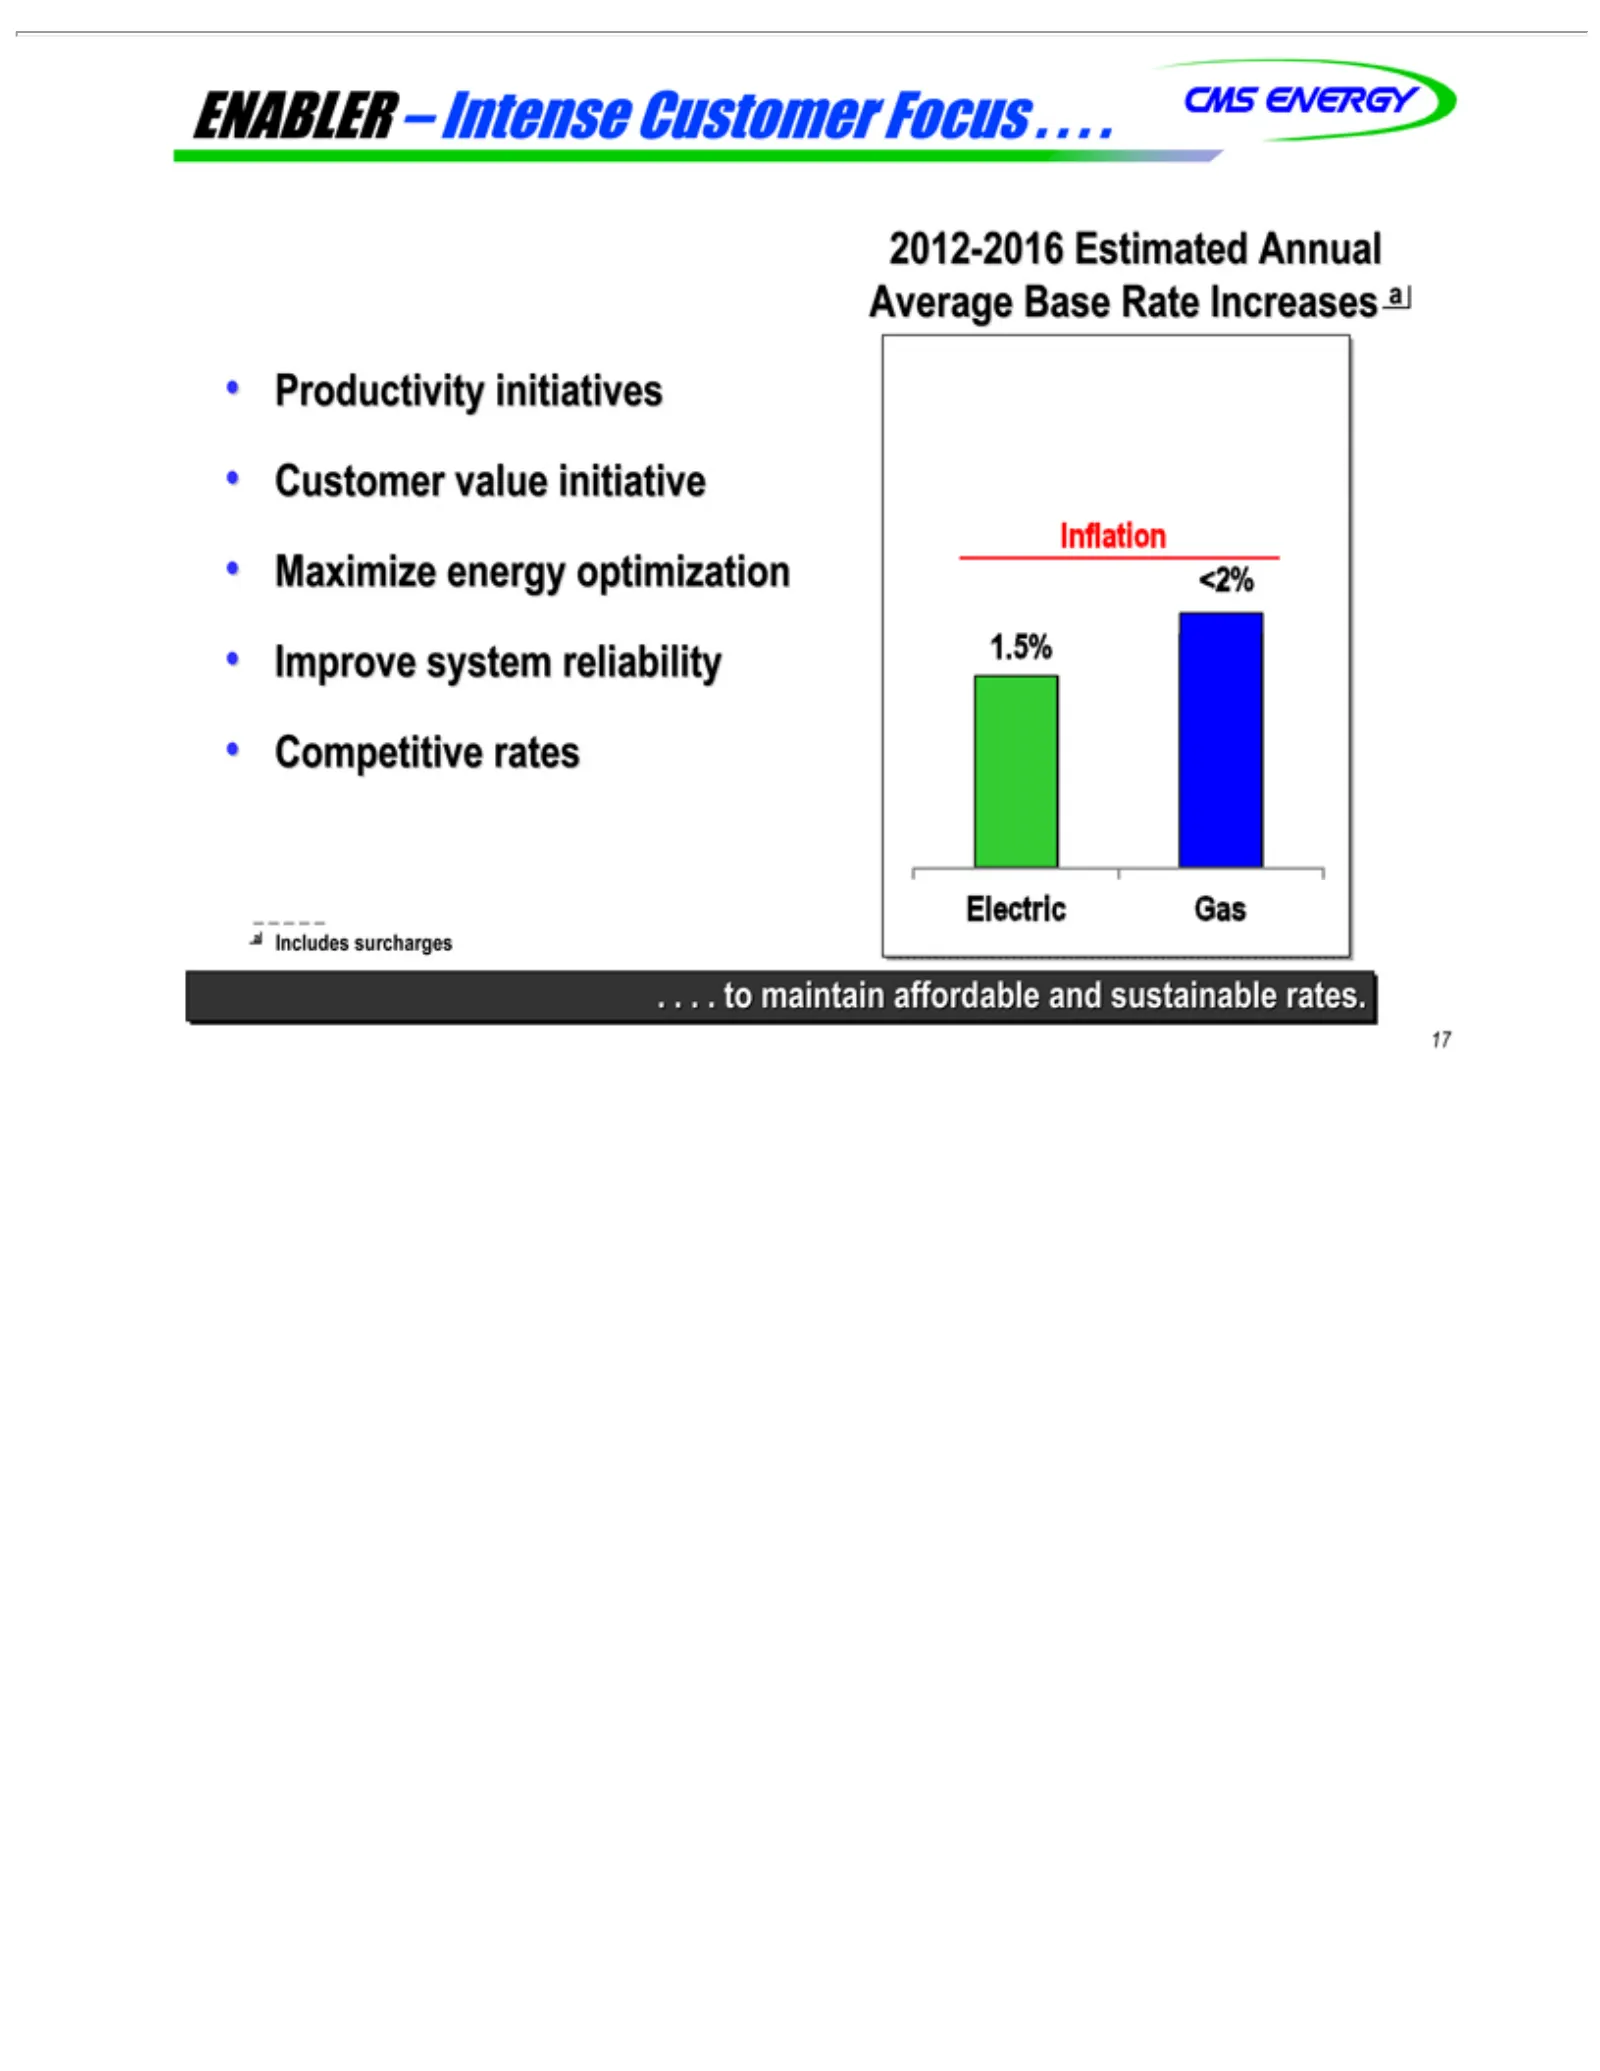
Slide 18: Productivity and affordable rates
ENABLER Productivity 2012-2016 aAverage Electric 1.5% <2% .Inflation 17 .Includes . . to maintain Gas Base surcharges Estimated –initiatives Intense Rate affordable Increases Customer Annual Customer and a sustainable Focus value. initiative . . . rates. Maximize energy optimization Improve system r
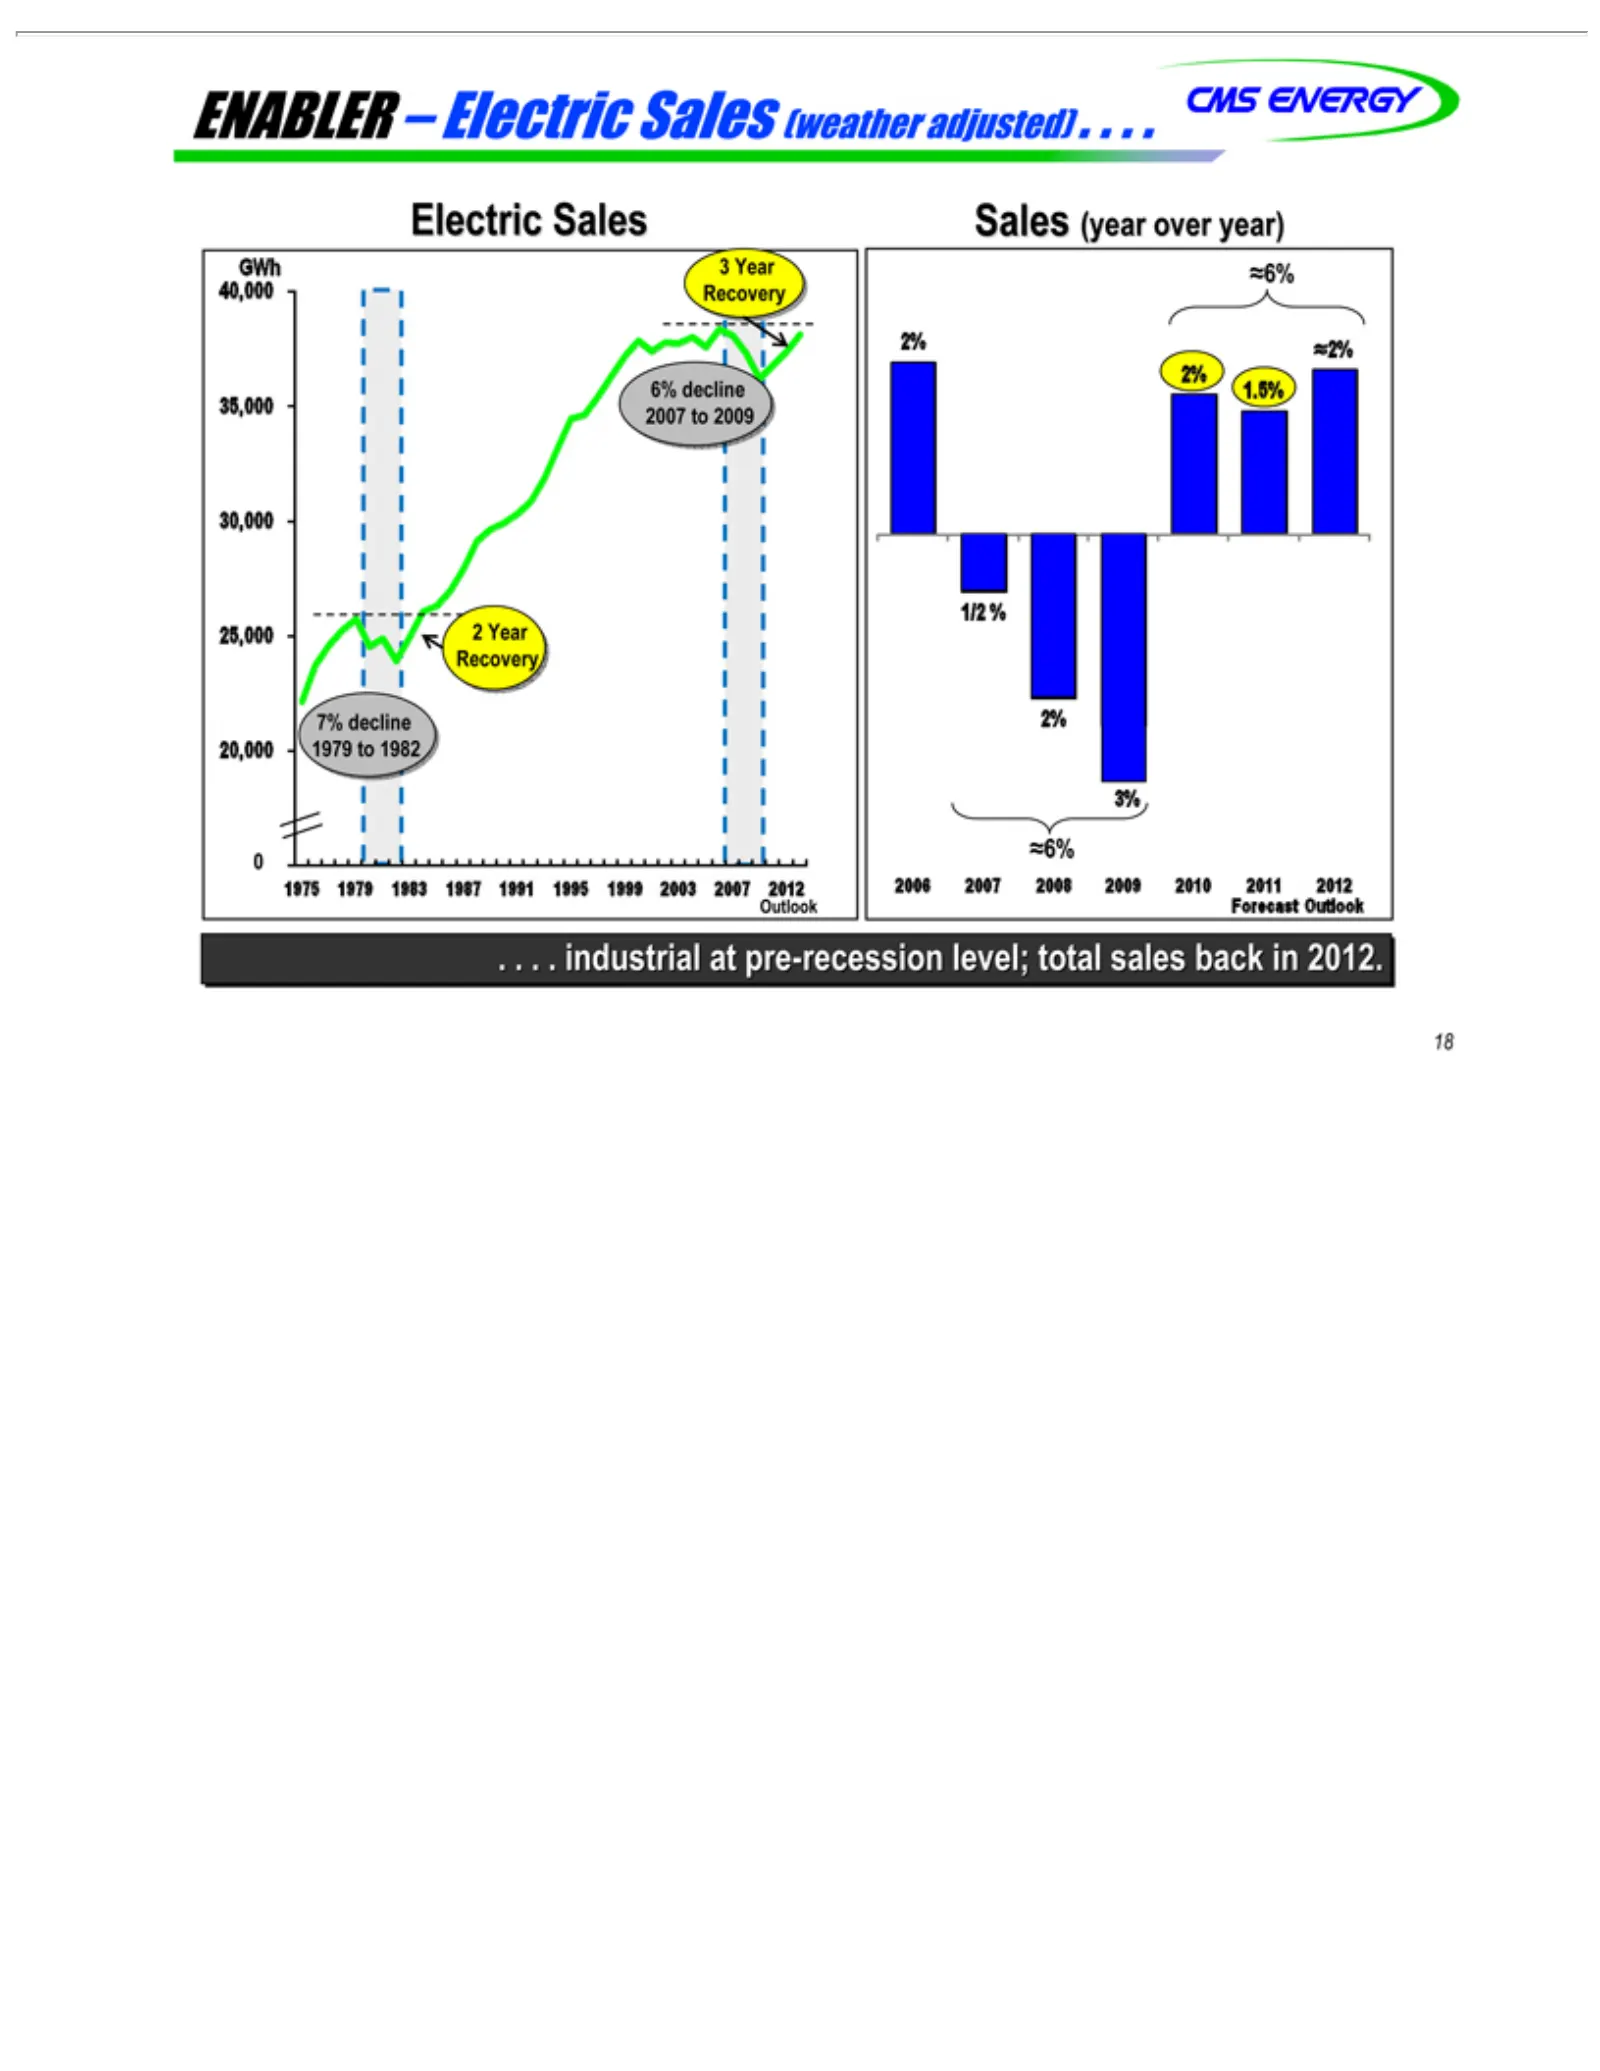
Slide 19: Electric sales outlook
ENABLER Electric GWh 40,000 35,000 25,000 30,000 7% Recovery 20,000 1975 15,0000 Outlook 1/2 1.5% 2006 6% 3% 2% .Forecast 18 . . .% decline 2% industrial 1979 2007 3 1979 Recovery 22007 Year Sales Outlook Year 1983 2008 –toElectric Sales at1982 2009 1987 2009 pre-recession (year Sales 1991 2010over
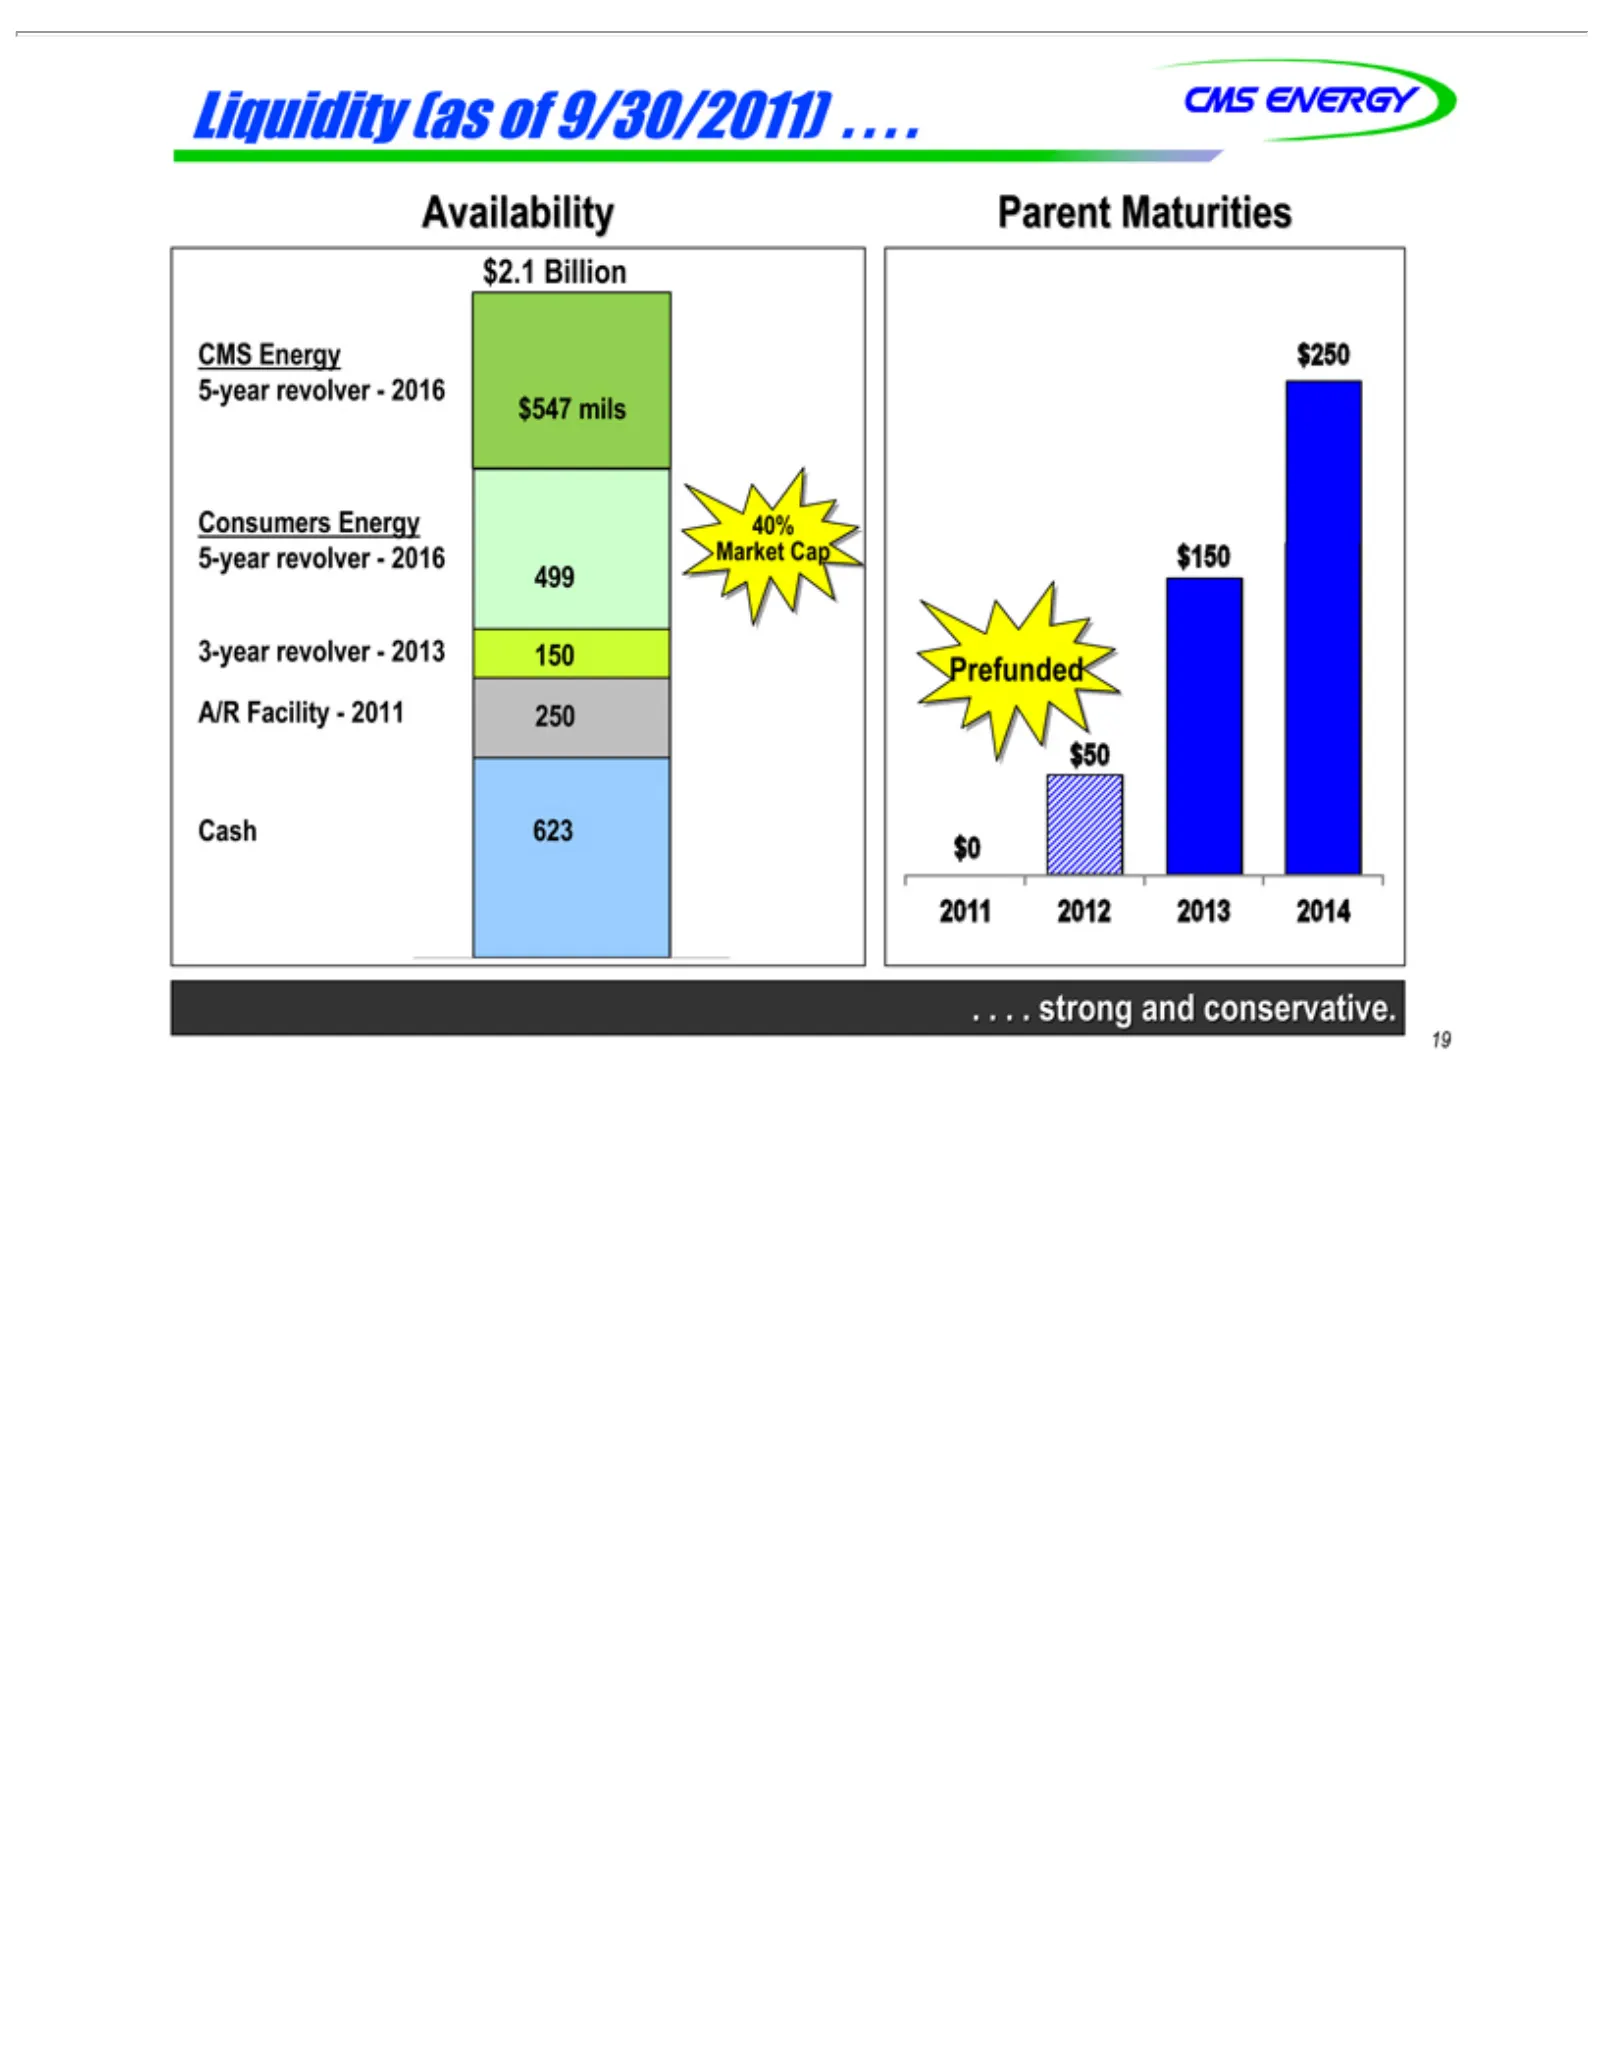
Slide 20: Liquidity
Liquidity CMS Availability Consumers 5-year 3-year 499 A/R Cash Parent 2011 $0 $50 Prefunded $150 .$250 19 . . . Facility—2011 strong 2012 623 Energy revolver—2016 revolver—2013 Maturities (as 2013 and Energy of conservative. 9/30/2011) 2014 40% 250150 $547. .mils Market . Cap .
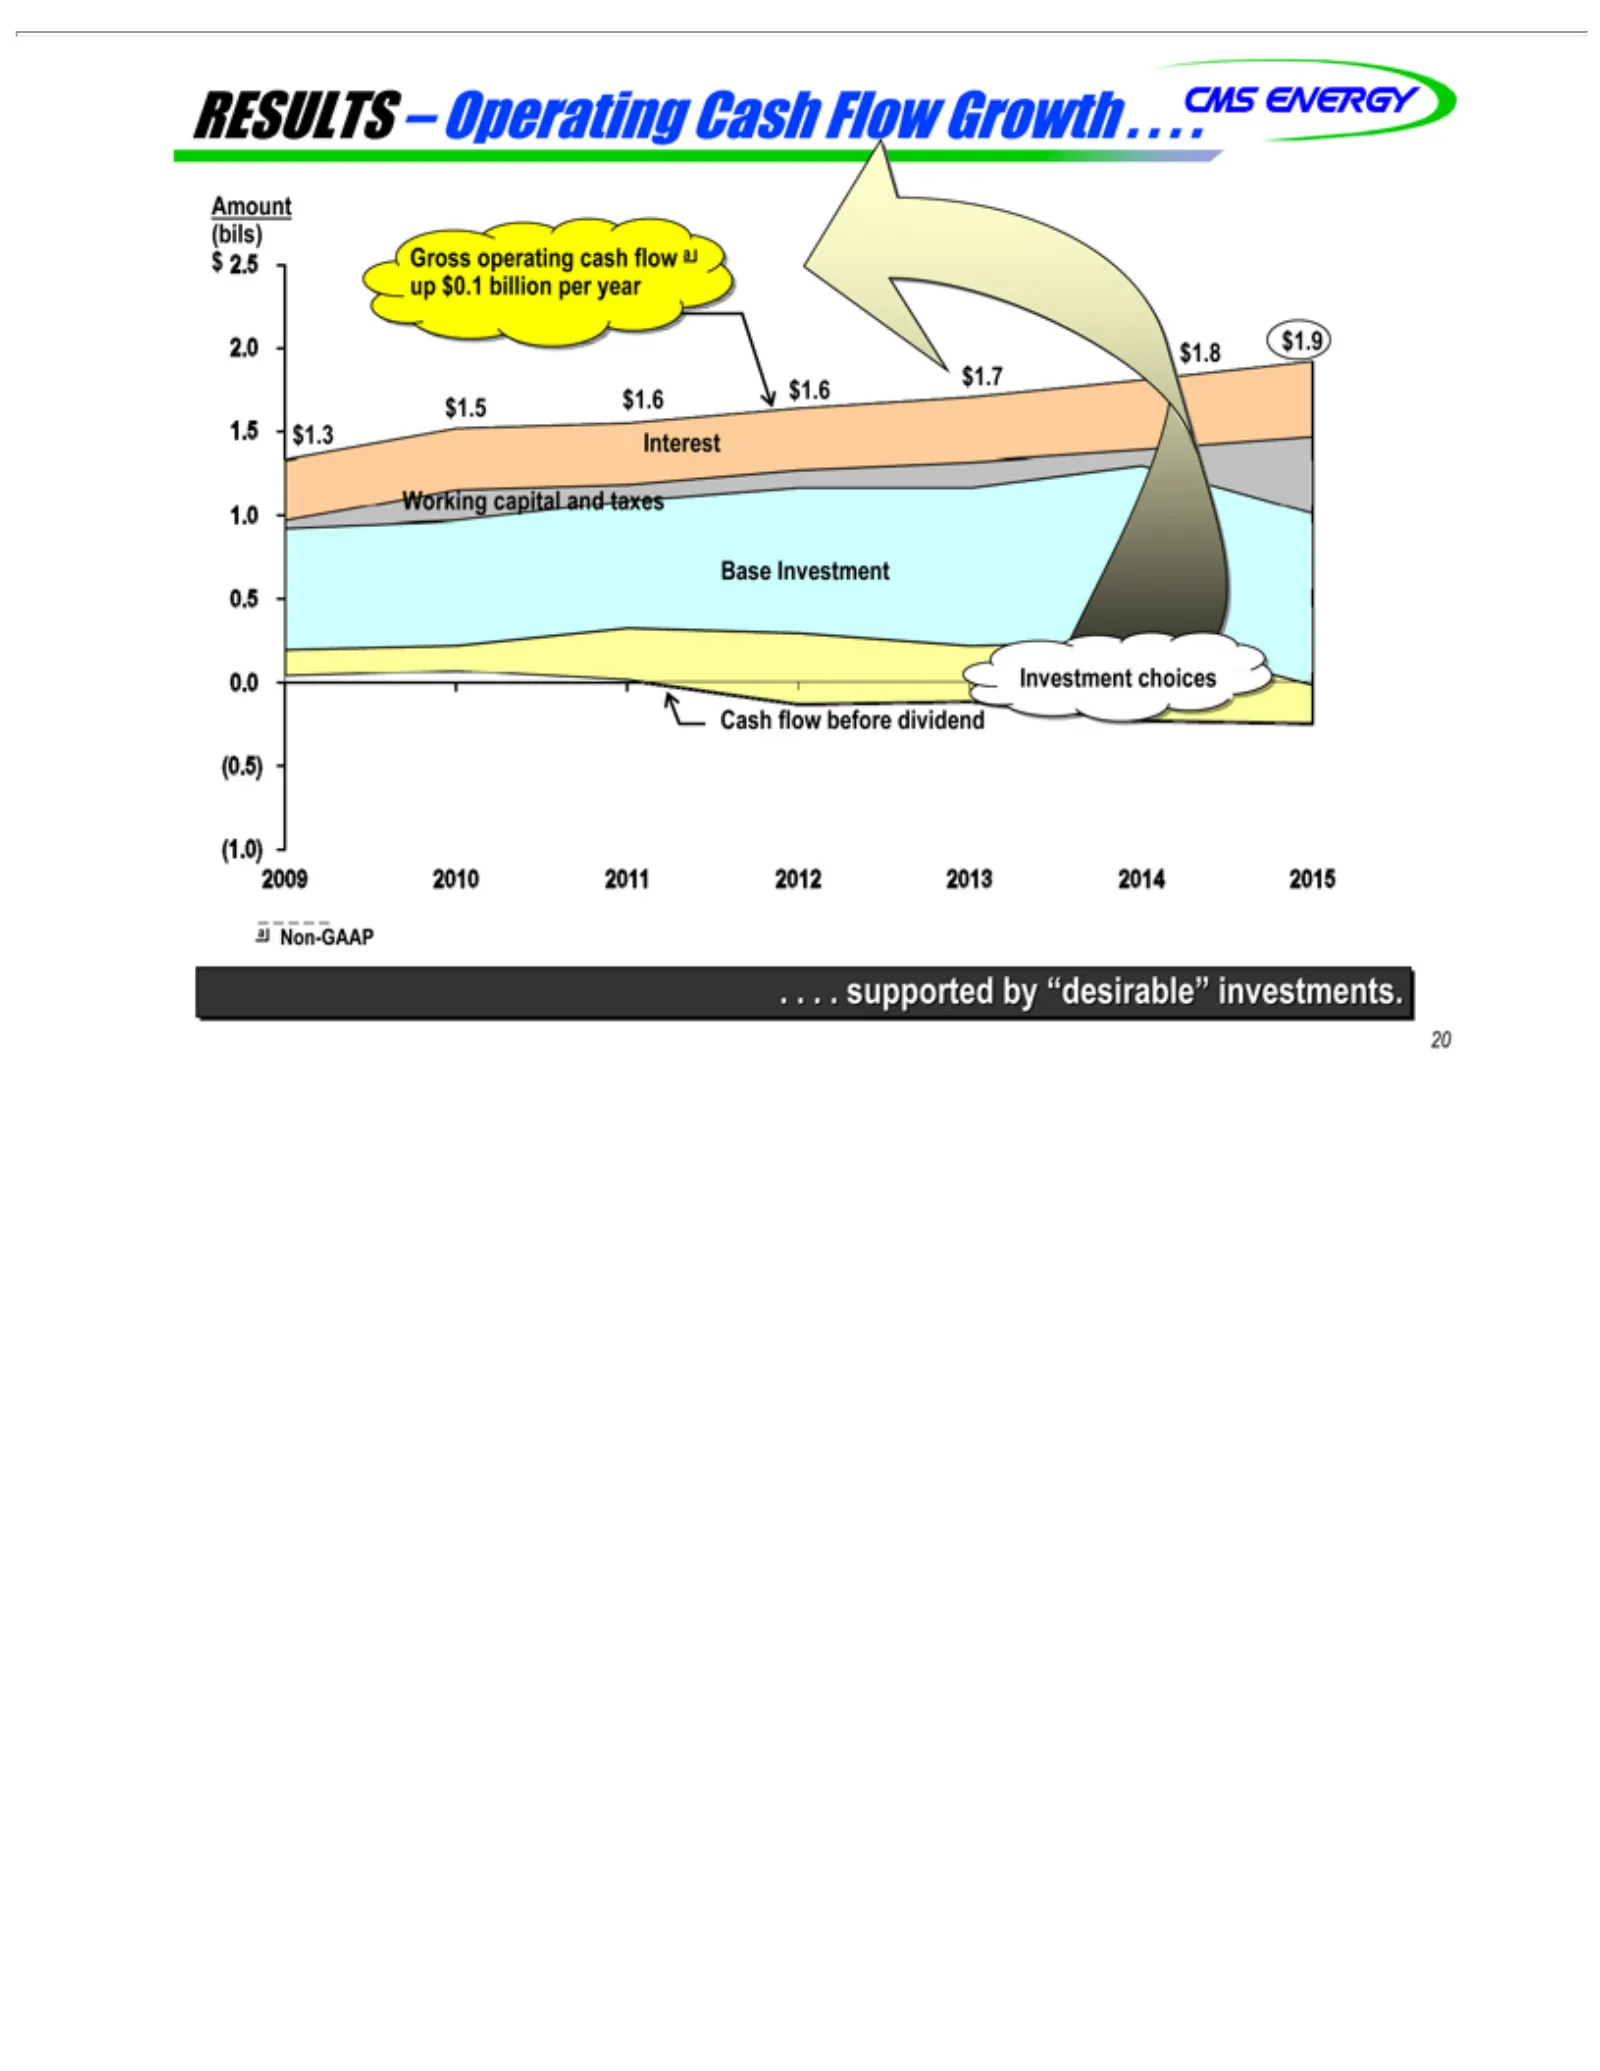
Slide 21: Operating cash flow and investment
RESULTS $ (bils) Amount up 2.0 $1.7 $1.5 1.5 1.0 2.5 $0.1Gross $1.8 billion $1.6 $1.3–operating $1.9 Operating percapital $1.6 year Interest Working cash Cash flow Flow a Growth . . . . Base 0.0 0.5 Cash _ (1.0) .a(0.5) 20 Investment .Non-GAAP 2009 Investment . . supported flow before 2010 2011and c
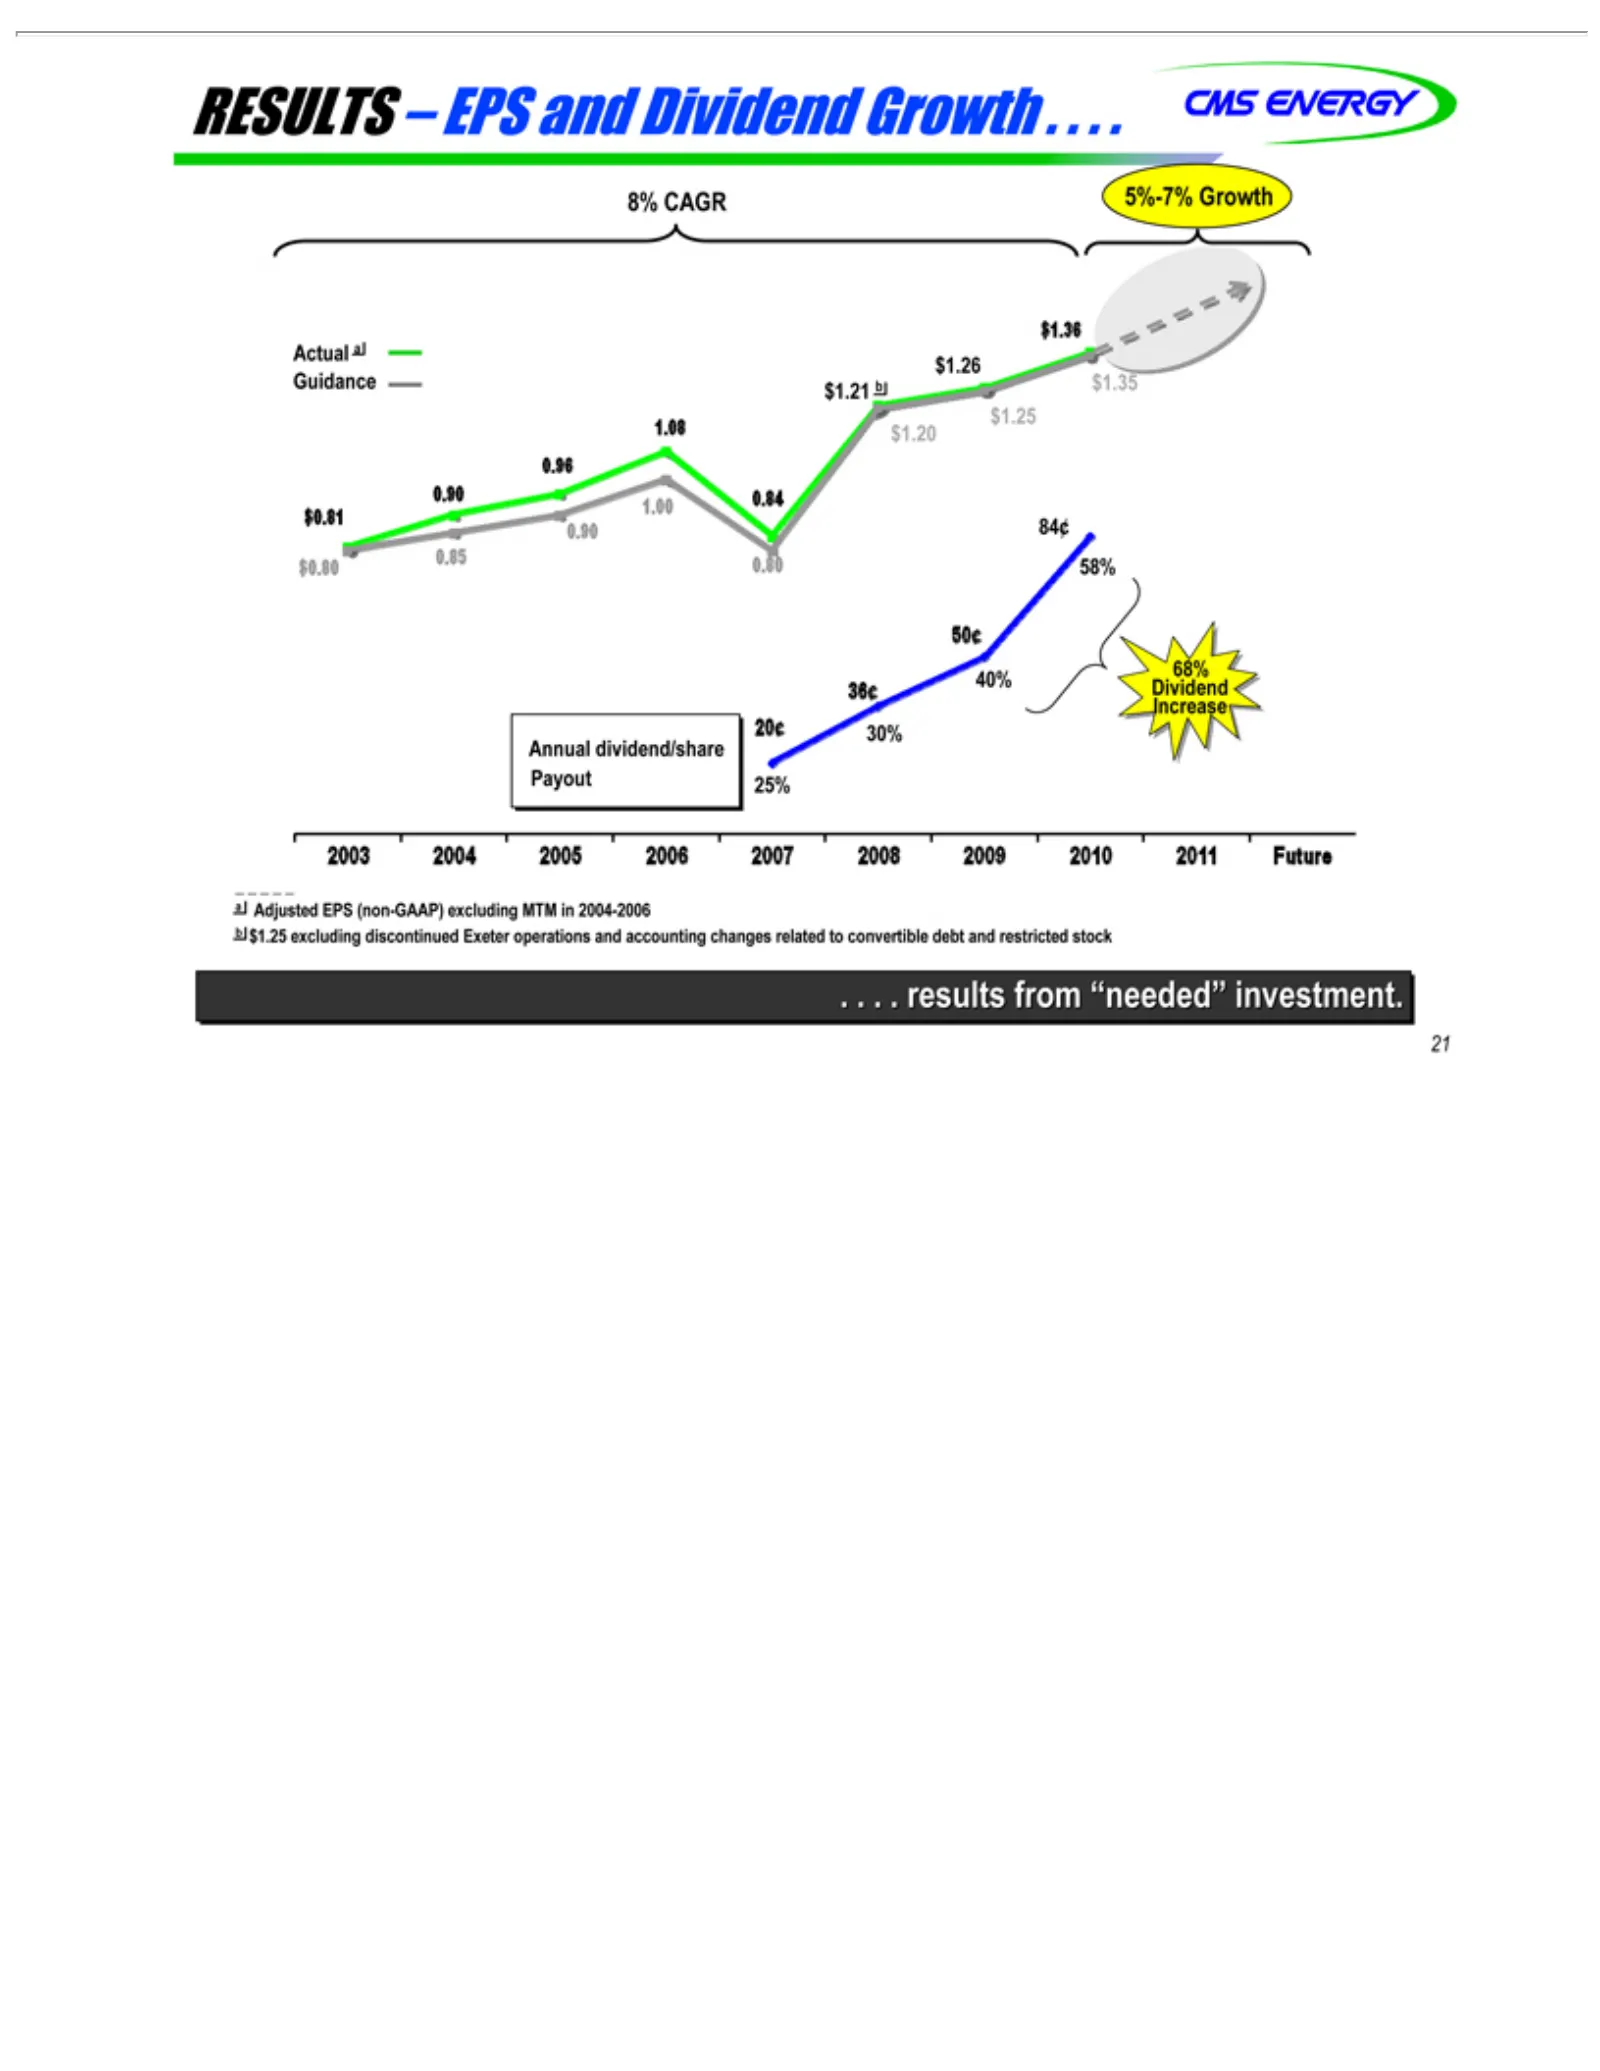
Slide 22: EPS and dividend growth
RESULTS 8% Actual $1.36 Guidance 1.08 $1.25 0.90 0.96 $0.81 $0.80 50¢ CAGRa0.85 $1.20 $1.26 $1.21 –5%-7% 1.00 0.90 EPSb 58% 0.84 84¢ 0.80 and $1.35 Growth Dividend Growth . . . . 40% 36¢ Annual 21 68% Increase aPayout b results Dividend Adjusted $1.25 from 2003 25% dividend/share excluding EPS “need
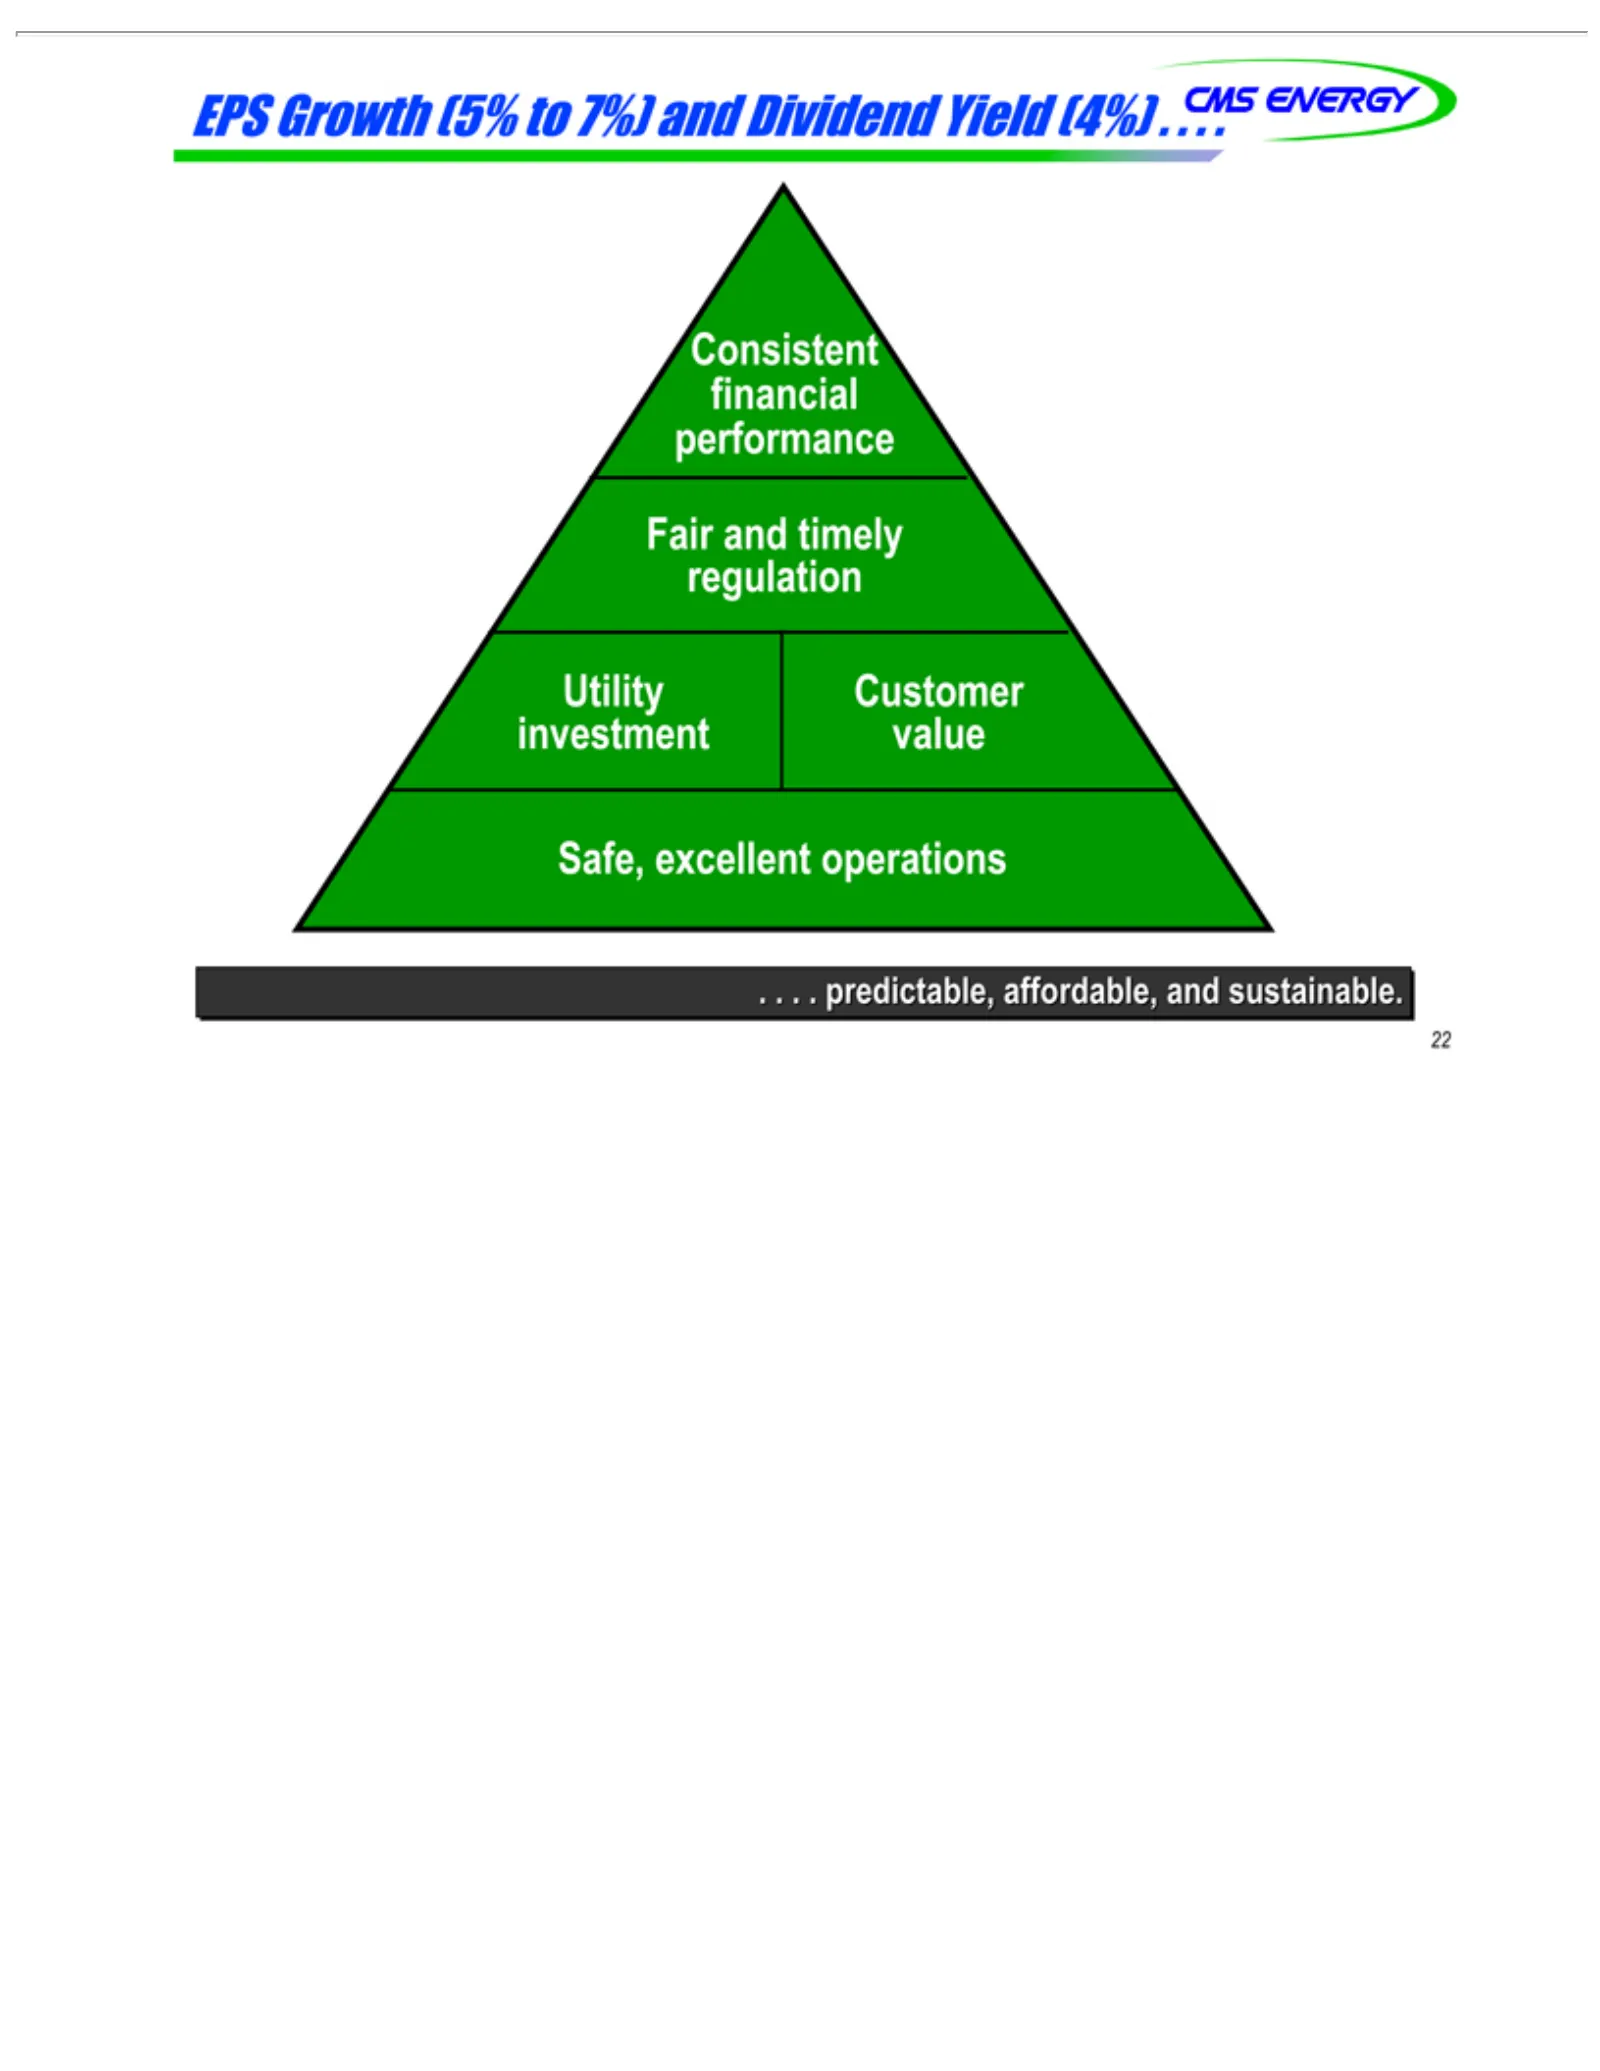
Slide 23: EPS growth and dividend yield
EPS and Fair performance financial Consistent Utility regulation investment Safe, predictable,redictable, 22 Growth excellent Customer timely value (5%operations to 7%) affordable, and Dividend and sustainable. Yield (4%) . . . .
Slide 24: Appendix
Appendix
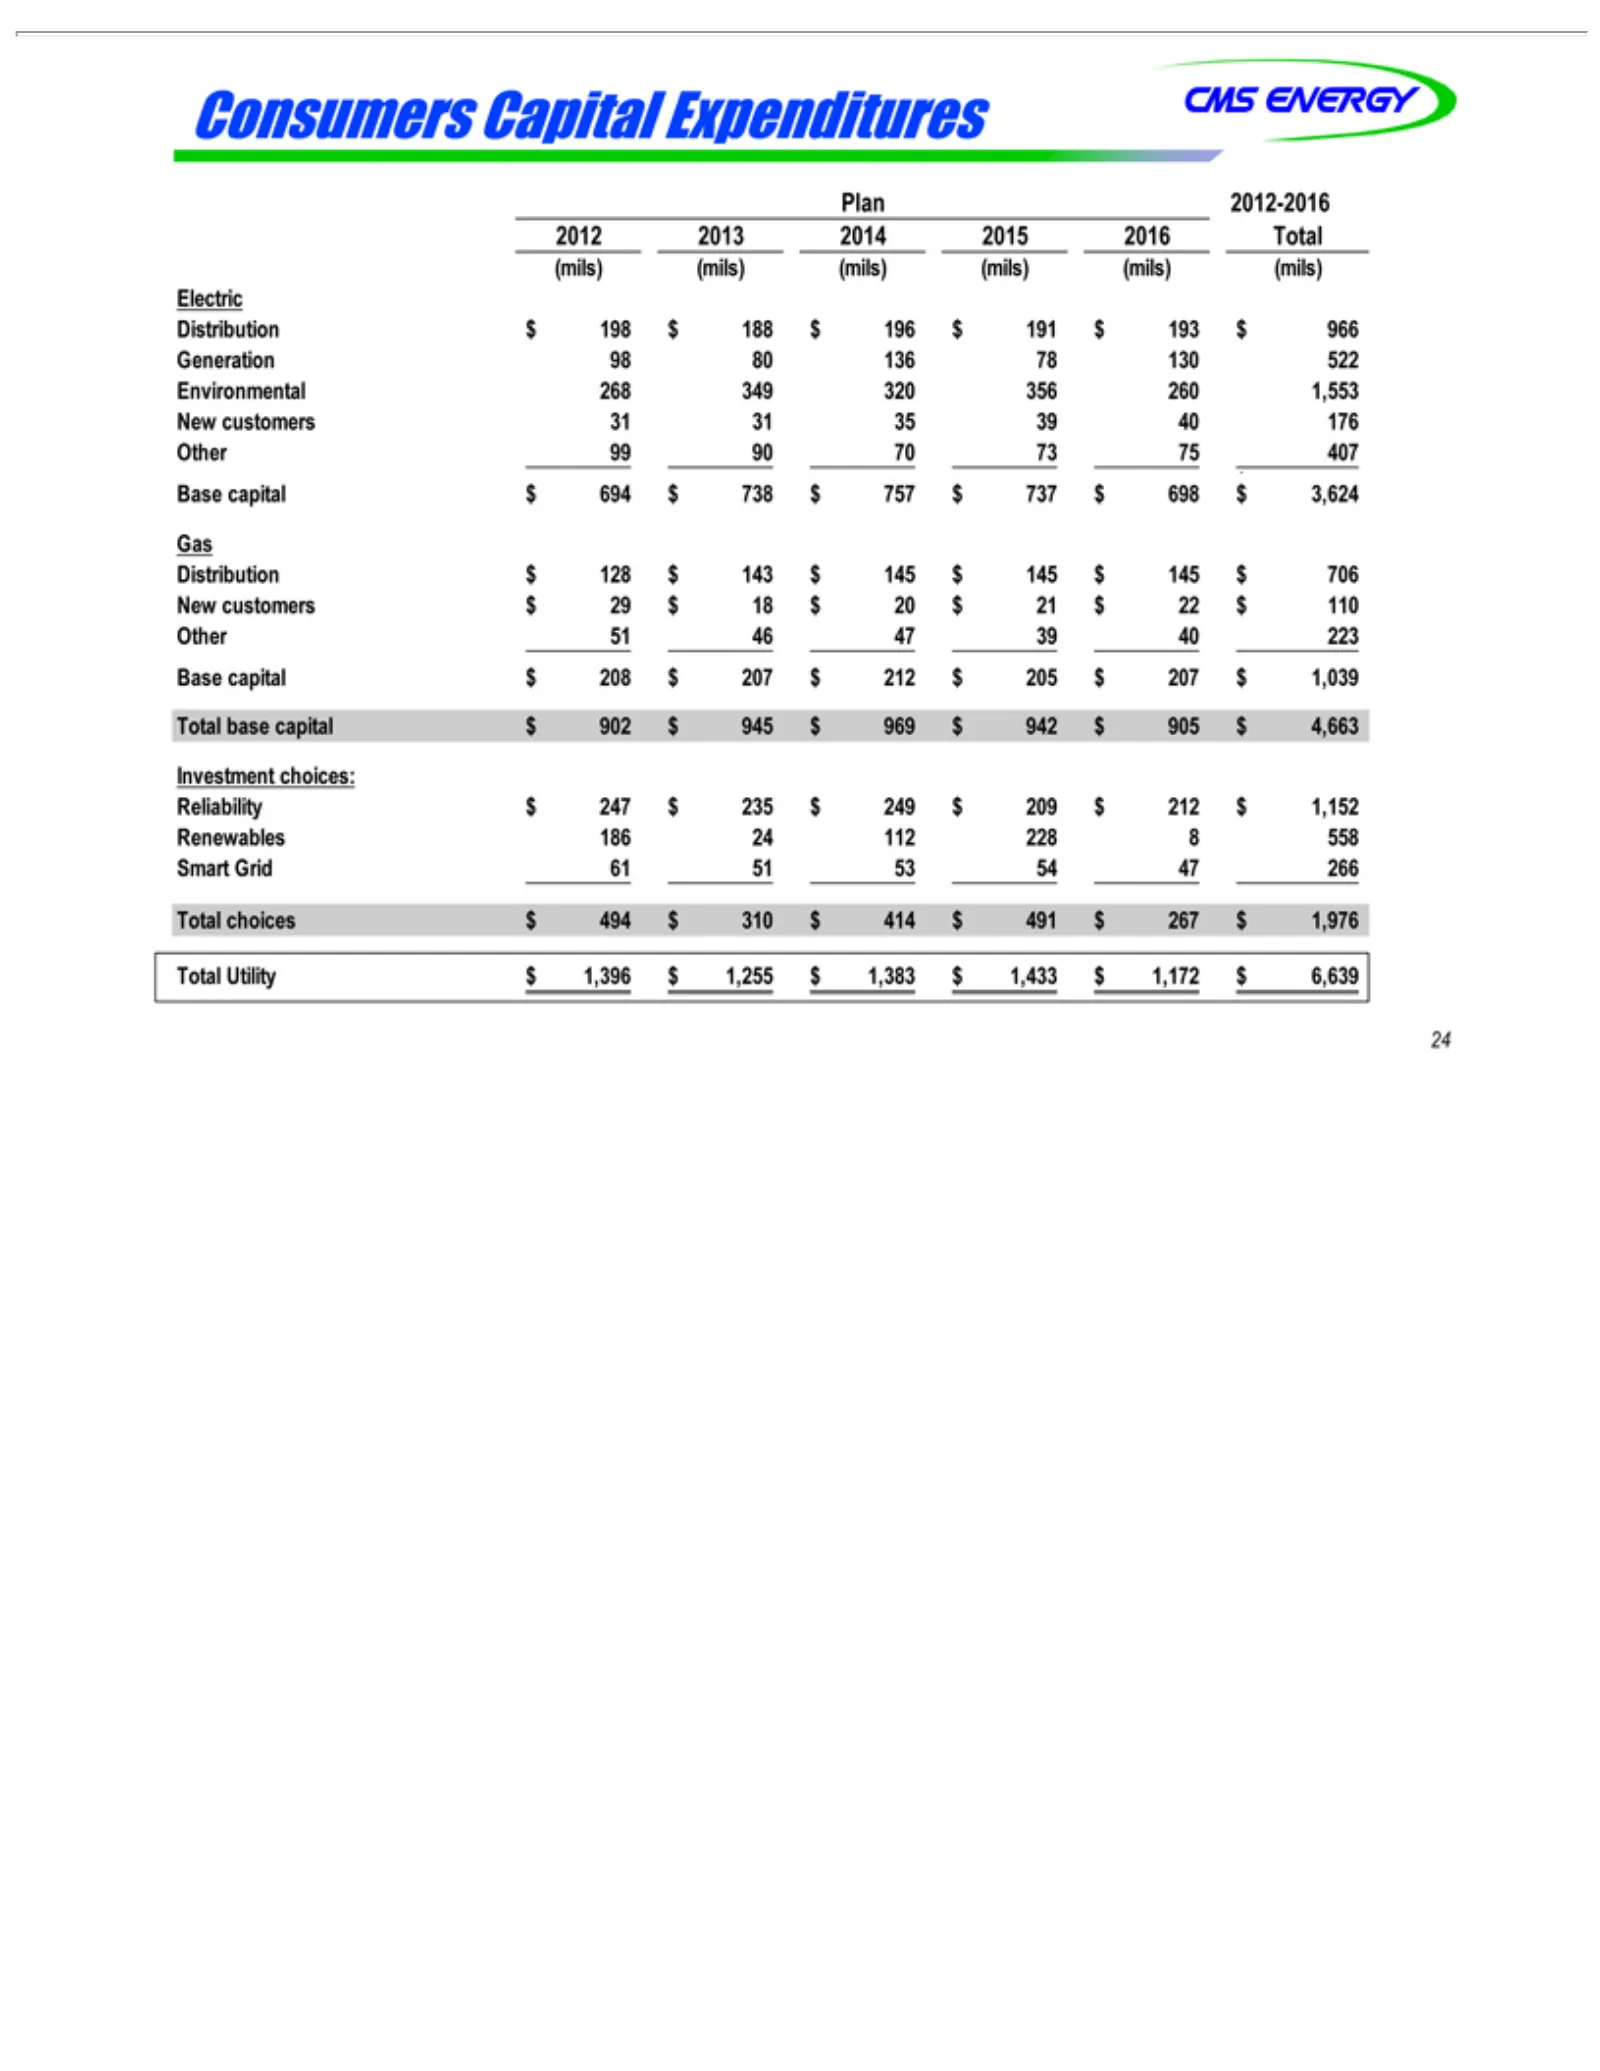
Slide 25: Consumers capital expenditures plan
Consumers Plan 2012 Electric (mils)(mils)(mils)(mils)(mils)(mils) Generation Environmental Distribution Gas New Other Base Investment Reliability Renewables Smart Total 24 2012-2016 customers capital 2013 base choices Utility 99 51 Grid 90capital 46$2014 98 choices: 61 Capital 70 47 186 $247 $128 19
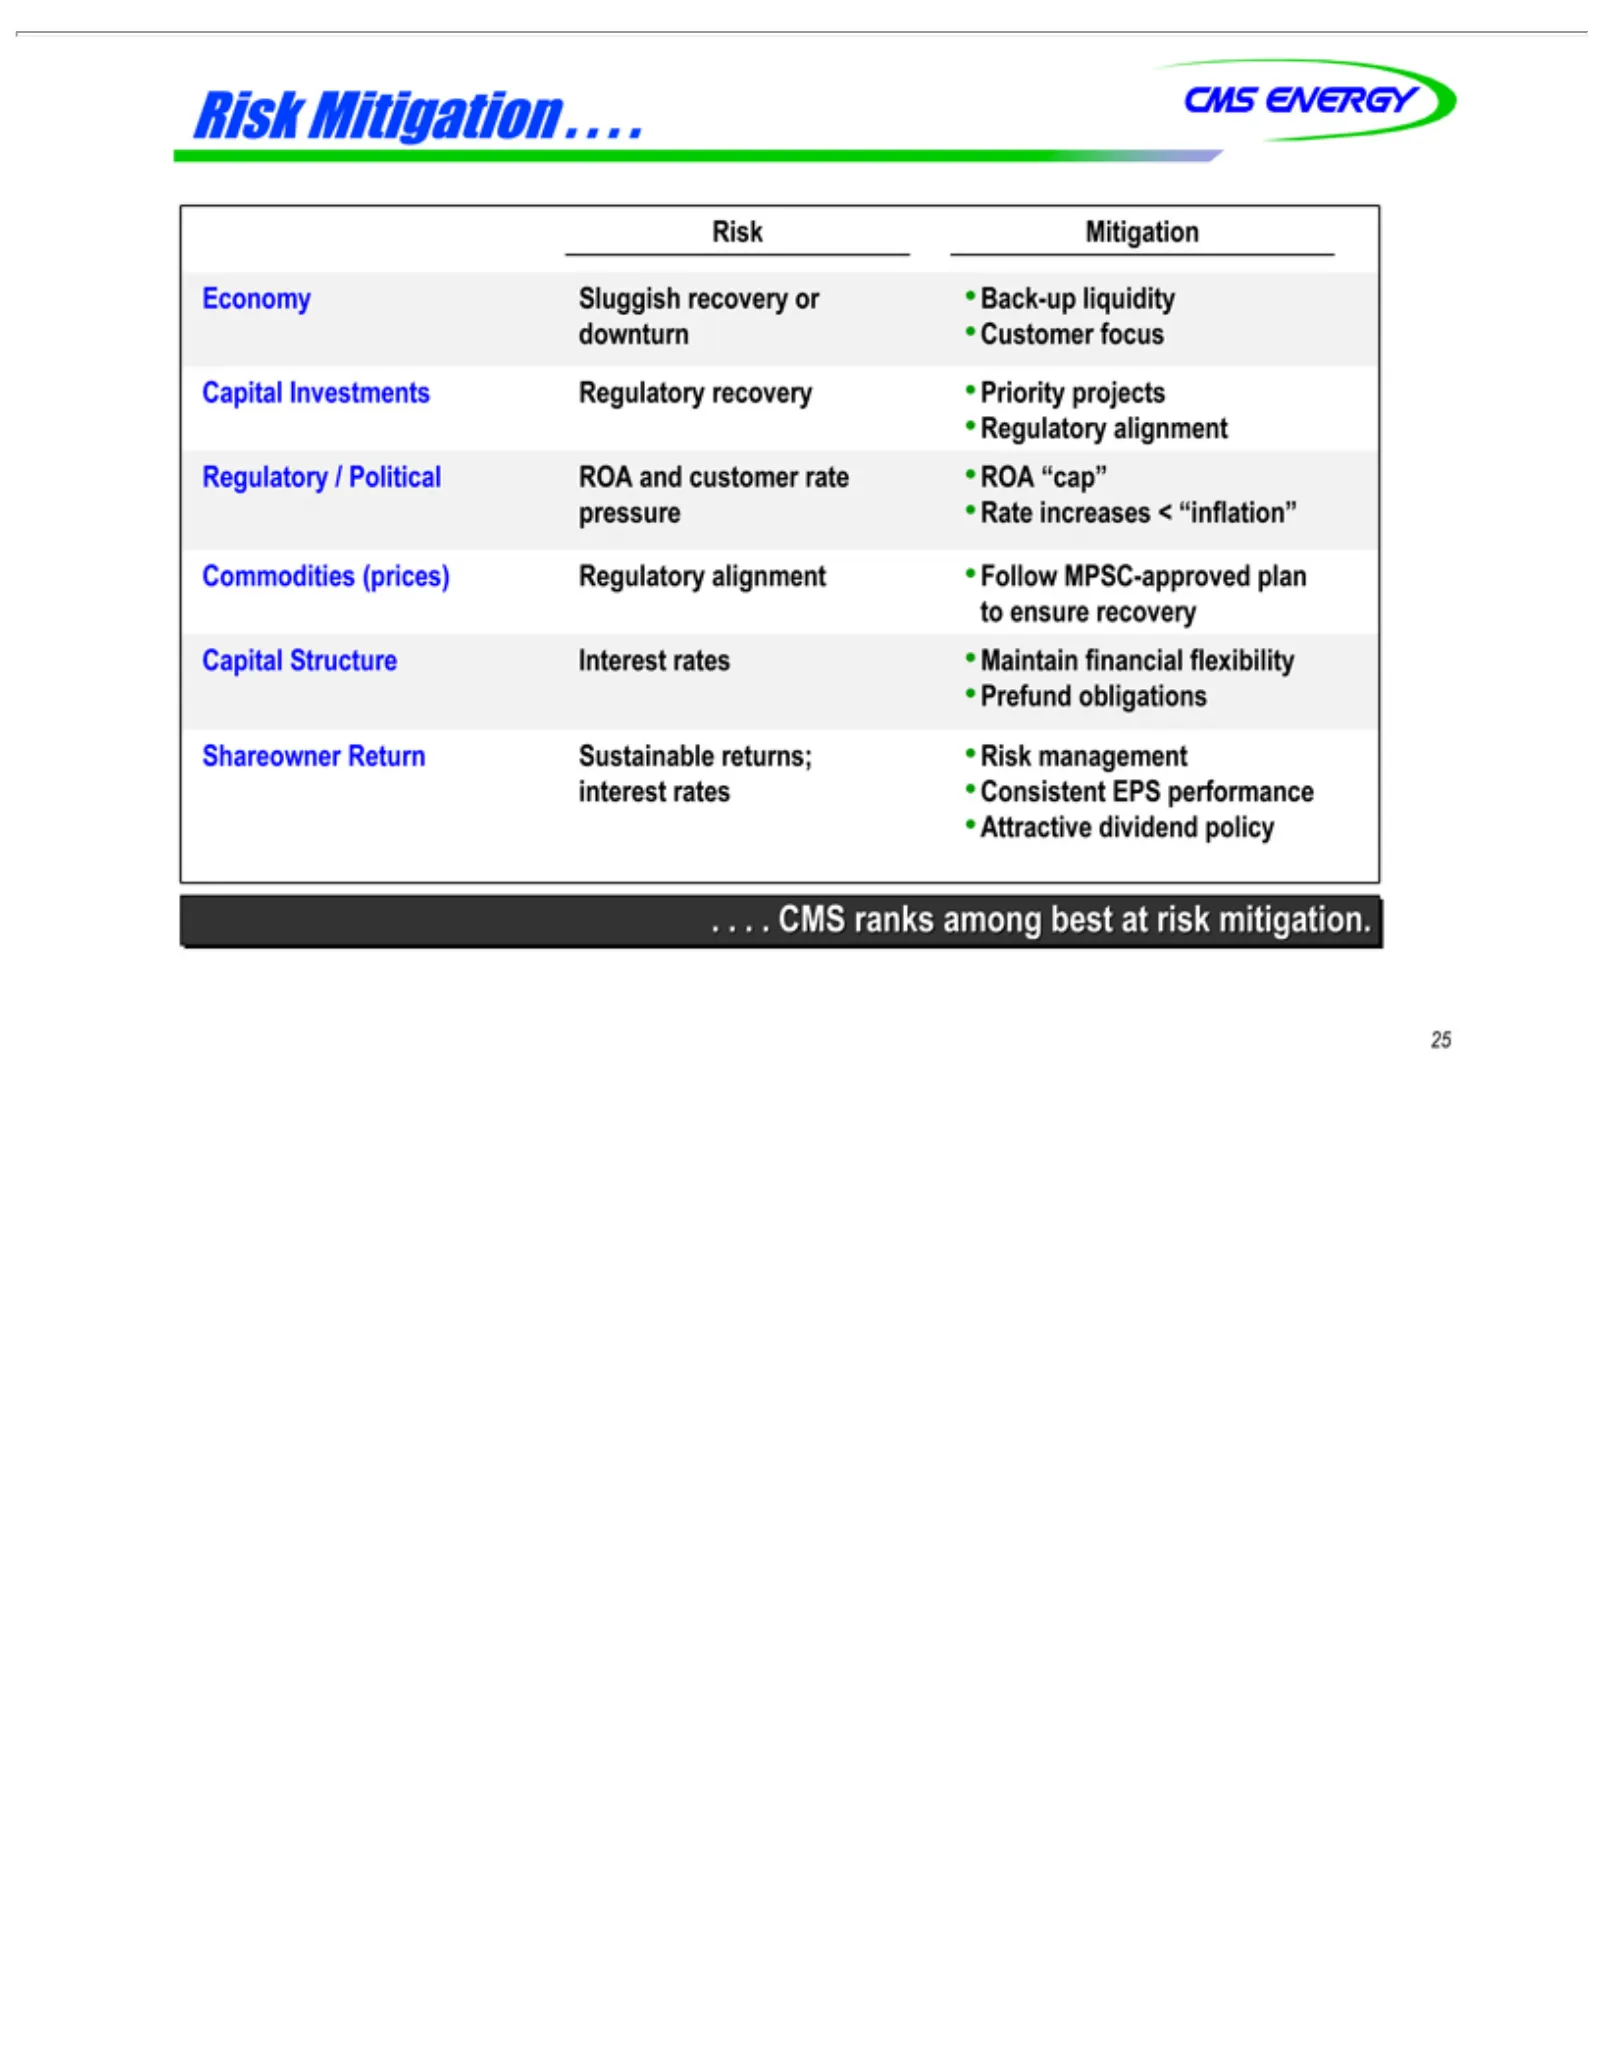
Slide 26: Risk mitigation
Risk Economy downturn Regulatory pressure Commodities to Capital Shareowner •interest CMS 25Attractive Regulatory Prefund ensure Mitigation ranks Investments Structure rates •recovery obligations Sluggish •Rate Customer /among dividend Return Political alignment •(prices) Consistent increases Intere
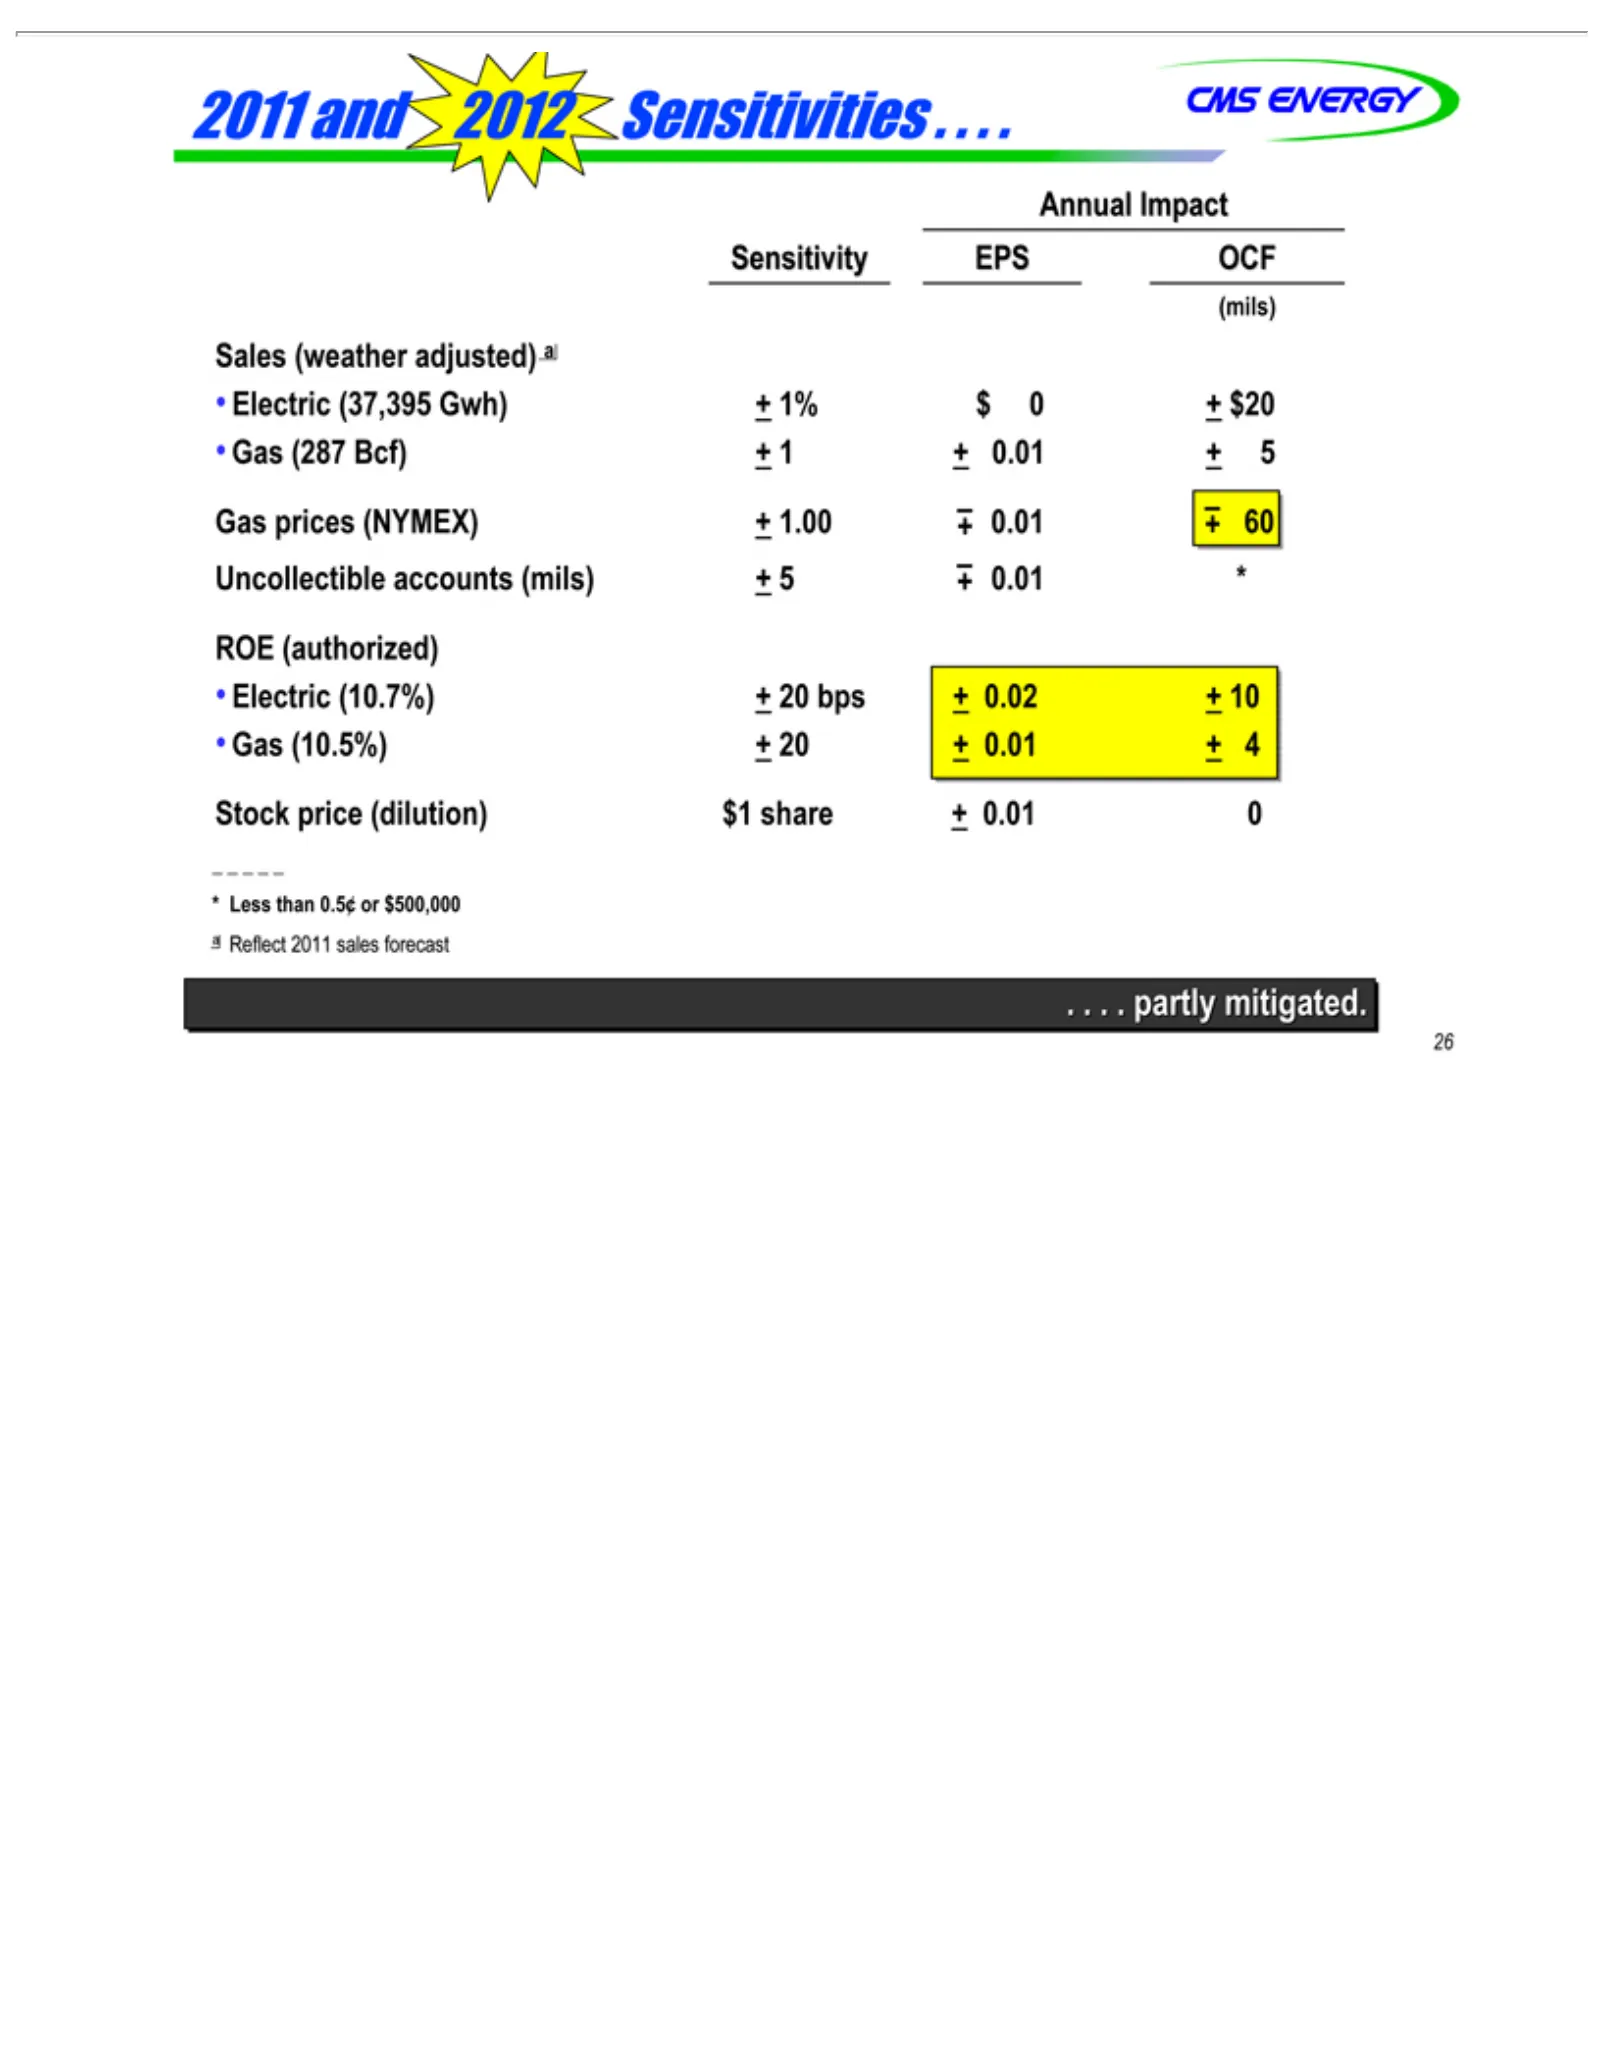
Slide 27: Annual sensitivities
* 2011 Annual Sensitivity Sales (mils) Uncollectible ROE Electric Gas _ Stock (287 prices (10.5%) and (authorized) (weather a Reflect partly 26 Impact Less (37,395 (10.7%) Bcf) 2012 (NYMEX) EPS than +accounts +sales mitigated. 2011 adjusted) 20 Sensitivities price OCF Gwh) 1+0.5¢ ++200.01 0.01 (dilu
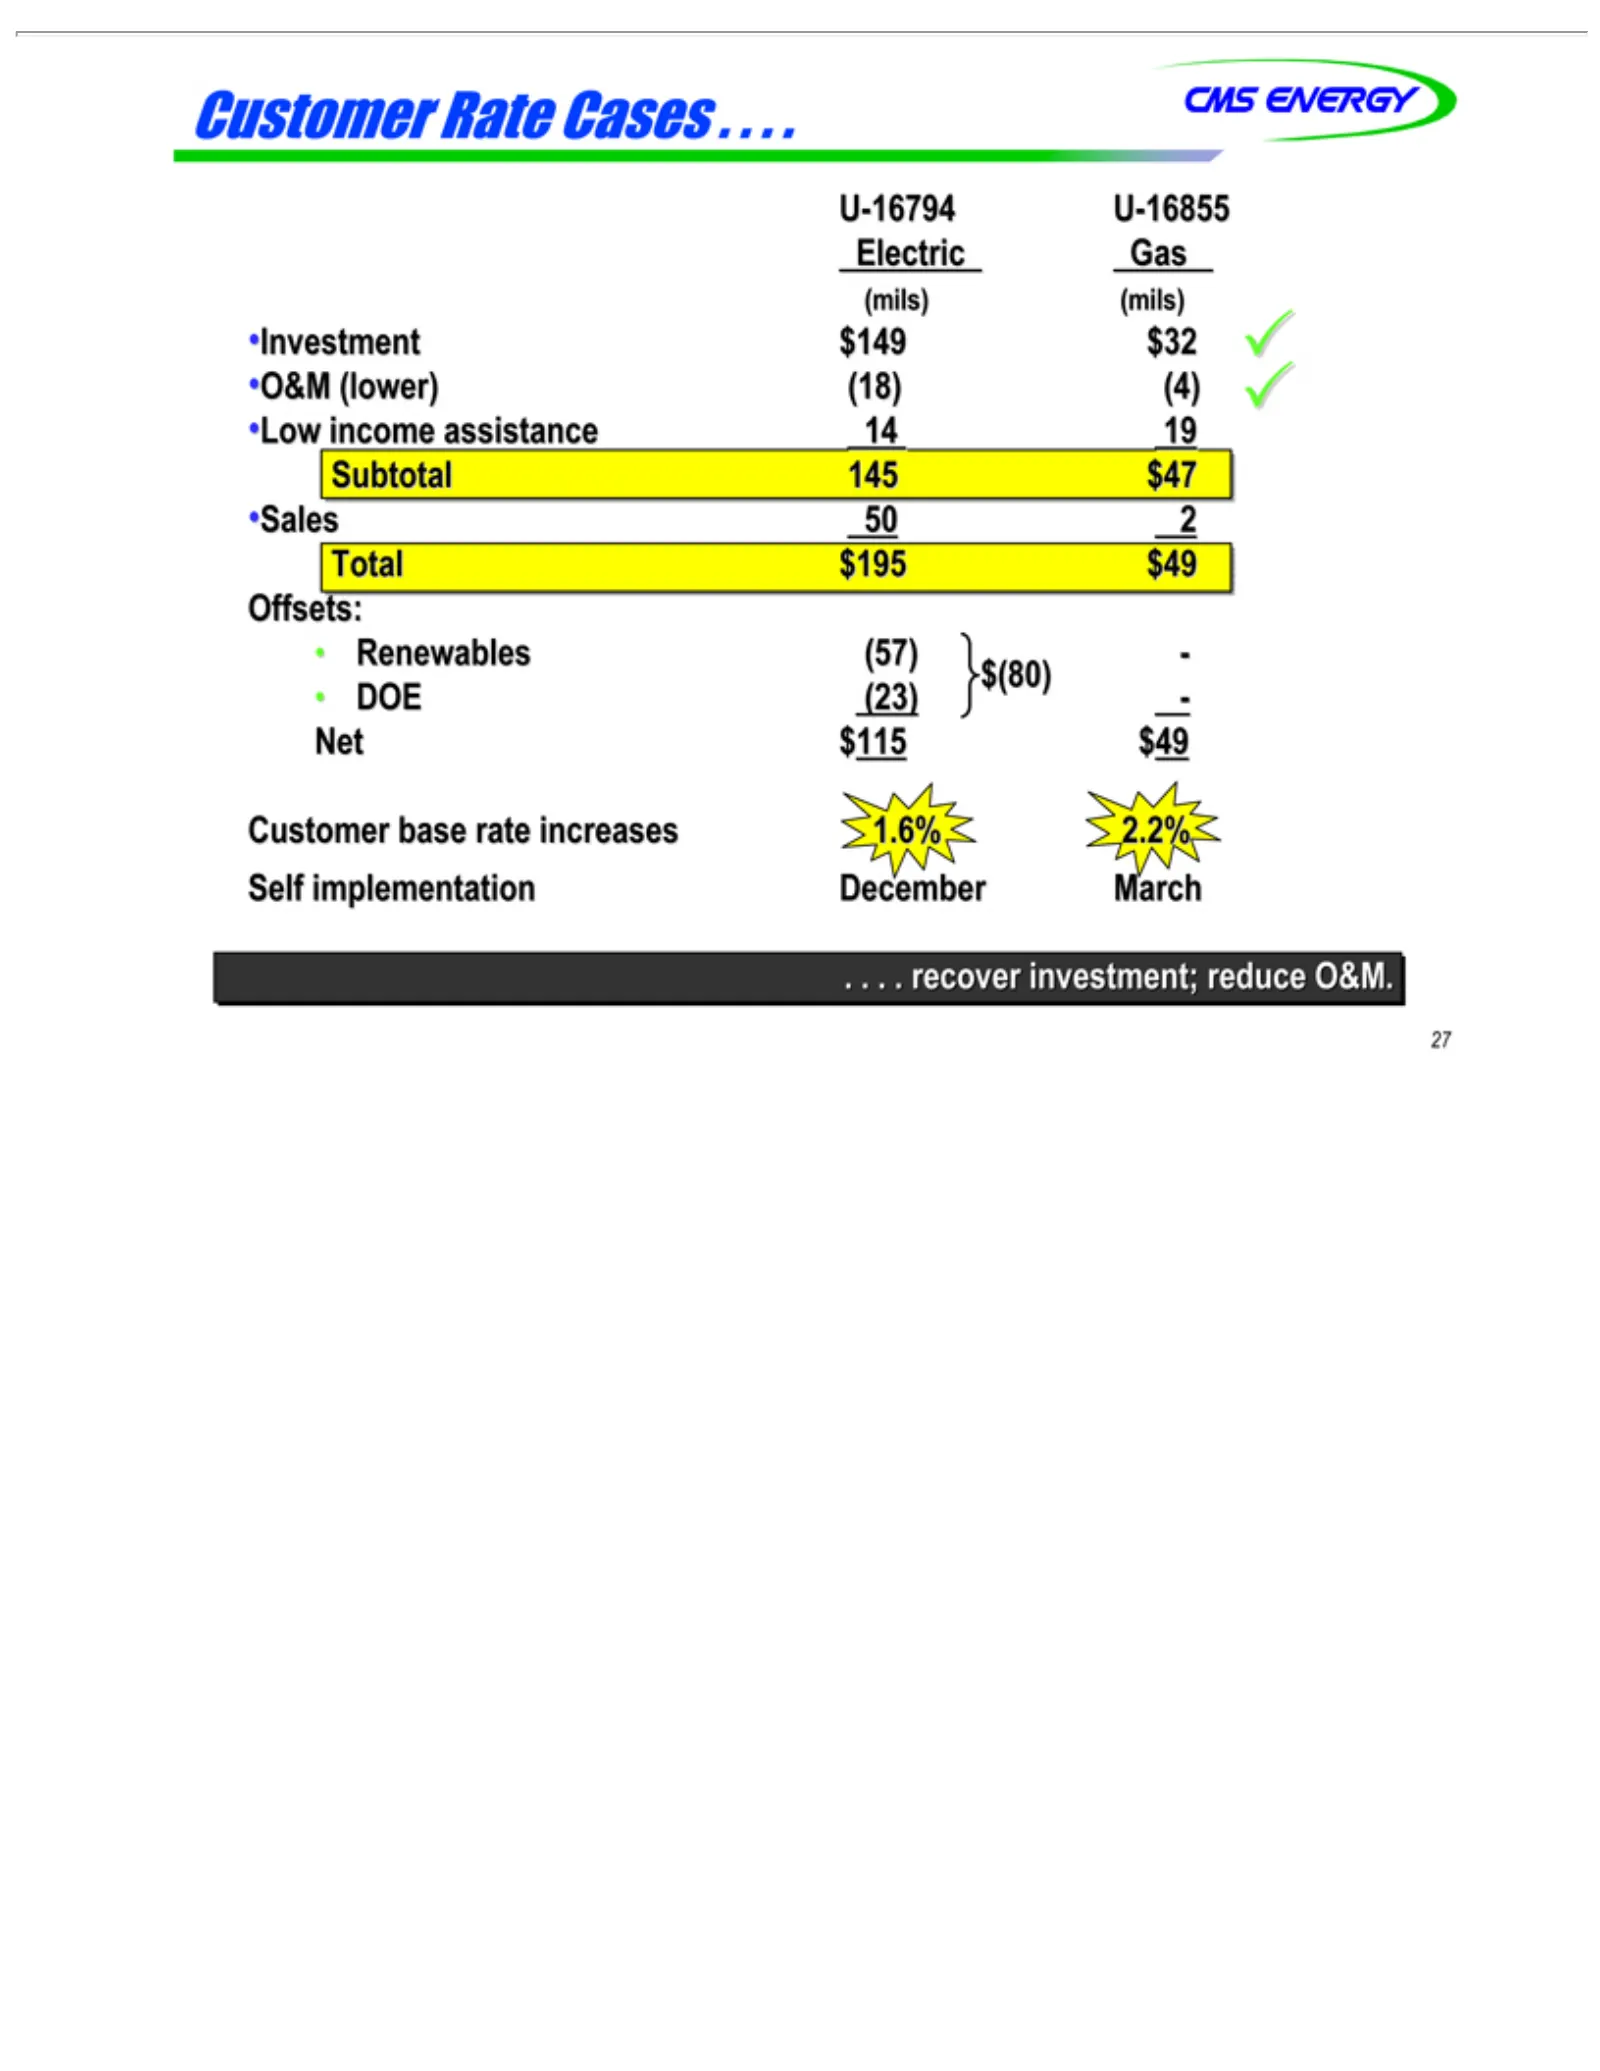
Slide 28: Electric rate case U-16794
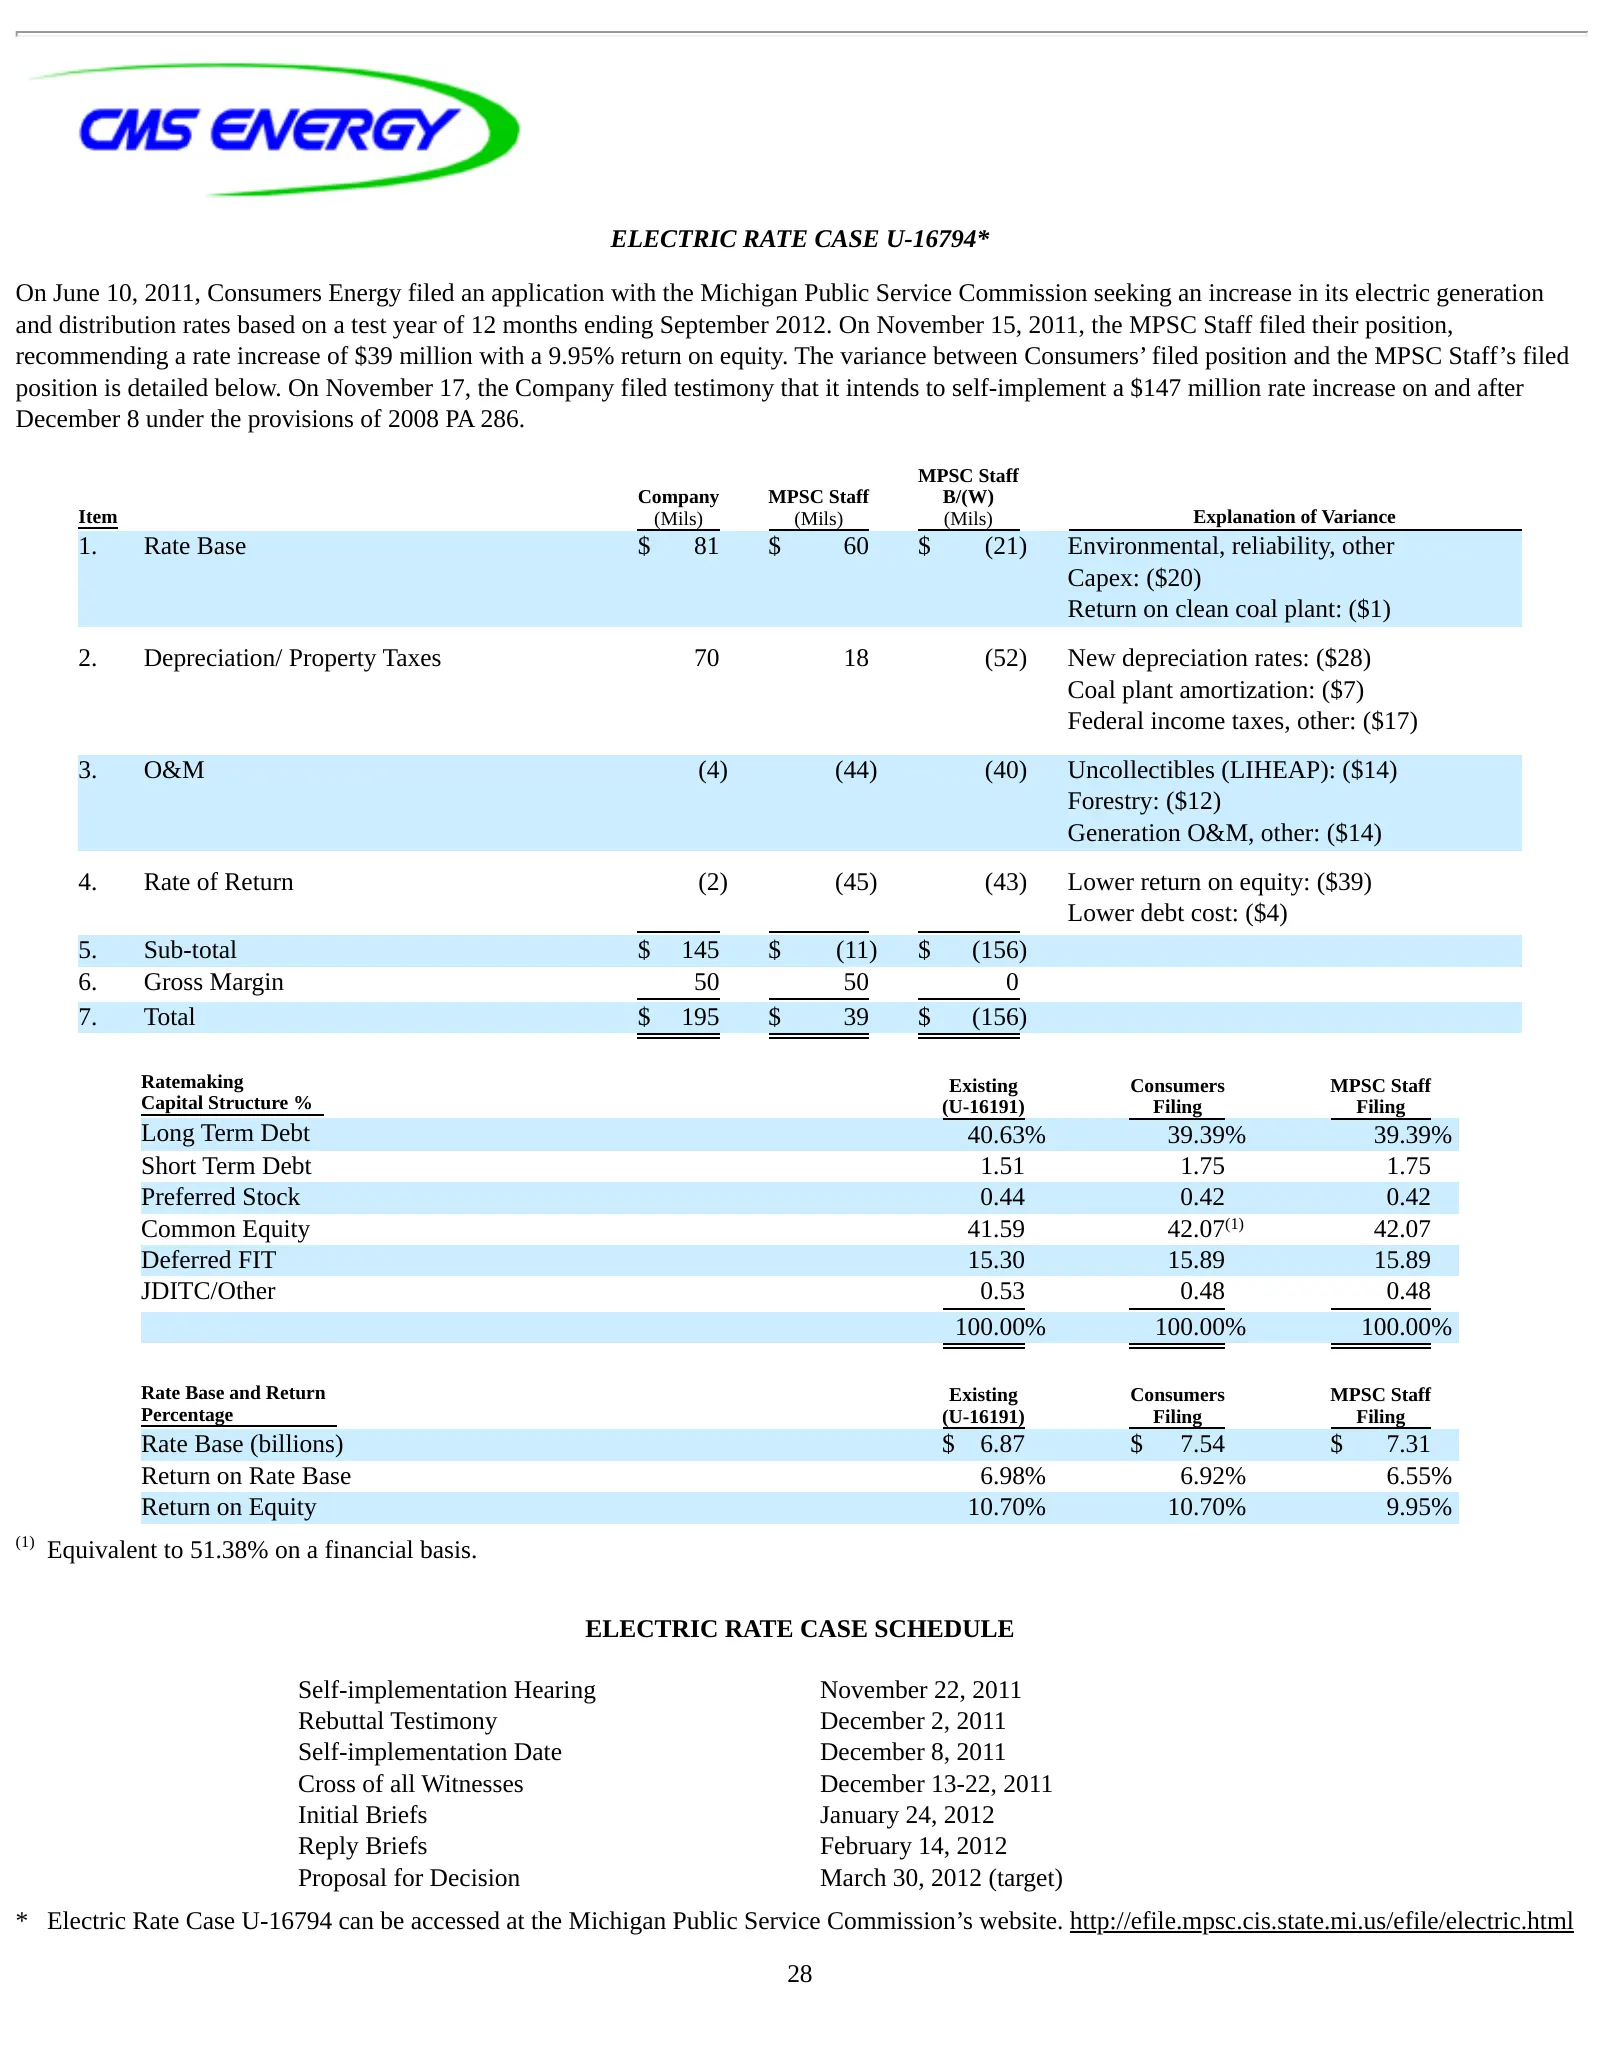
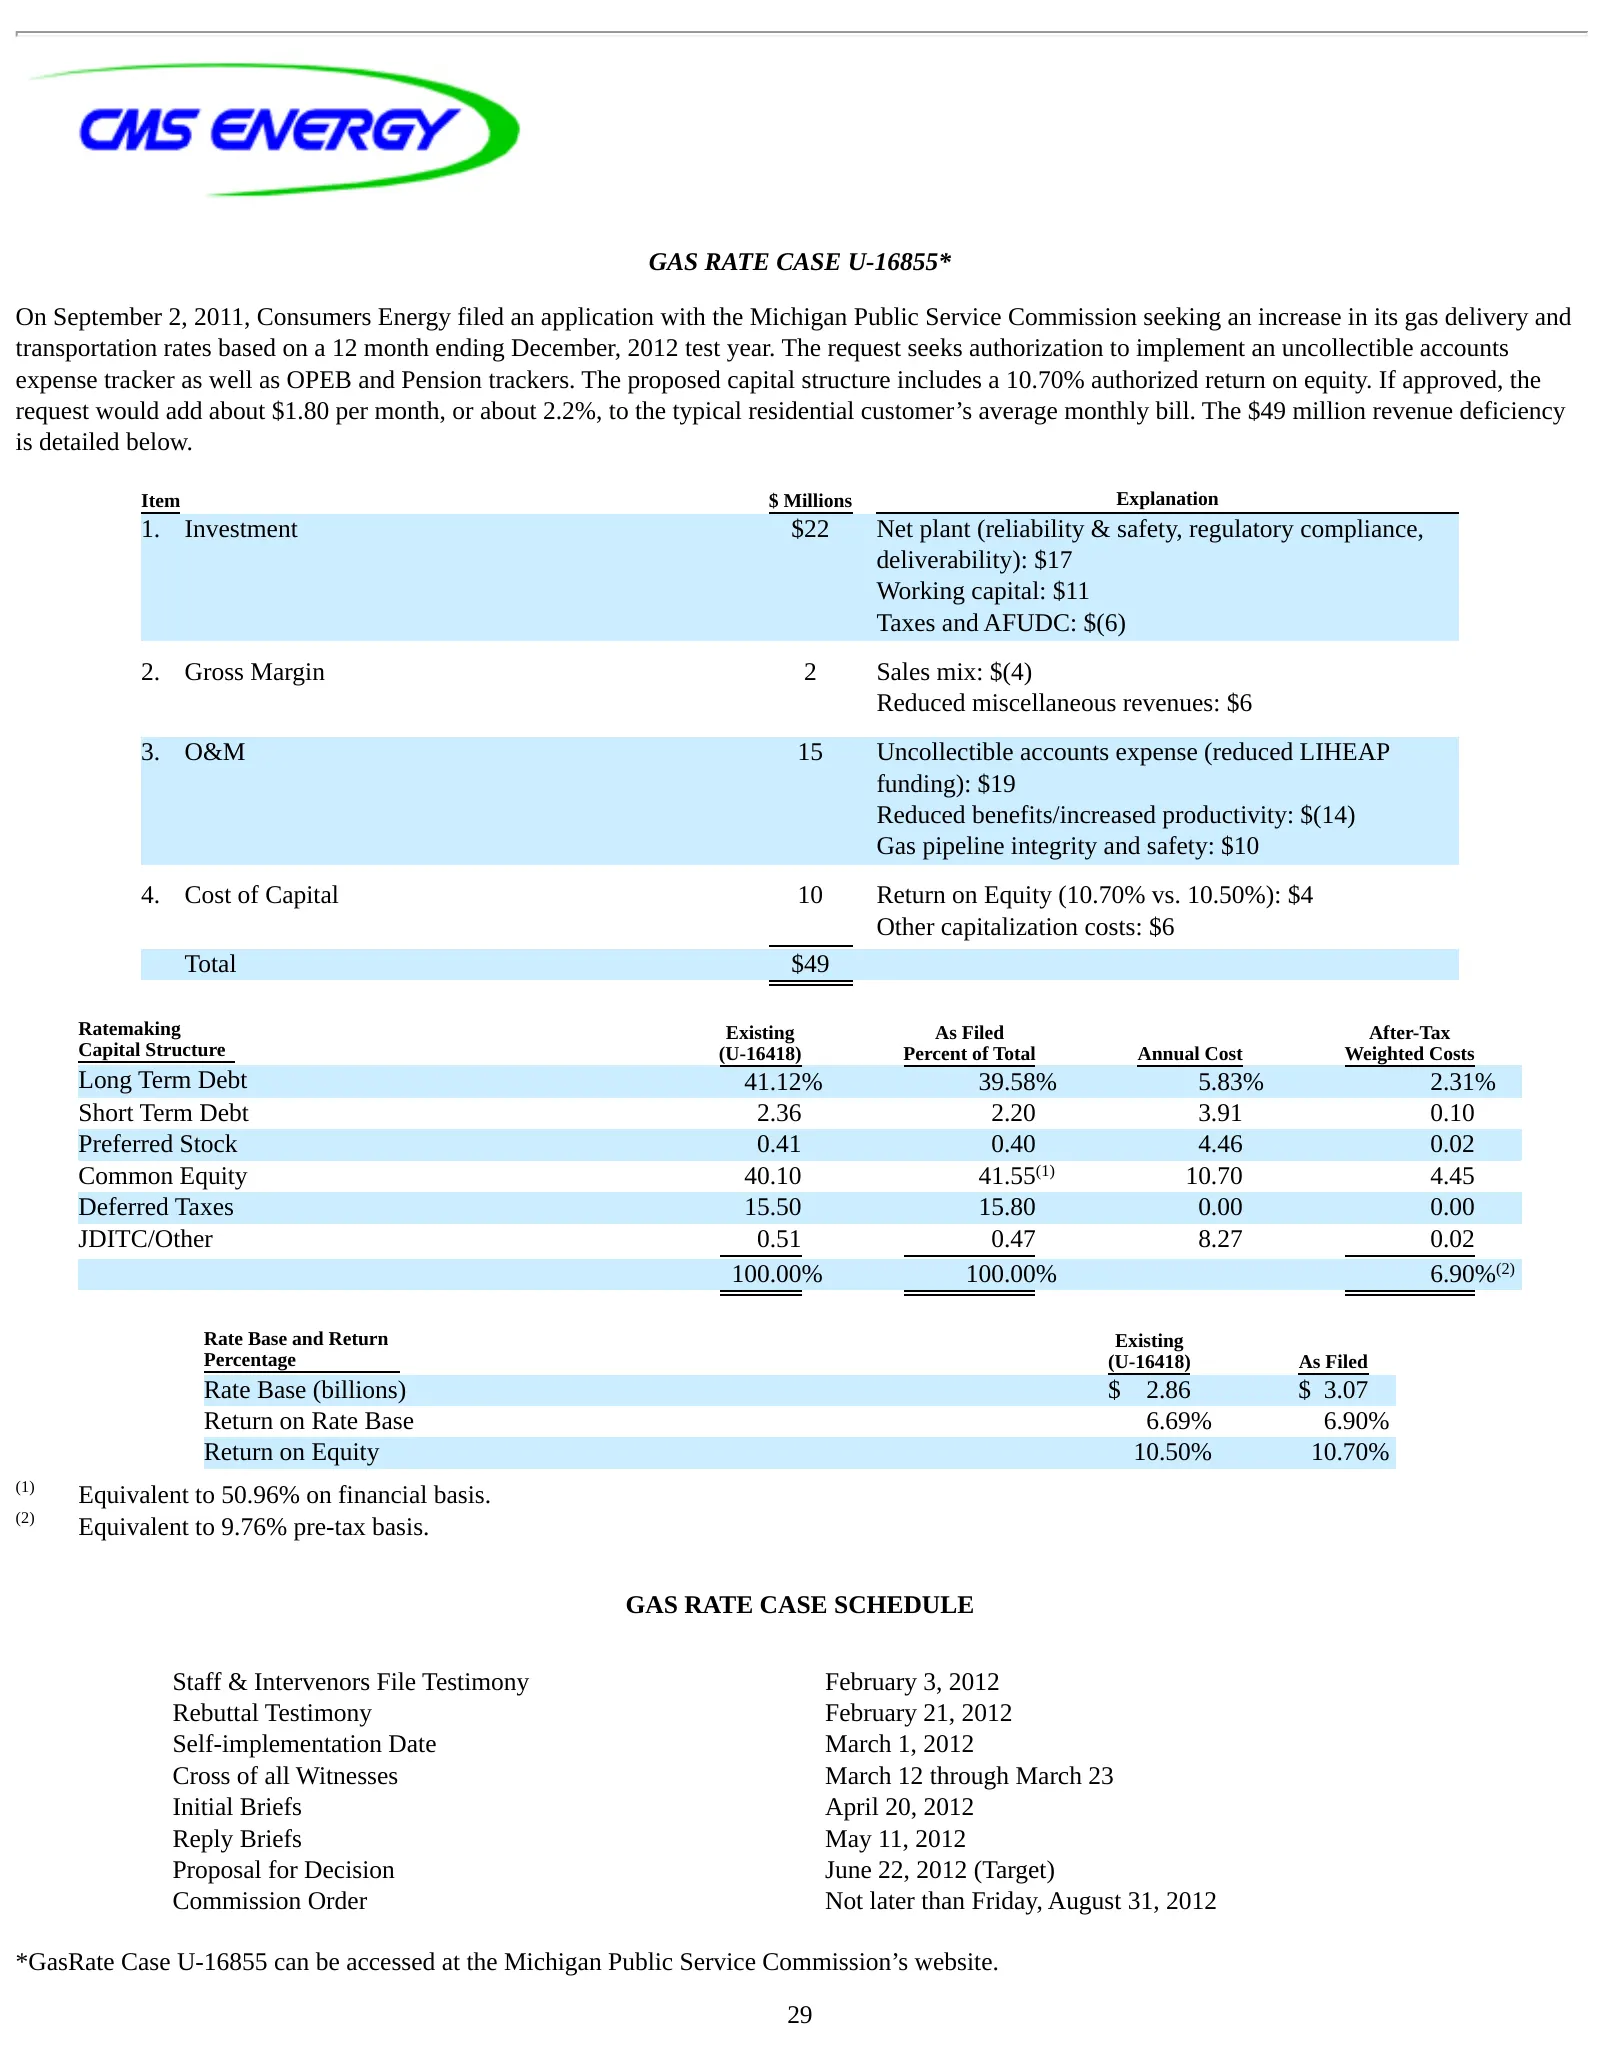
U-16794 Electric Investment (mils)(mils) O&M Low Subtotal Sales Total Renewables(57) Offsets: DOE(23) $(80) Net Customer Self recoverecover 27 $115 implementation income $195 50 (lower)(18)(4) Gas $145 2U-16855 $49 -base Rate $49 $149 assistance $47 investment; rate Cases -$32 increases December 331
Slide 29: Electric rate case U-16794
ELECTRIC RATE CASE U-16794* On June 10, 2011, Consumers Energy filed an application with the Michigan Public Service Commission seeking an increase in its electric generation and distribution rates based on a test year of 12 months ending September 2012. On November 15, 2011, the MPSC Staff filed th
Slide 30: Gas rate case U-16855
GAS RATE CASE U-16855* On September 2, 2011, Consumers Energy filed an application with the Michigan Public Service Commission seeking an increase in its gas delivery and transportation rates based on a 12 month ending December, 2012 test year. The request seeks authorization to implement an uncolle
Slide 31: Consumers rate base and regulated rate cases
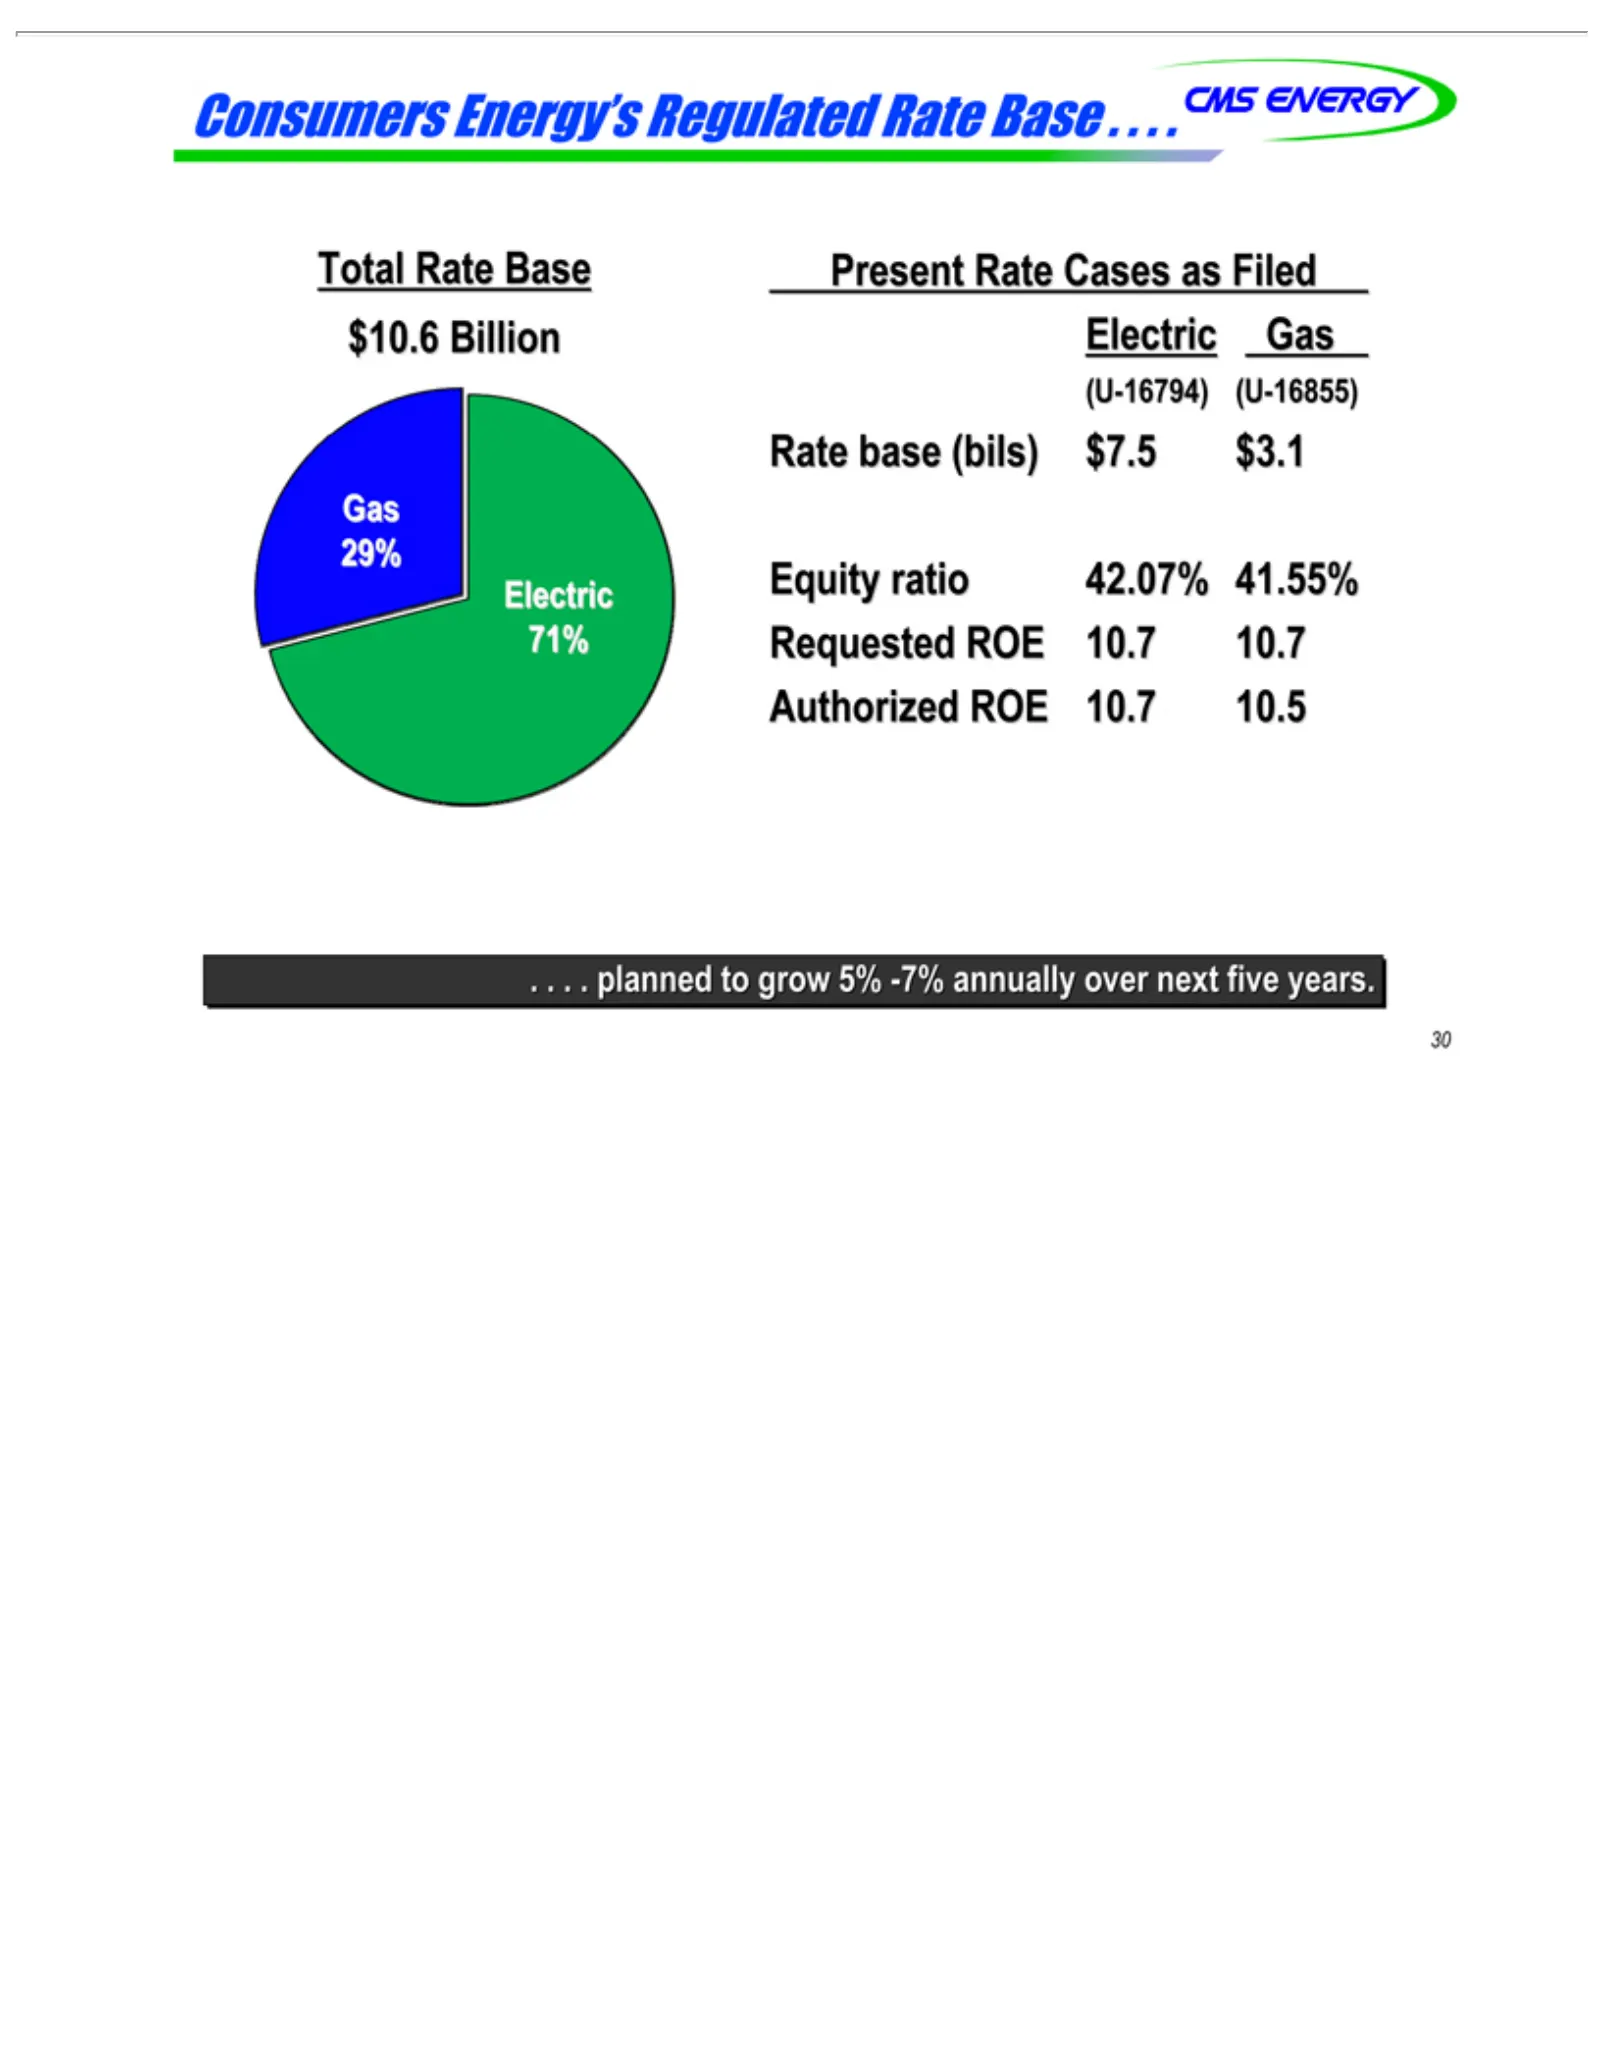
Consumers Total $10.6 30 Rate Rate Billion Authorized planned base Base Energy’s Requested Equity Electric (U-16794)(U-16855) Electric 29% Gas 71% Present to(bilsbils)) grow ROE ratio ROE 5% 10.7 Regulated Gas $7.5 -7% Rate 42.07% 10.7 10.5 Cases Rate annually $3.1 10.7 41.55%asBase overFiled next f
Slide 32: Credit ratings
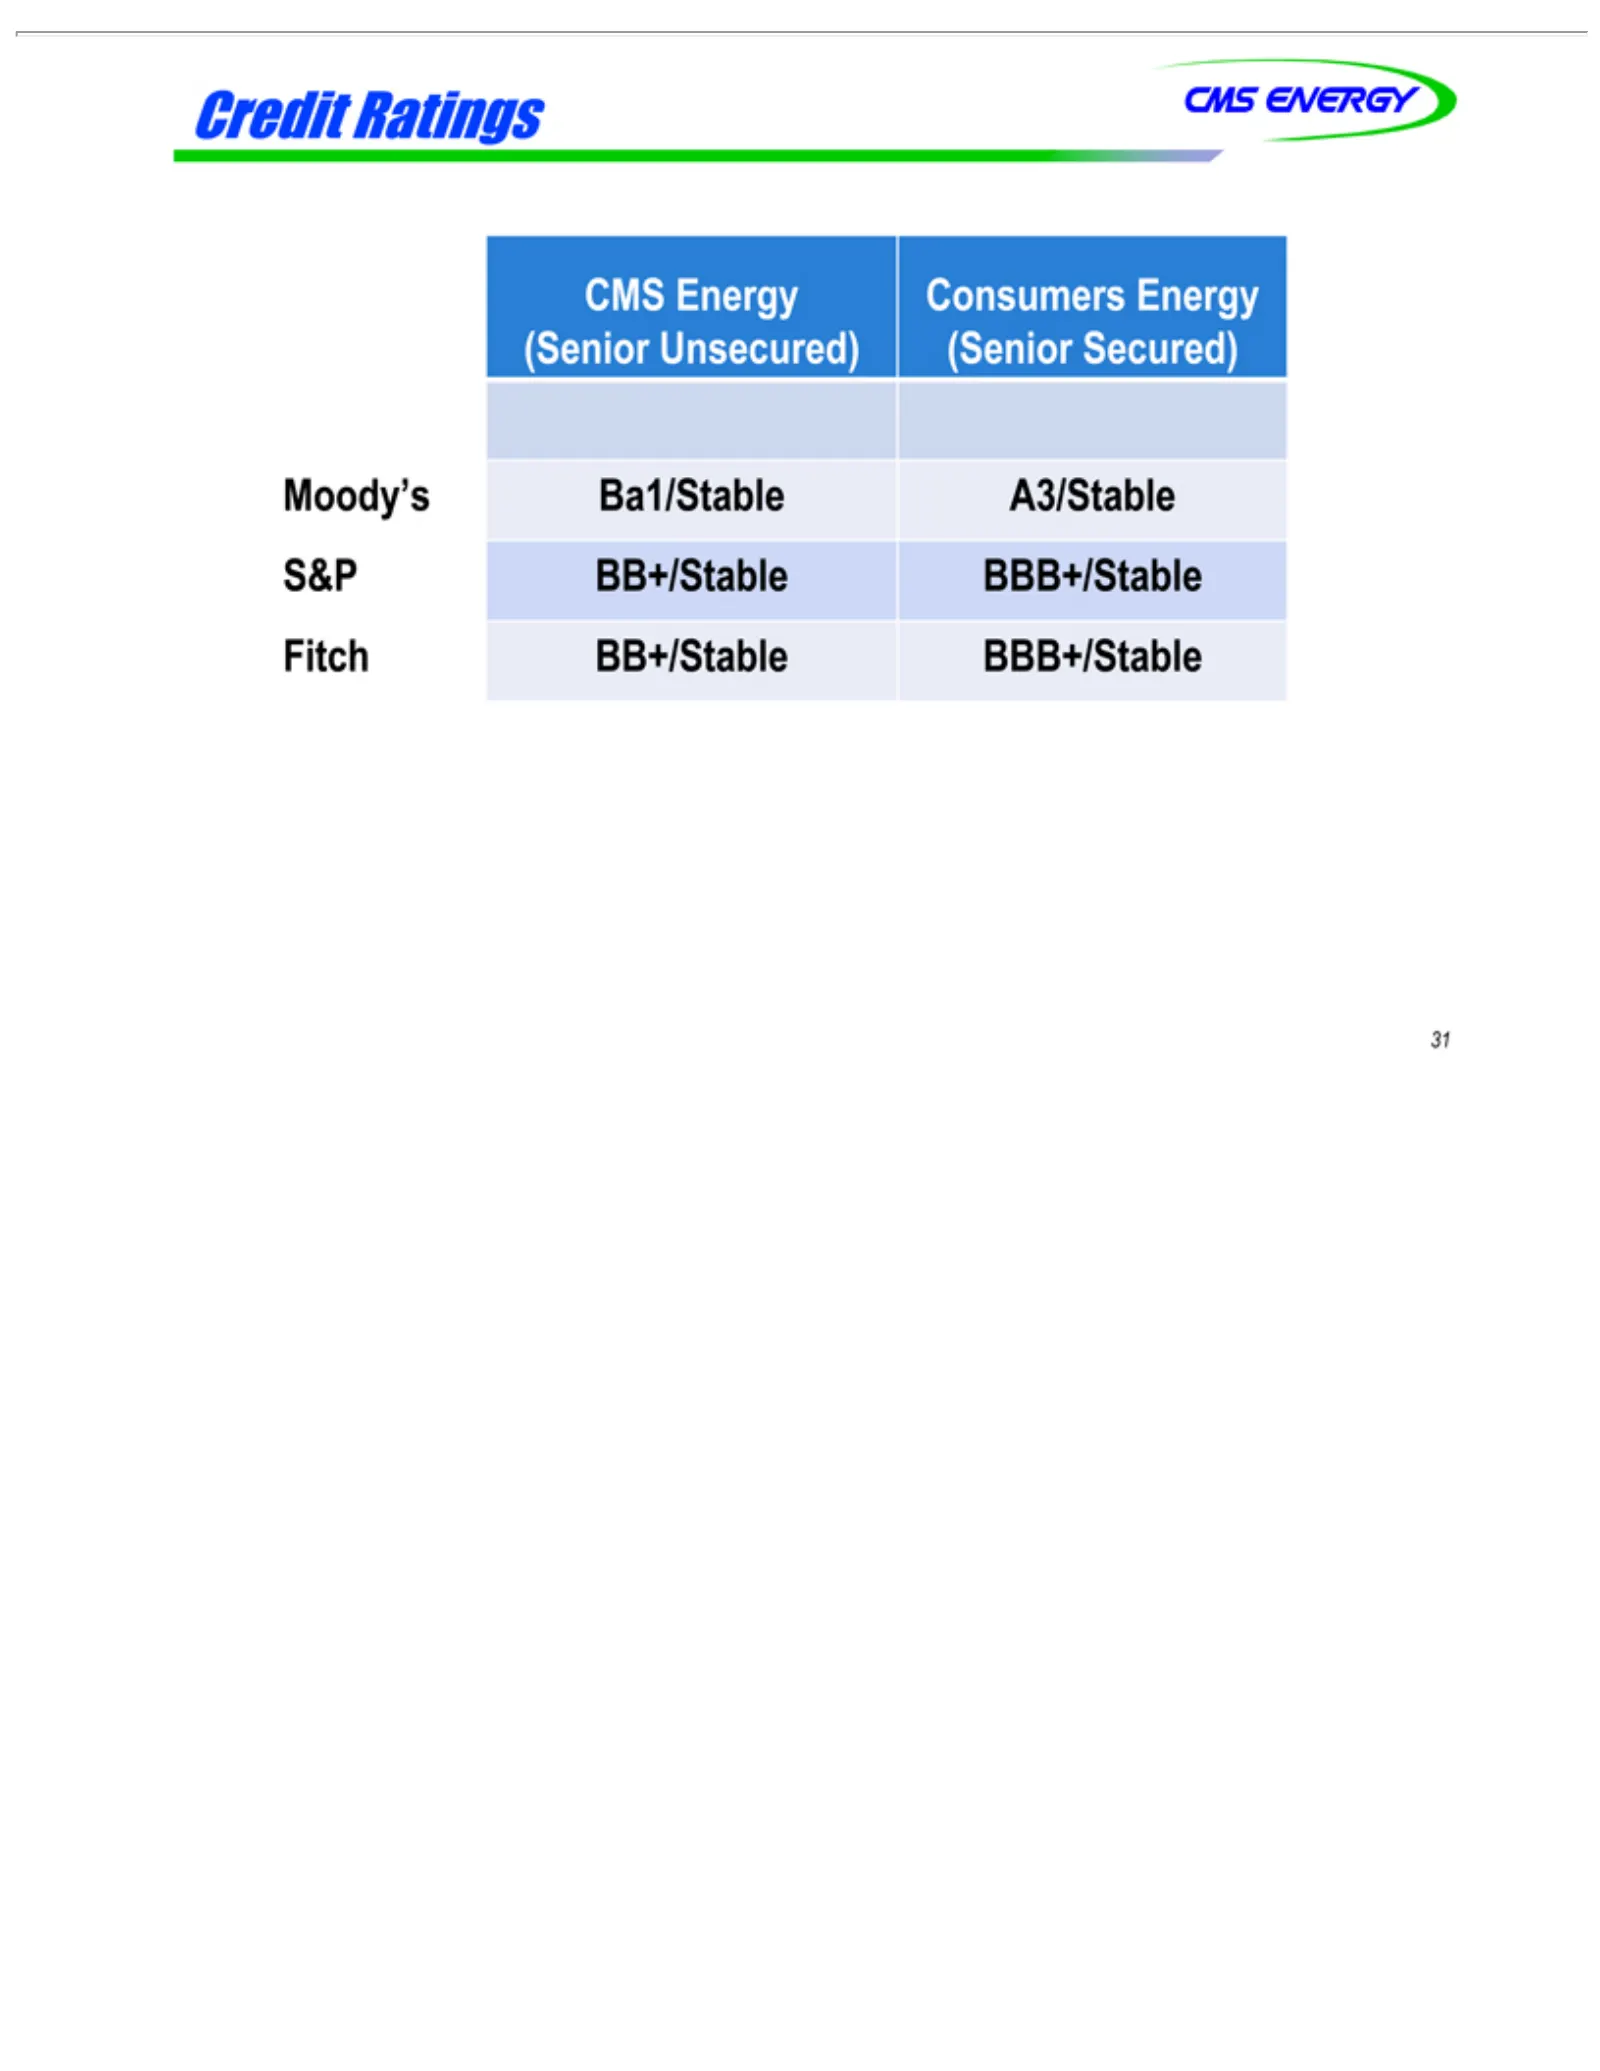
CreditBB+/Stable CMS (Senior Moody’s S&P Fitch 31 BB+/Stable Energy Ratings Unsecured)(Senior Ba1/Stable Consumers BBB+/Stable BBB+/Stable A3/Stable Energy Secured)
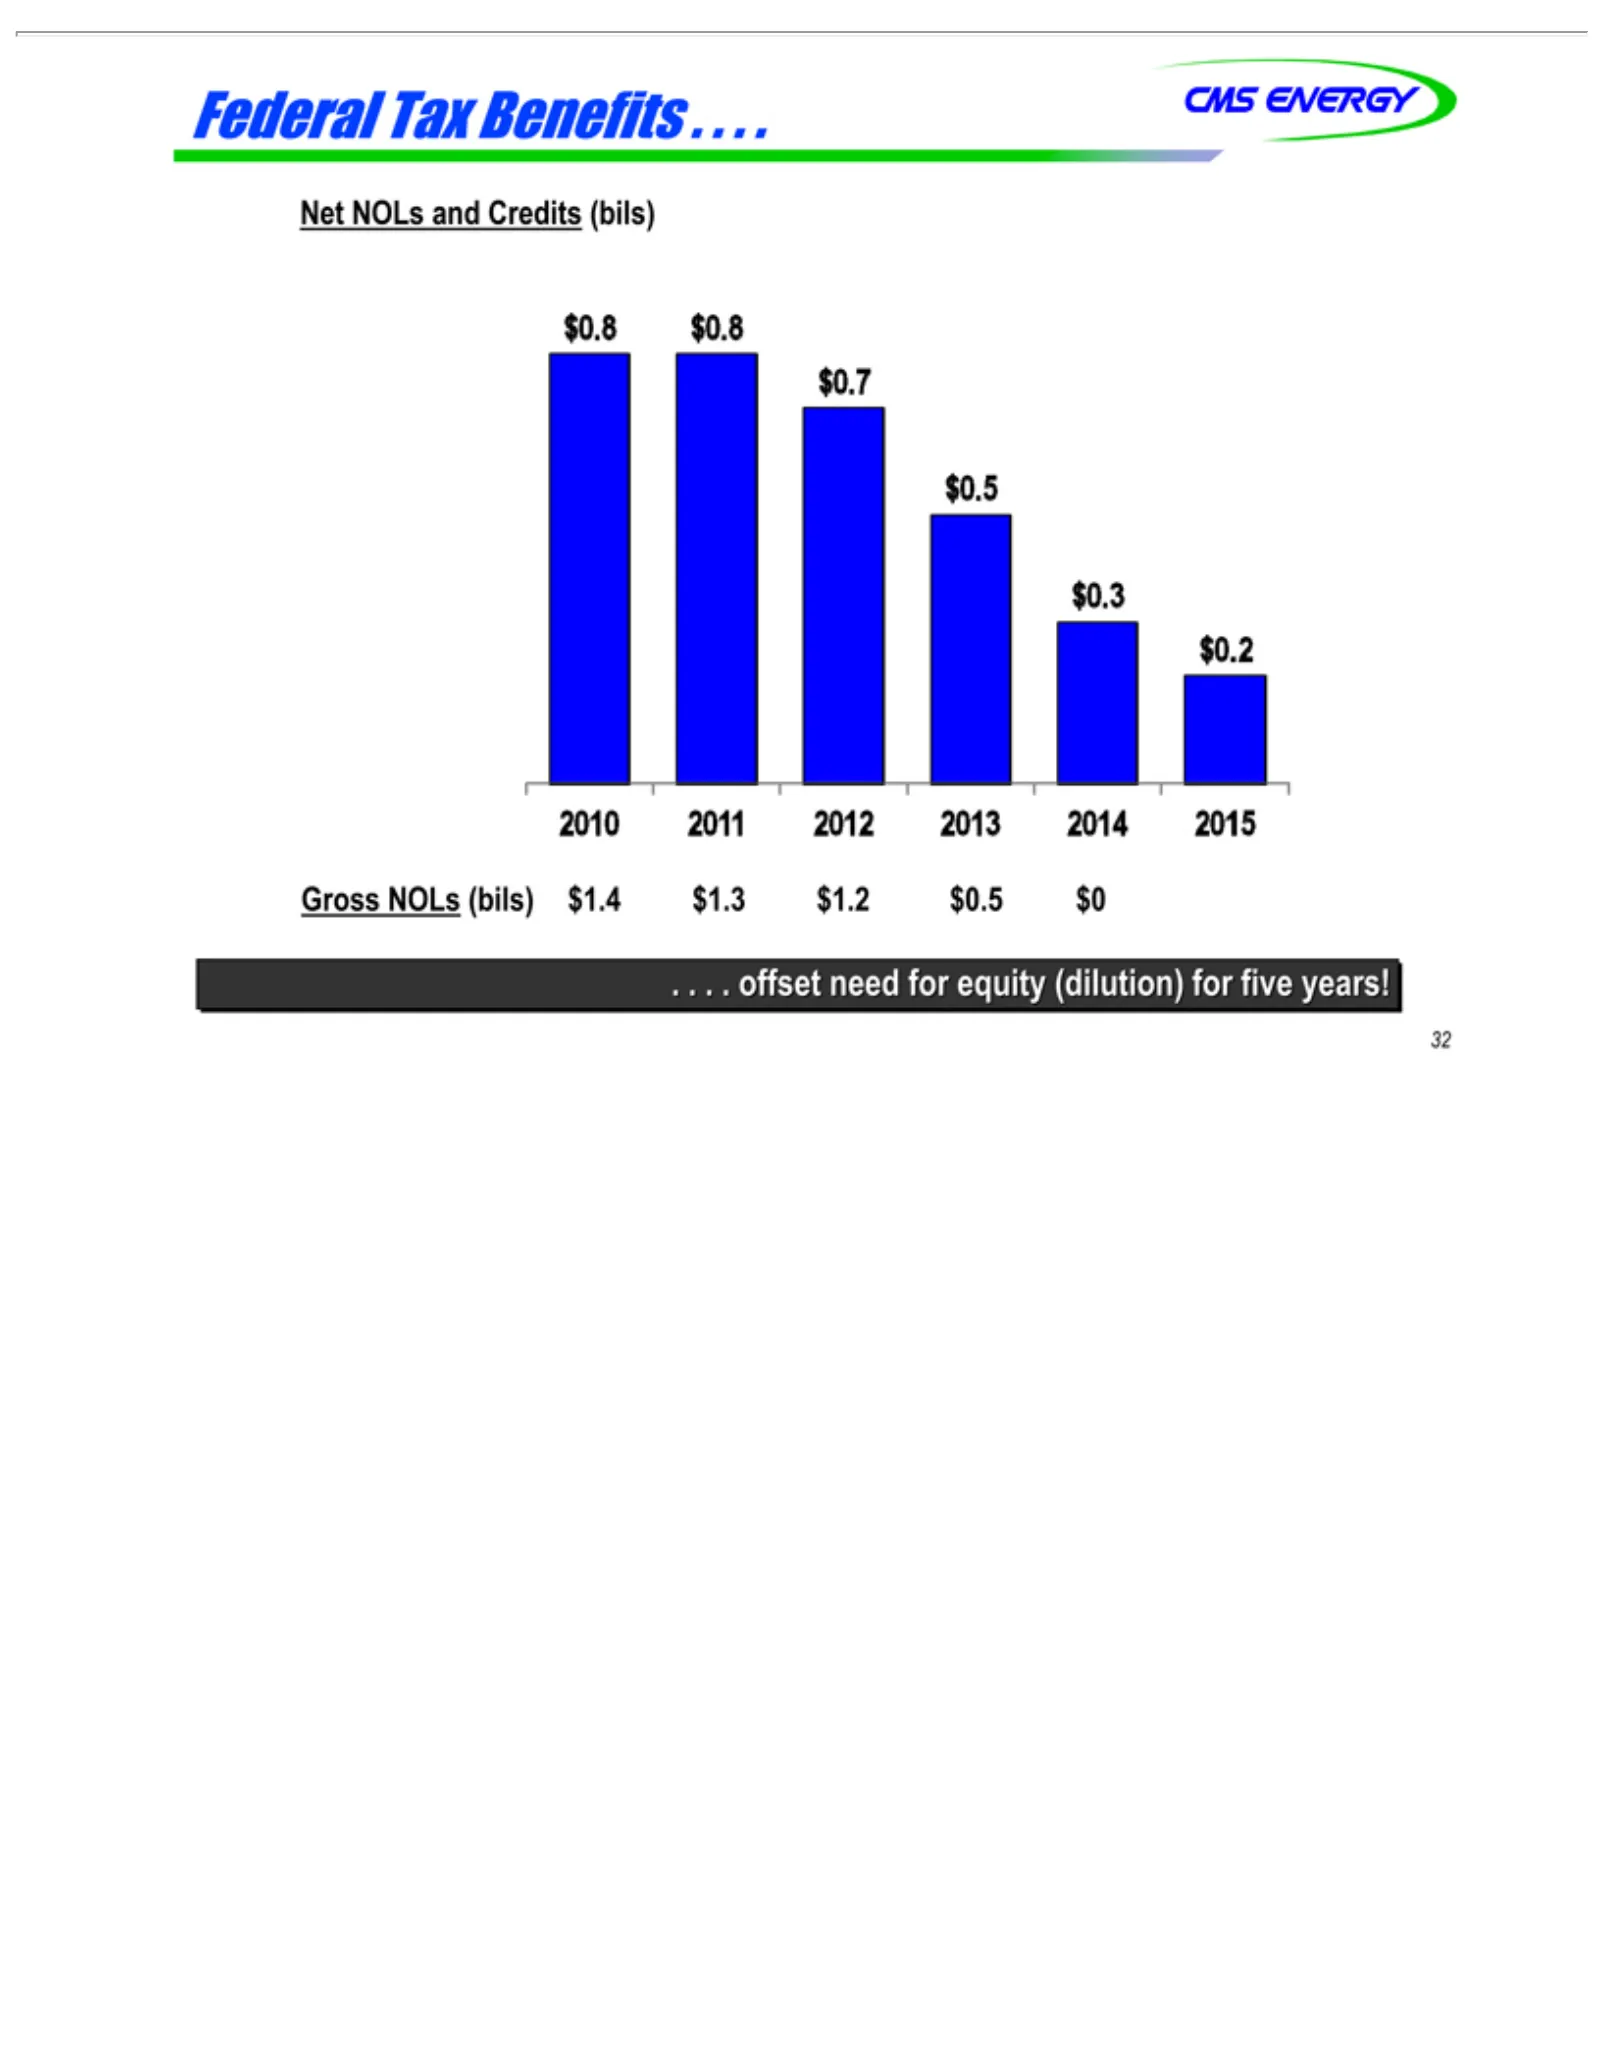
Slide 33: Federal NOLs and tax credits
Federal Net $0.8 2010 $0.2 $0.3 $0.5 $0.7 Gross .... 32 offset NOLs $0.8 2011 NOLs Tax need and 2012 Benefits (bils) for Credits 2013 equity $1.42014 (bils) $1.3 (dilution) 2015 $1.2 $0.5 for five $0 years!
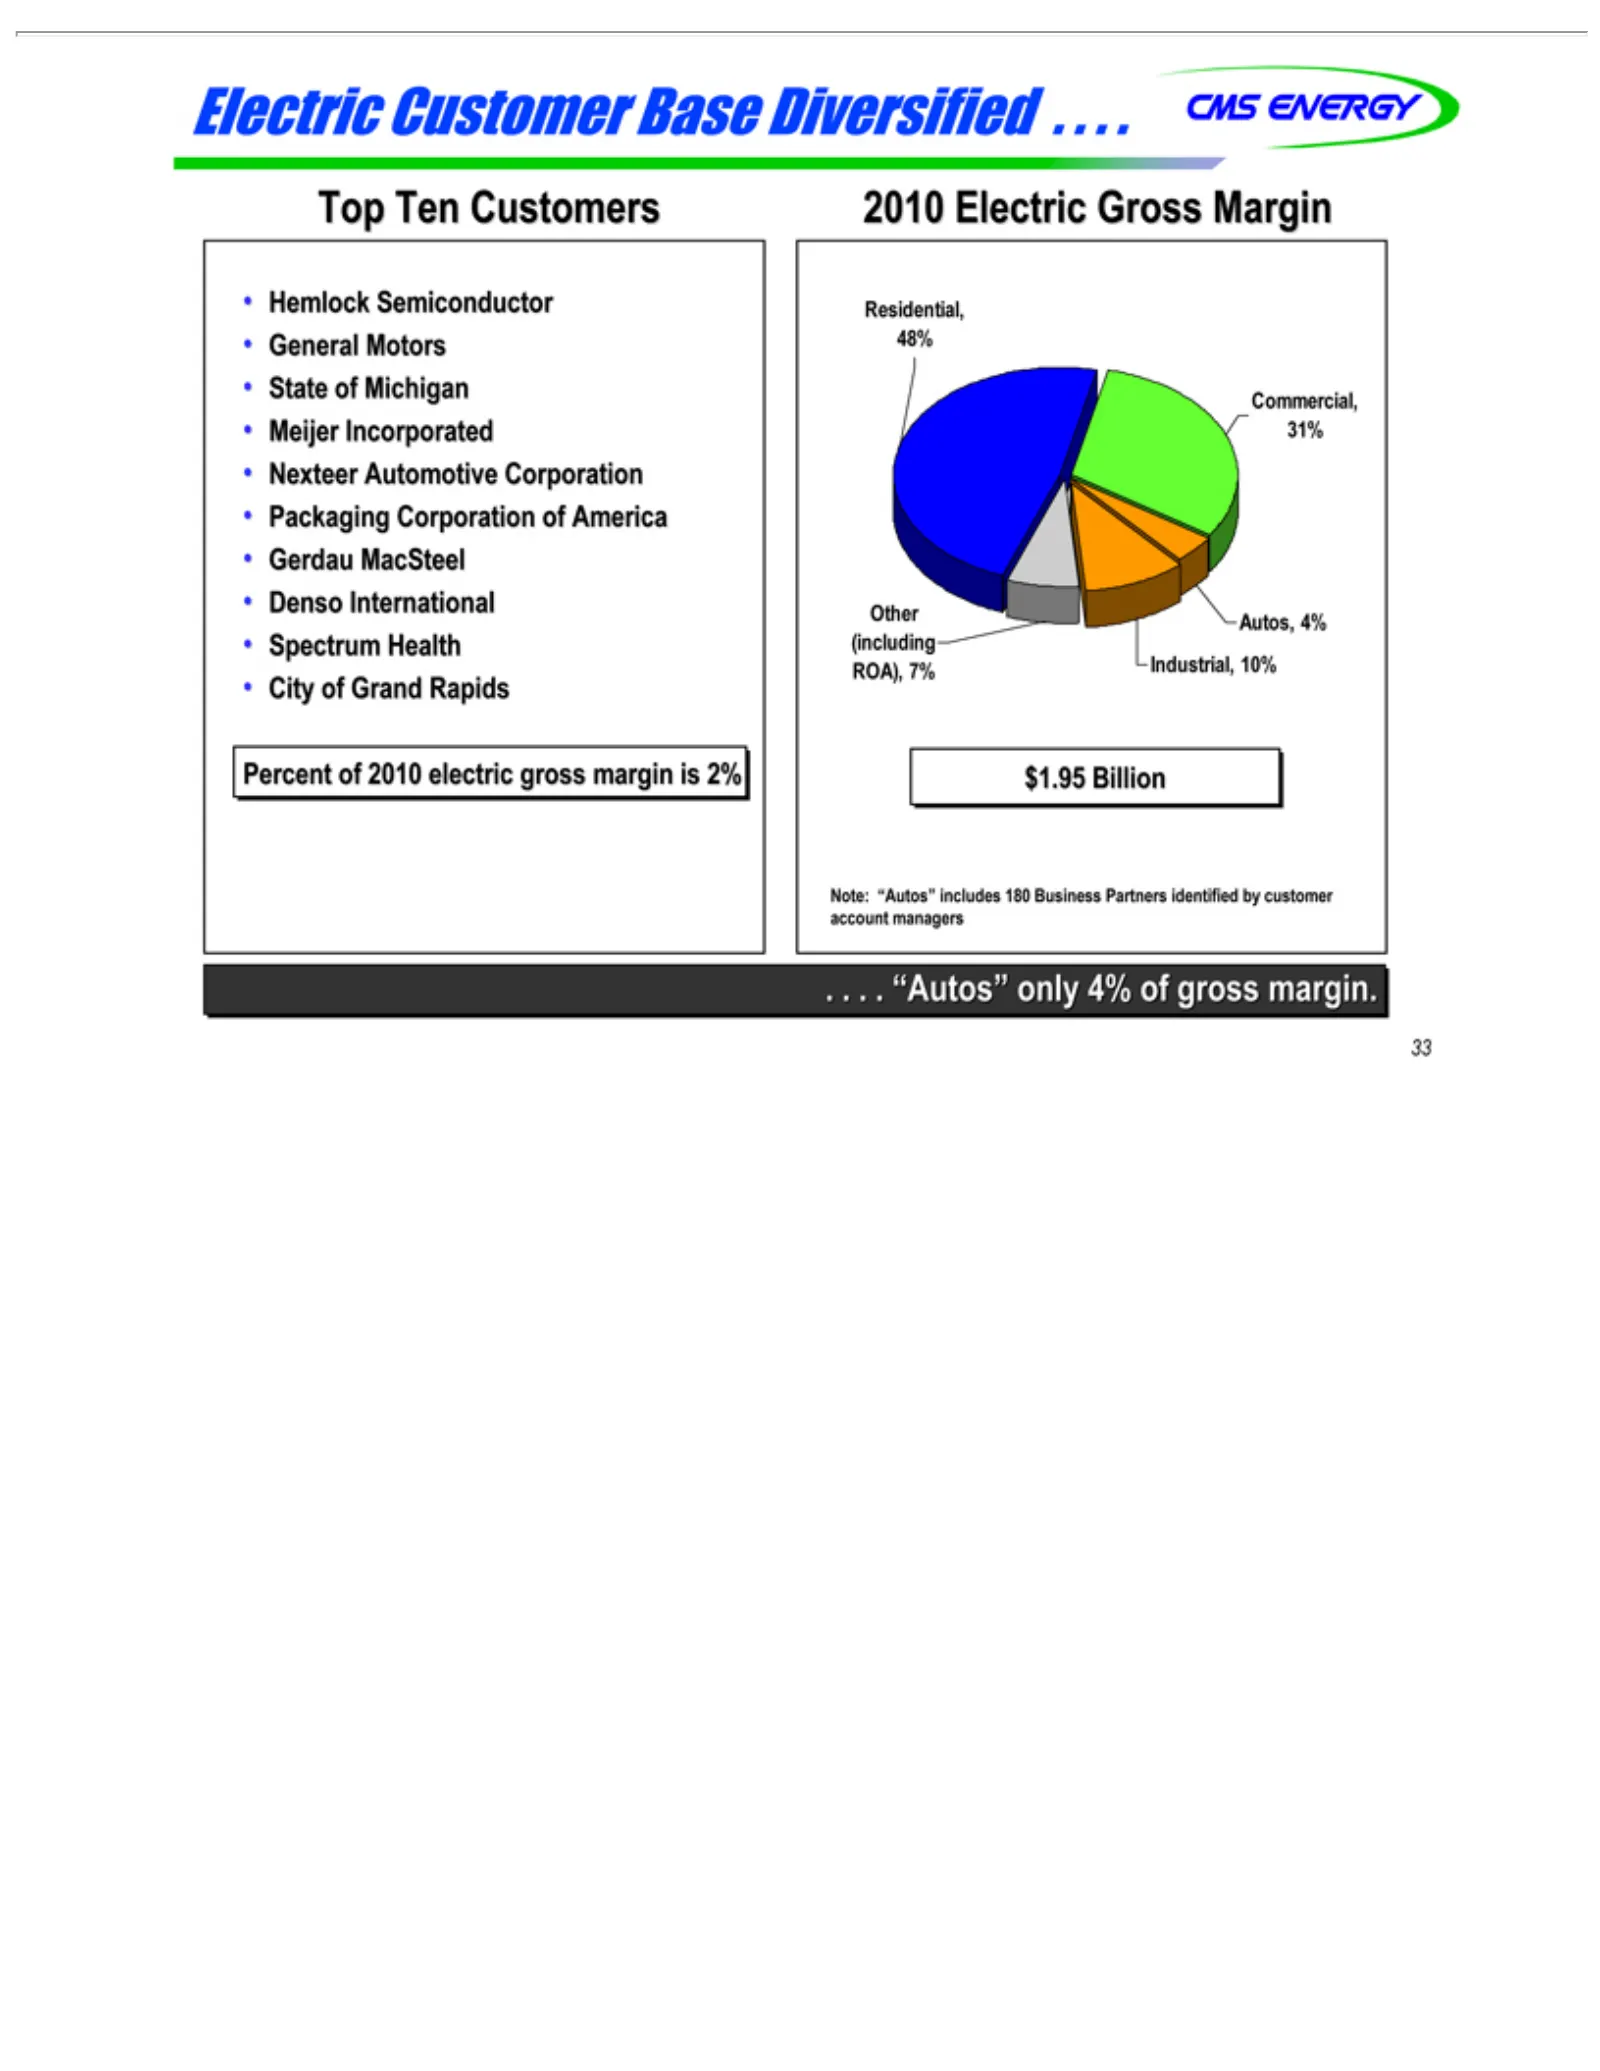
Slide 34: Electric customer mix
Electric Hemlock General State Meijer Nexteer Packaging Gerdau Denso Spectrum City Percent 2010 Other 31% Commercial, 48% Residential, ROA), (including $1.95 33 Note:of of Electric Autos, account “Autos”International Incorporated 7% Grand MacSteel Billion of Michigan Customer Automotive Motors Semic
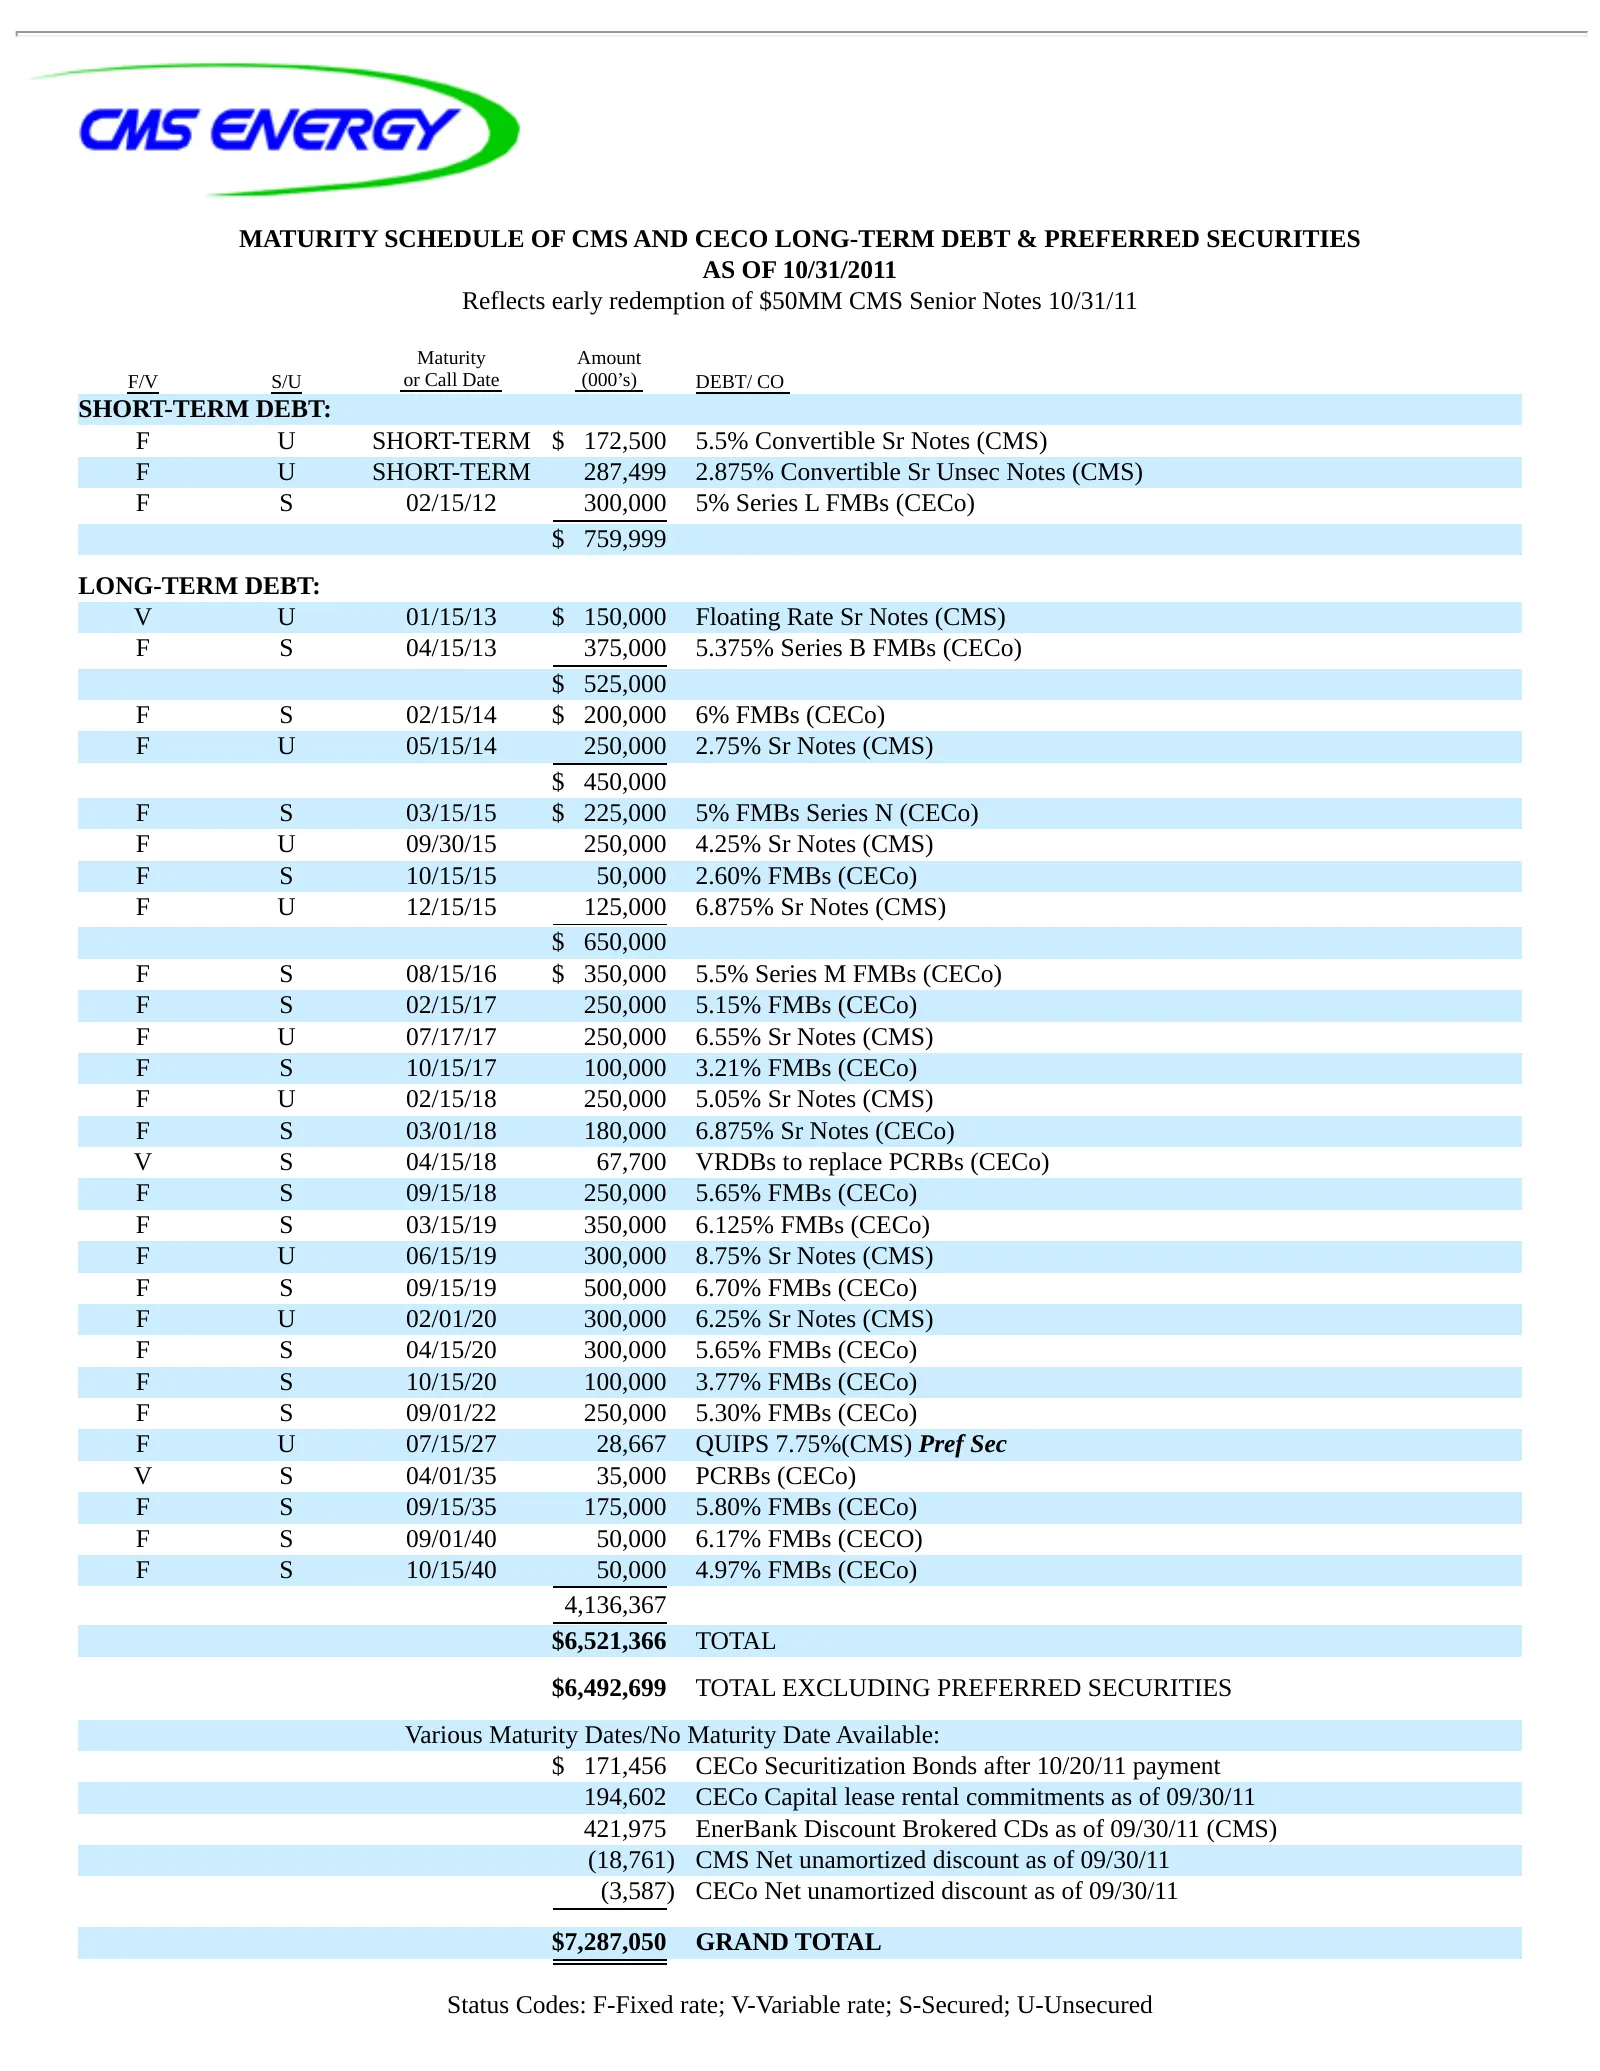
Slide 35: Maturity schedule of CMS and CECo debt
MATURITY SCHEDULE OF CMS AND CECO LONG-TERM DEBT & PREFERRED SECURITIES AS OF 10/31/2011 Reflects early redemption of $50MM CMS Senior Notes 10/31/11 Maturity Amount F/V S/U or Call Date (000’s) DEBT/ CO SHORT-TERM DEBT: F U SHORT-TERM $ 172,500 5.5% Convertible Sr Notes (CMS) F U SHORT-TERM 287,499

Slide 36: 34
34
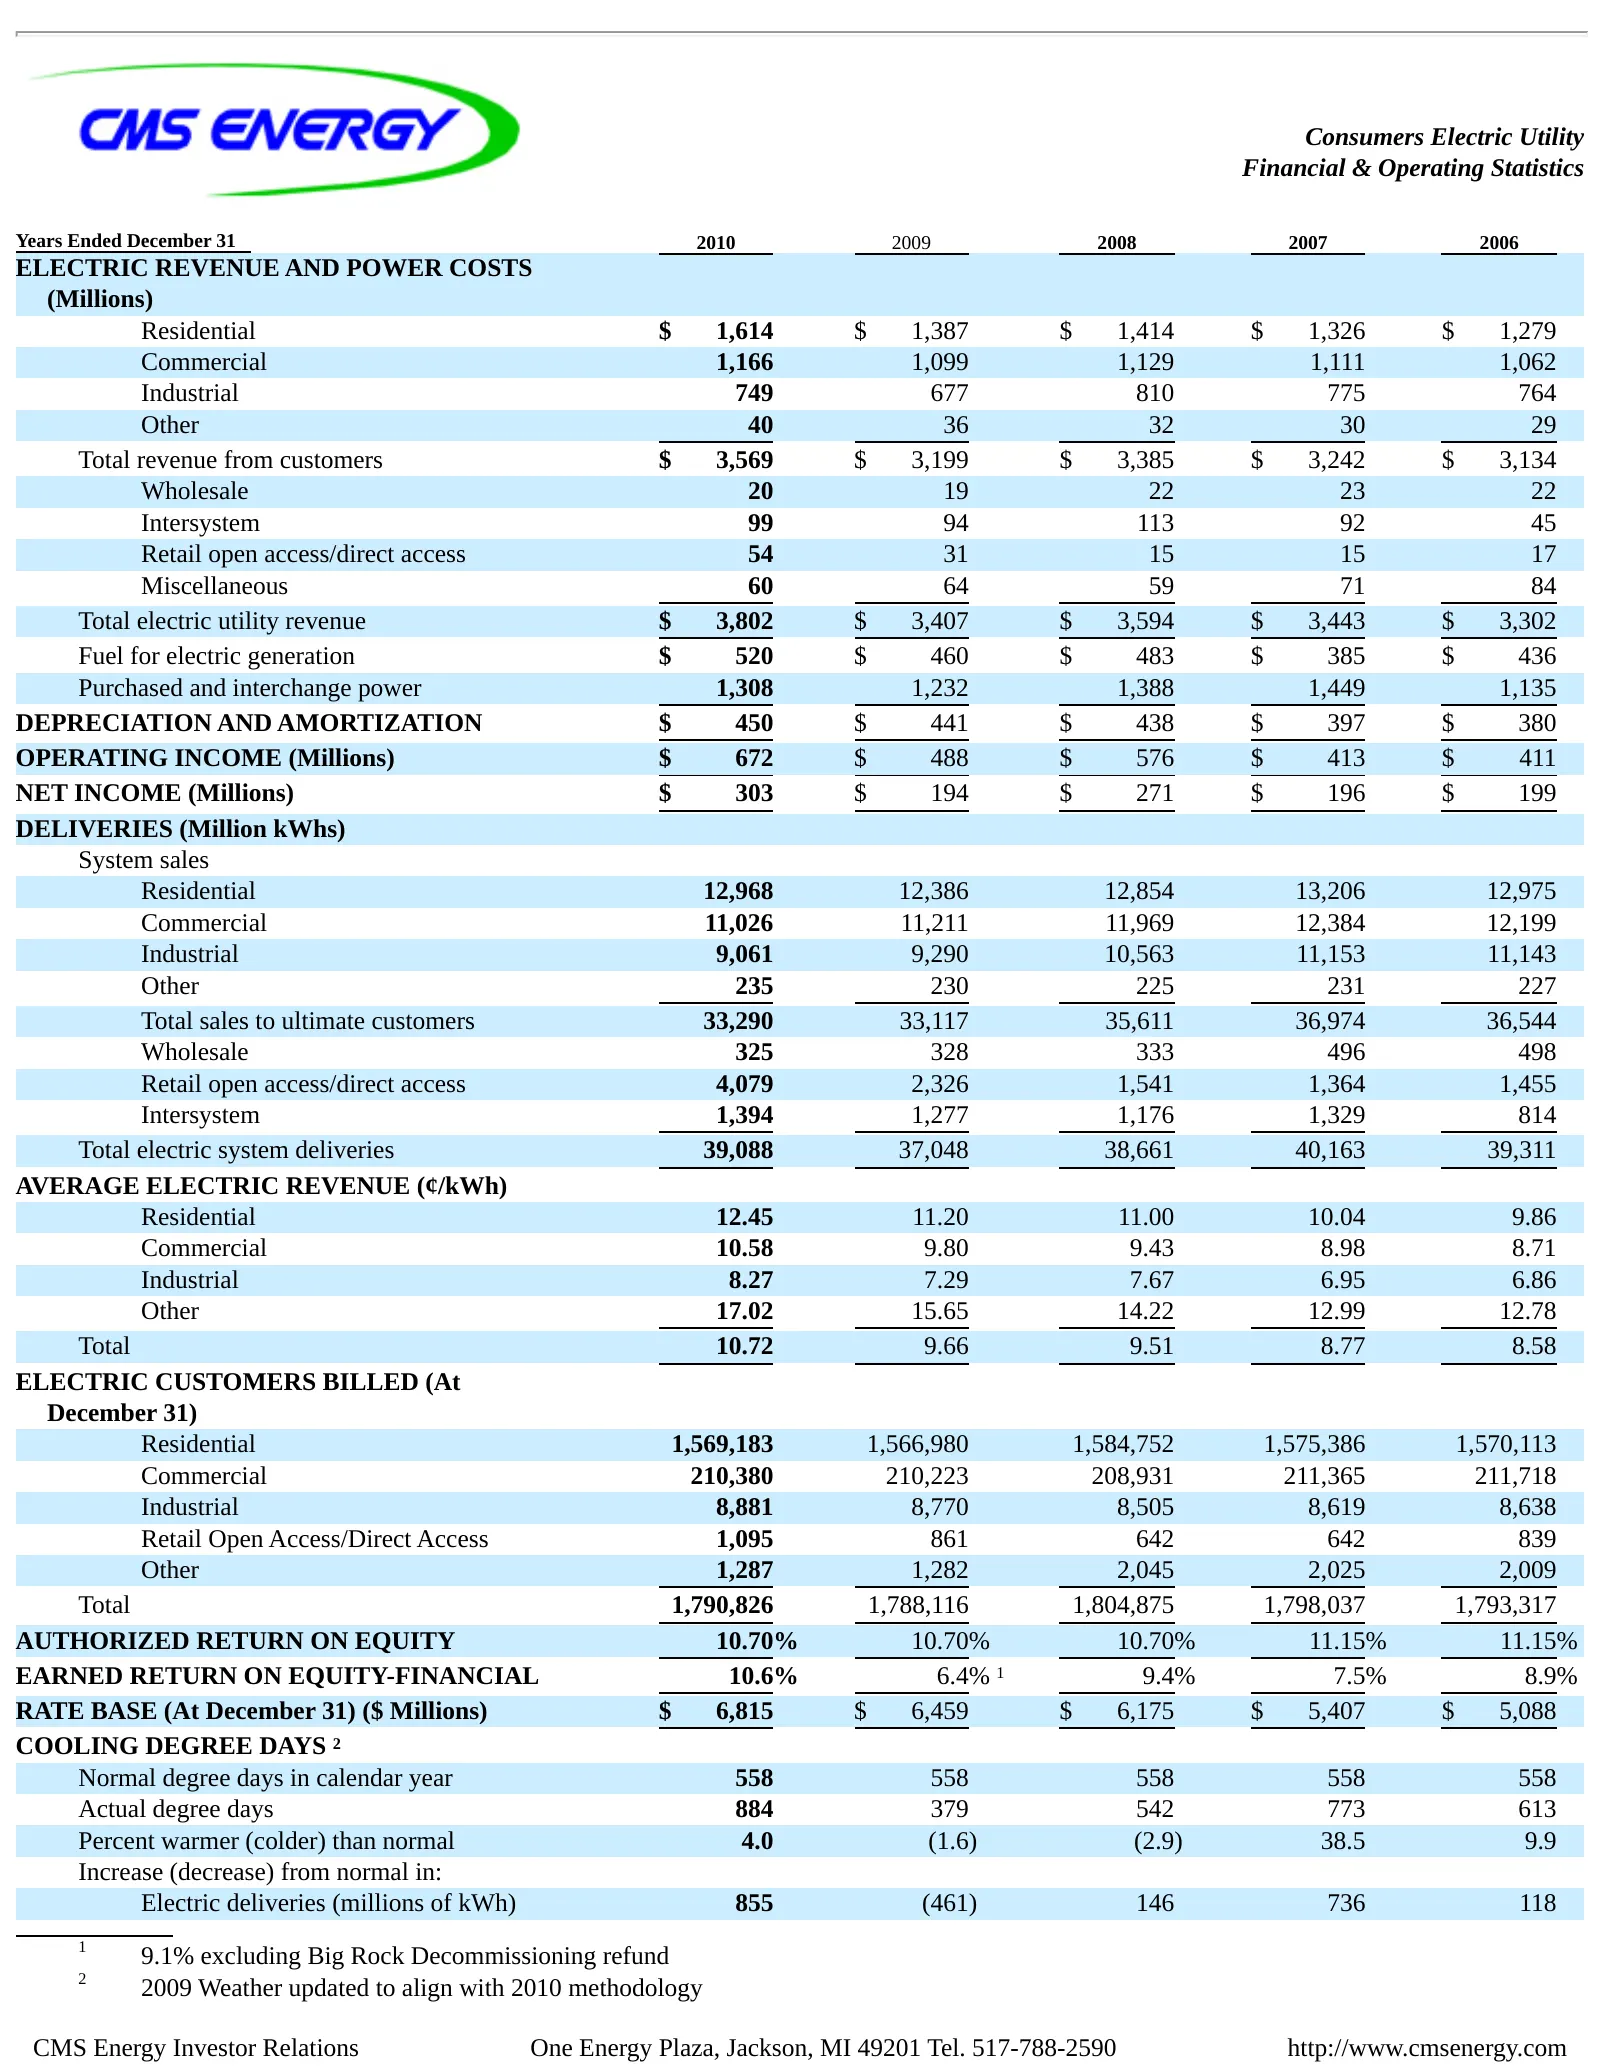
Slide 37: Consumers Electric Utility Financial & Operating Statistics
Consumers Electric Utility Financial & Operating Statistics Years Ended December 31 2010 2009 2008 2007 2006 ELECTRIC REVENUE AND POWER COSTS (Millions) Residential $ 1,614 $ 1,387 $ 1,414 $ 1,326 $ 1,279 Commercial 1,166 1,099 1,129 1,111 1,062 Industrial 749 677 810 775 764 Other 40 36 32 30 29 To

Slide 38: 35
35
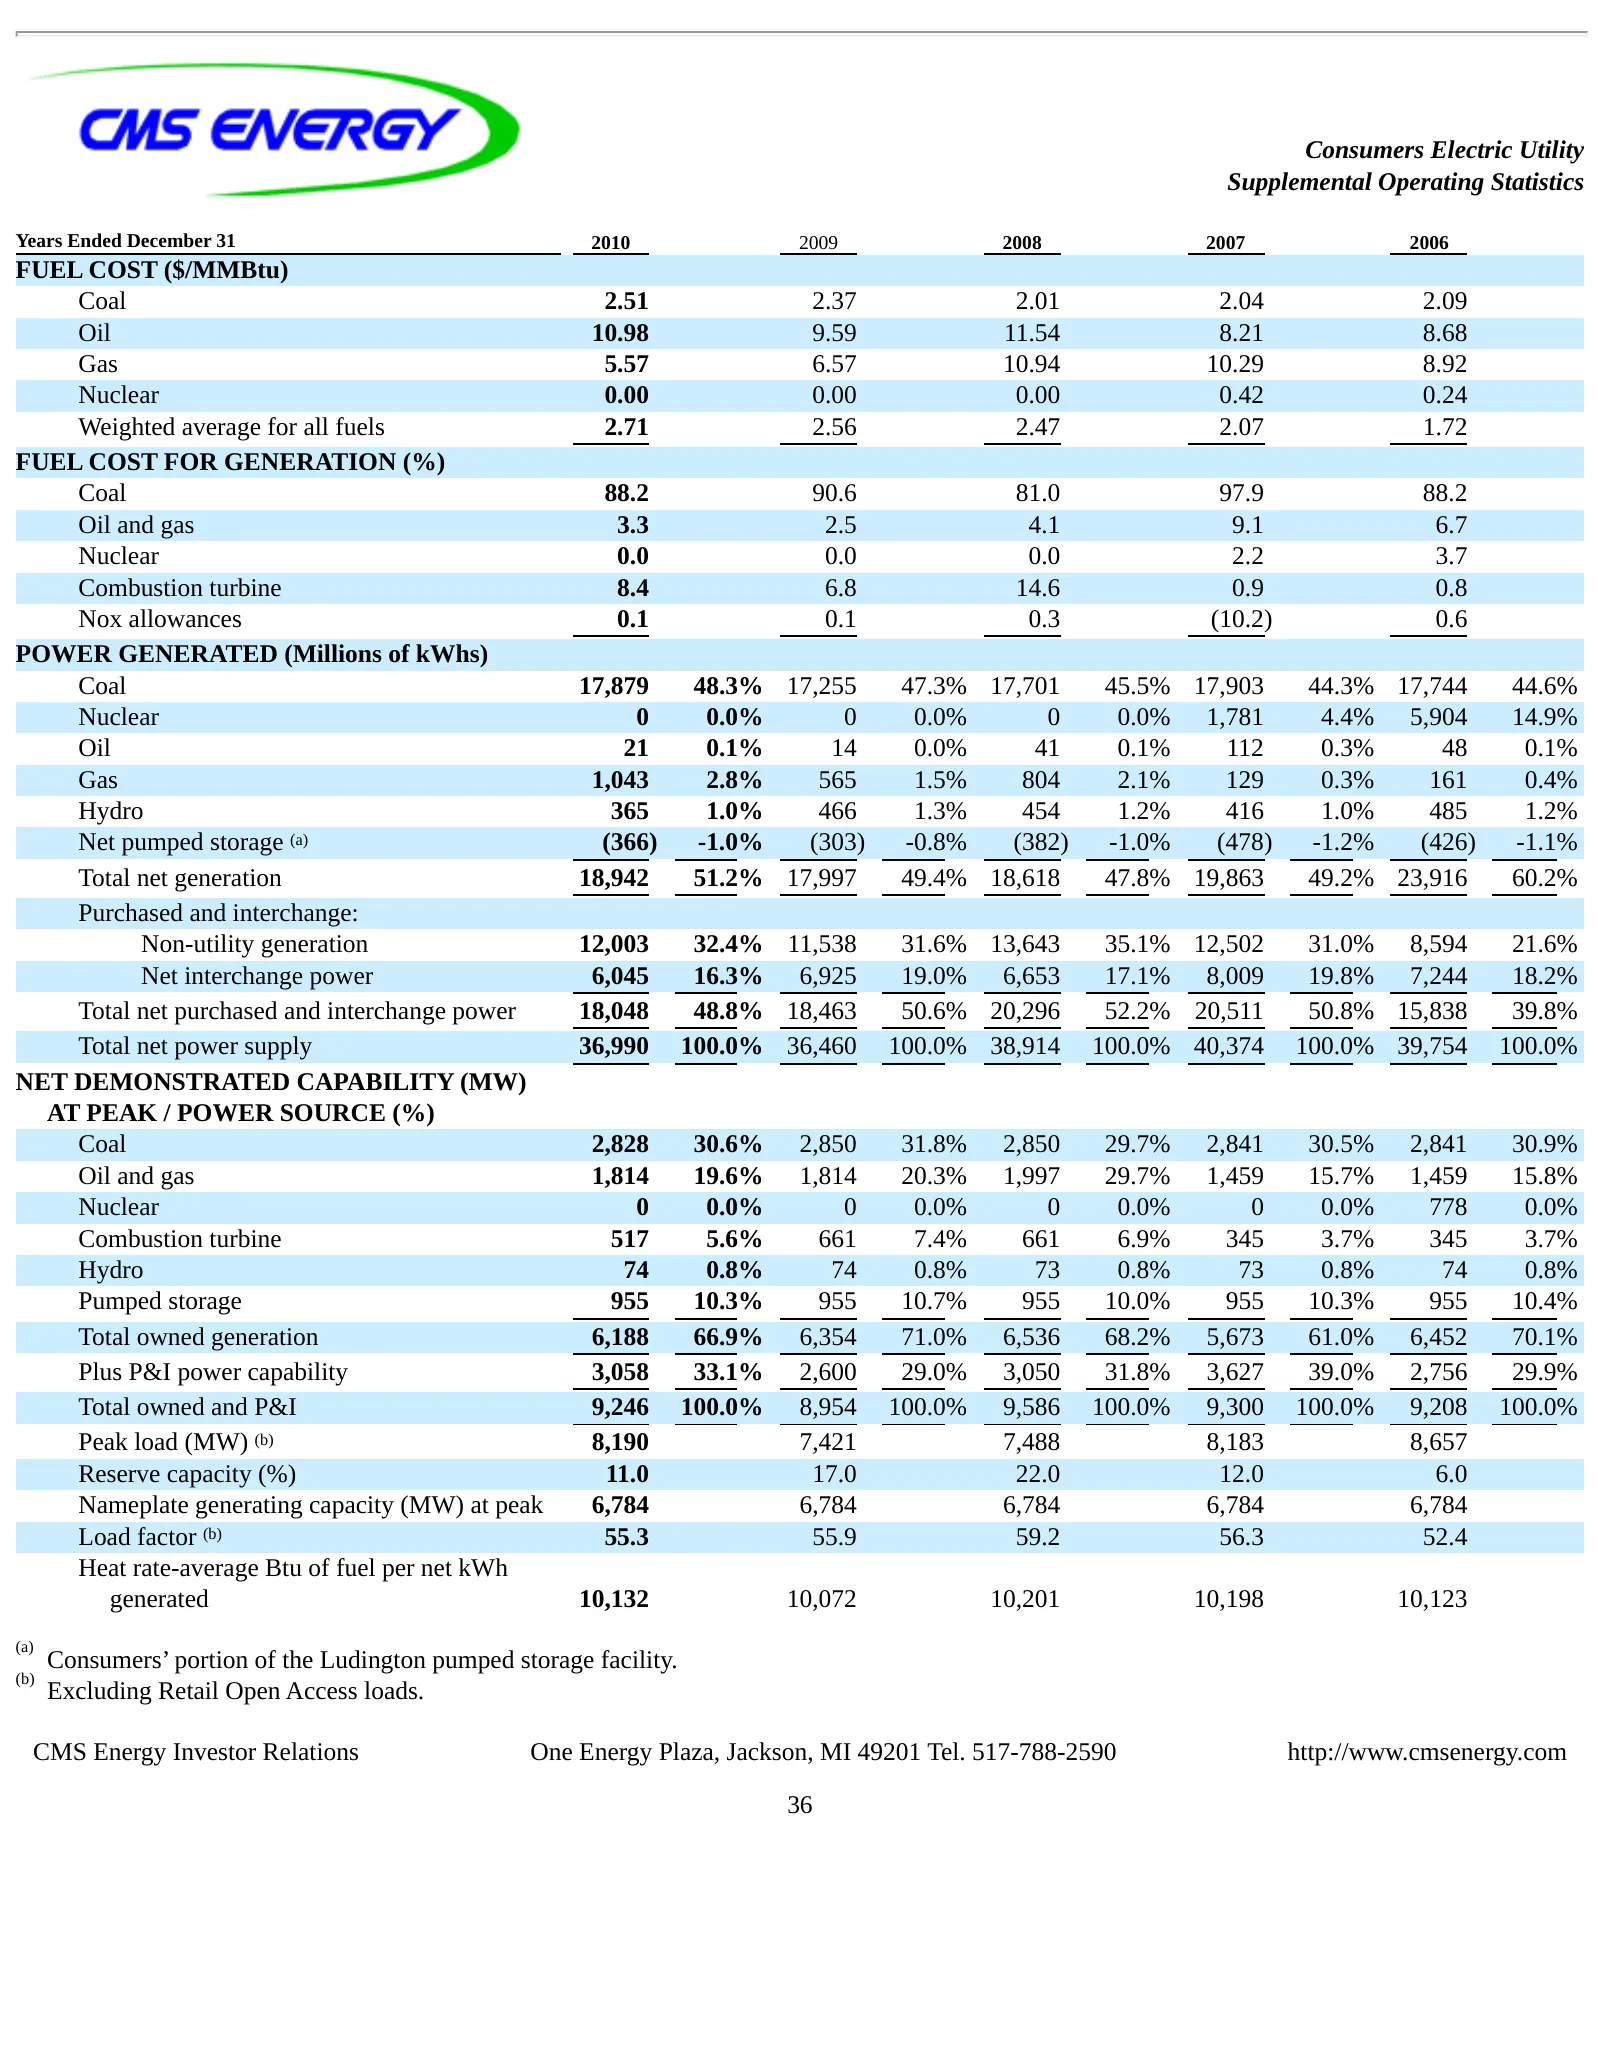
Slide 39: Consumers Electric Utility Supplemental Operating Statistics
Consumers Electric Utility Supplemental Operating Statistics Years Ended December 31 2010 2009 2008 2007 2006 FUEL COST ($/MMBtu) Coal 2.51 2.37 2.01 2.04 2.09 Oil 10.98 9.59 11.54 8.21 8.68 Gas 5.57 6.57 10.94 10.29 8.92 Nuclear 0.00 0.00 0.00 0.42 0.24 Weighted average for all fuels 2.71 2.56 2.47
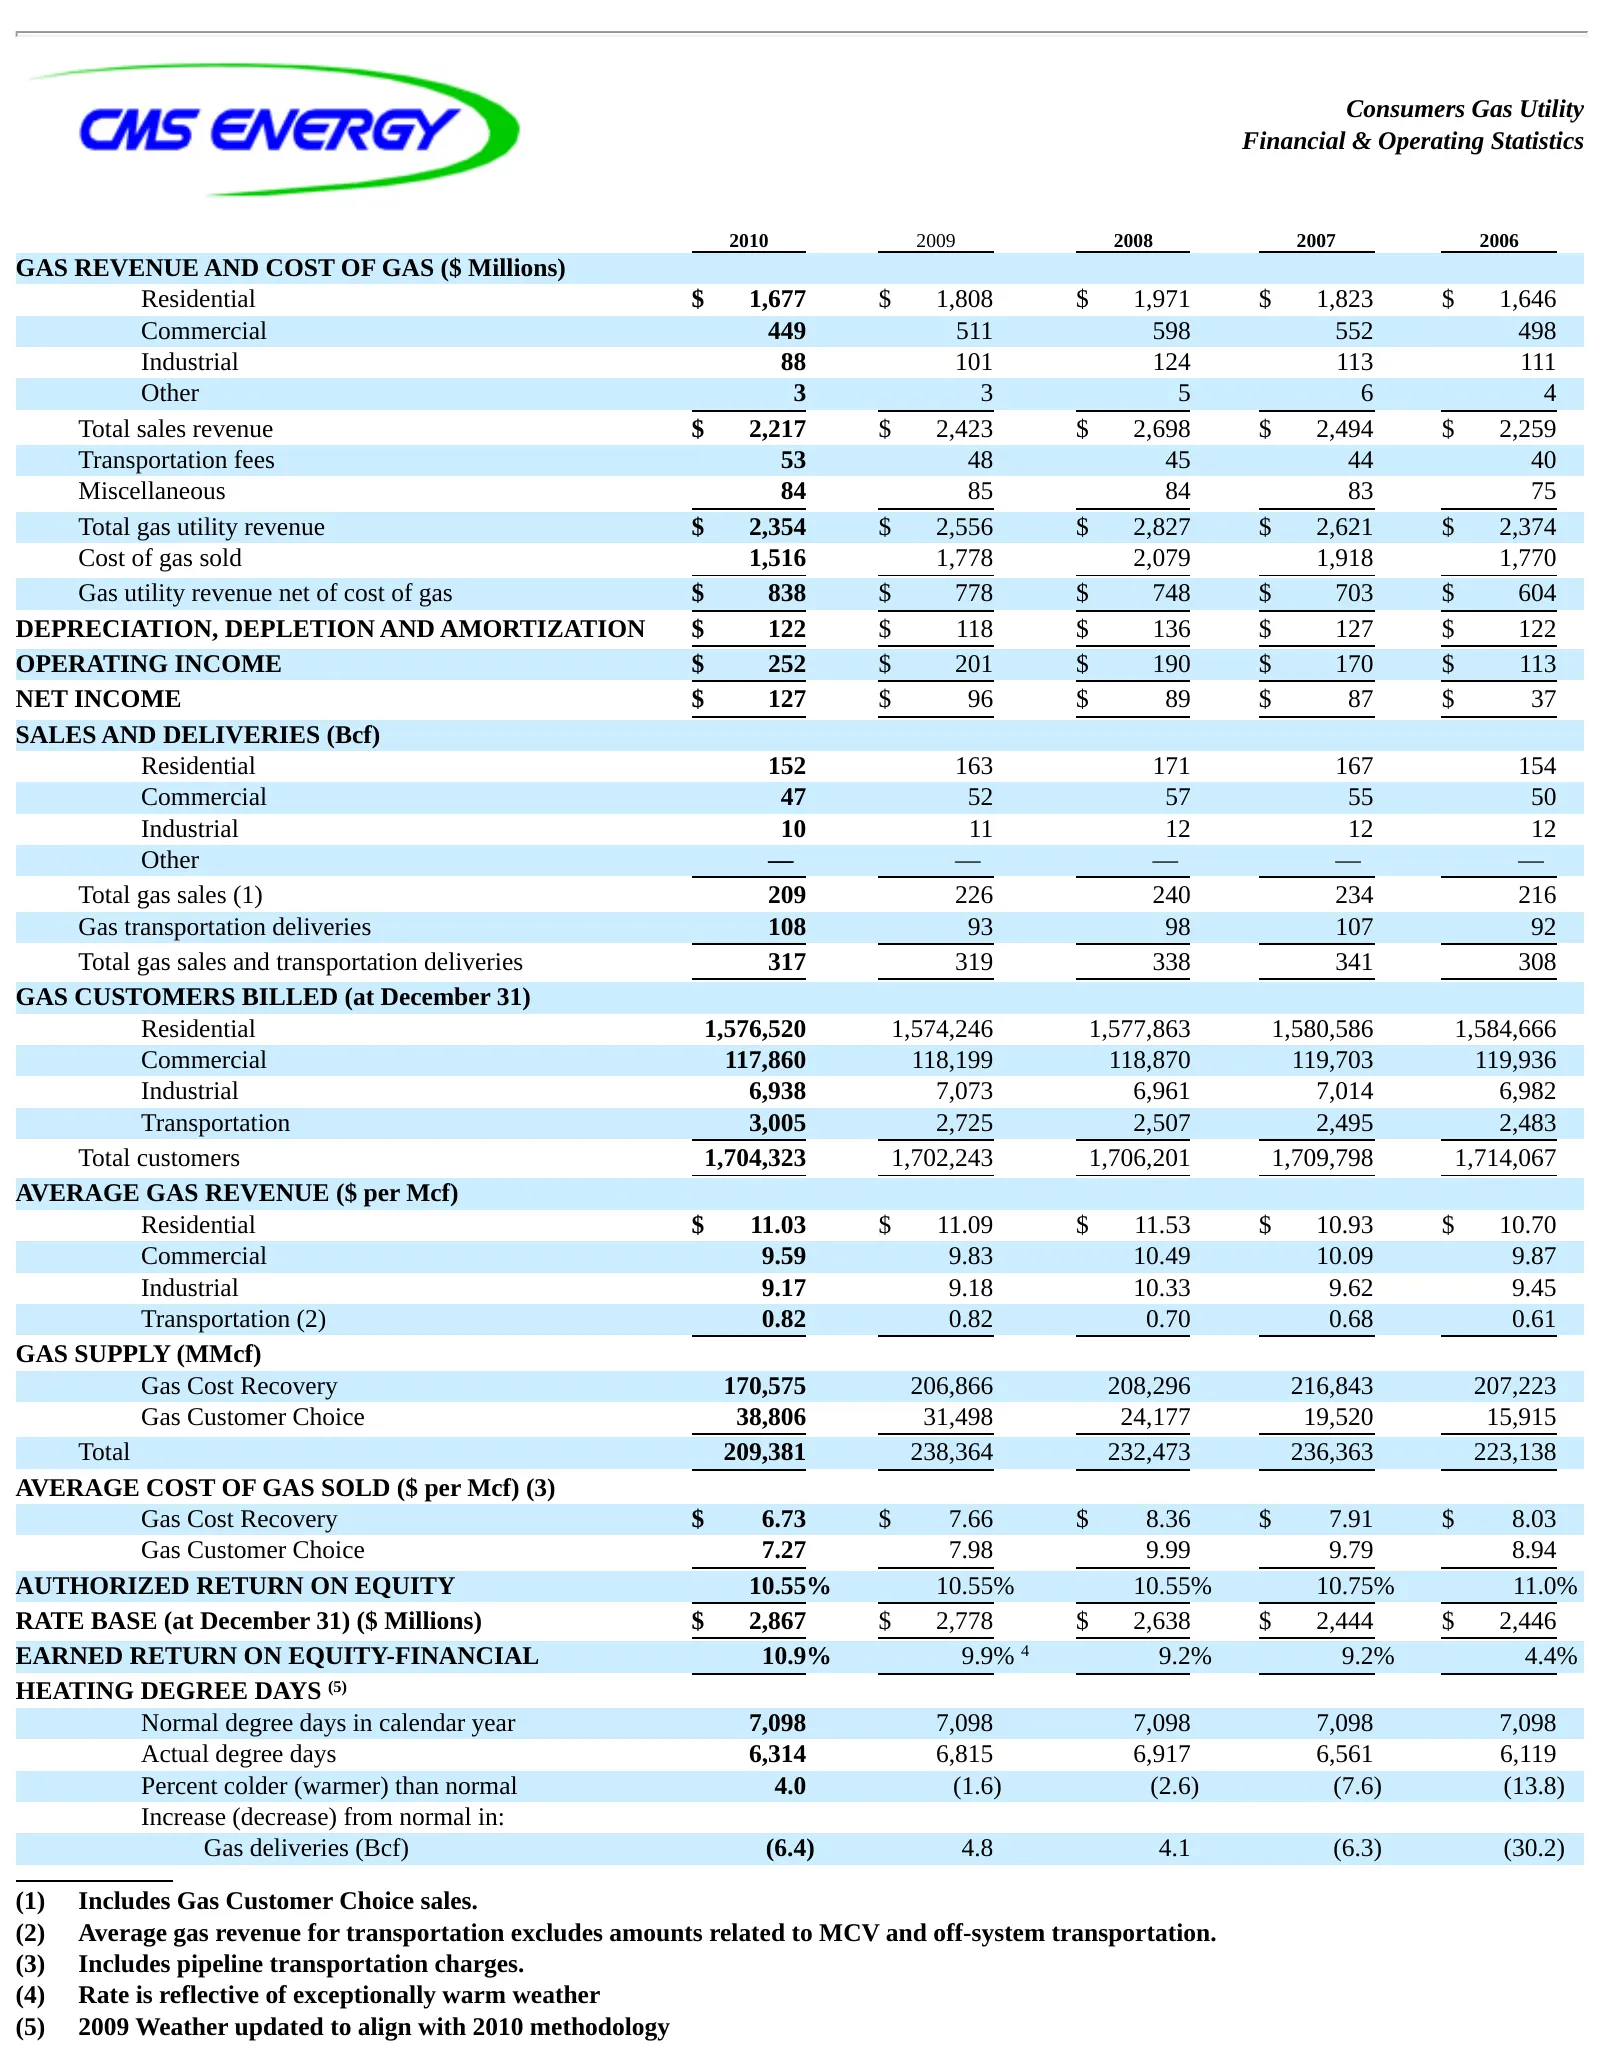
Slide 40: Consumers Gas Utility Financial & Operating Statistics
Consumers Gas Utility Financial & Operating Statistics 2010 2009 2008 2007 2006 GAS REVENUE AND COST OF GAS ($ Millions) Residential $ 1,677 $ 1,808 $ 1,971 $ 1,823 $ 1,646 Commercial 449 511 598 552 498 Industrial 88 101 124 113 111 Other 3 3 5 6 4 Total sales revenue $ 2,217 $ 2,423 $ 2,698 $ 2,49

Slide 41: CMS Energy Investor Relations
CMS Energy Investor Relations One Energy Plaza, Jackson, MI 49201 Tel. 517-788-2590 http://www.cmsenergy.com 37
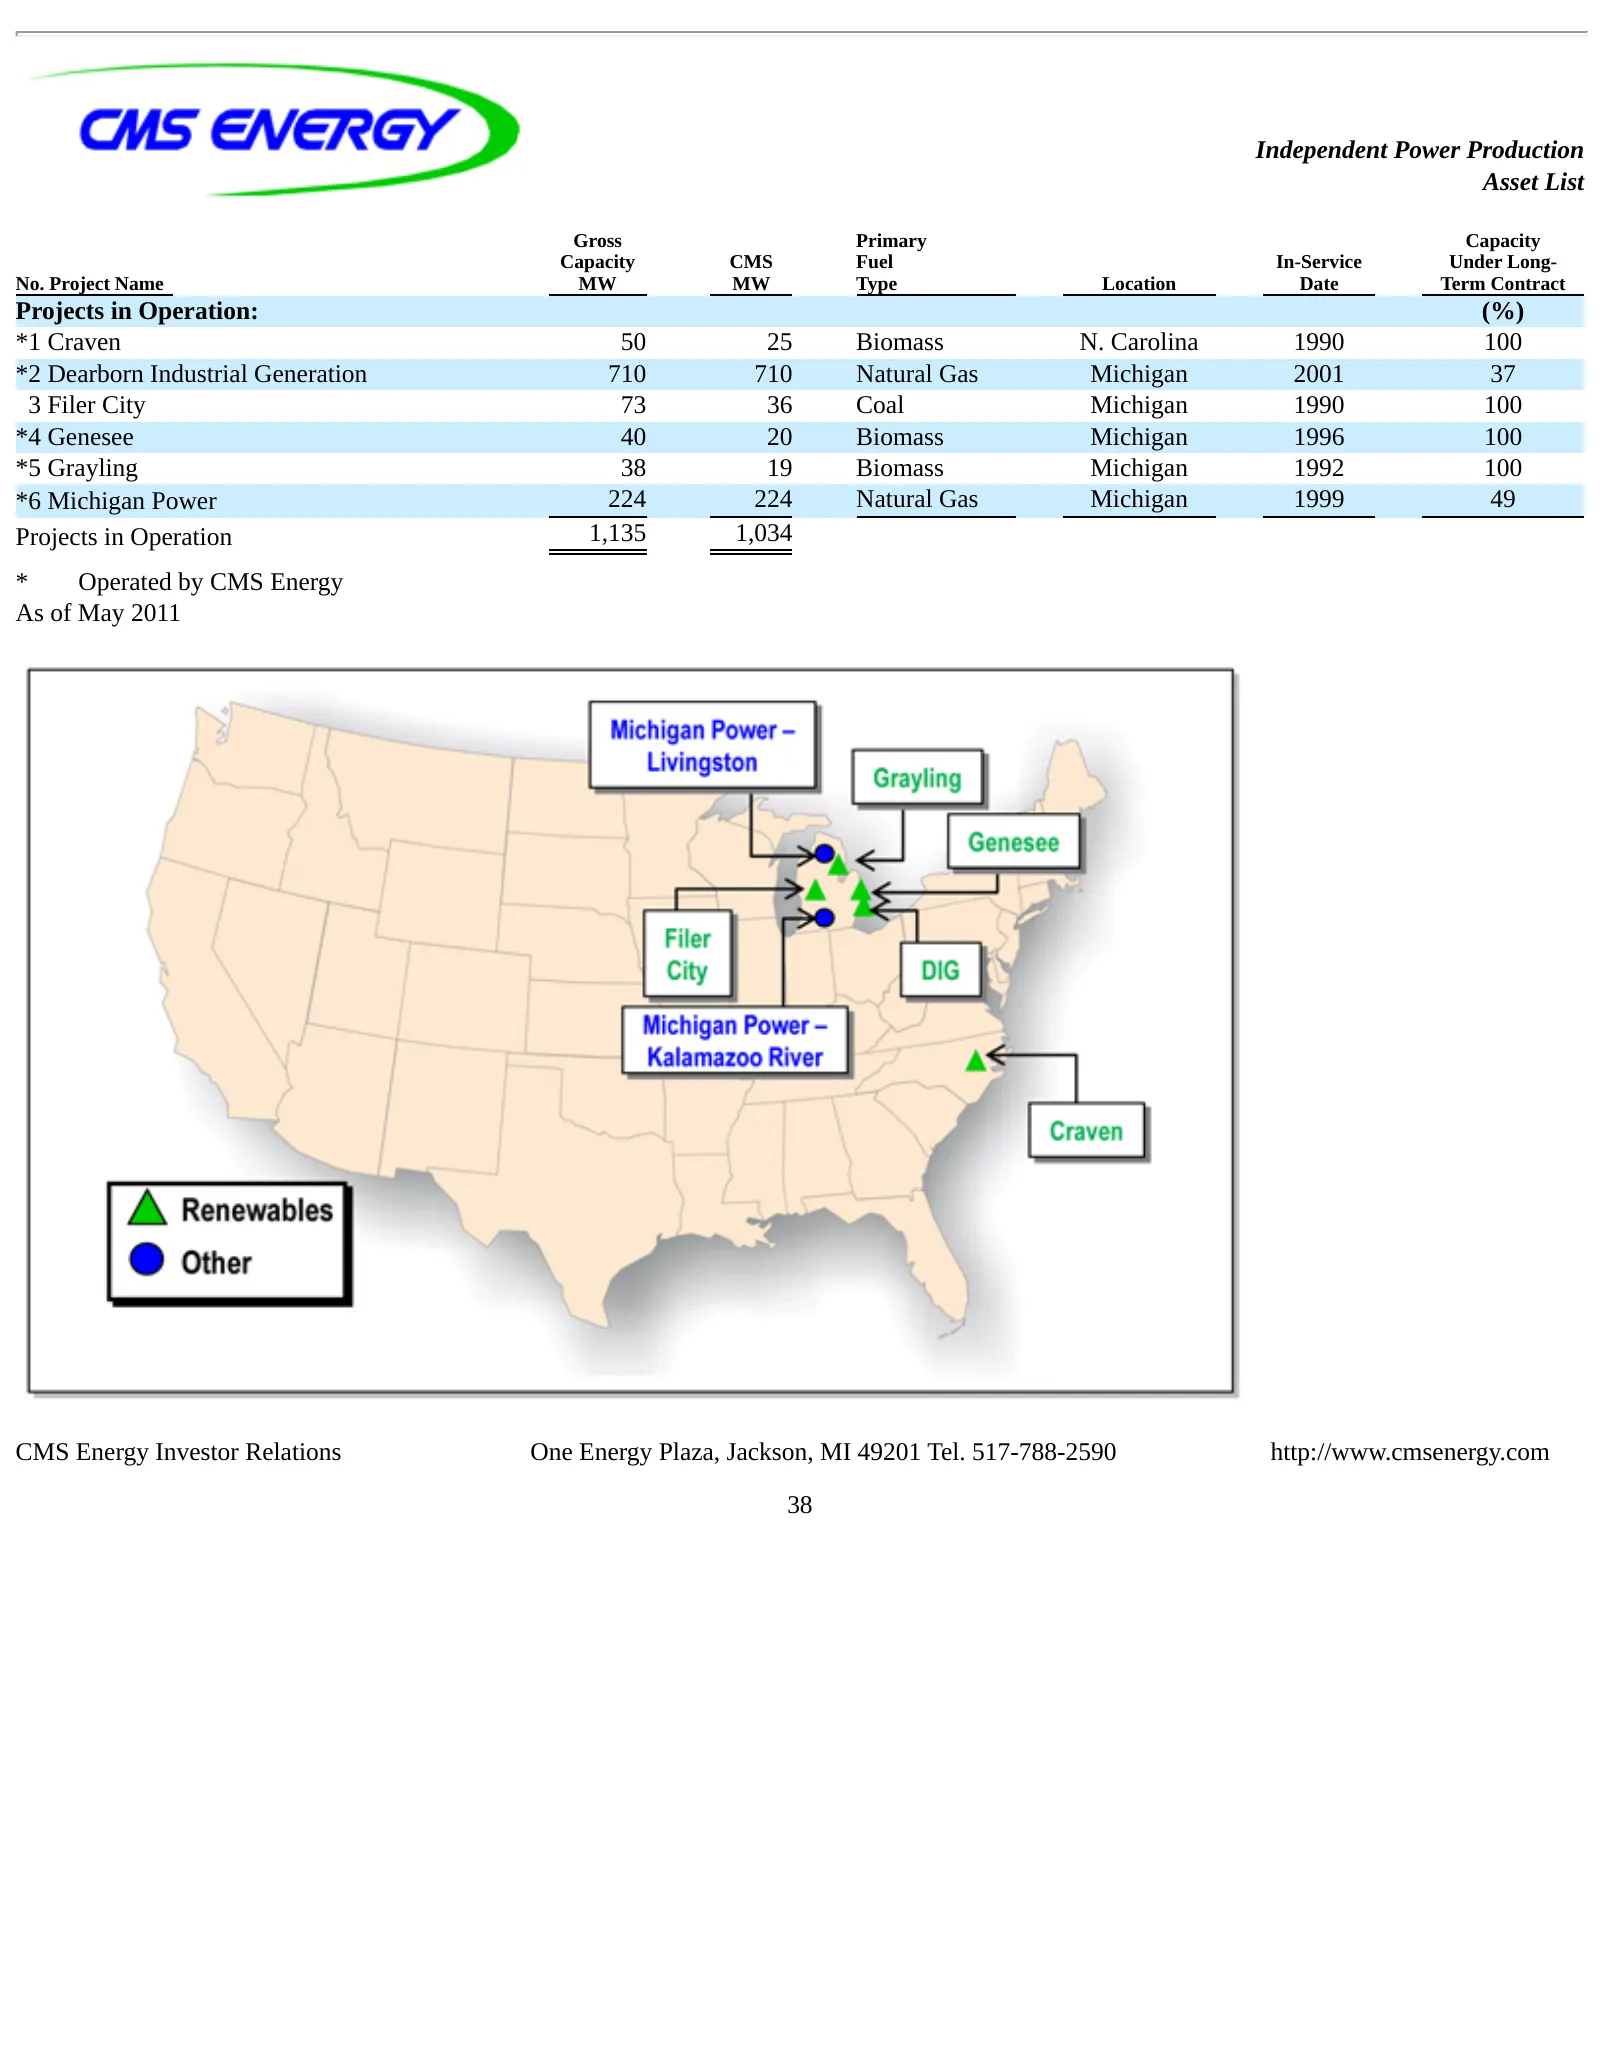
Slide 42: Independent Power Production Asset List
Independent Power Production Asset List Gross Primary Capacity Capacity CMS Fuel In-Service Under Long- No. Project Name MW MW Type Location Date Term Contract Projects in Operation: (%) *1 Craven 50 25 Biomass N. Carolina 1990 100 *2 Dearborn Industrial Generation 710 710 Natural Gas Michigan 2001
Slide 43: GAAP Reconciliation
GAAP Reconciliation
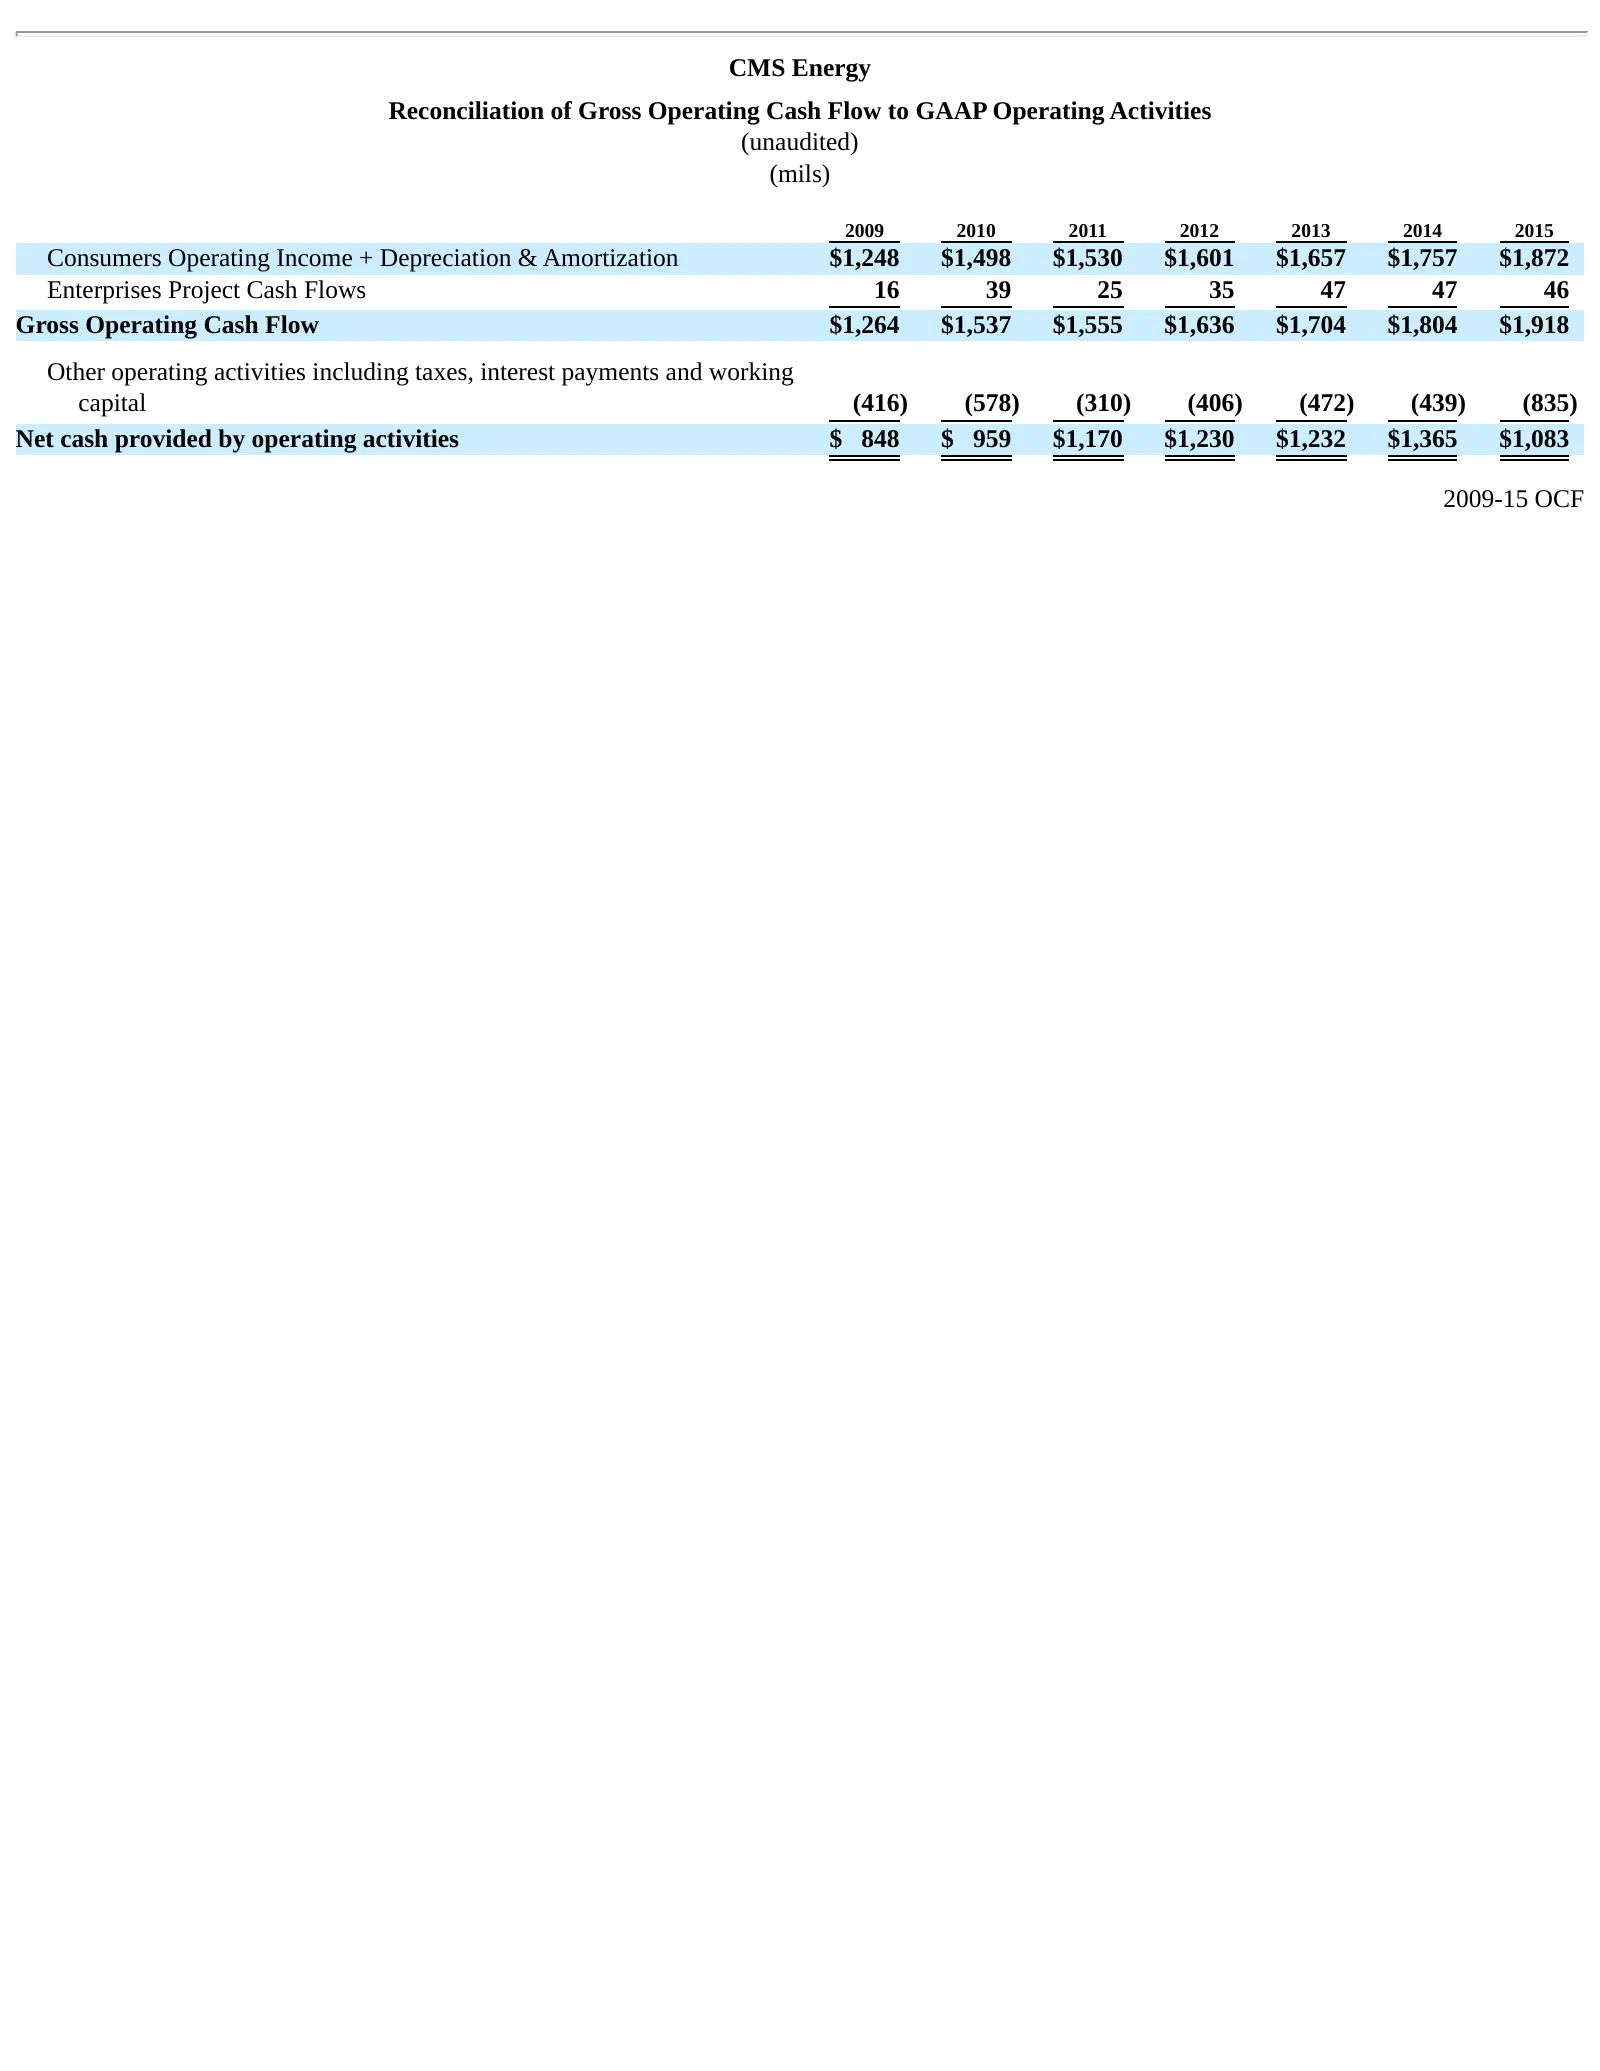
Slide 44: Reconciliation of Gross Operating Cash Flow to GAAP Operating Activities
CMS Energy Reconciliation of Gross Operating Cash Flow to GAAP Operating Activities (unaudited) (mils) 2009 2010 2011 2012 2013 2014 2015 Consumers Operating Income + Depreciation & Amortization $1,248 $1,498 $1,530 $1,601 $1,657 $1,757 $1,872 Enterprises Project Cash Flows 16 39 25 35 47 47 46 Gros
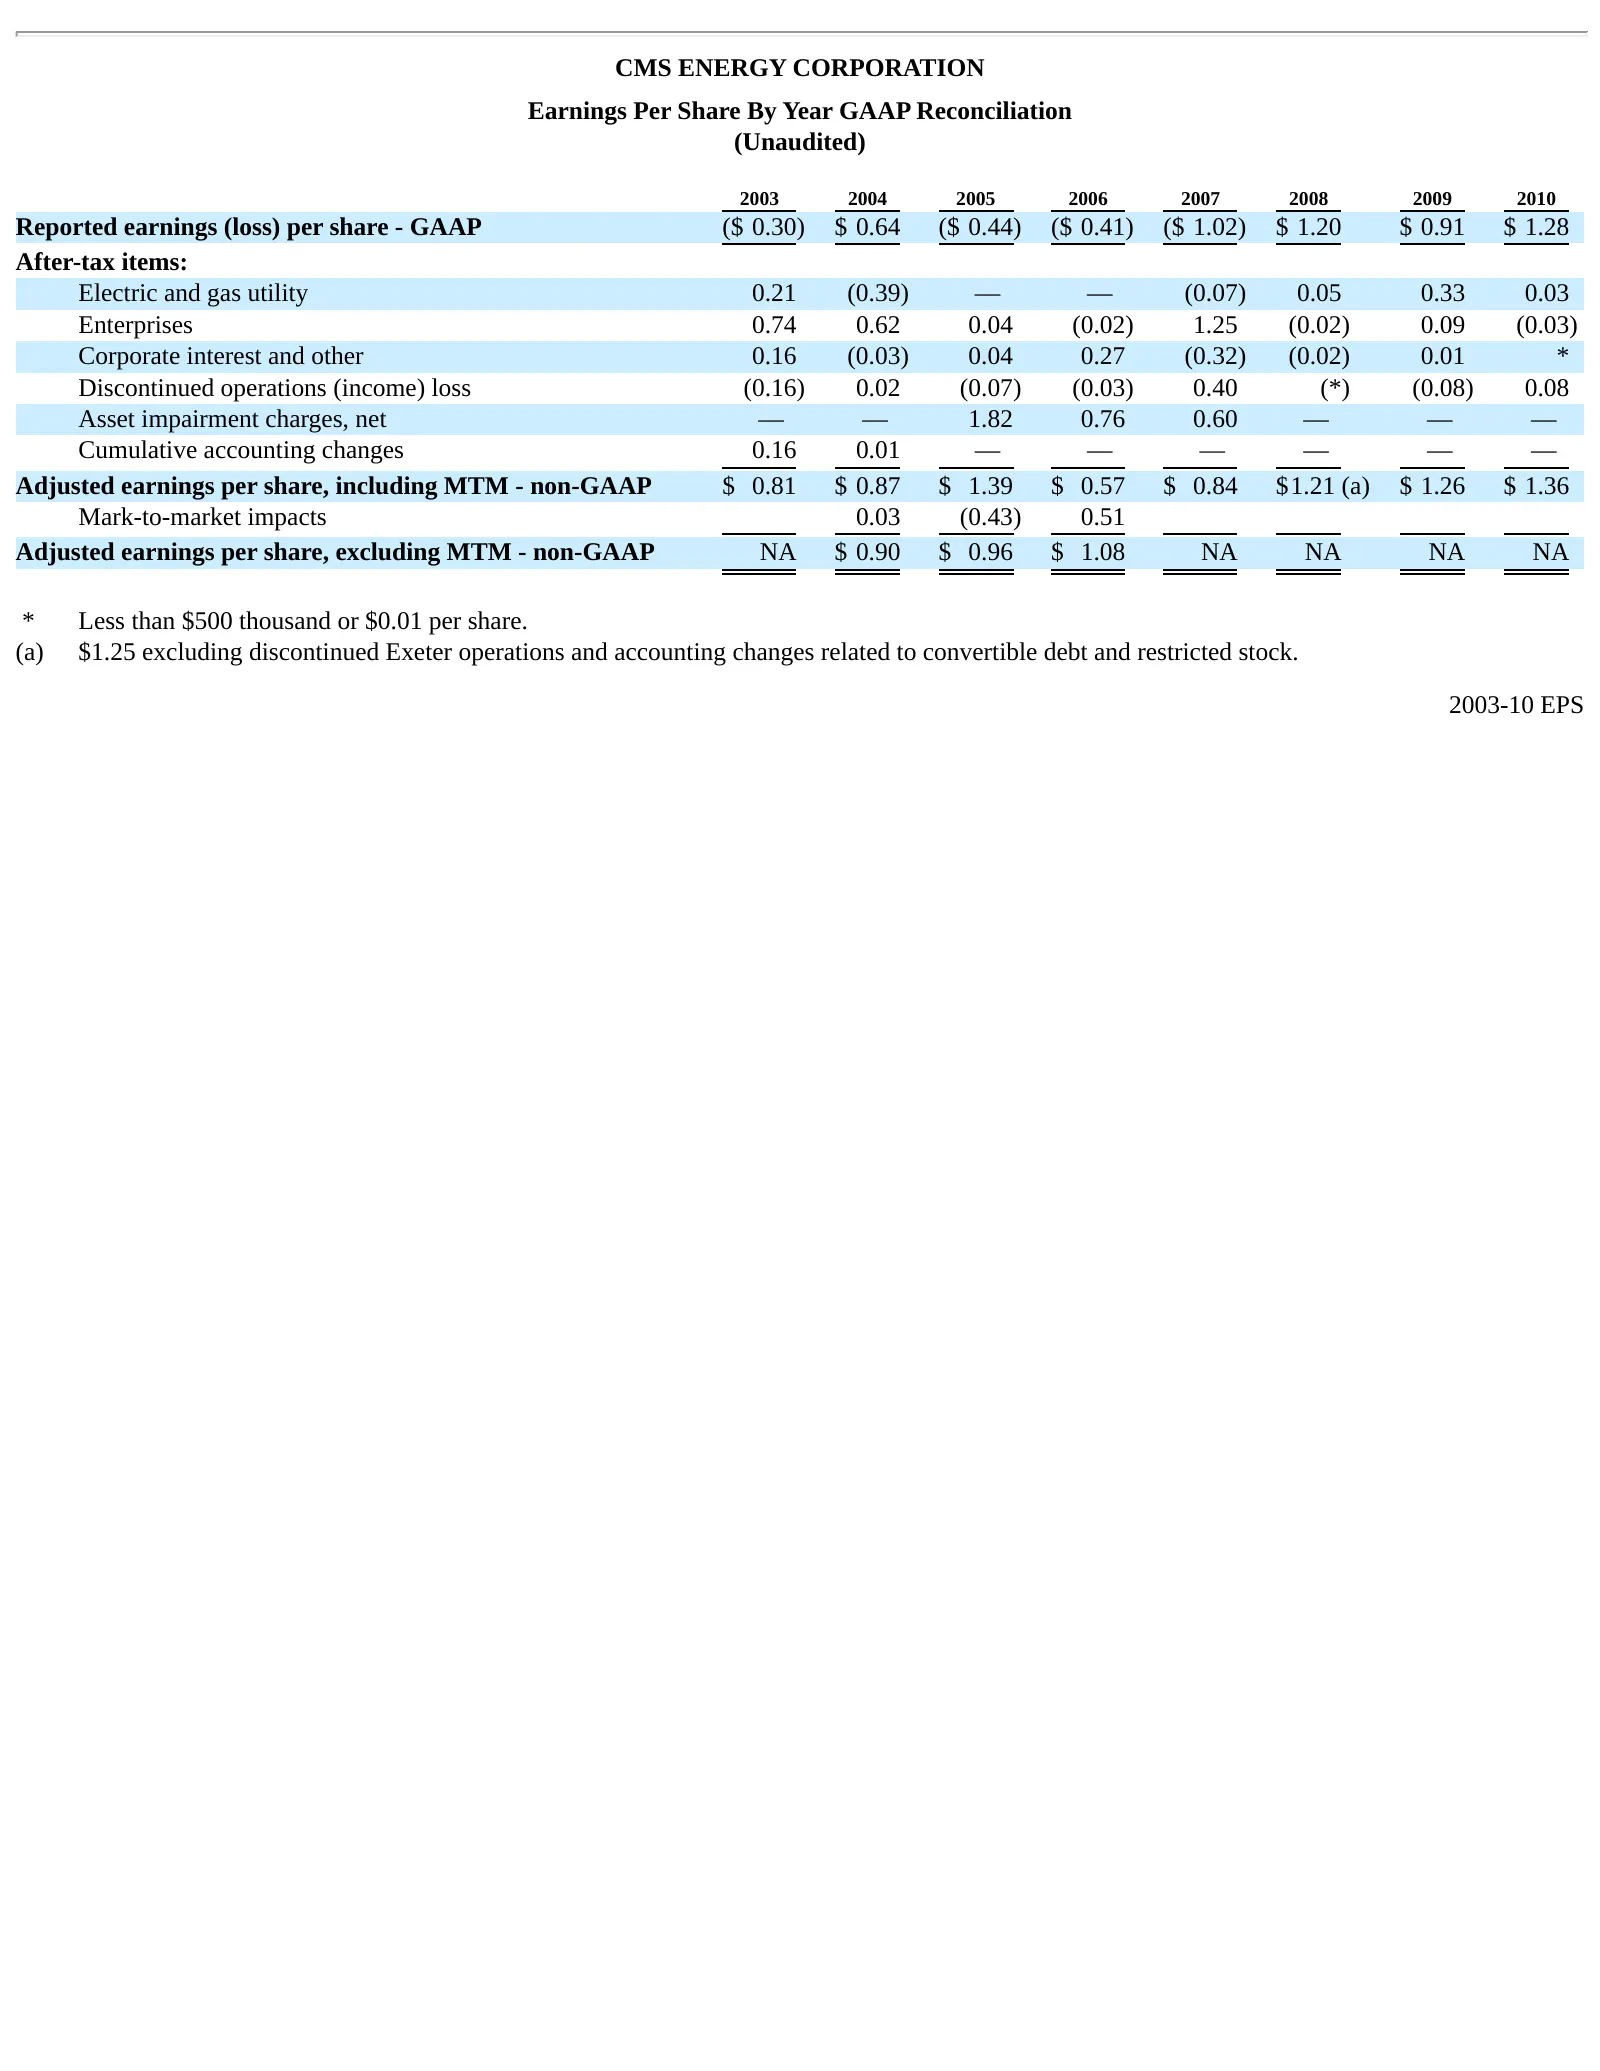
Slide 45: Earnings Per Share By Year GAAP Reconciliation
CMS ENERGY CORPORATION Earnings Per Share By Year GAAP Reconciliation (Unaudited) 2003 2004 2005 2006 2007 2008 2009 2010 Reported earnings (loss) per share - GAAP ($ 0.30) $ 0.64 ($ 0.44) ($ 0.41) ($ 1.02) $ 1.20 $ 0.91 $ 1.28 After-tax items: Electric and gas utility 0.21 (0.39) — — (0.07) 0.05 0.
Source: SEC EDGAR · 8-K filed Dec 12, 2011
More decks from Consumers Energy Company
 FY2024 Earnings Presentation33 slides · Feb 6, 2025
 Technical Presentation (August 2024)8 slides · August 2024
 Technical Presentation (August 2024)8 slides · August 2024
 Corporate Update (August 2024)8 slides · August 2024
 Corporate Update (August 2024)8 slides · August 2024
 Corporate Update (September 2023)22 slides · Sep 28, 2023