Santander Holdings USA Inc · NYSE:SNUS/PH
Santander Holdings USA — Debt Investor Presentation (November 2021)
37 slides from Santander Holdings USA's debt investor presentation, Nov 2, 2021
Slide 1: Fixed Income Investor Presentation Third Quarter 2021
SANTANDER HOLDINGS USA, INC. Fixed Income Investor Presentation Third Quarter 2021 November 2, 2021
Slide 2: Disclaimer
DISCLAIMER This presentation of Santander Holdings USA, Inc. (“SHUSA”) contains “forward-looking statements” within the meaning of the Private Securities Litigation Reform Act of 1995 regarding the financial condition, results of operations, business plans and future performance of SHUSA. Words such
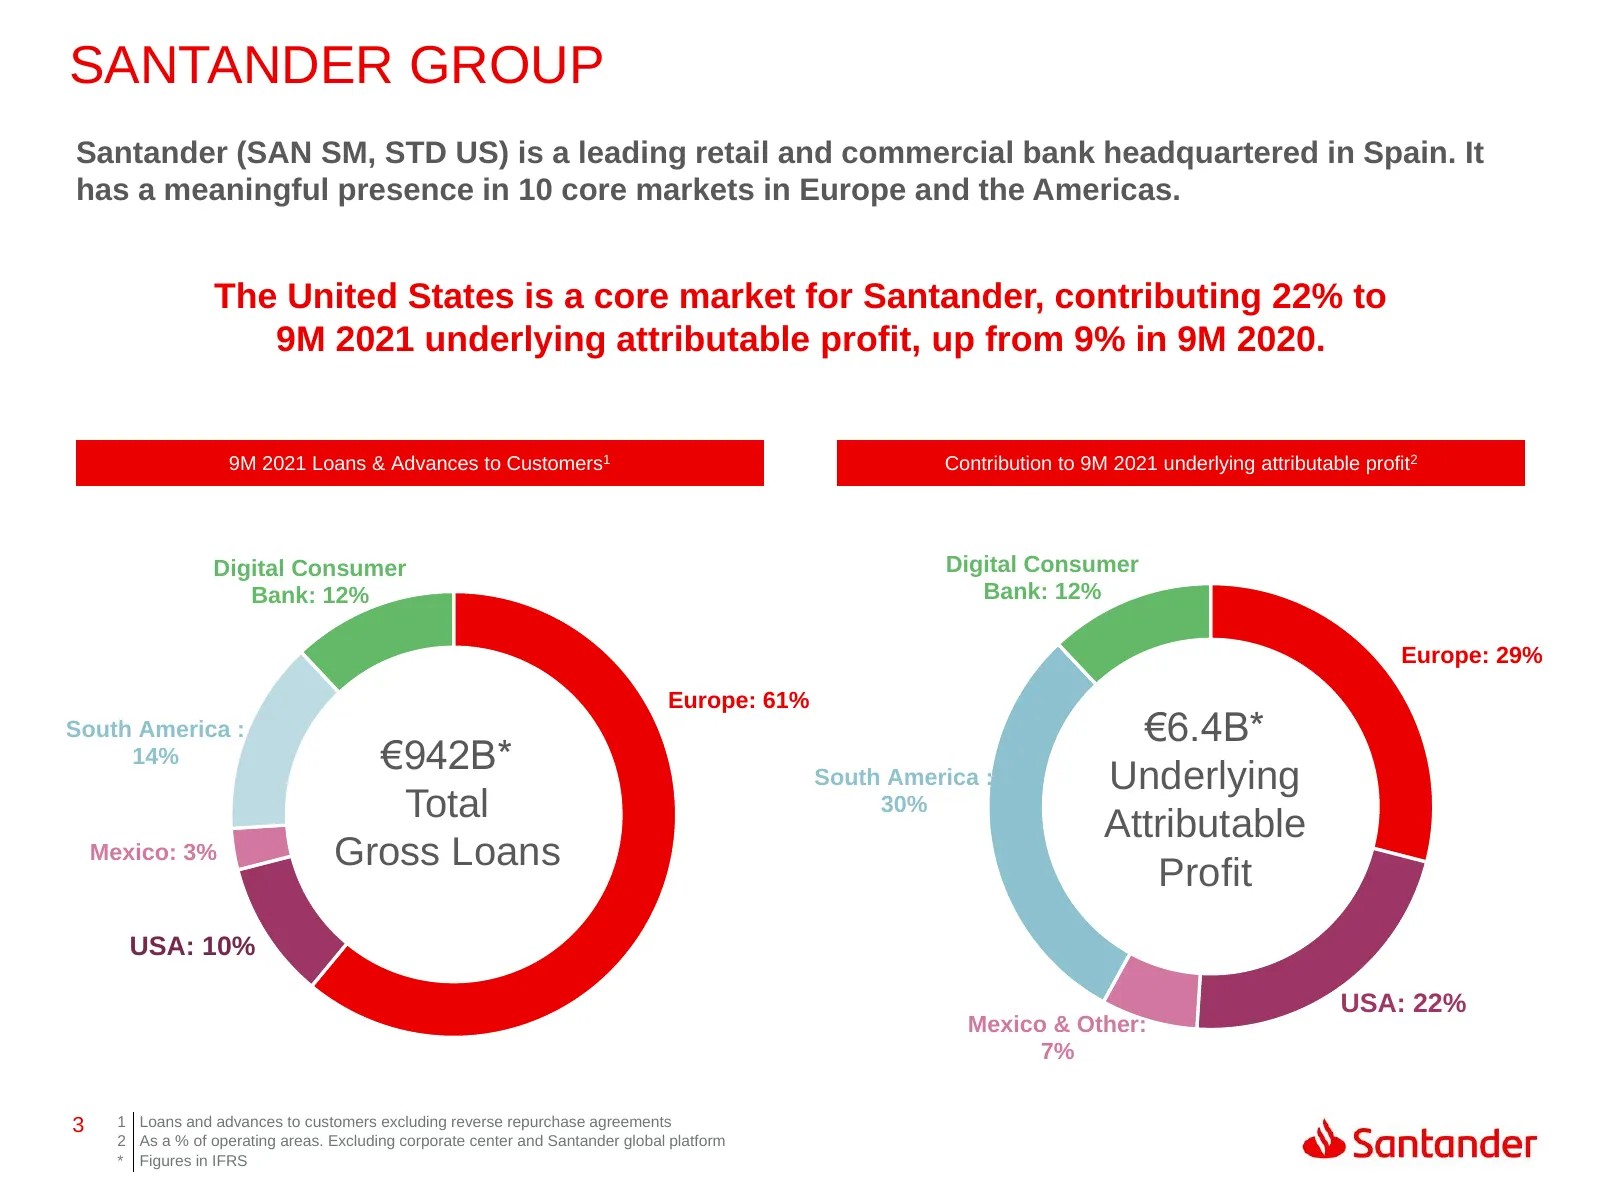
Slide 3: Santander Group
SANTANDER GROUP Santander (SAN SM, STD US) is a leading retail and commercial bank headquartered in Spain. It has a meaningful presence in 10 core markets in Europe and the Americas. The United States is a core market for Santander, contributing 22% to 9M 2021 underlying attributable profit, up from
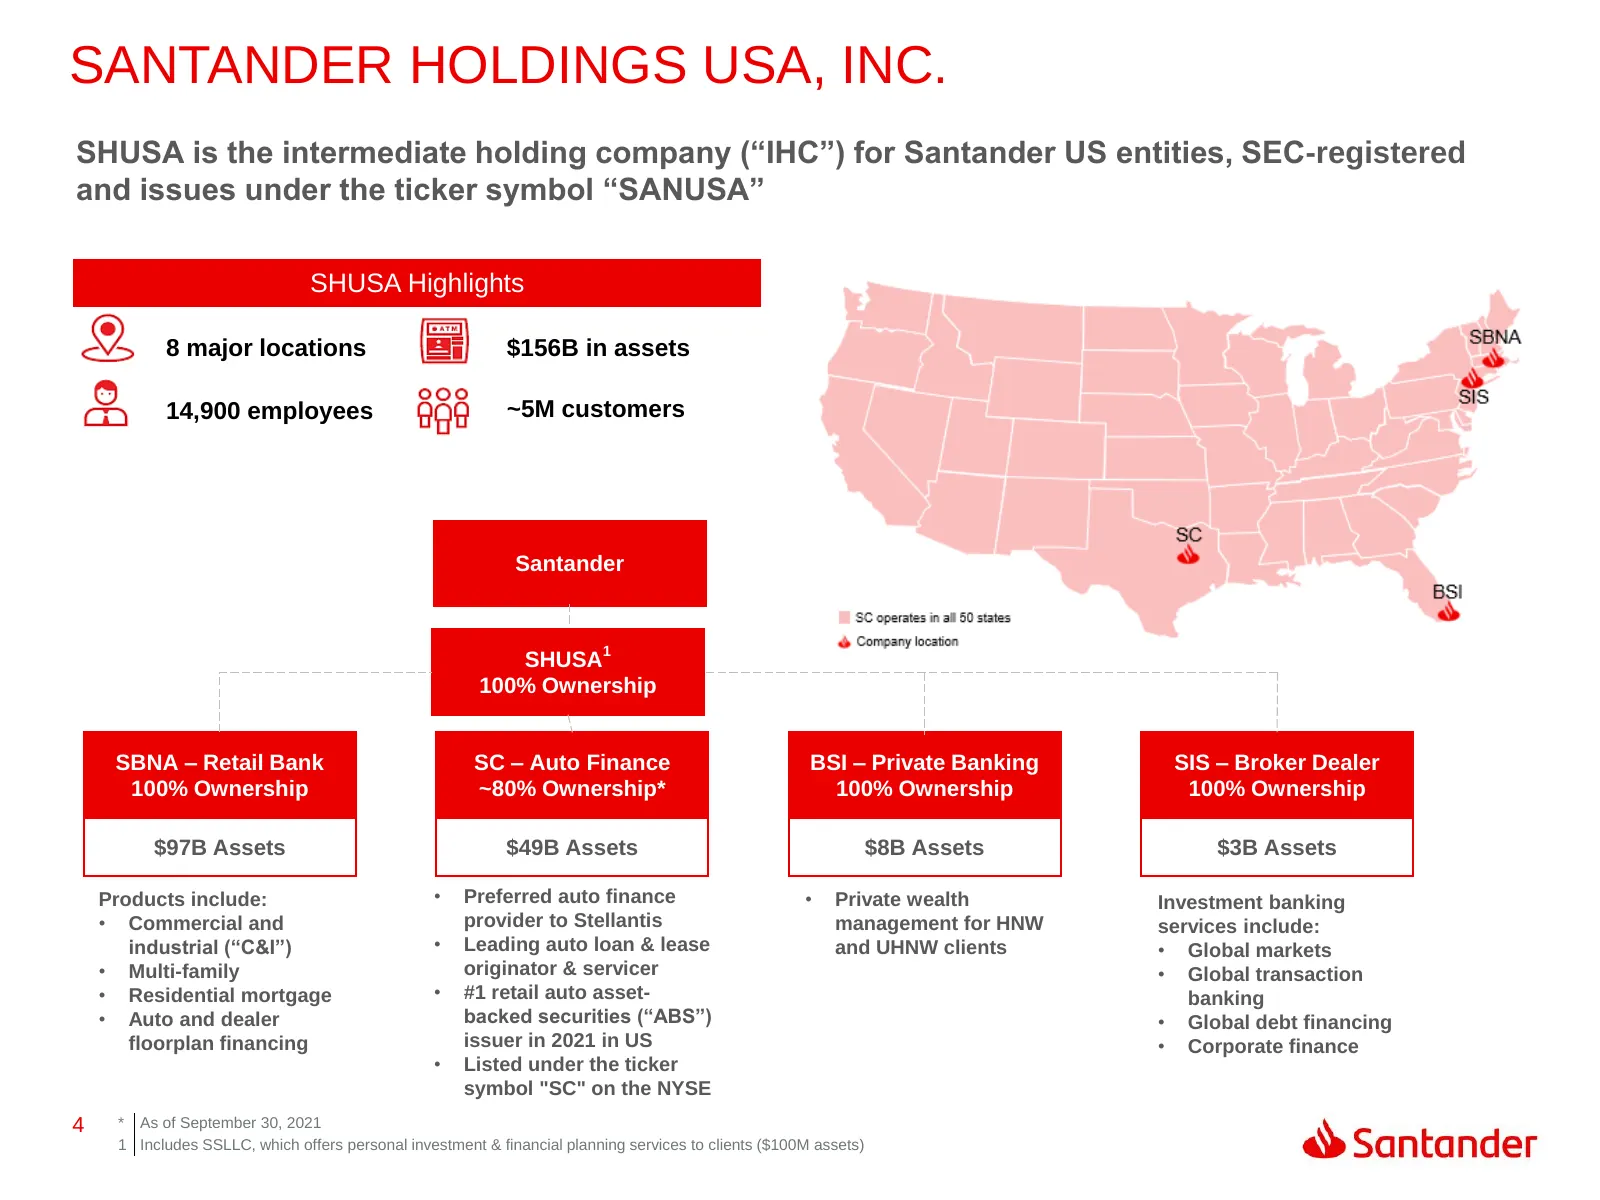
Slide 4: Santander Holdings USA, Inc.
SANTANDER HOLDINGS USA, INC. SHUSA is the intermediate holding company (“IHC”) for Santander US entities, SEC-registered and issues under the ticker symbol “SANUSA” SHUSA Highlights 8 major locations $156B in assets 14,900 employees ~5M customers Santander SHUSA1 100% Ownership SBNA – Retail Bank SC
Slide 5: Santander Bank
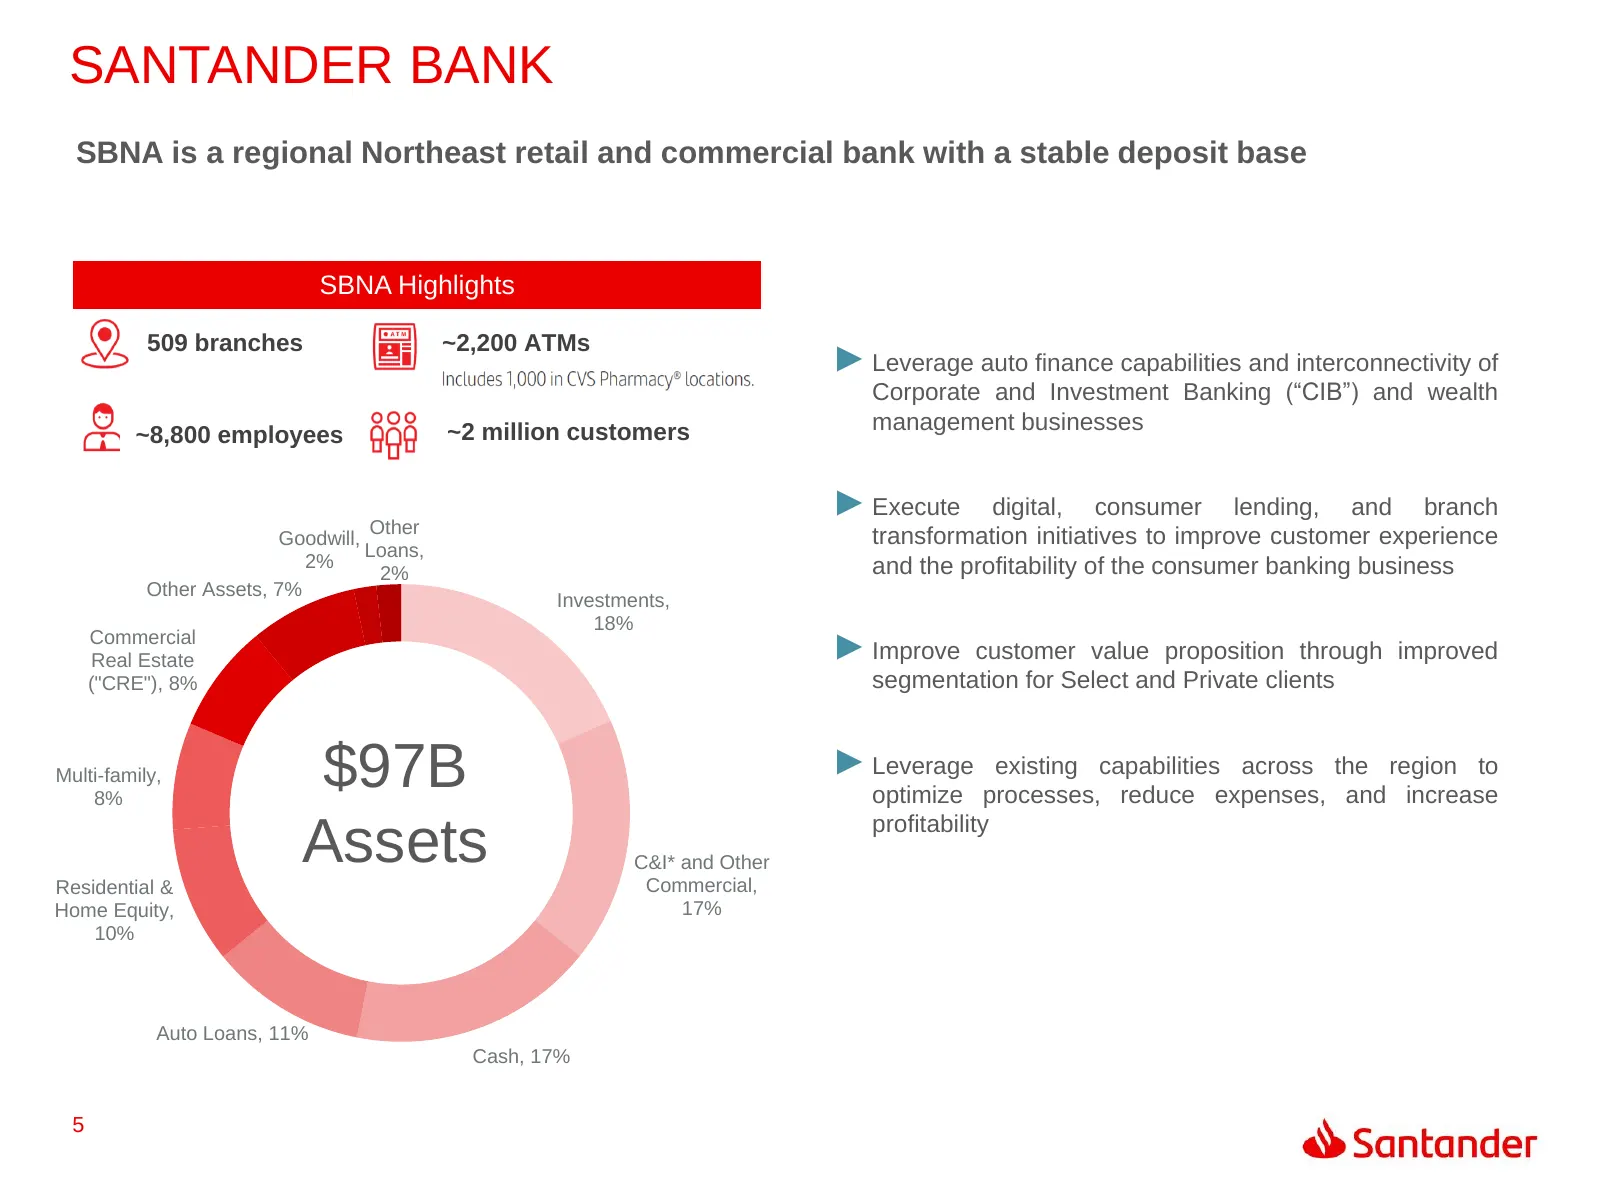
SANTANDER BANK SBNA is a regional Northeast retail and commercial bank with a stable deposit base SBNA Highlights 509 branches ~2,200 ATMs ► Leverage auto finance capabilities and interconnectivity of Corporate and Investment Banking (“CIB”) and wealth ~2 million customers management businesses ~8,8
Slide 6: Santander Consumer USA
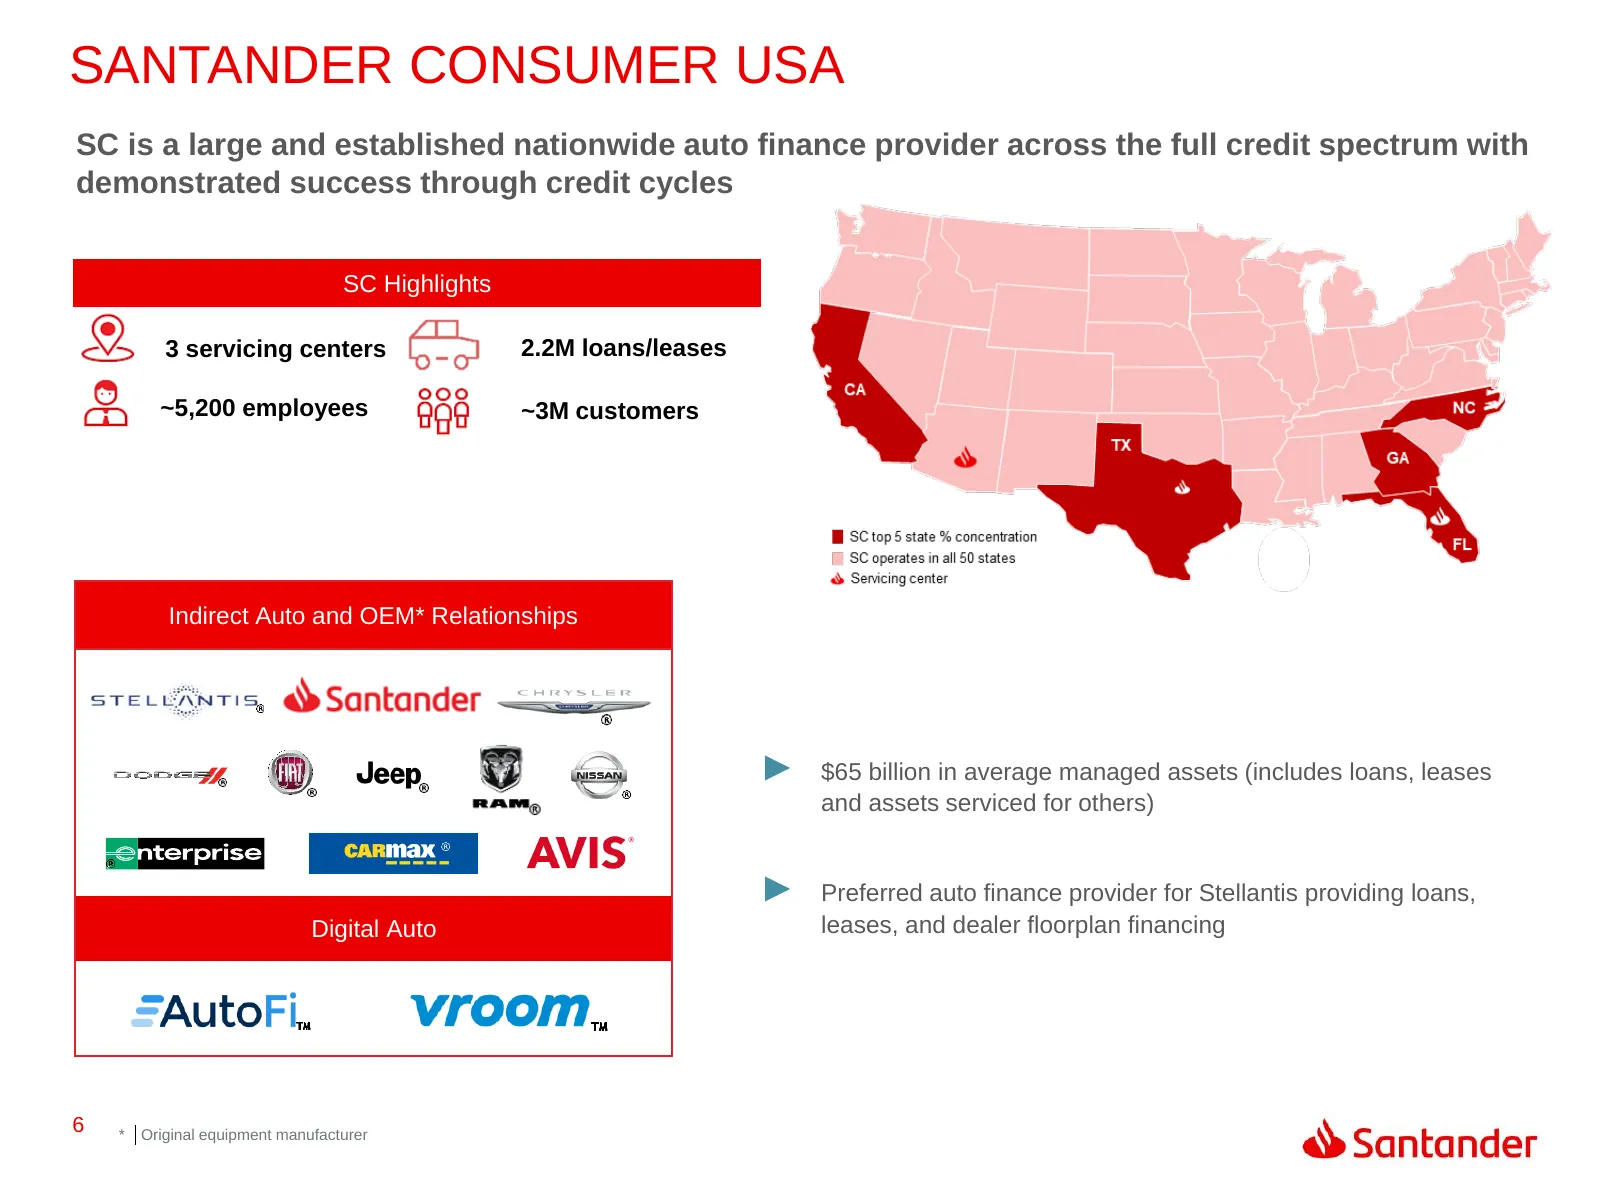
SANTANDER CONSUMER USA SC is a large and established nationwide auto finance provider across the full credit spectrum with demonstrated success through credit cycles SC Highlights 3 servicing centers 2.2M loans/leases ~5,200 employees ~3M customers Indirect Auto and OEM* Relationships ► $65 billion
Slide 7: Q3 2021 Highlights
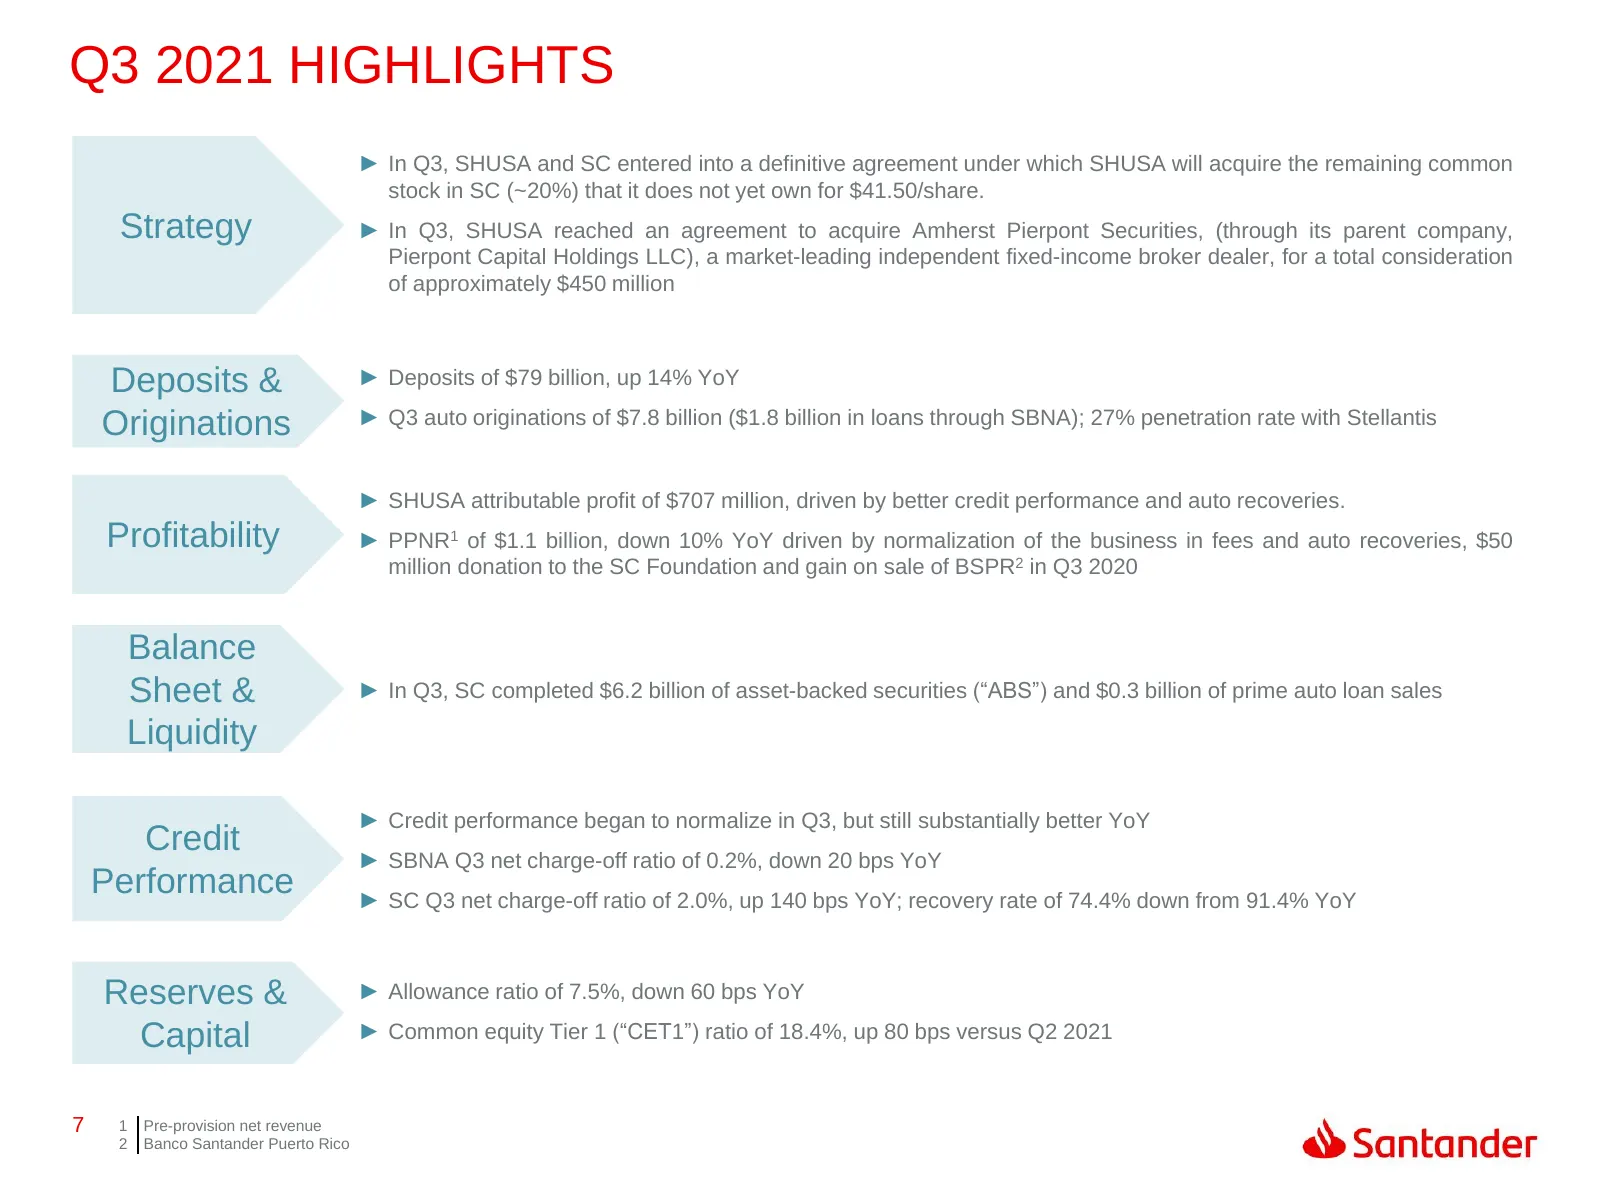
Q3 2021 HIGHLIGHTS ► In Q3, SHUSA and SC entered into a definitive agreement under which SHUSA will acquire the remaining common stock in SC (~20%) that it does not yet own for $41.50/share. Strategy ► In Q3, SHUSA reached an agreement to acquire Amherst Pierpont Securities, (through its parent comp
Slide 8: Allowance for Credit Losses (ACL)
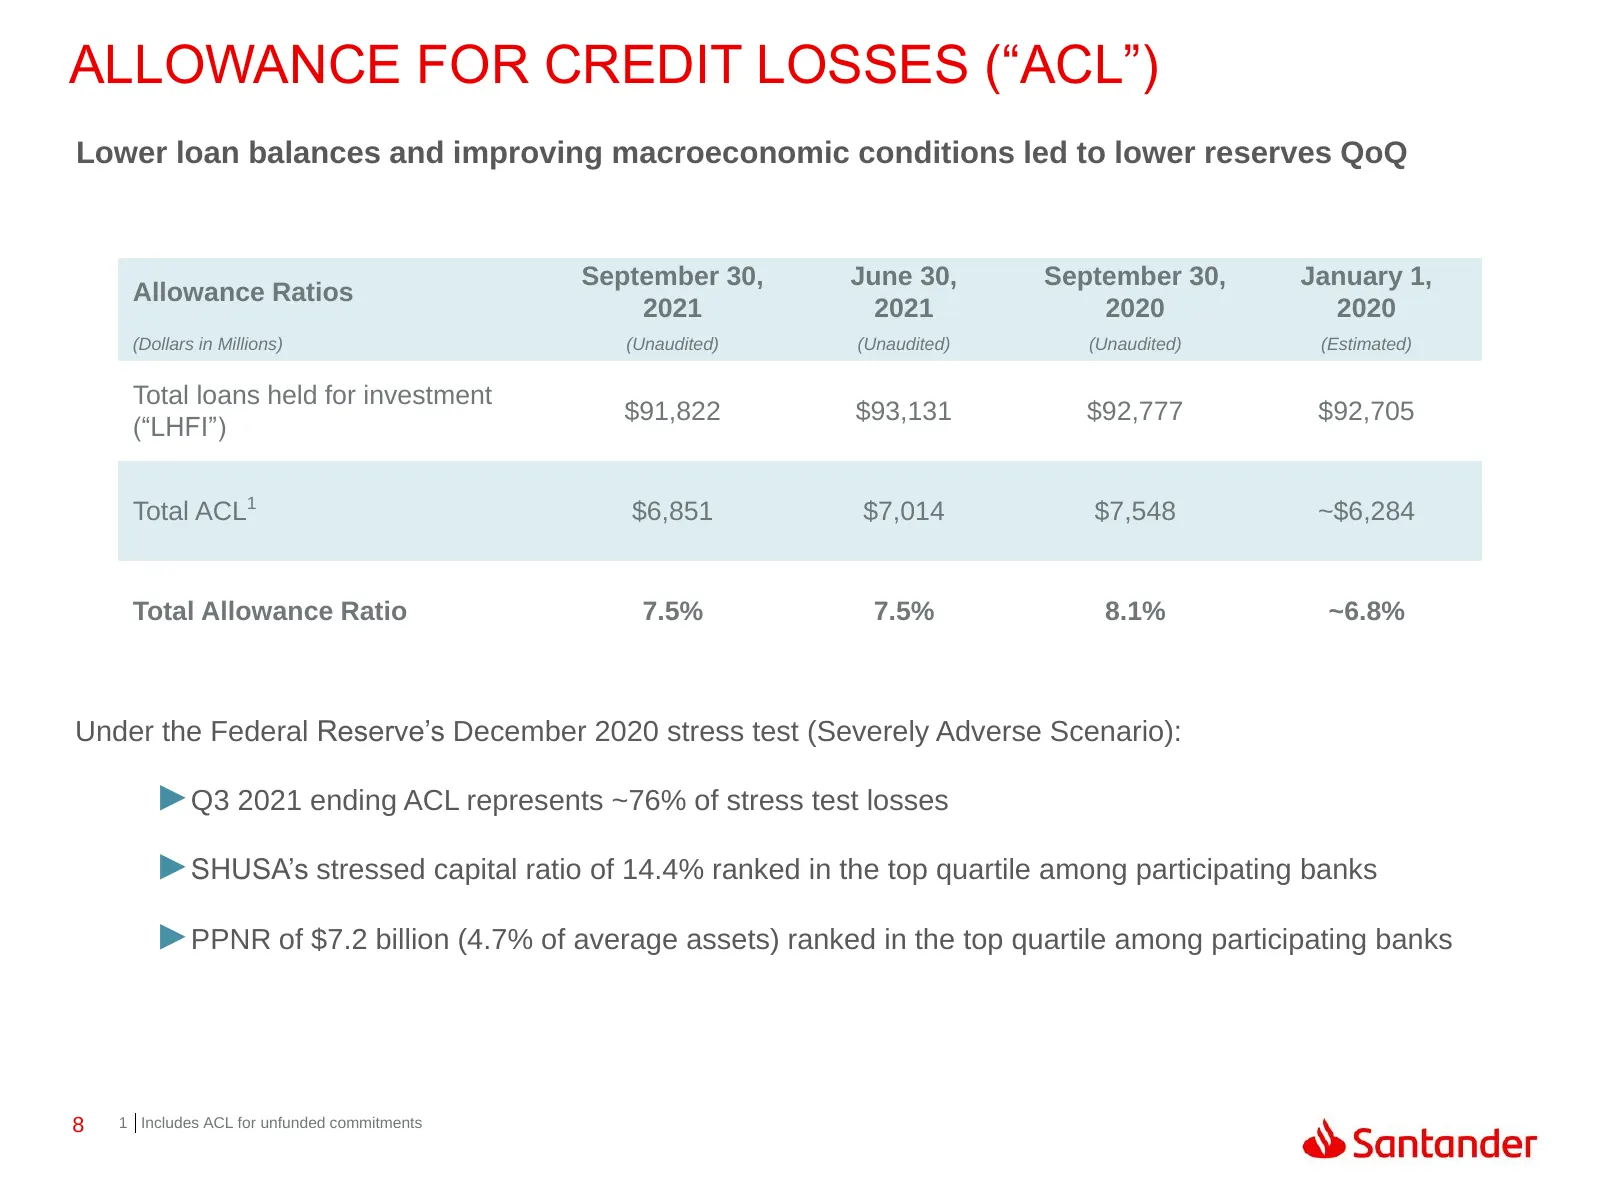
ALLOWANCE FOR CREDIT LOSSES (“ACL”) Lower loan balances and improving macroeconomic conditions led to lower reserves QoQ September 30, June 30, September 30, January 1, Allowance Ratios 2021 2021 2020 2020 (Dollars in Millions) (Unaudited) (Unaudited) (Unaudited) (Estimated) Total loans held for inv
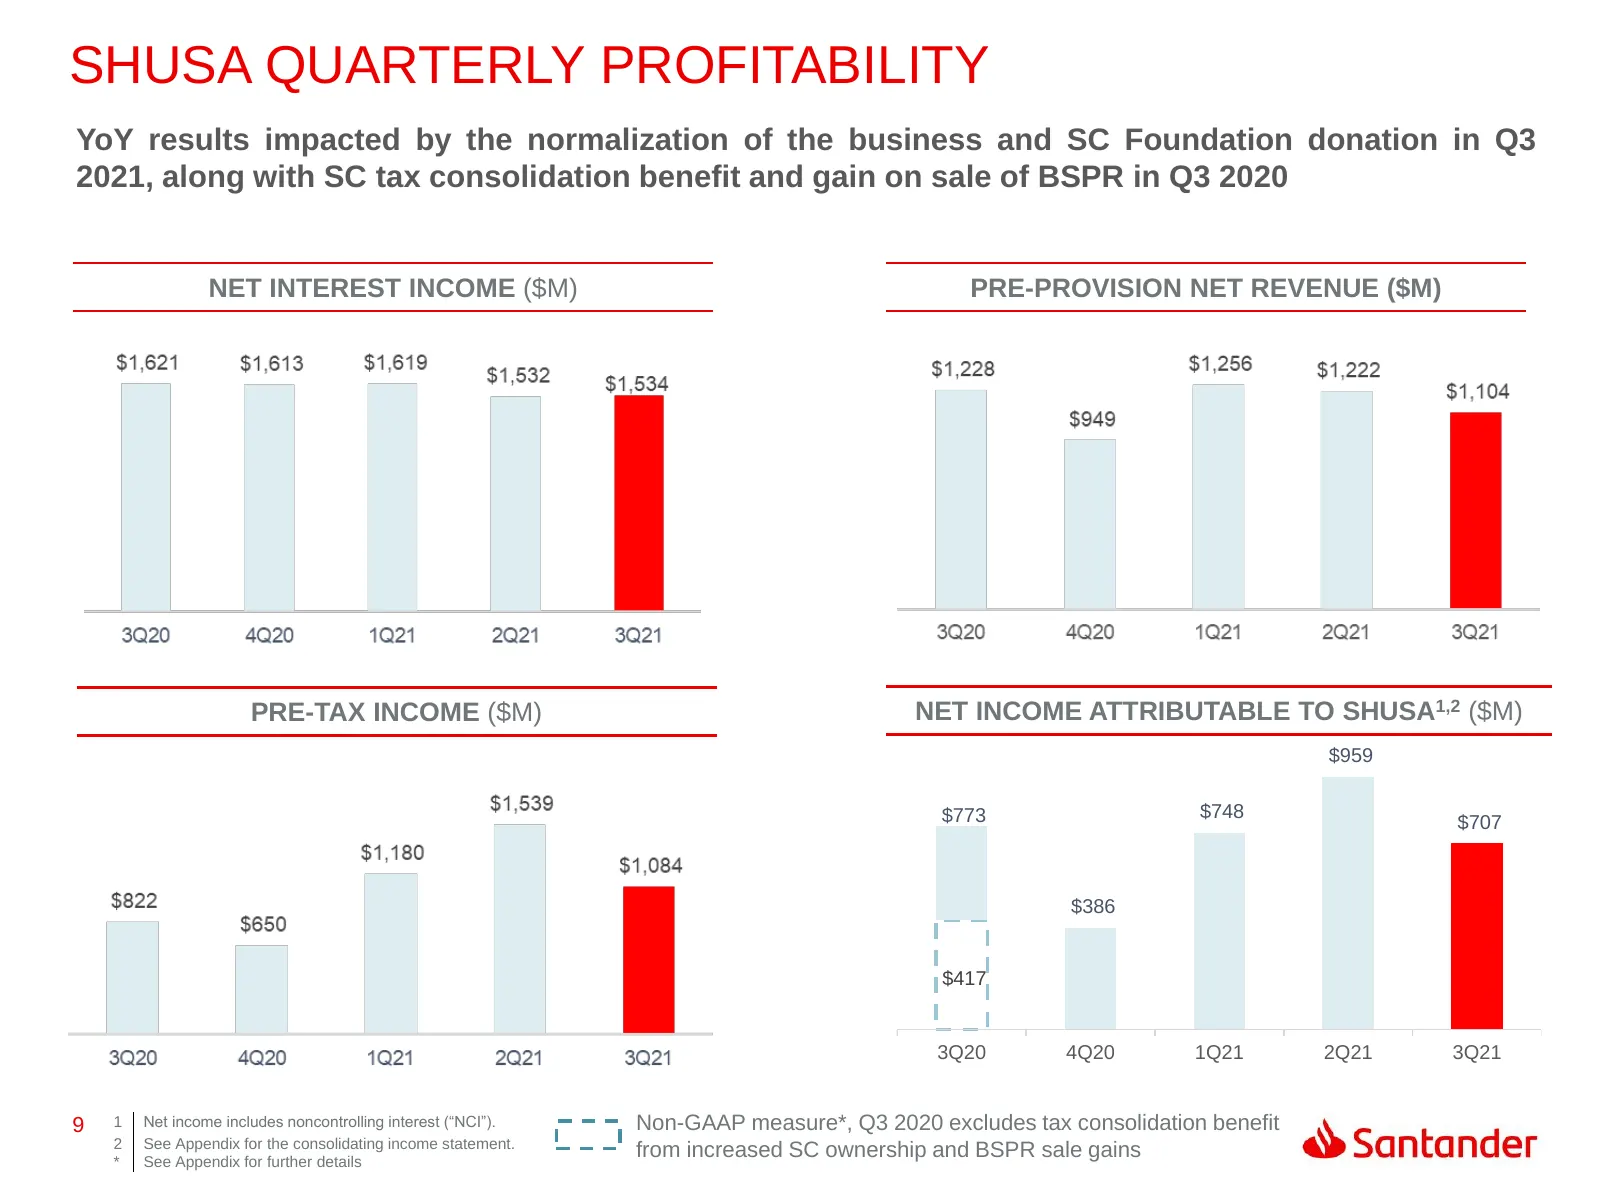
Slide 9: SHUSA Quarterly Profitability
SHUSA QUARTERLY PROFITABILITY YoY results impacted by the normalization of the business and SC Foundation donation in Q3 2021, along with SC tax consolidation benefit and gain on sale of BSPR in Q3 2020 NET INTEREST INCOME ($M) PRE-PROVISION NET REVENUE ($M) PRE-TAX INCOME ($M) NET INCOME ATTRIBUTAB
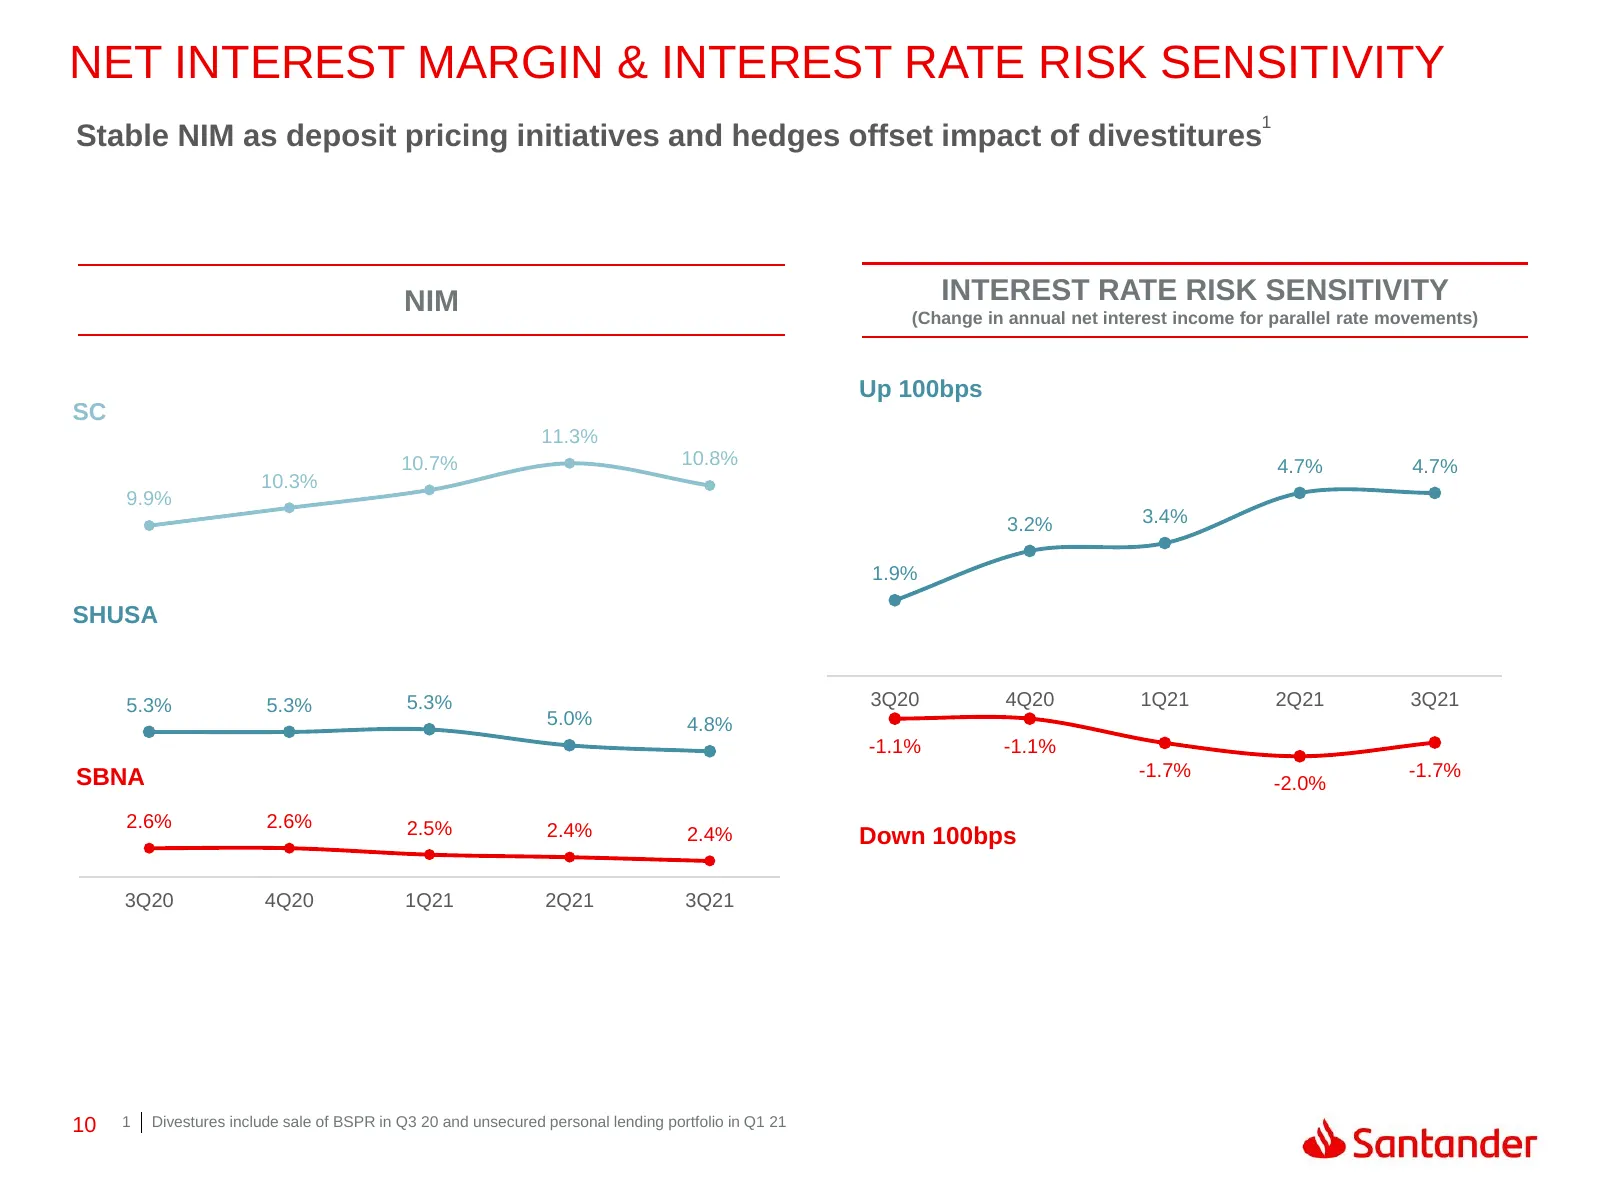
Slide 10: Net Interest Margin & Interest Rate Risk Sensitivity
NET INTEREST MARGIN & INTEREST RATE RISK SENSITIVITY 1 Stable NIM as deposit pricing initiatives and hedges offset impact of divestitures NIM INTEREST RATE RISK SENSITIVITY (Change in annual net interest income for parallel rate movements) Up 100bps SC 11.3% 10.7% 10.8% 4.7% 4.7% 10.3% 9.9% 3.2% 3.4
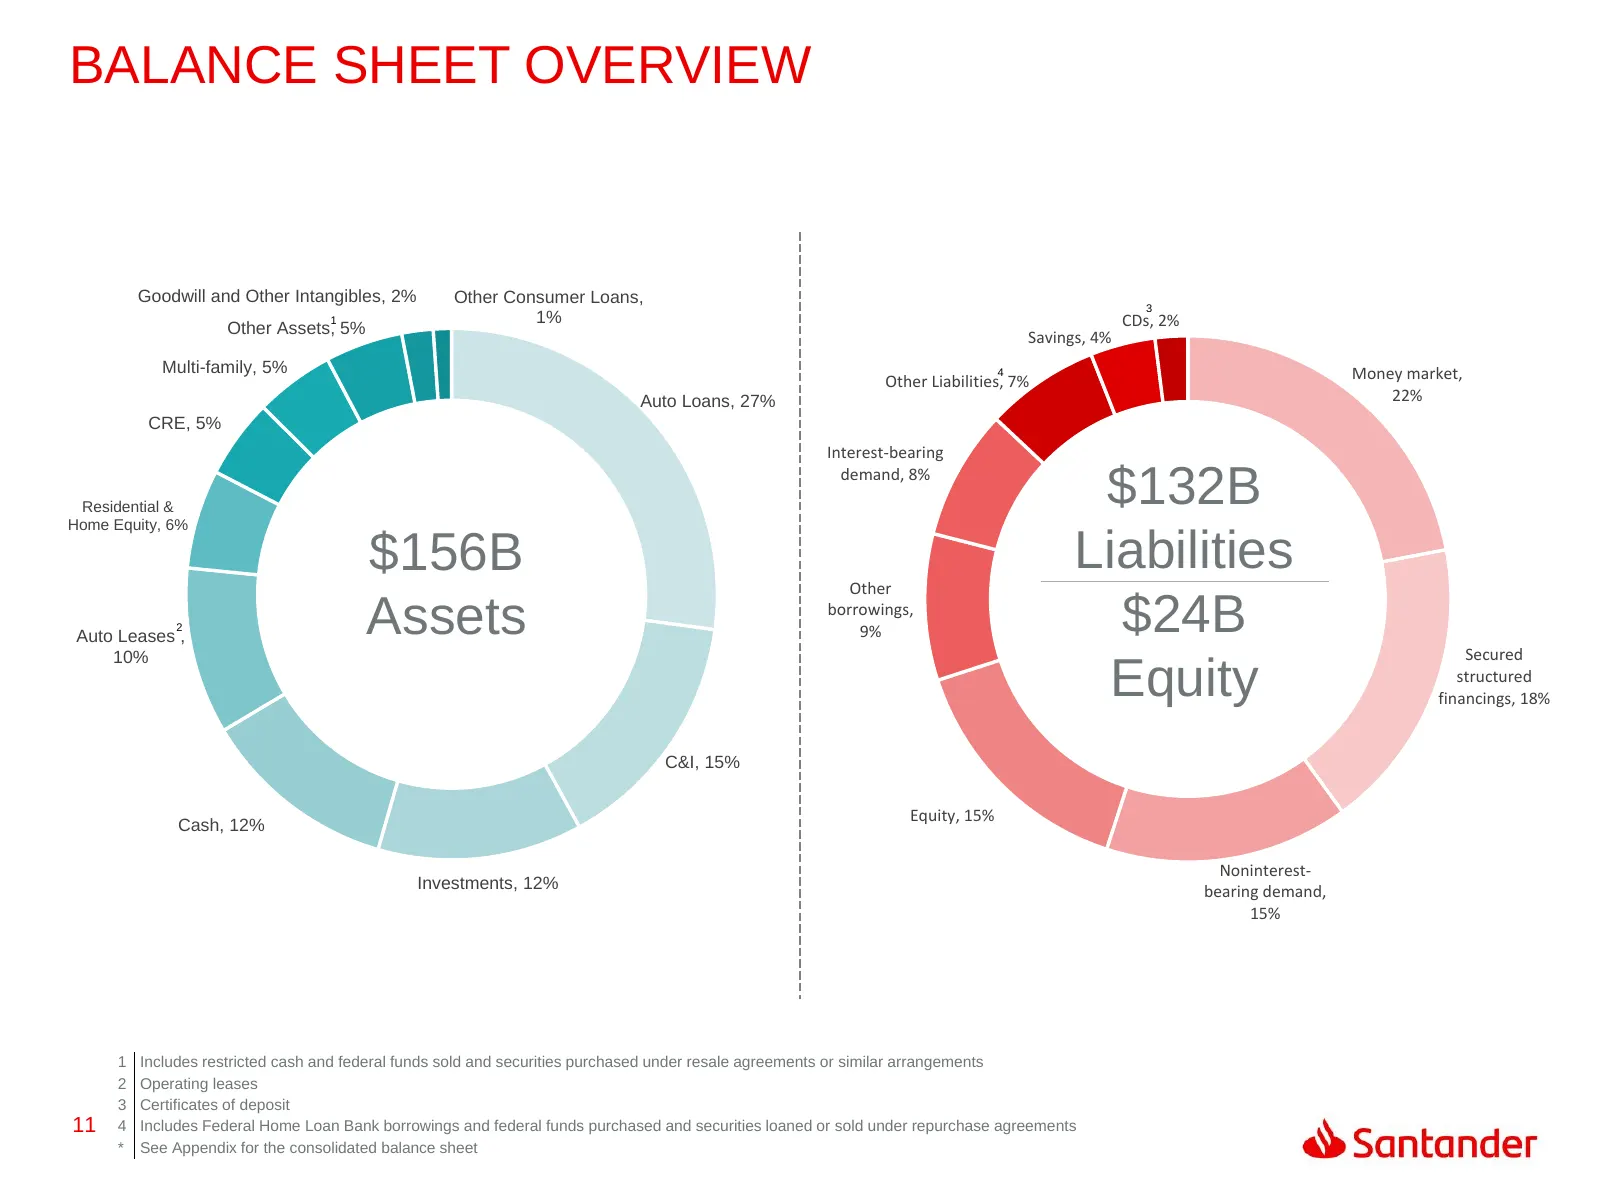
Slide 11: Balance Sheet Overview
BALANCE SHEET OVERVIEW Goodwill and Other Intangibles, 2% Other Consumer Loans, 3 1 1% CDs, 2% Other Assets, 5% Savings, 4% Multi-family, 5% 4 Money market, Other Liabilities, 7% Auto Loans, 27% 22% CRE, 5% Interest-bearing Residential & Home Equity, 6% demand, 8% $132B $156B Other Liabilities Auto
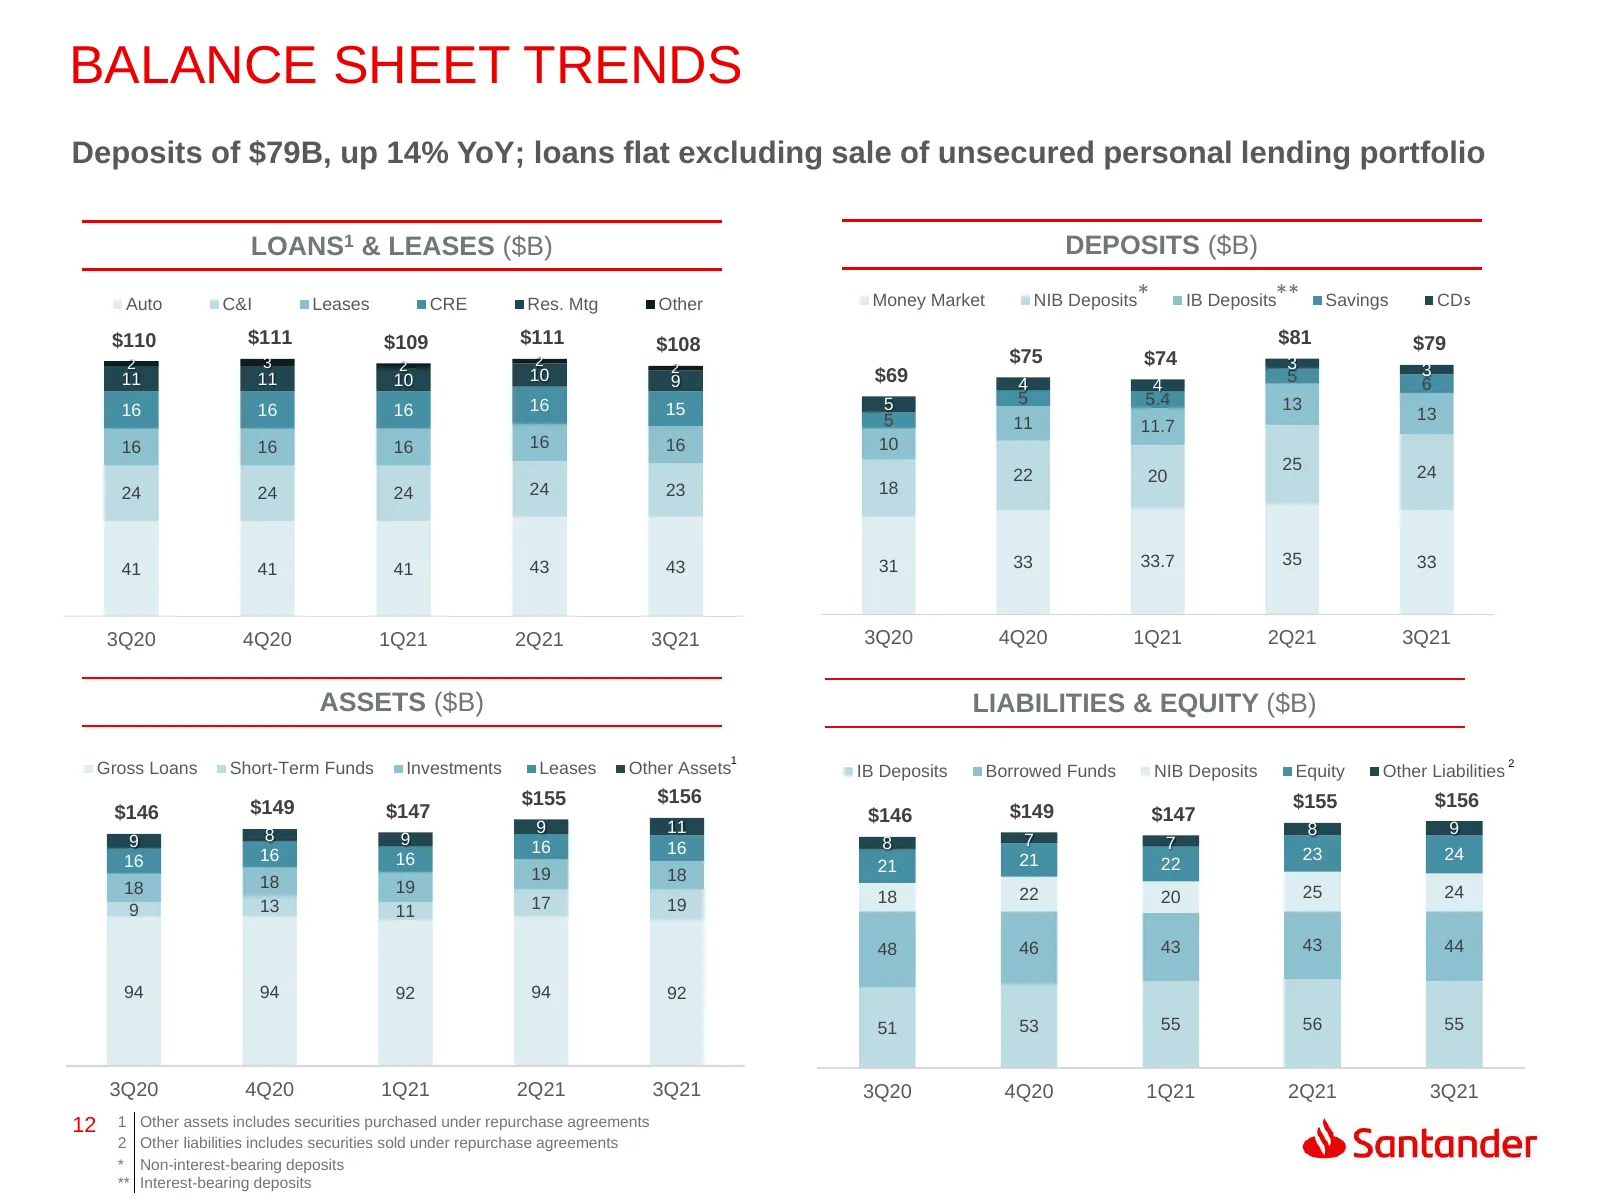
Slide 12: Balance Sheet Trends
BALANCE SHEET TRENDS Deposits of $79B, up 14% YoY; loans flat excluding sale of unsecured personal lending portfolio LOANS1 & LEASES ($B) DEPOSITS ($B) Auto C&I Leases CRE Res. Mtg Other Money Market NIB Deposits* IB Deposits** Savings CD s $110 $111 $109 $111 $108 $81 $79 2 3 2 2 $75 $74 3 2 3 11 1
Slide 13: Borrowed Funds Profile
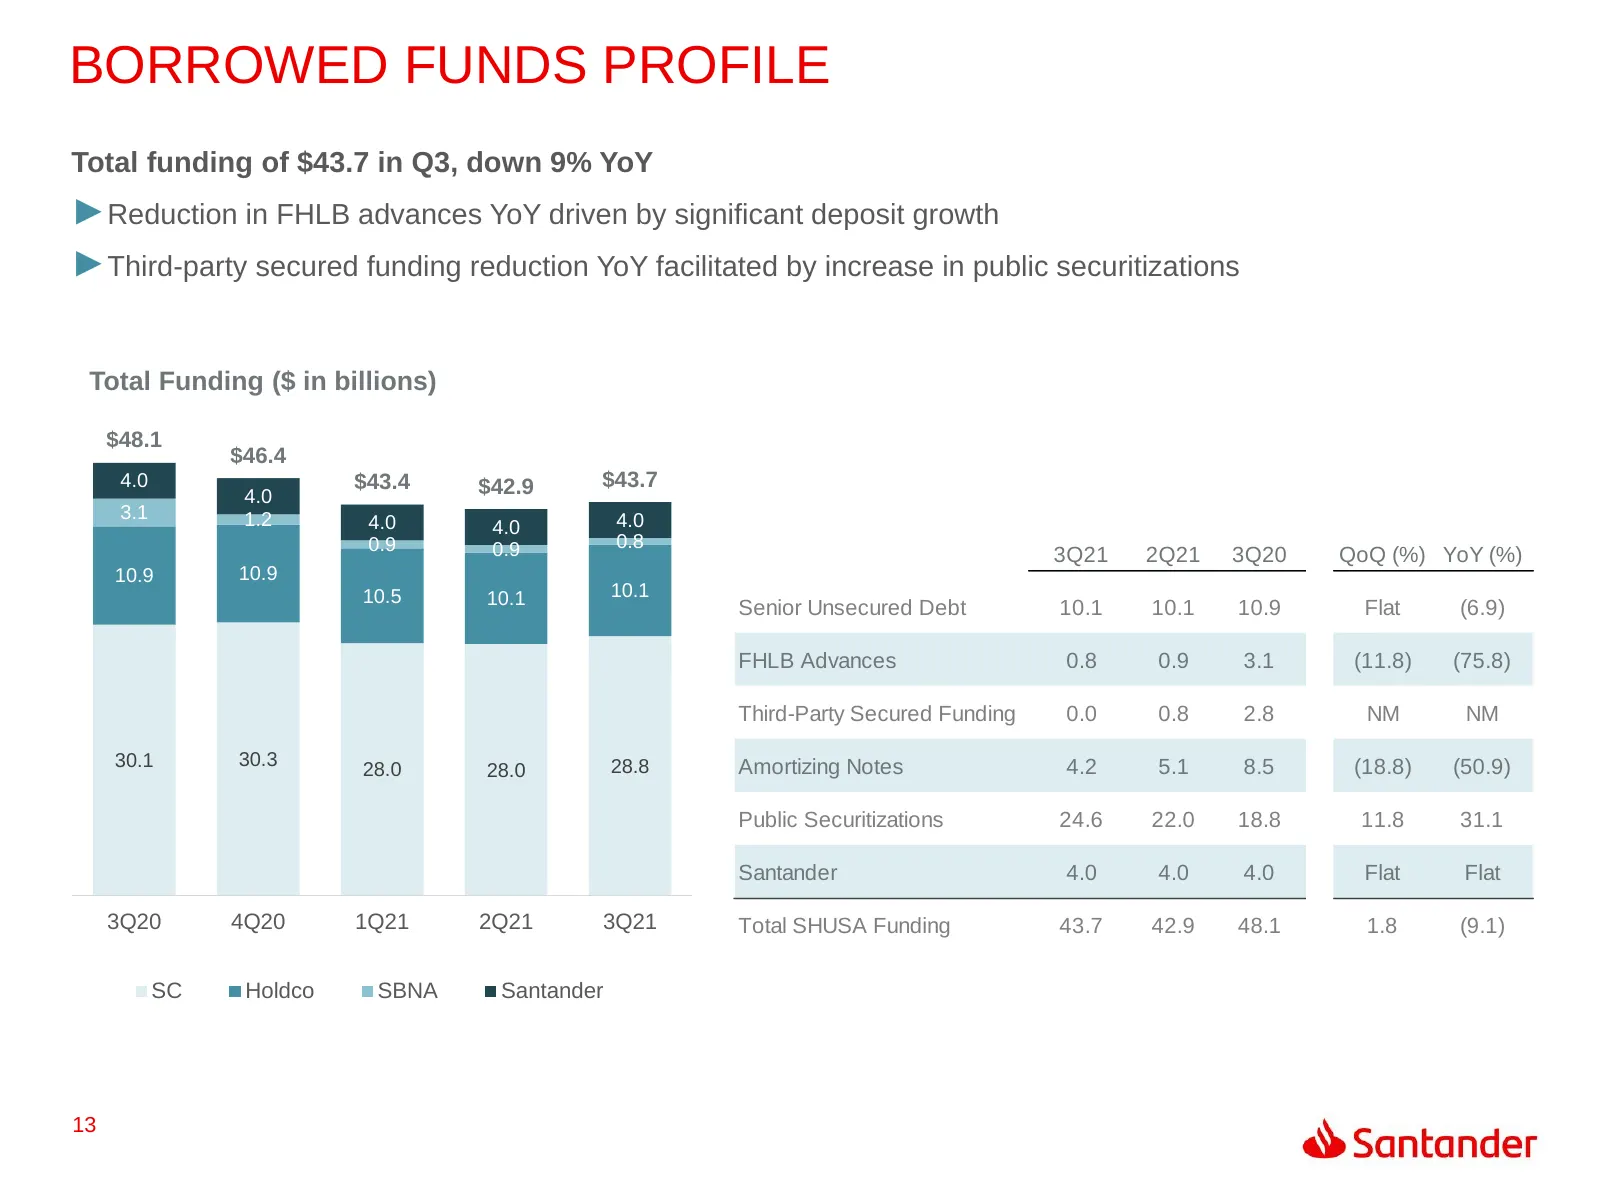
BORROWED FUNDS PROFILE Total funding of $43.7 in Q3, down 9% YoY ►Reduction in FHLB advances YoY driven by significant deposit growth ►Third-party secured funding reduction YoY facilitated by increase in public securitizations Total Funding ($ in billions) $48.1 $46.4 4.0 $43.4 $42.9 $43.7 4.0 3.1 1
Slide 14: SHUSA Debt & Total Loss-Absorbing Capacity
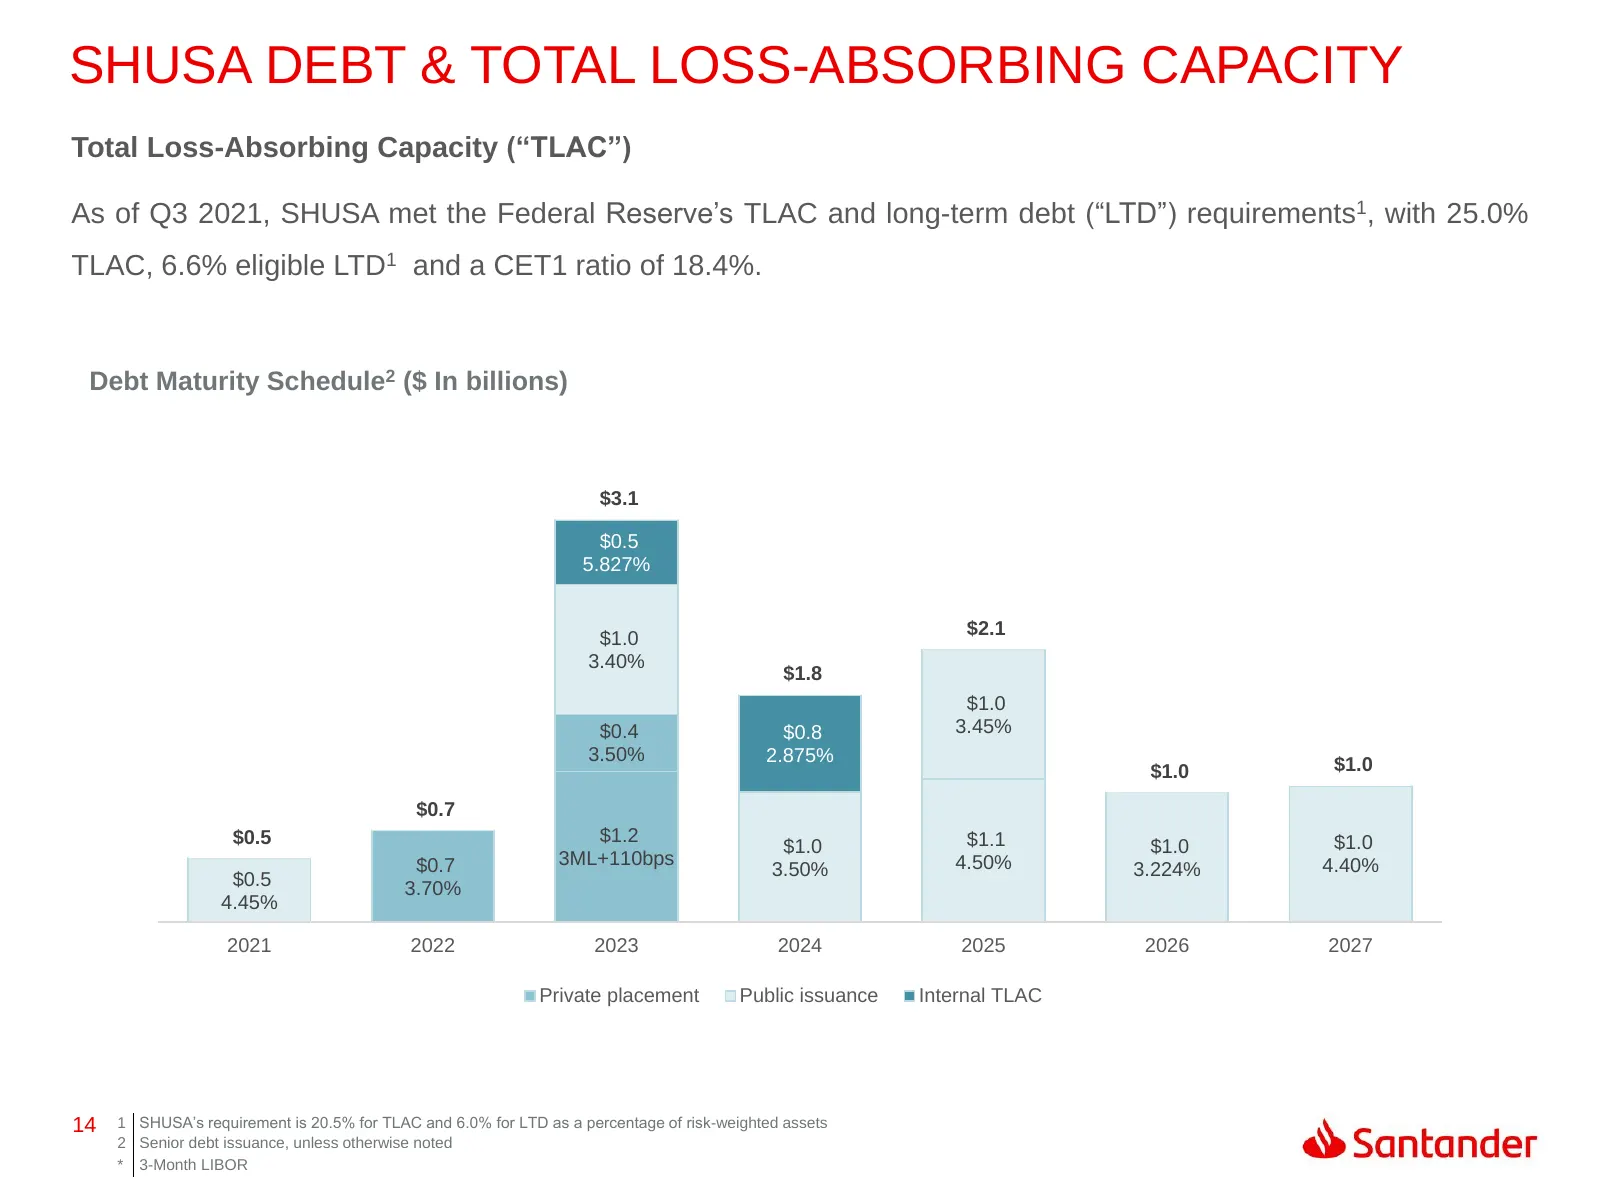
SHUSA DEBT & TOTAL LOSS-ABSORBING CAPACITY Total Loss-Absorbing Capacity (“TLAC”) As of Q3 2021, SHUSA met the Federal Reserve’s TLAC and long-term debt (“LTD”) requirements1, with 25.0% TLAC, 6.6% eligible LTD1 and a CET1 ratio of 18.4%. Debt Maturity Schedule2 ($ In billions) $3.1 $0.5 5.827% $2.1
Slide 15: Capital Ratios
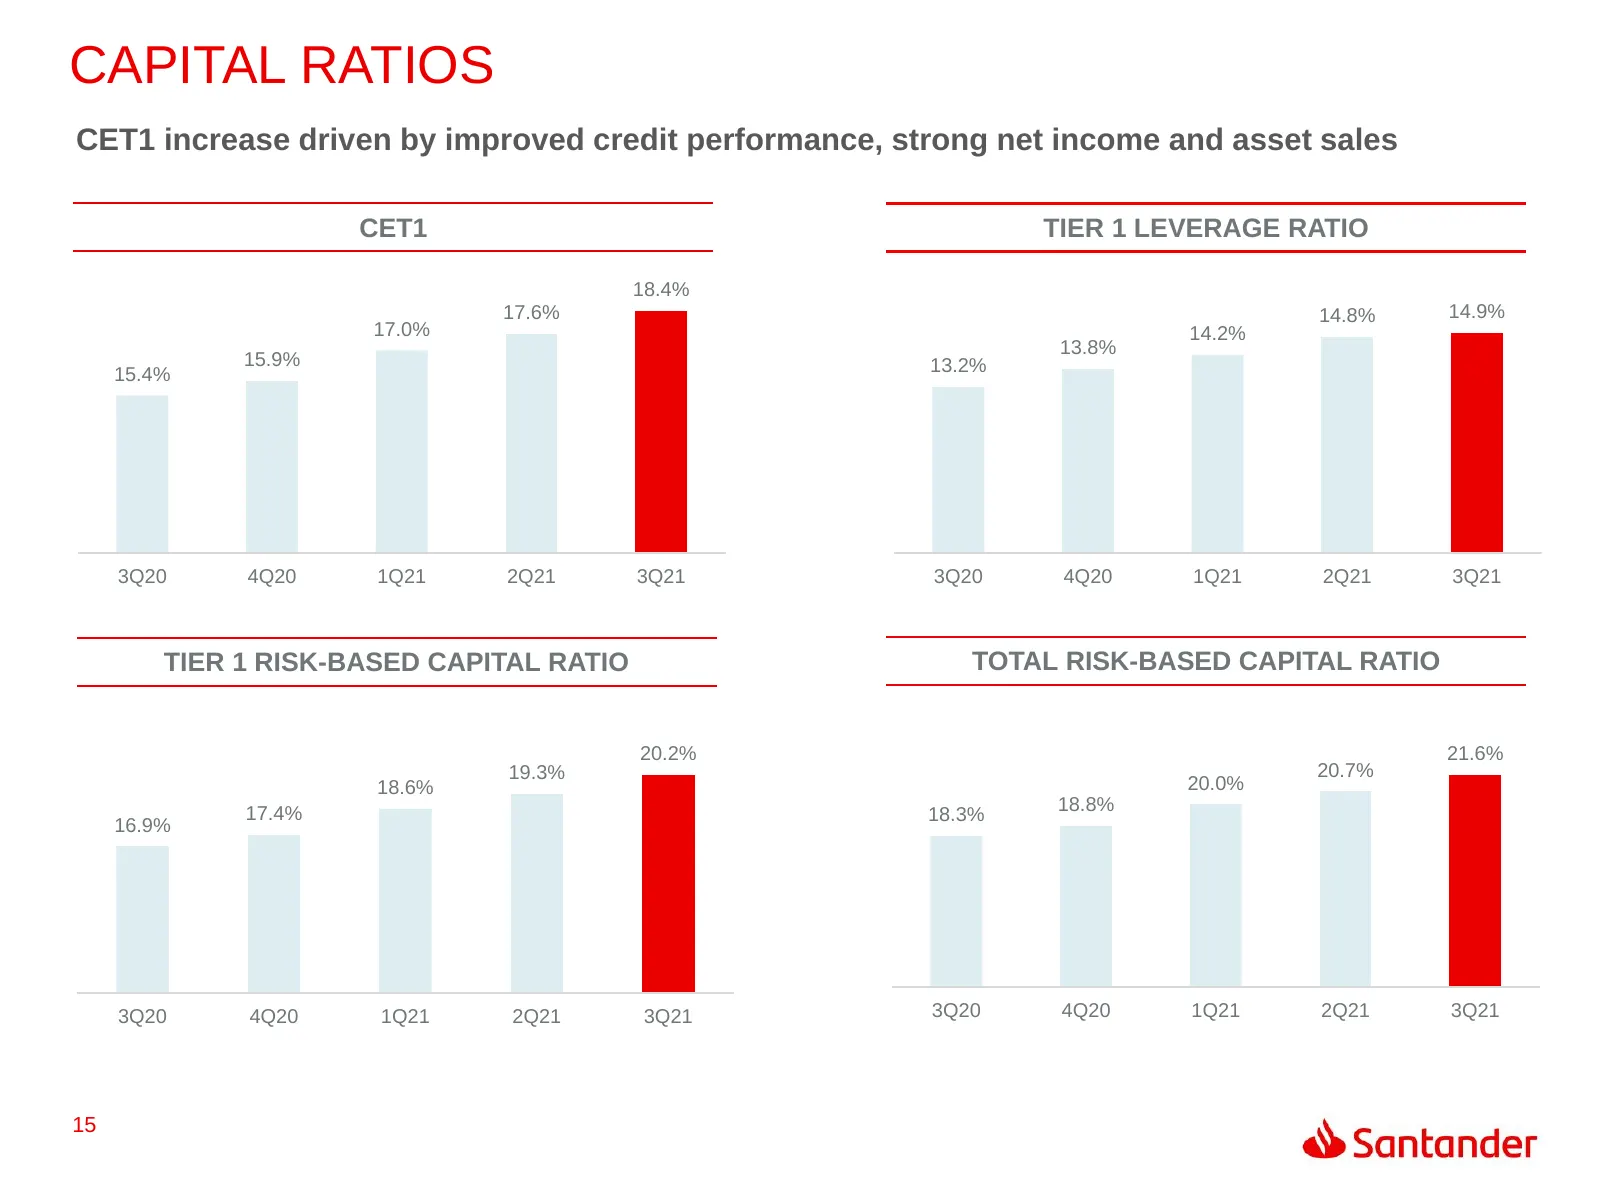
CAPITAL RATIOS CET1 increase driven by improved credit performance, strong net income and asset sales CET1 TIER 1 LEVERAGE RATIO 18.4% 17.6% 14.8% 14.9% 17.0% 14.2% 13.8% 15.9% 13.2% 15.4% 3Q20 4Q20 1Q21 2Q21 3Q21 3Q20 4Q20 1Q21 2Q21 3Q21 TIER 1 RISK-BASED CAPITAL RATIO TOTAL RISK-BASED CAPITAL RATI
Slide 16: SBNA Asset Quality
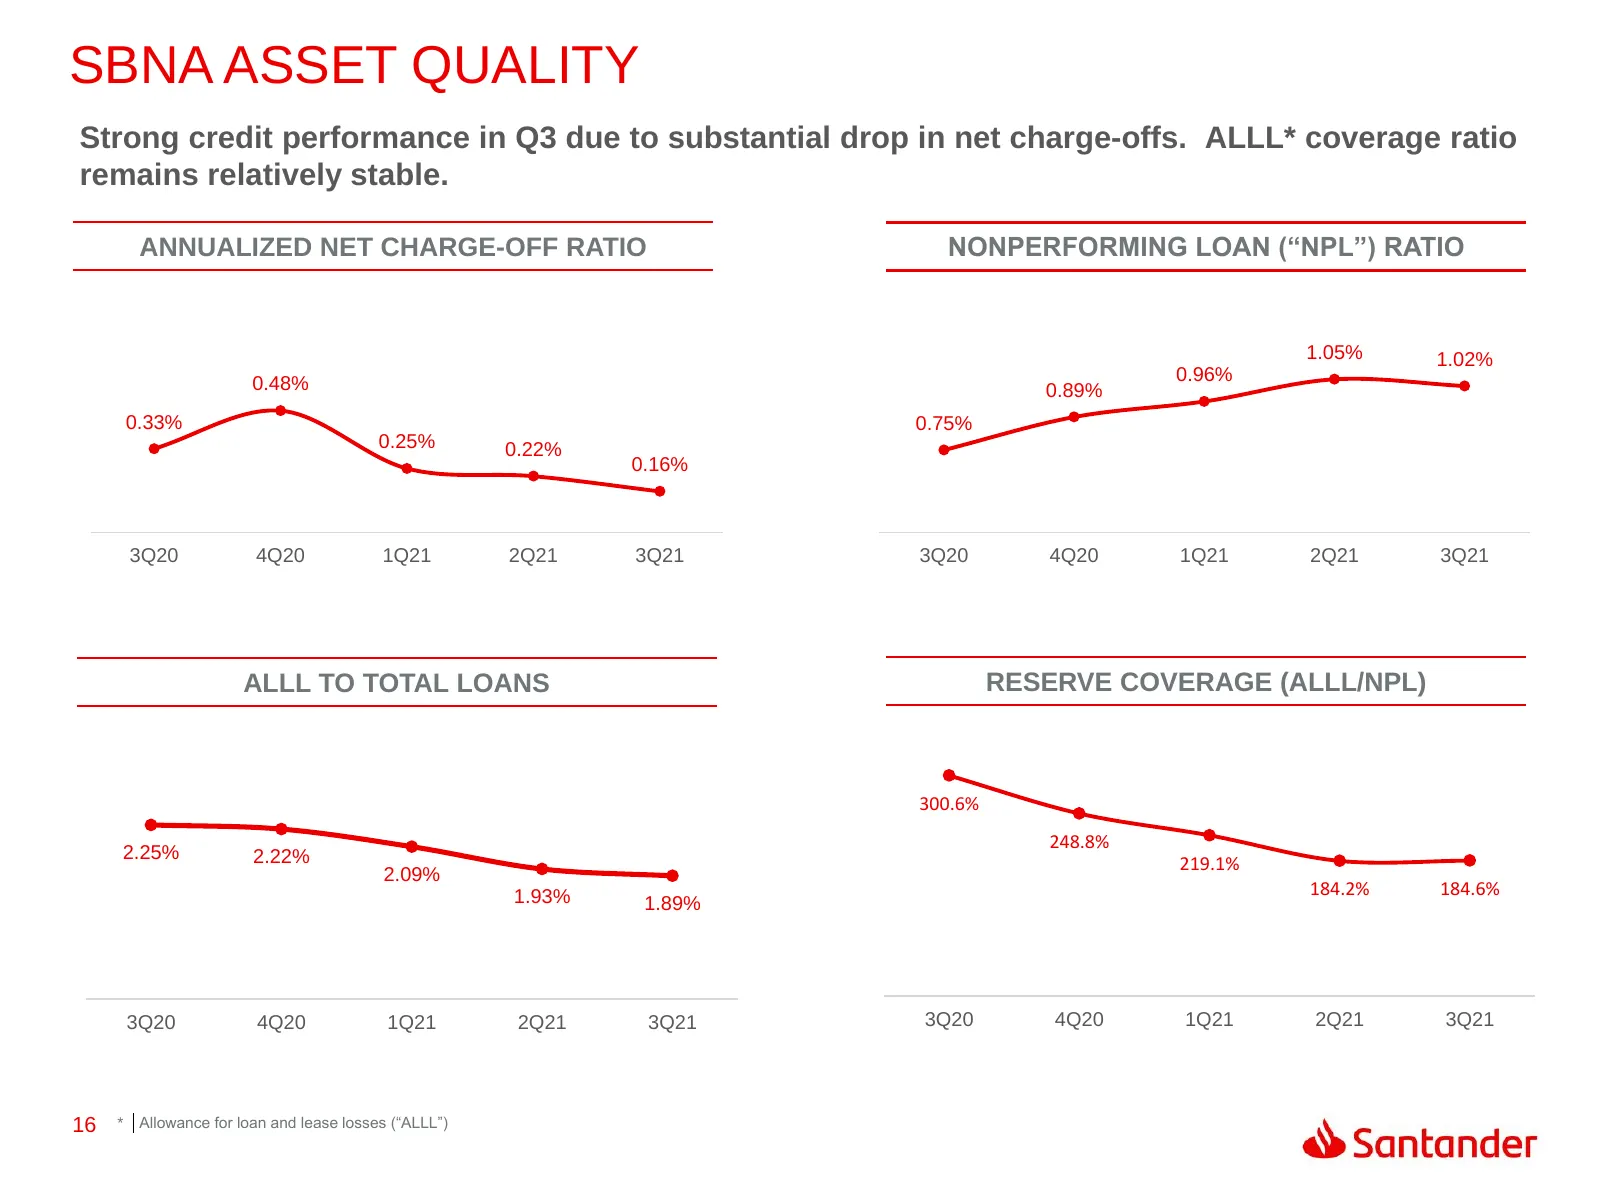
SBNA ASSET QUALITY Strong credit performance in Q3 due to substantial drop in net charge-offs. ALLL* coverage ratio remains relatively stable. ANNUALIZED NET CHARGE-OFF RATIO NONPERFORMING LOAN (“NPL”) RATIO 1.05% 1.02% 0.48% 0.96% 0.89% 0.33% 0.75% 0.25% 0.22% 0.16% 3Q20 4Q20 1Q21 2Q21 3Q21 3Q20 4Q
Slide 17: SC Auto Originations
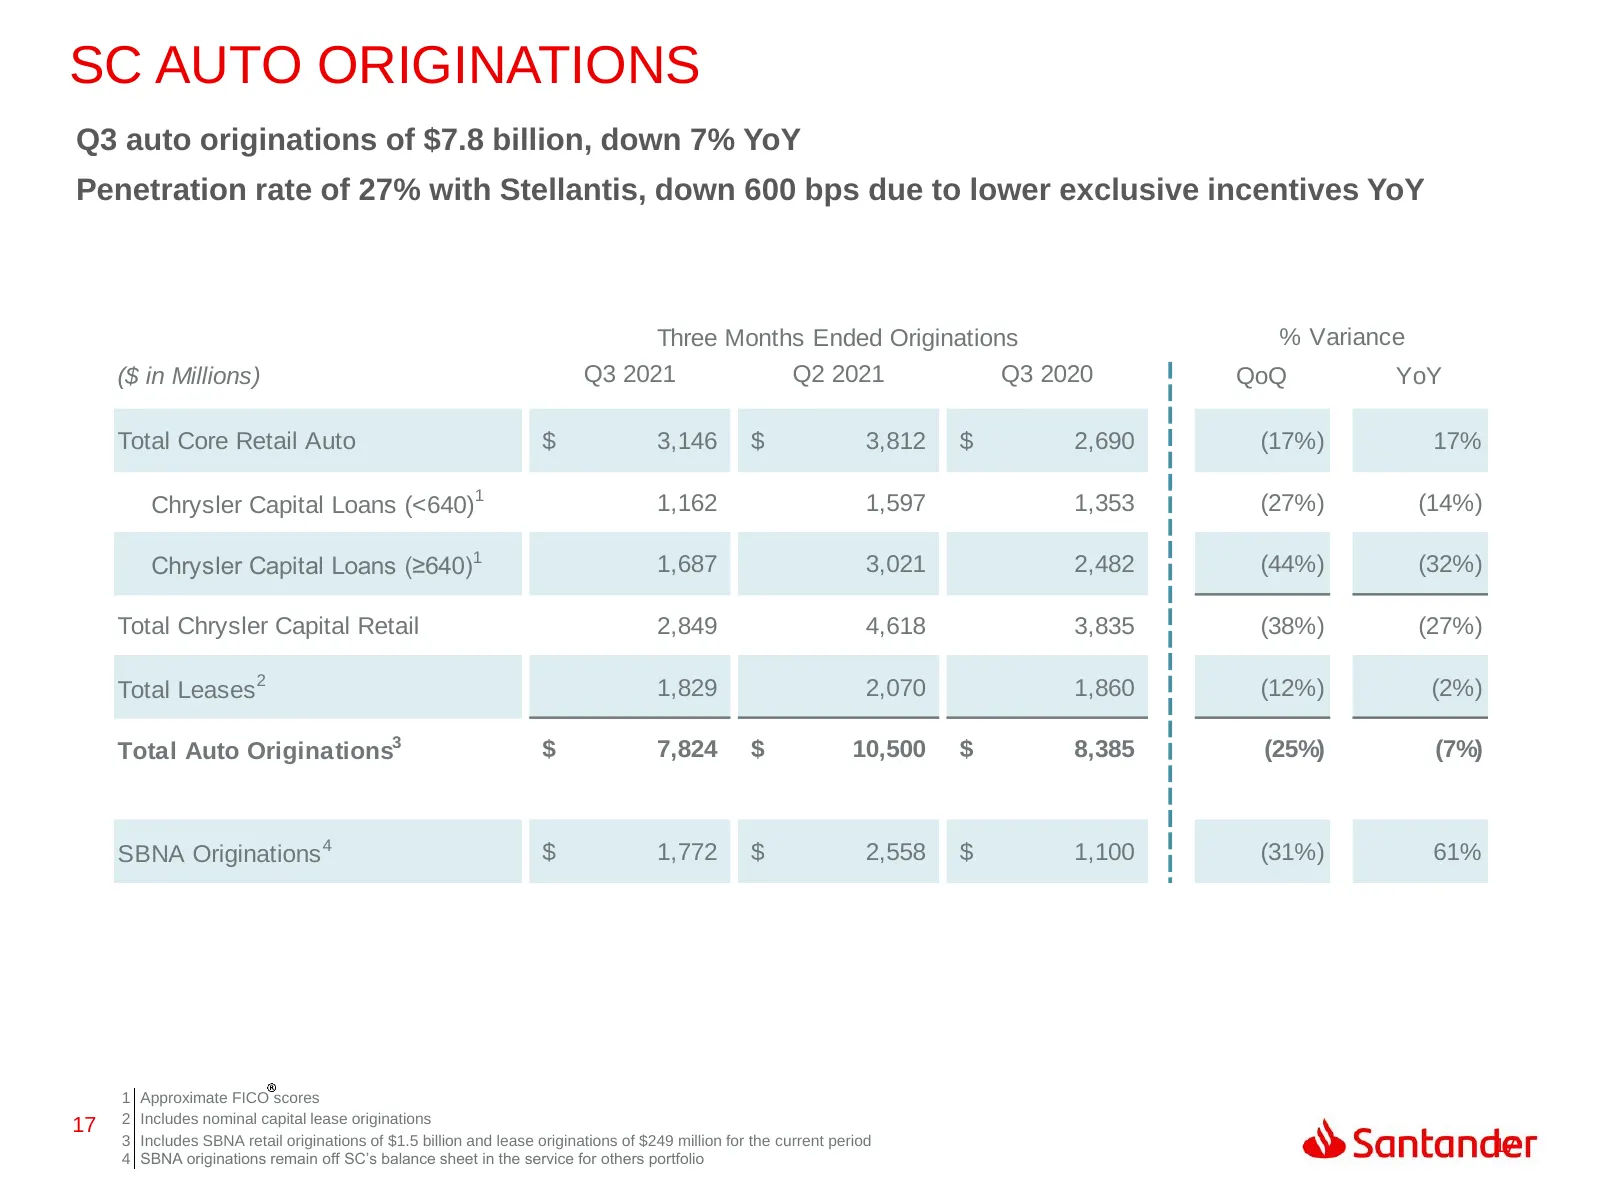
SC AUTO ORIGINATIONS Q3 auto originations of $7.8 billion, down 7% YoY Penetration rate of 27% with Stellantis, down 600 bps due to lower exclusive incentives YoY Three Months Ended Originations % Variance ($ in Millions) Q3 2021 Q2 2021 Q3 2020 QoQ YoY Total Core Retail Auto $ 3,146 $ 3,812 $ 2,690
Slide 18: SC Delinquency and Loss
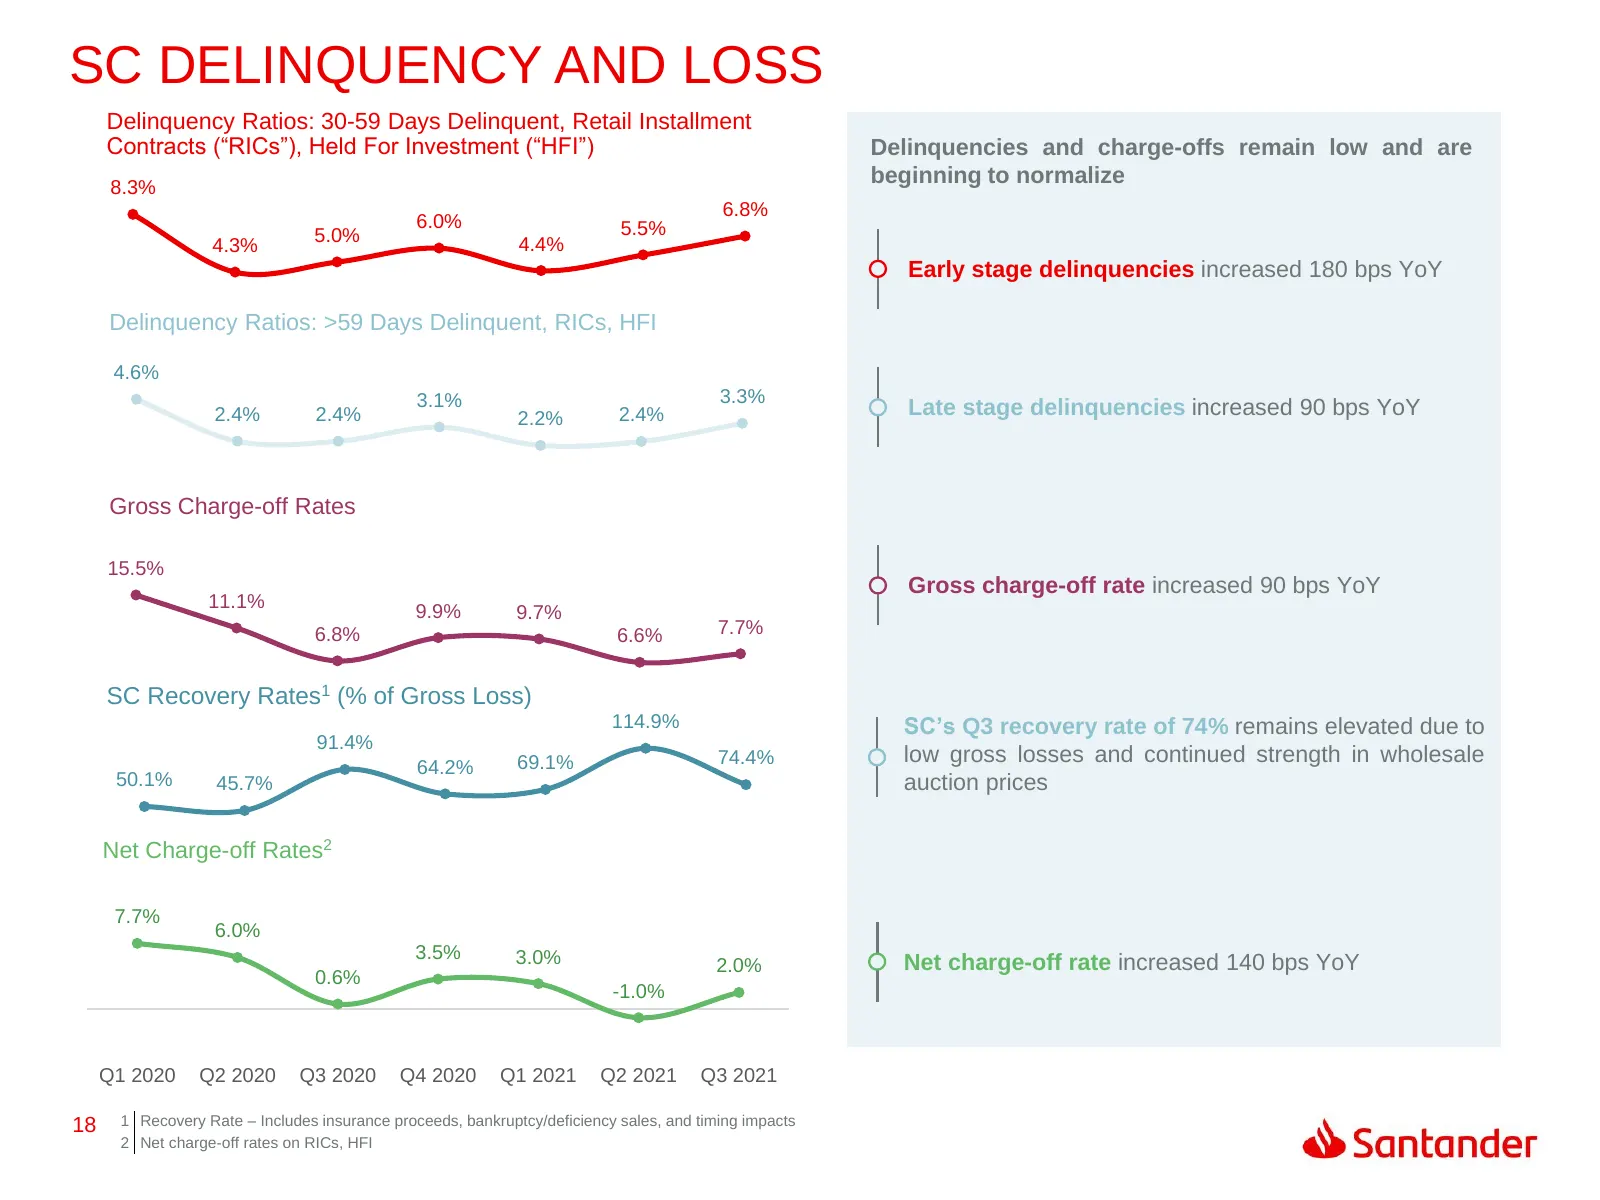
SC DELINQUENCY AND LOSS Delinquency Ratios: 30-59 Days Delinquent, Retail Installment Contracts (“RICs”), Held For Investment (“HFI”) Delinquencies and charge-offs remain low and are 8.3% beginning to normalize 6.8% 6.0% 5.5% 5.0% 4.4% 4.3% Early stage delinquencies increased 180 bps YoY Delinquency
Slide 19: Rating Agencies
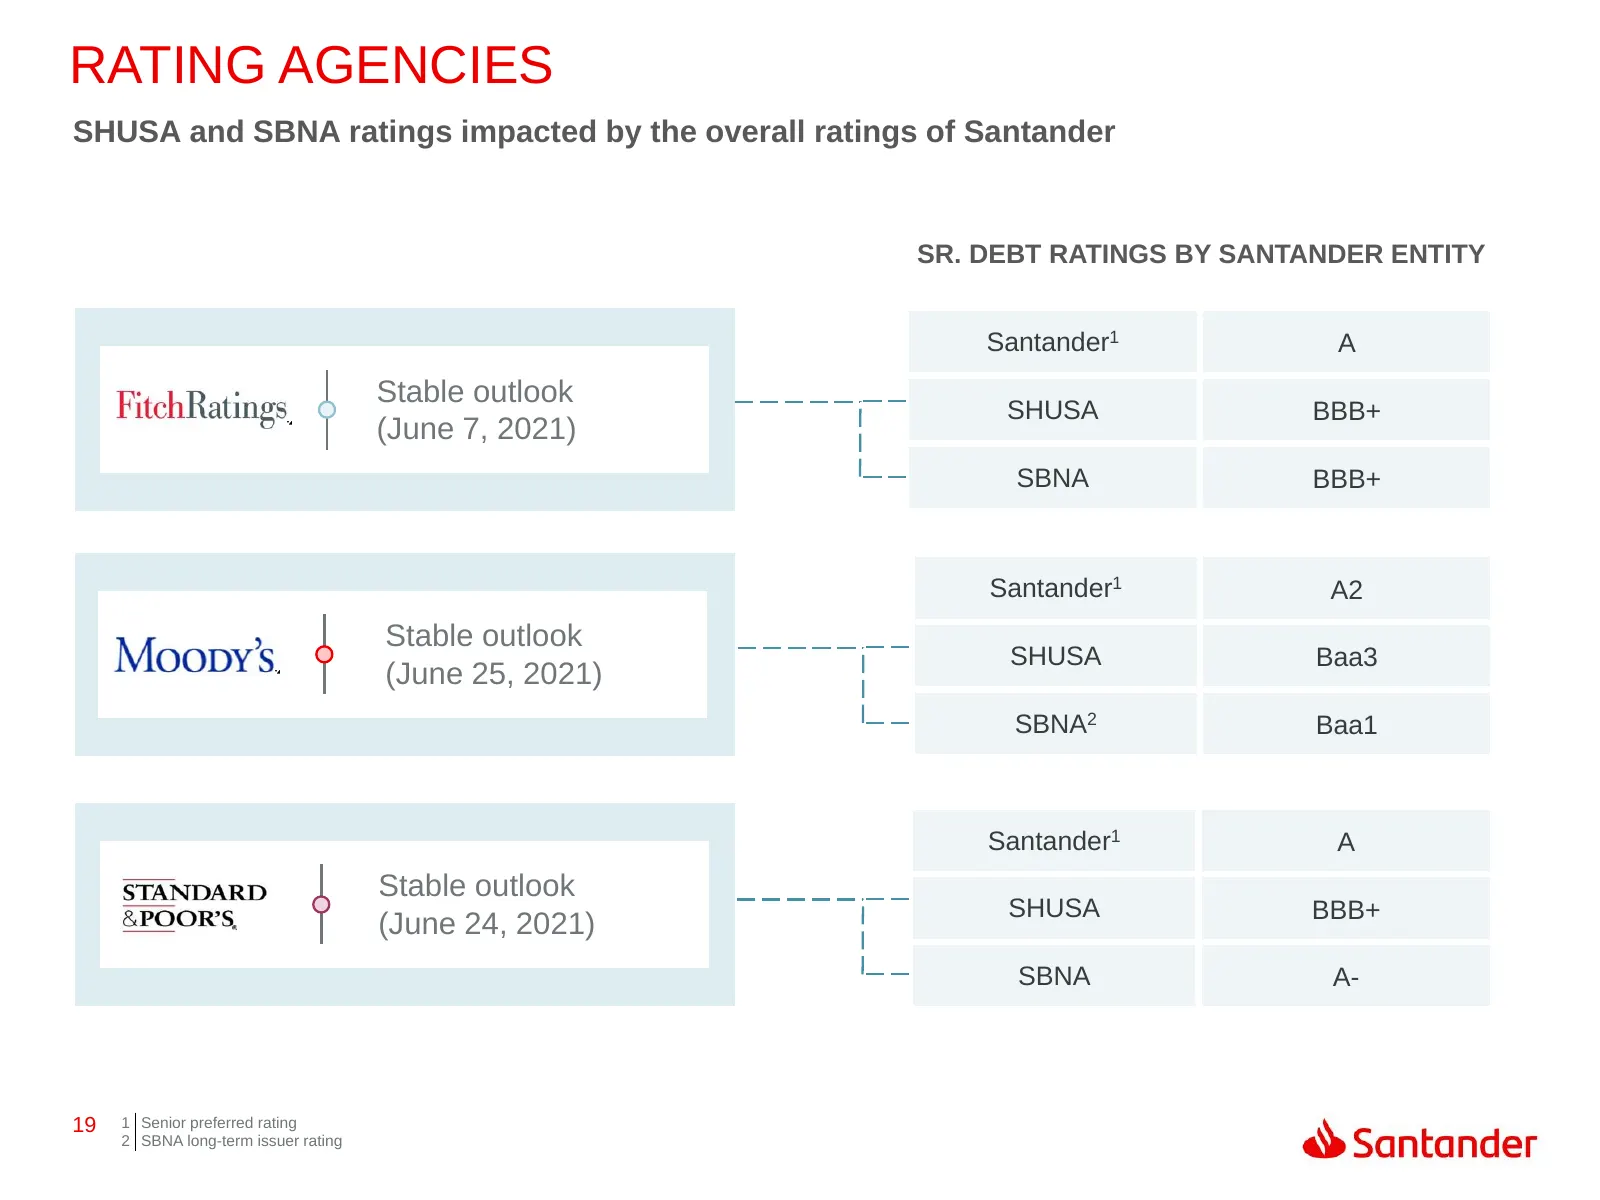
RATING AGENCIES SHUSA and SBNA ratings impacted by the overall ratings of Santander SR. DEBT RATINGS BY SANTANDER ENTITY Santander1 A Stable outlook SHUSA BBB+ (June 7, 2021) SBNA BBB+ Santander1 A2 Stable outlook SHUSA Baa3 (June 25, 2021) SBNA2 Baa1 Santander1 A Stable outlook SHUSA BBB+ (June 24,
Slide 20: Appendix
APPENDIX @ Santander
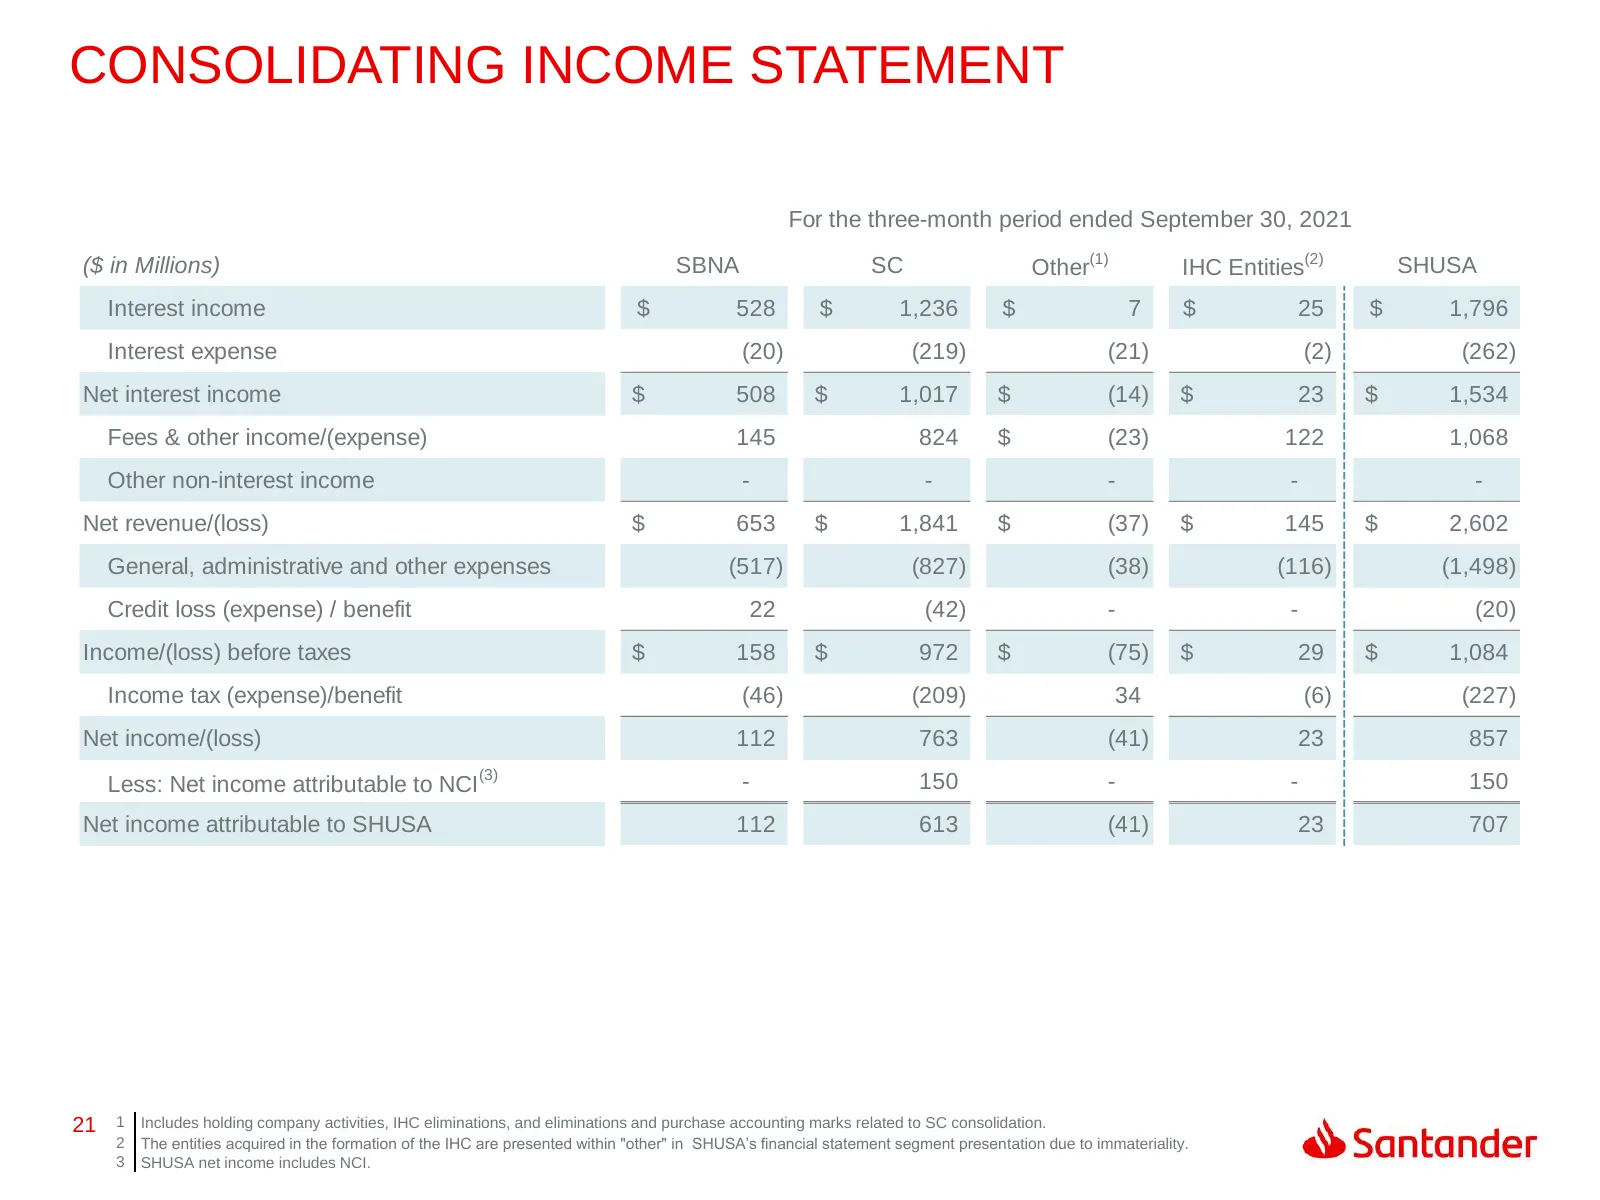
Slide 21: Consolidating Income Statement
CONSOLIDATING INCOME STATEMENT For the three-month period ended September 30, 2021 ($ in Millions) SBNA SC Other(1) IHC Entities(2) SHUSA Interest income $ 528 $ 1,236 $ 7 $ 25 $ 1,796 Interest expense (20) (219) (21) (2) (262) Net interest income $ 508 $ 1,017 $ (14) $ 23 $ 1,534 Fees & other incom
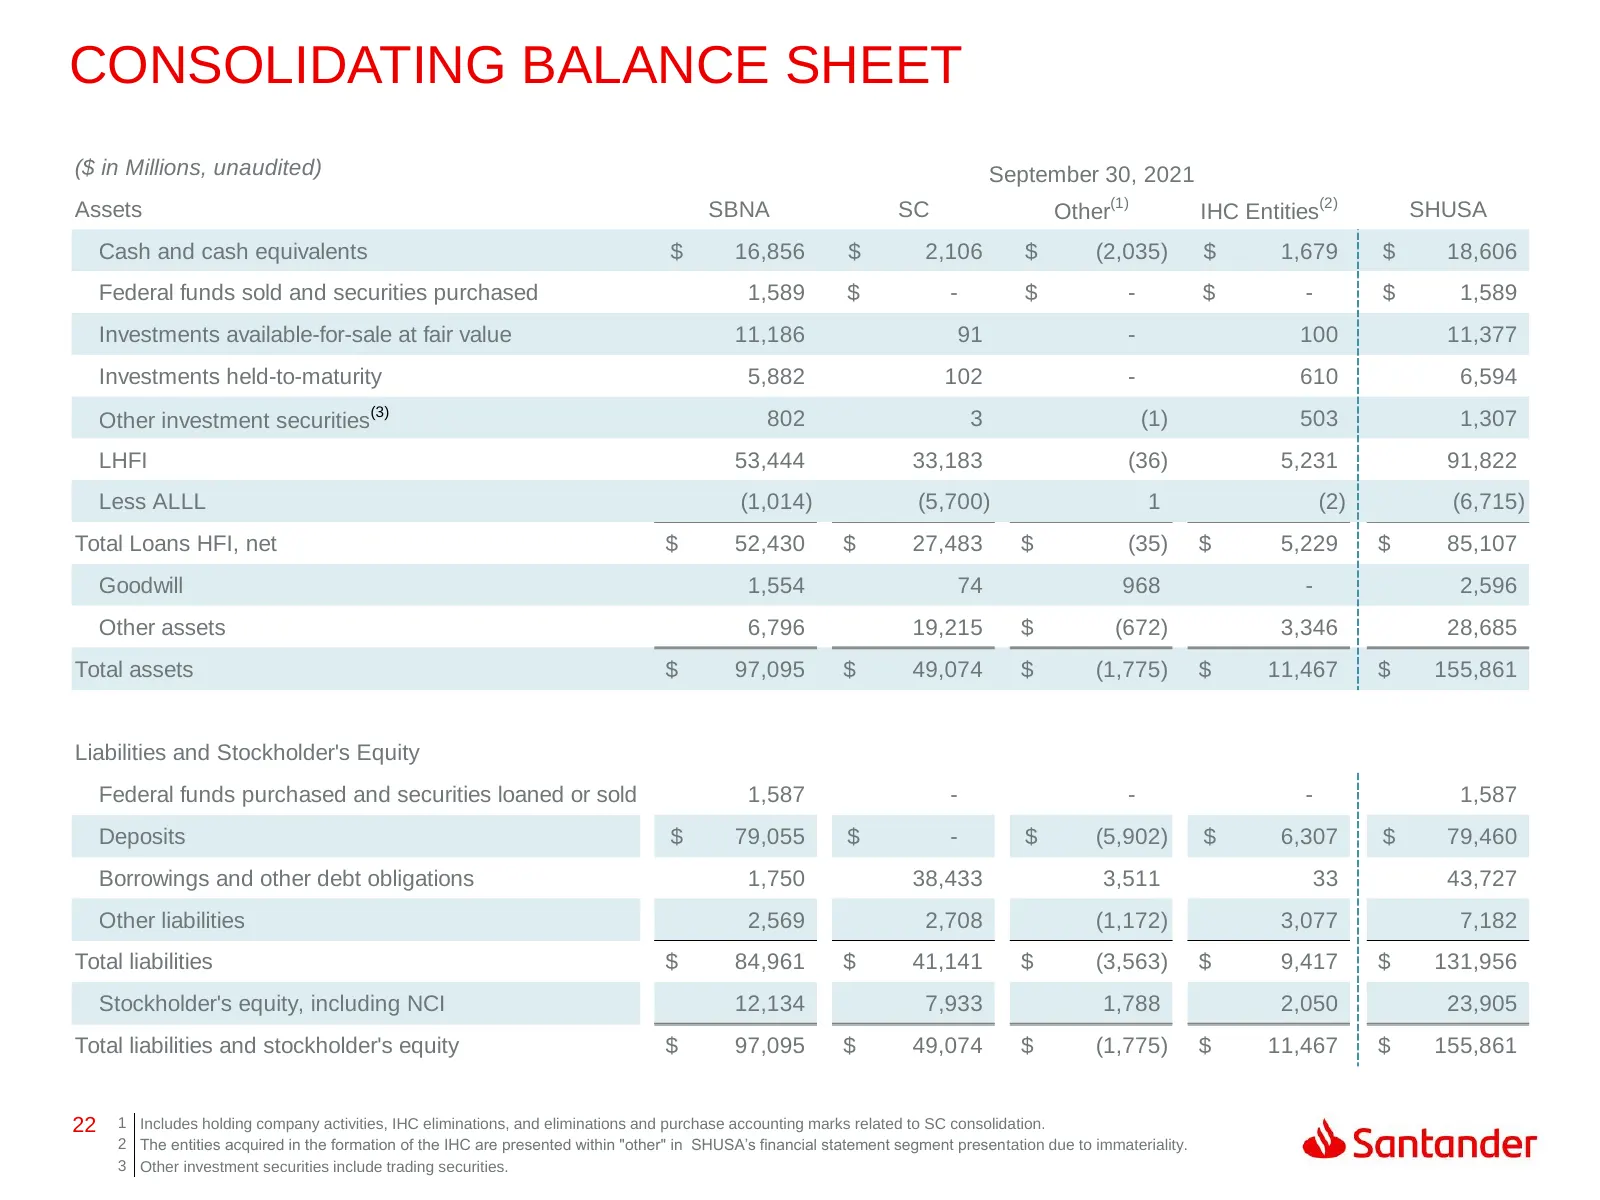
Slide 22: Consolidating Balance Sheet
CONSOLIDATING BALANCE SHEET ($ in Millions, unaudited) September 30, 2021 (1) (2) Assets SBNA SC Other IHC Entities SHUSA Cash and cash equivalents $ 16,856 $ 2,106 $ (2,035) $ 1,679 $ 18,606 Federal funds sold and securities purchased 1,589 $ - $ - $ - $ 1,589 Investments available-for-sale at fair
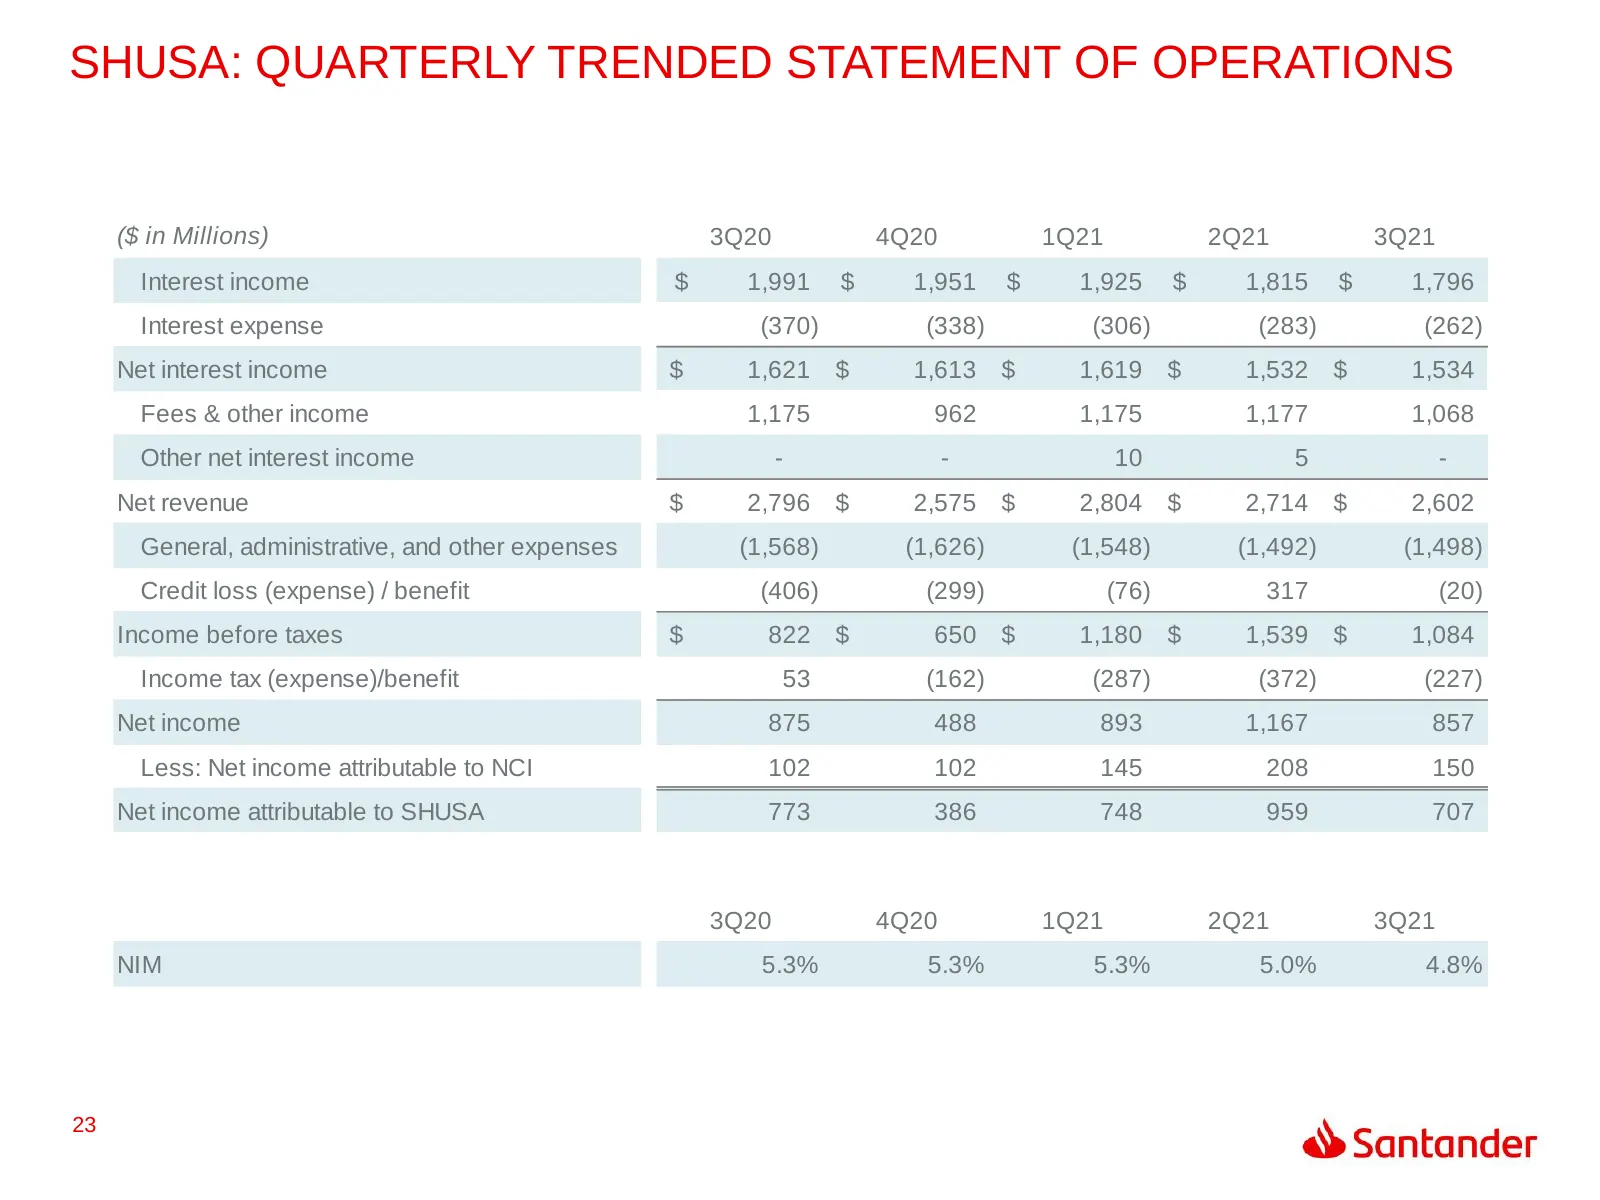
Slide 23: SHUSA: Quarterly Trended Statement of Operations
SHUSA: QUARTERLY TRENDED STATEMENT OF OPERATIONS ($ in Millions) 3Q20 4Q20 1Q21 2Q21 3Q21 Interest income $ 1,991 $ 1,951 $ 1,925 $ 1,815 $ 1,796 Interest expense (370) (338) (306) (283) (262) Net interest income $ 1,621 $ 1,613 $ 1,619 $ 1,532 $ 1,534 Fees & other income 1,175 962 1,175 1,177 1,068
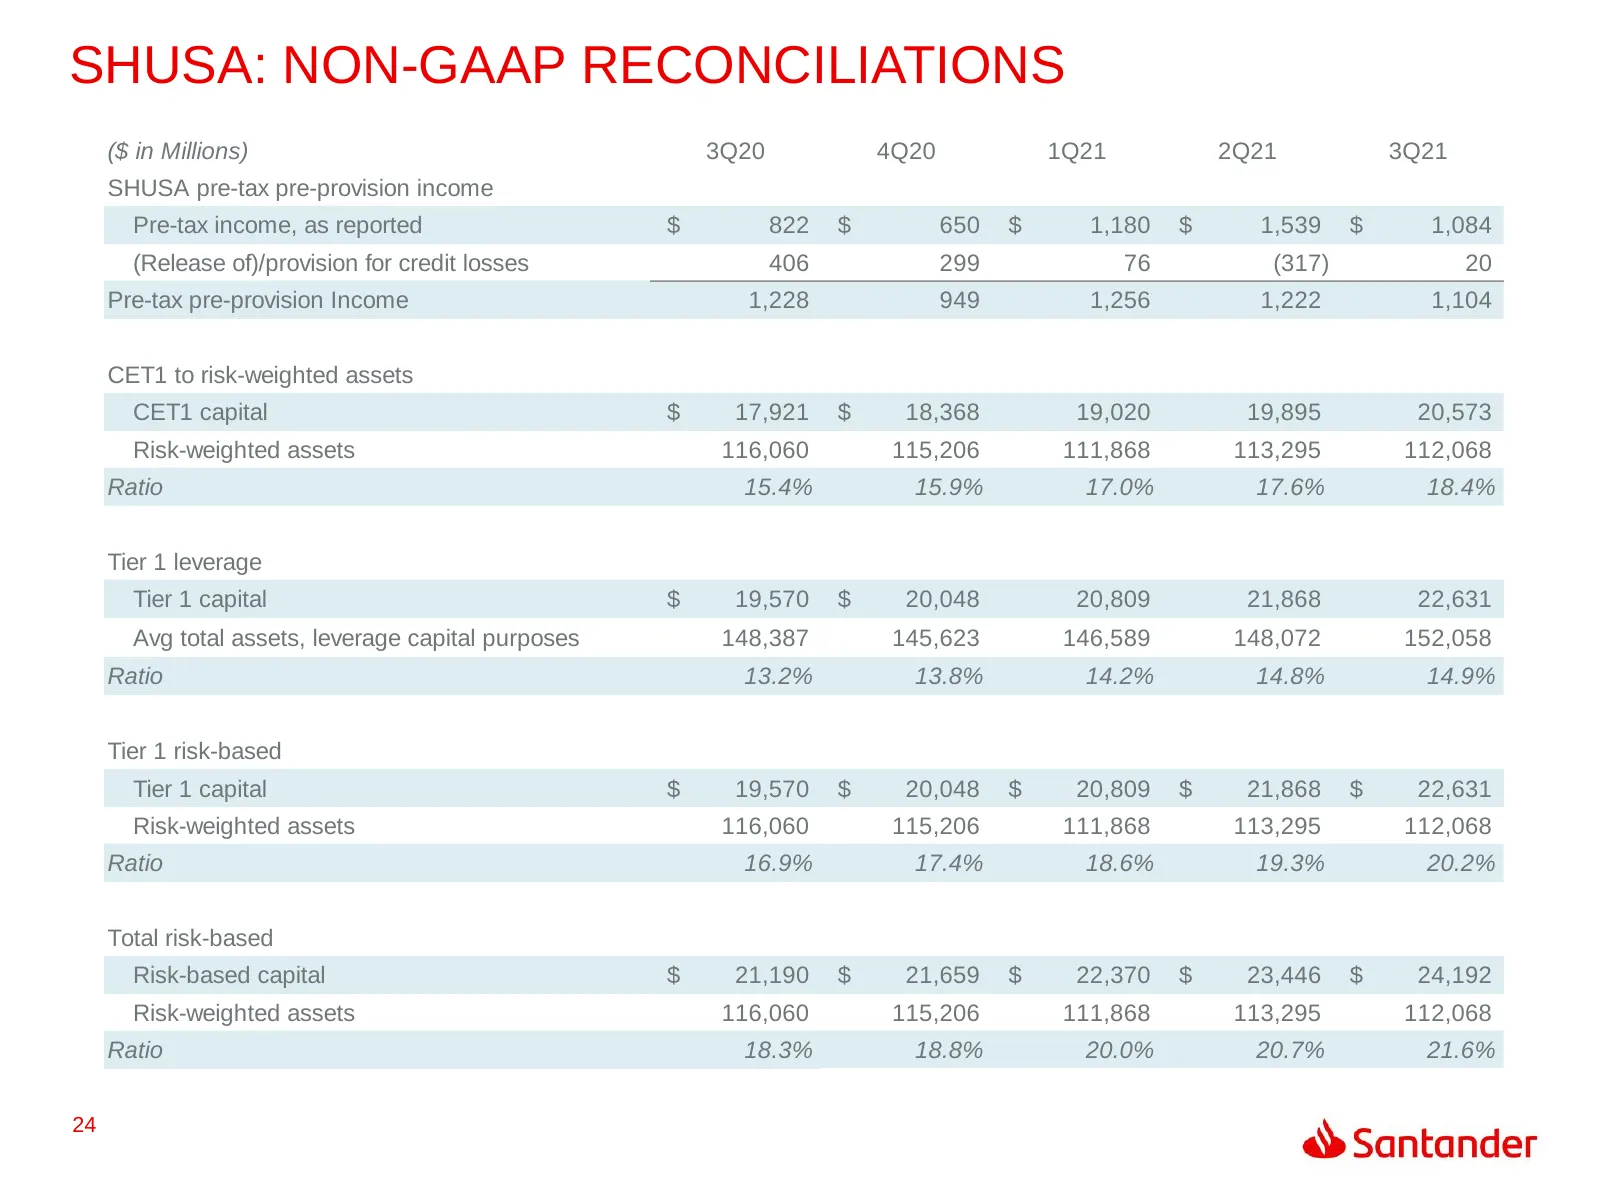
Slide 24: SHUSA: Non-GAAP Reconciliations
SHUSA: NON-GAAP RECONCILIATIONS ($ in Millions) 3Q20 4Q20 1Q21 2Q21 3Q21 SHUSA pre-tax pre-provision income Pre-tax income, as reported $ 822 $ 650 $ 1,180 $ 1,539 $ 1,084 (Release of)/provision for credit losses 406 299 76 (317) 20 Pre-tax pre-provision Income 1,228 949 1,256 1,222 1,104 CET1 to ri
Slide 25: SBNA: Quarterly Profitability
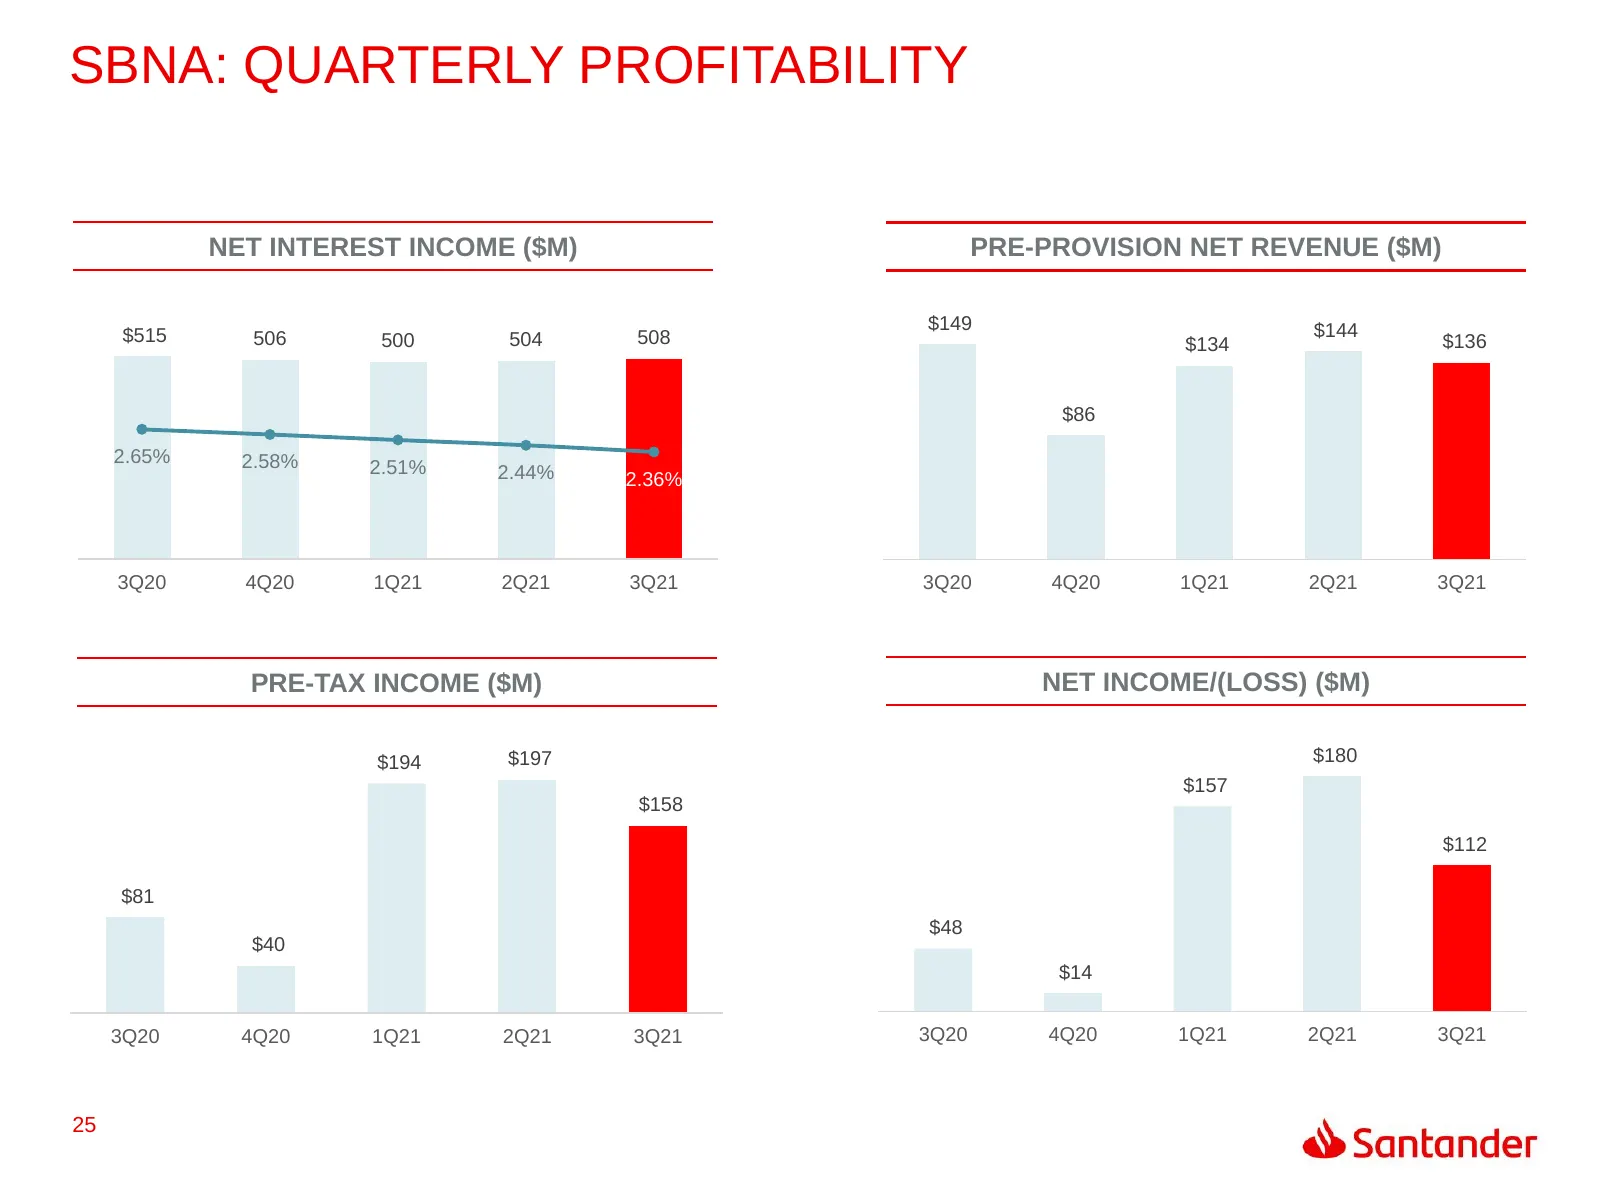
SBNA: QUARTERLY PROFITABILITY NET INTEREST INCOME ($M) PRE-PROVISION NET REVENUE ($M) $600 4.00% $149 $144 $515 506 500 504 508 $134 $136 $500 3.50% $400 3.00% $86 $300 2.50% 2.65% 2.58% 2.51% 2.44% $200 2.36% 2.00% $100 1.50% $- 1.00% 3Q20 4Q20 1Q21 2Q21 3Q21 3Q20 4Q20 1Q21 2Q21 3Q21 PRE-TAX INCOME
Slide 26: SBNA: Quarterly Trended Statement of Operations
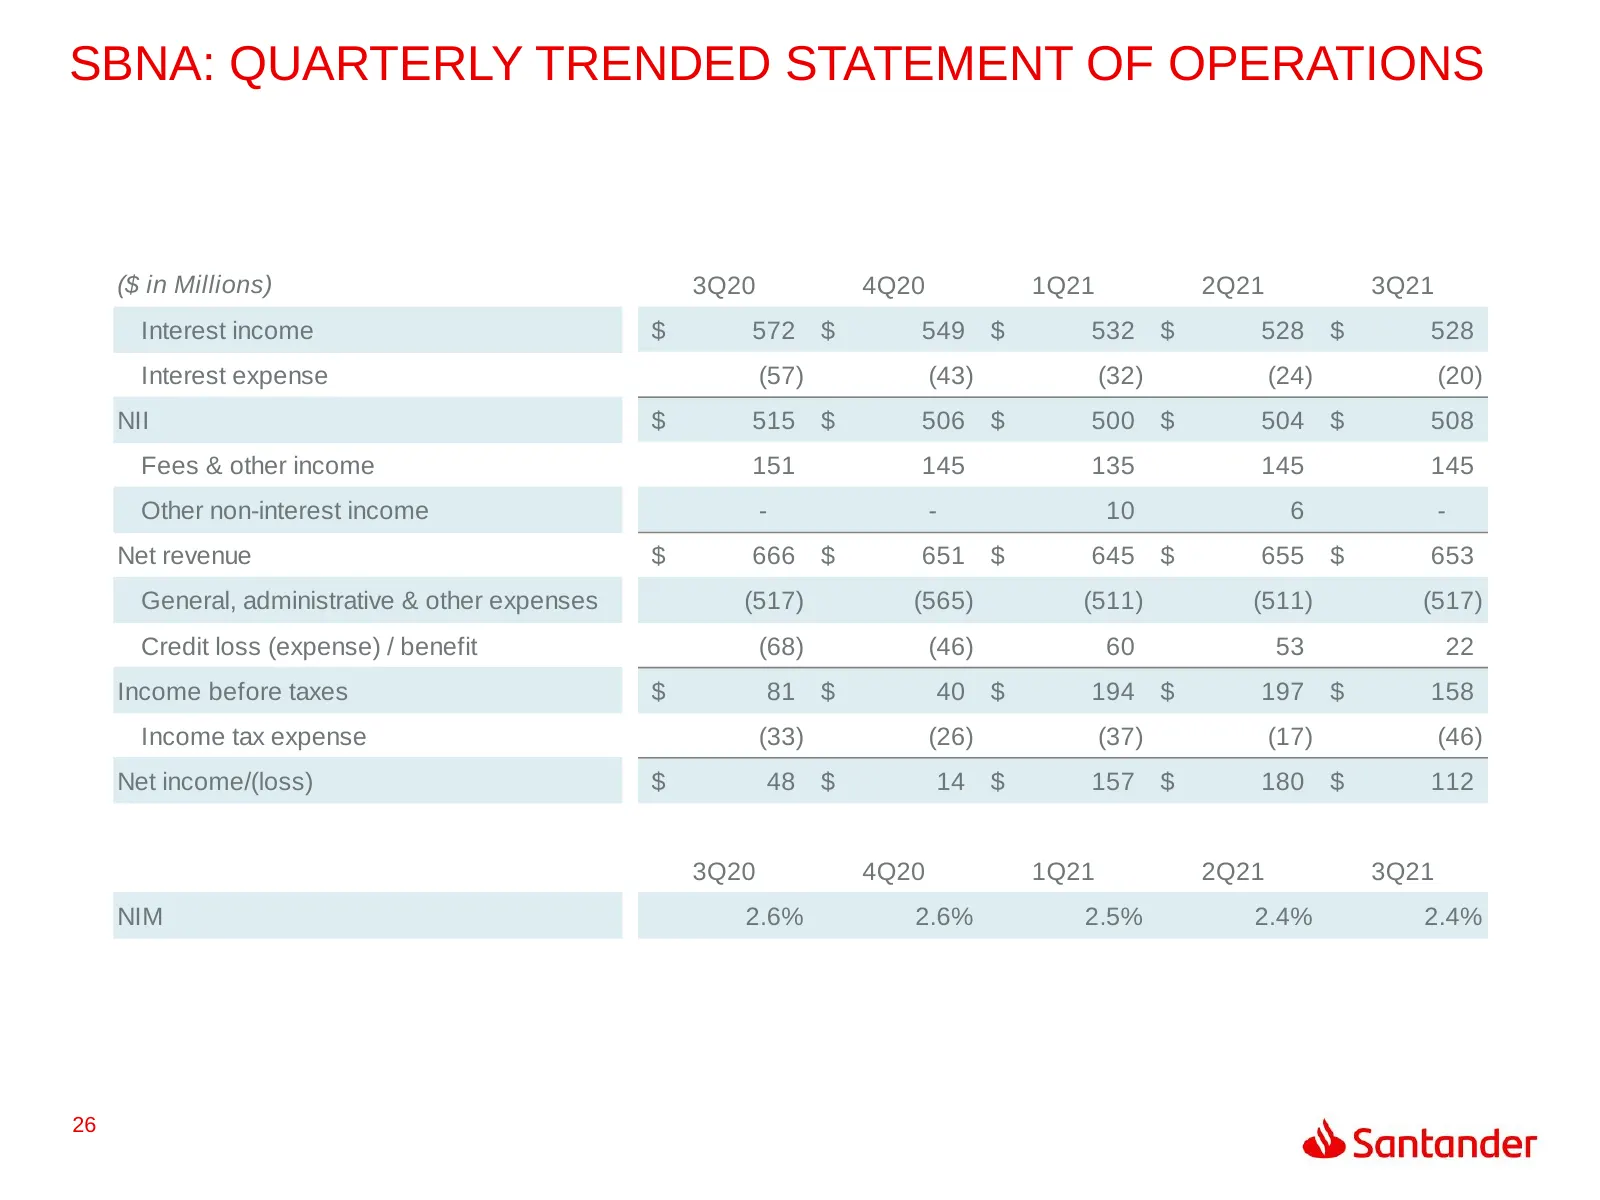
SBNA: QUARTERLY TRENDED STATEMENT OF OPERATIONS OPS ($ in Millions) 3Q20 4Q20 1Q21 2Q21 3Q21 Interest income $ 572 $ 549 $ 532 $ 528 $ 528 Interest expense (57) (43) (32) (24) (20) NII $ 515 $ 506 $ 500 $ 504 $ 508 Fees & other income 151 145 135 145 145 Other non-interest income - - 10 6 - Net reve
Slide 27: SBNA: Quarterly Average Balance Sheet
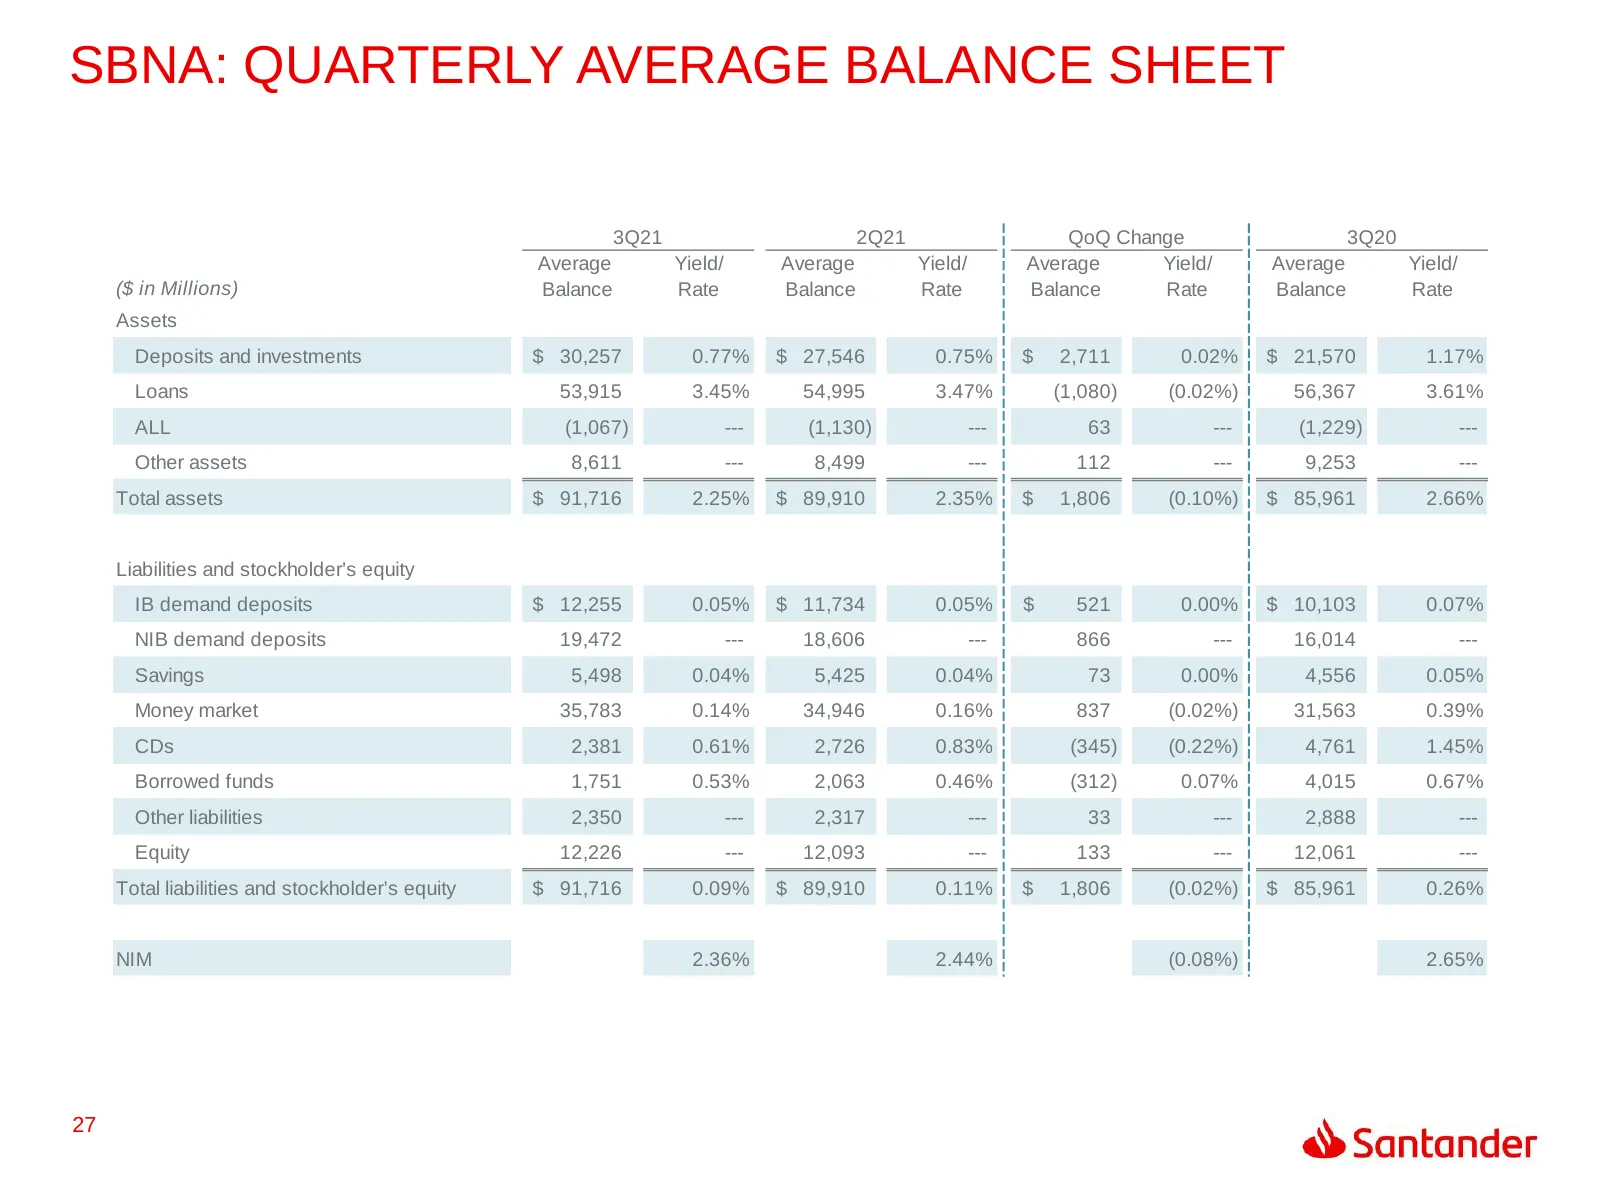
SBNA: QUARTERLY AVERAGE BALANCE SHEET 3Q21 2Q21 QoQ Change 3Q20 Average Yield/ Average Yield/ Average Yield/ Average Yield/ ($ in Millions) Balance Rate Balance Rate Balance Rate Balance Rate Assets Deposits and investments $ 30,257 0.77% $ 27,546 0.75% $ 2,711 0.02% $ 21,570 1.17% Loans 53,915 3.45
Slide 28: SBNA: Funding – Deposits
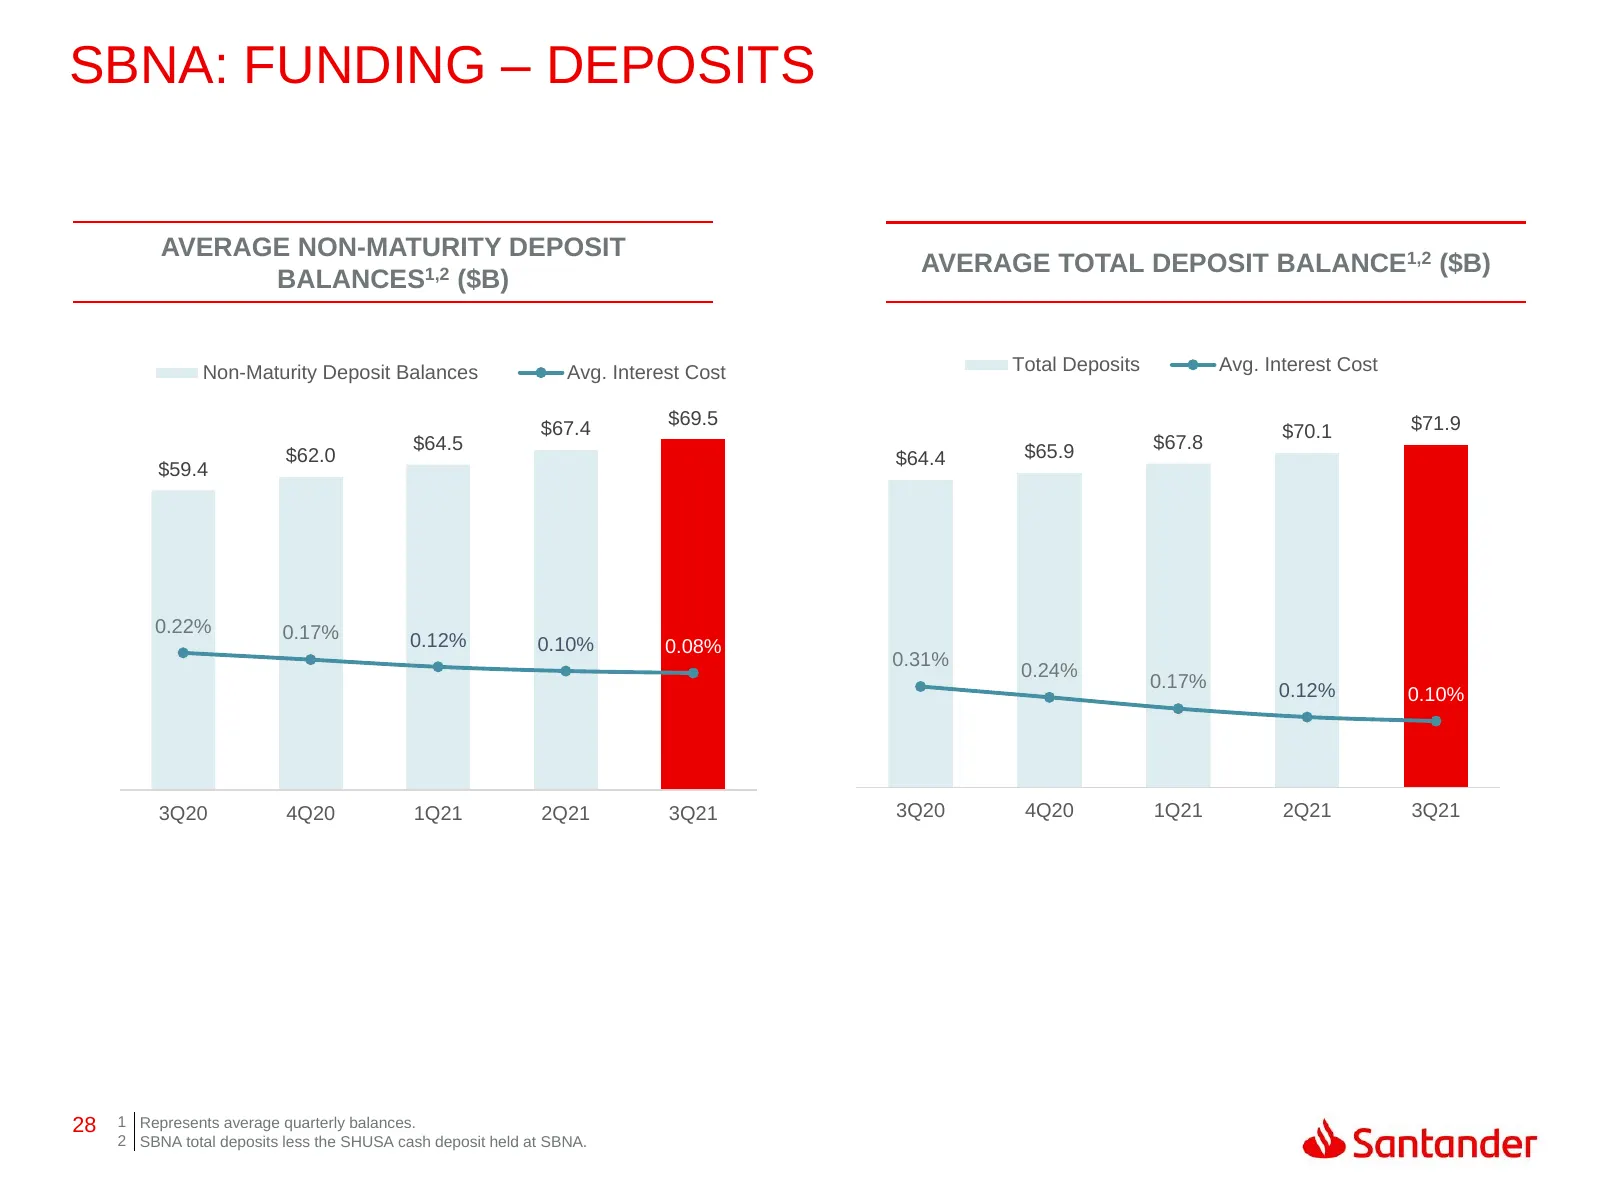
SBNA: FUNDING – DEPOSITS AVERAGE NON-MATURITY DEPOSIT AVERAGE TOTAL DEPOSIT BALANCE1,2 ($B) BALANCES1,2 ($B) Non-Maturity Deposit Balances Avg. Interest Cost Total Deposits Avg. Interest Cost 80.0 80.0 $69.5 1.80% $71.9 70.0 $67.4 $70.1 $64.5 $65.9 $67.8 $62.0 70.0 $64.4 1.70% $59.4 60.0 1.30%60.0 5
Slide 29: SBNA: Asset Quality
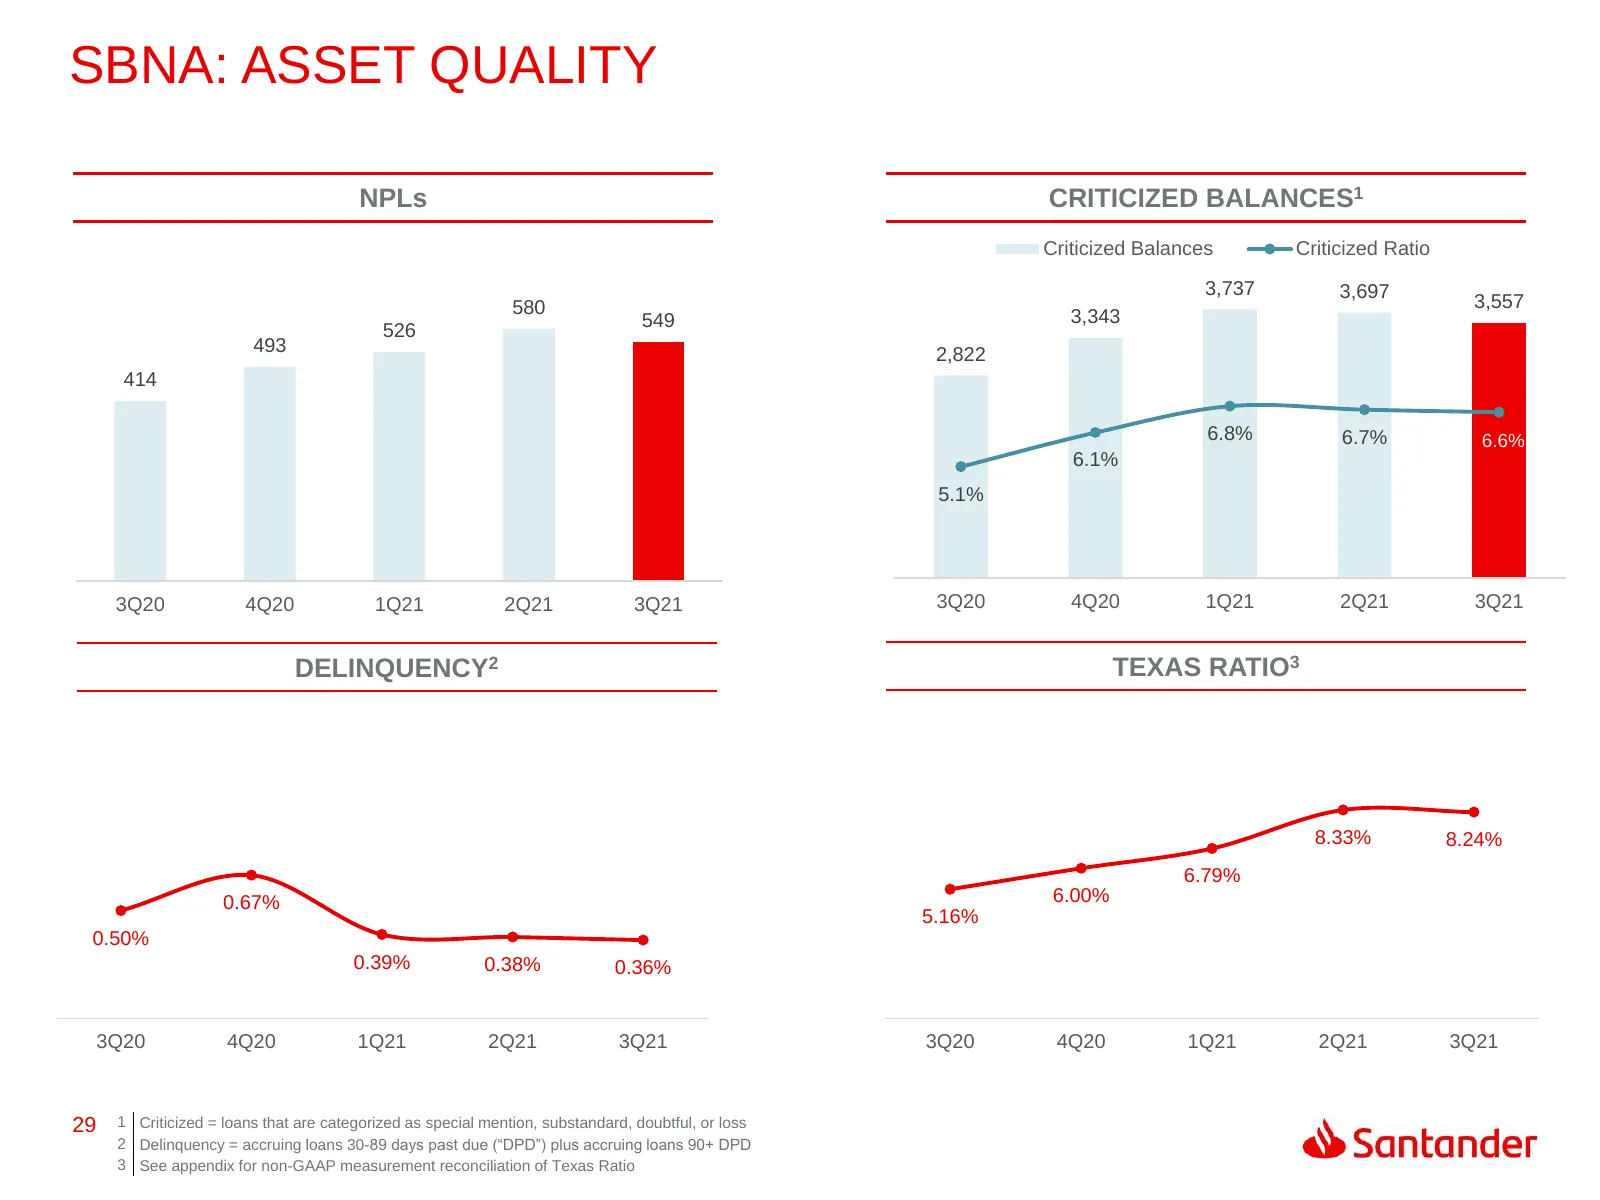
SBNA: ASSET QUALITY NPLs CRITICIZED BALANCES1 Criticized Balances Criticized Ratio 4,000 3,737 3,697 10.00% 580 3,557 549 3,343 526 3,500 9.00% 493 2,822 3,000 8.00% 414 2,500 7.00% 2,000 6.8% 6.7% 6.6% 6.00% 1,500 6.1% 5.00% 1,000 5.1% 4.00% 500 3.00% 0 2.00% 3Q20 4Q20 1Q21 2Q21 3Q21 3Q20 4Q20 1Q21
Slide 30: SBNA: Asset Quality (Continued)
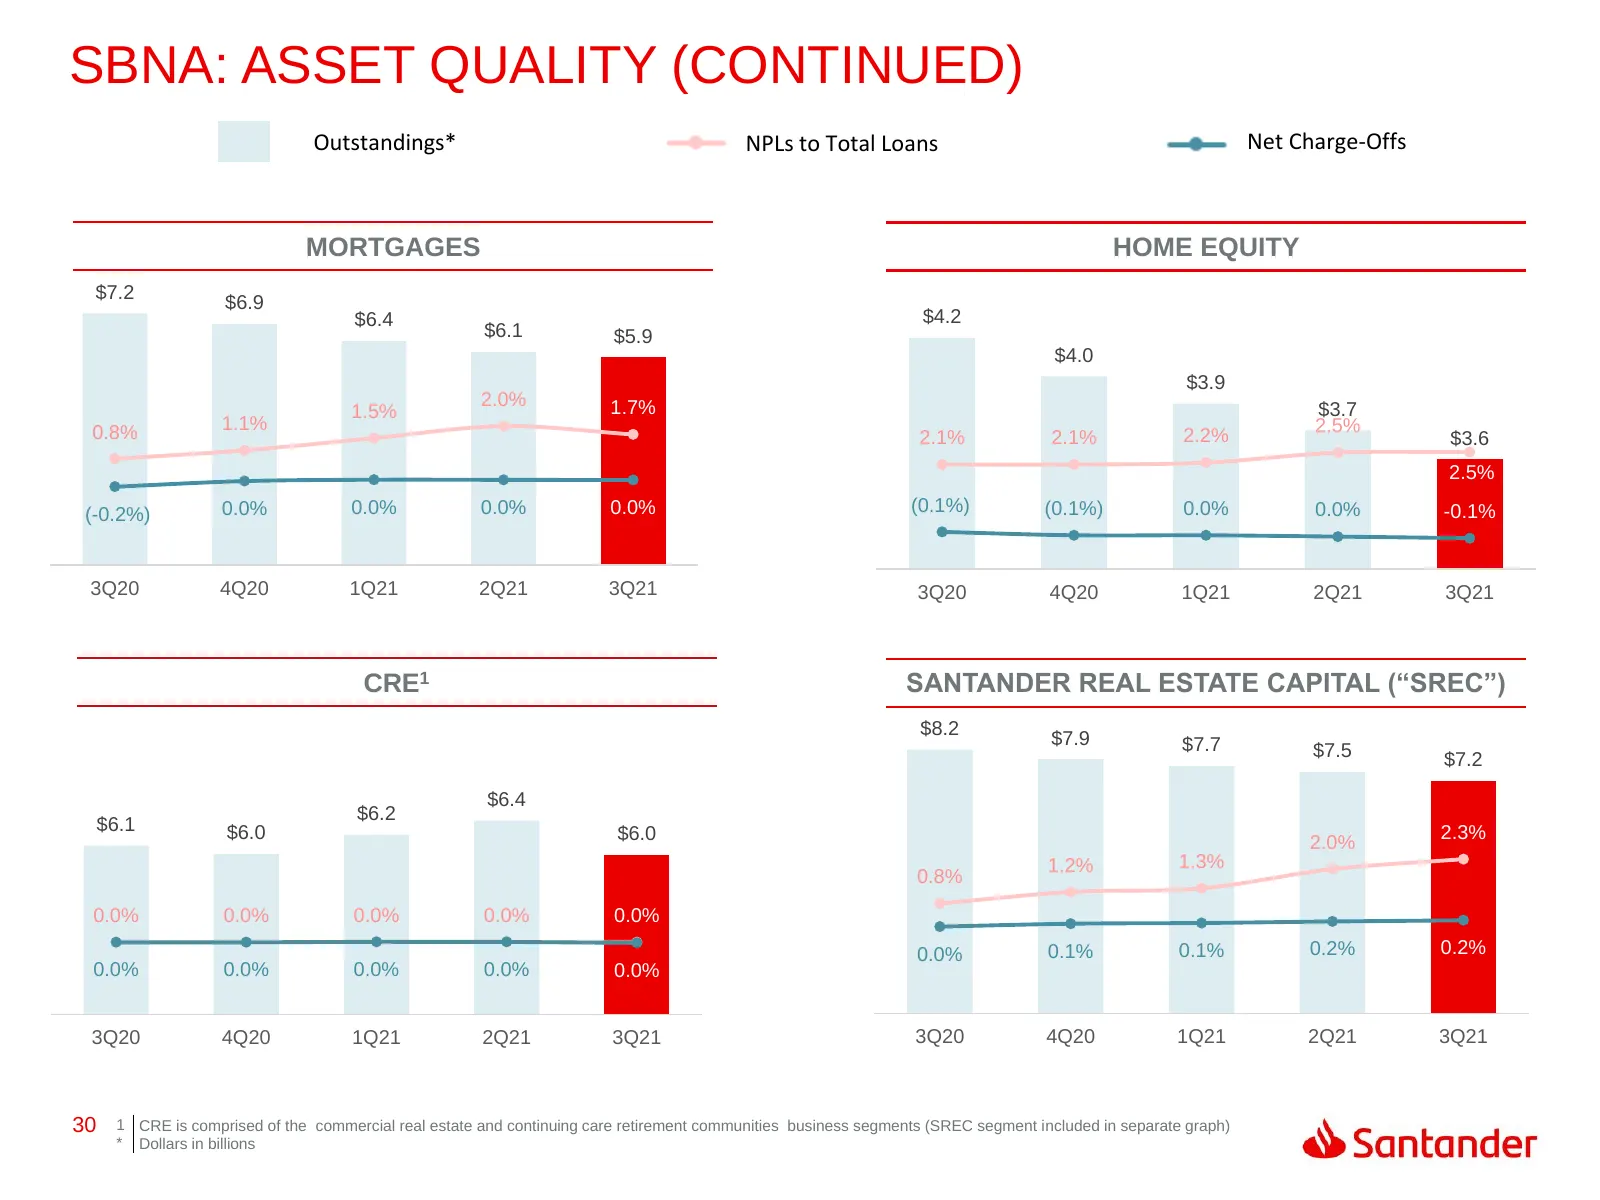
SBNA: ASSET QUALITY (CONTINUED) Outstandings* NPLs to Total Loans Net Charge-Offs MORTGAGES HOME EQUITY $8.0 7.0% $7.2 $6.9 $4.4 7.0% $7.0 $6.4 6.0% $4.2 $6.1 $5.9 5.0% $4.2 6.0% $6.0 4.0% $4.0 5.0% $3.9 $4.0 $5.0 2.0% 1.7% 3.0% $3.7 4.0% 1.5% $3.8 $4.0 0.8% 1.1% 2.0% 2.5% 2.1% 2.1% 2.2% $3.6 3.0% 1
Slide 31: SBNA: Asset Quality (Continued)
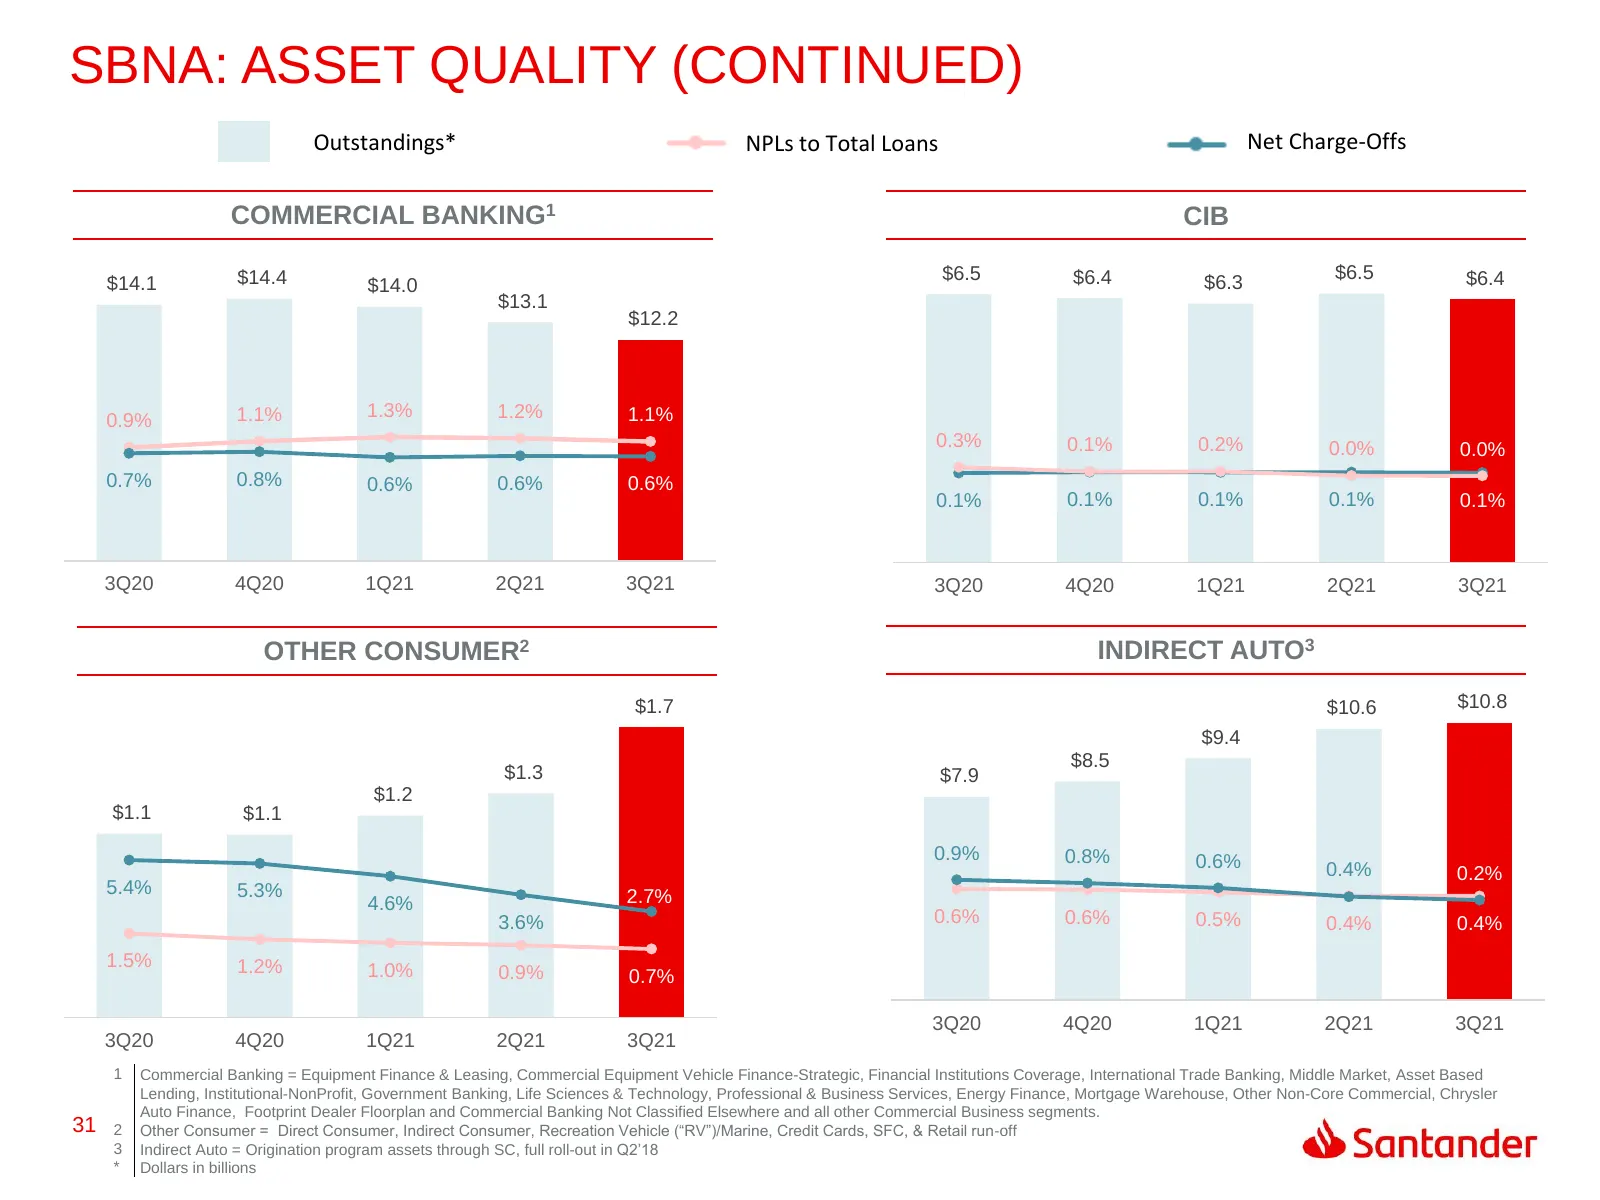
SBNA: ASSET QUALITY (CONTINUED) Outstandings* NPLs to Total Loans Net Charge-Offs COMMERCIAL BANKING1 CIB $16.0 $14.4 7.0% $7.0 $6.5 $6.4 $6.3 $6.5 $6.4 7.0% $14.1 $14.0 $14.0 $13.1 6.0% 6.0% $12.2 $6.0 5.0% 5.0% $12.0 $5.0 4.0% 4.0% $10.0 3.0% 3.0% $4.0 1.1% 1.3% 1.2% 1.1% 0.9% $8.0 2.0% 2.0% $6.0
Slide 32: SBNA: Capital Ratios
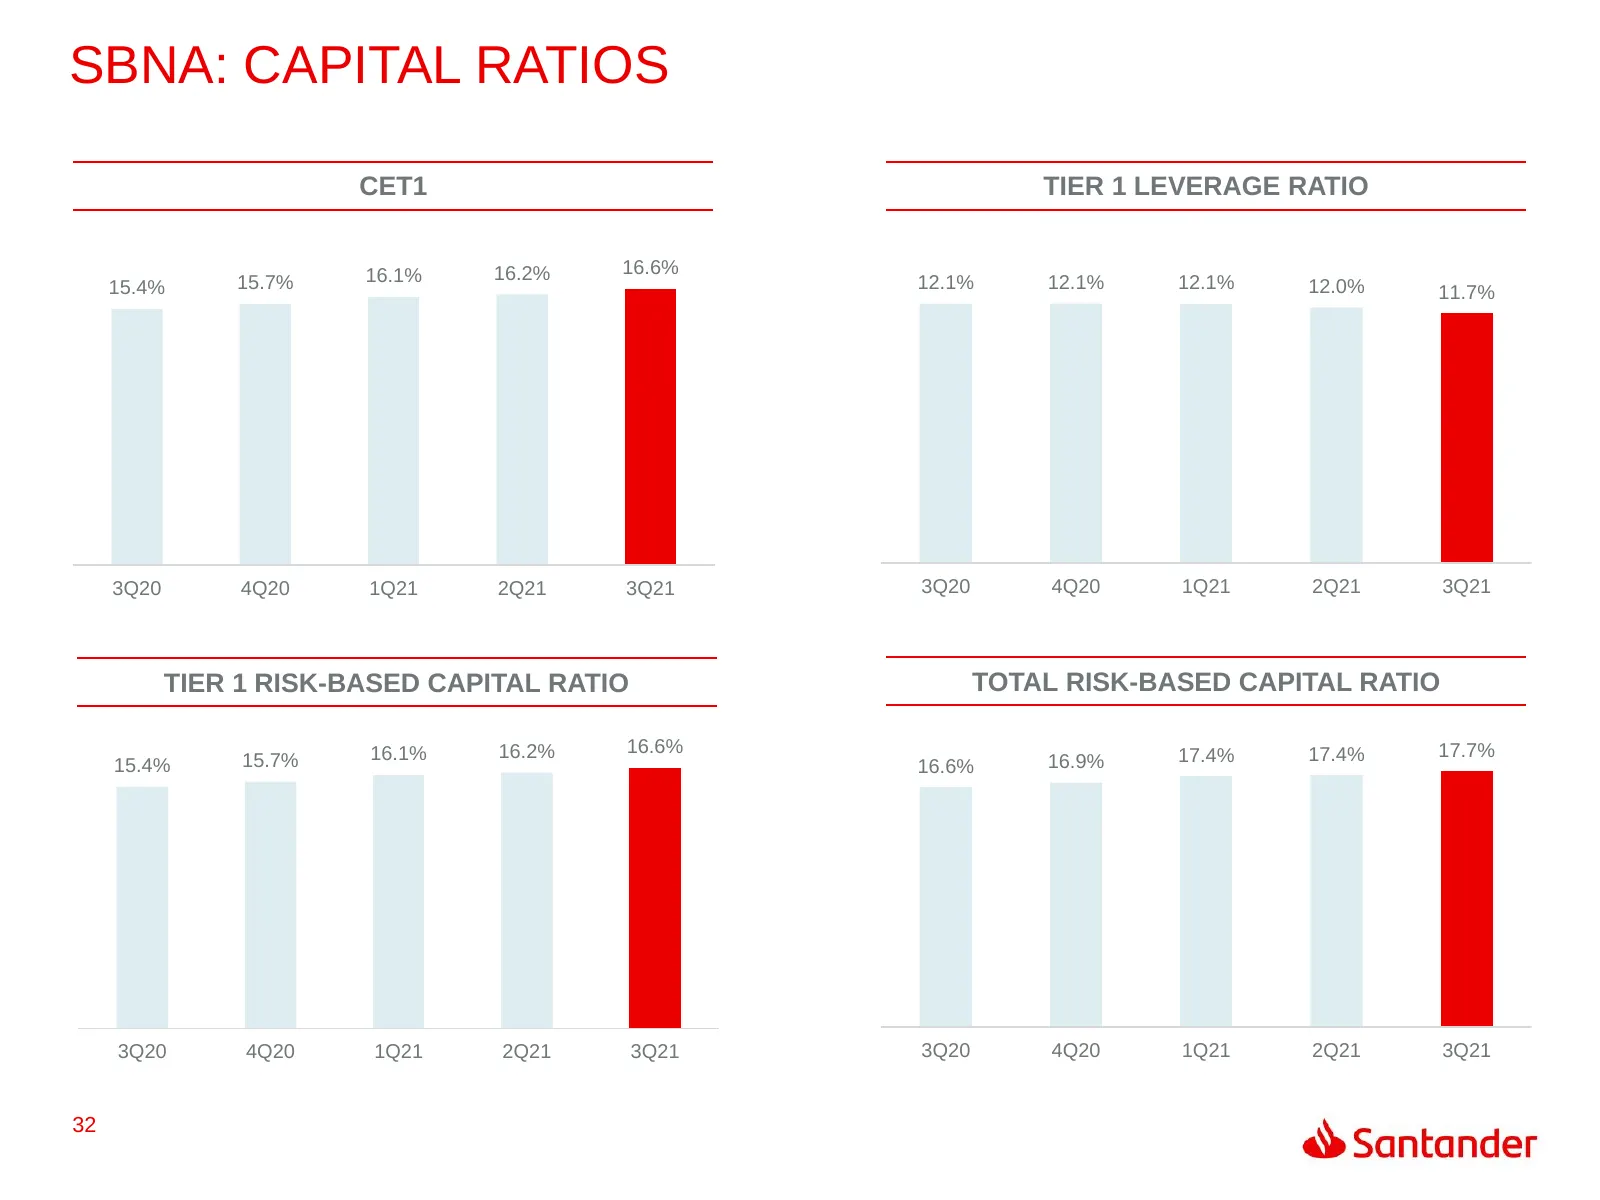
SBNA: CAPITAL RATIOS CET1 TIER 1 LEVERAGE RATIO 16.1% 16.2% 16.6% 15.4% 15.7% 12.1% 12.1% 12.1% 12.0% 11.7% 3Q20 4Q20 1Q21 2Q21 3Q21 3Q20 4Q20 1Q21 2Q21 3Q21 TIER 1 RISK-BASED CAPITAL RATIO TOTAL RISK-BASED CAPITAL RATIO 16.1% 16.2% 16.6% 17.4% 17.4% 17.7% 15.4% 15.7% 16.6% 16.9% 3Q20 4Q20 1Q21 2Q21
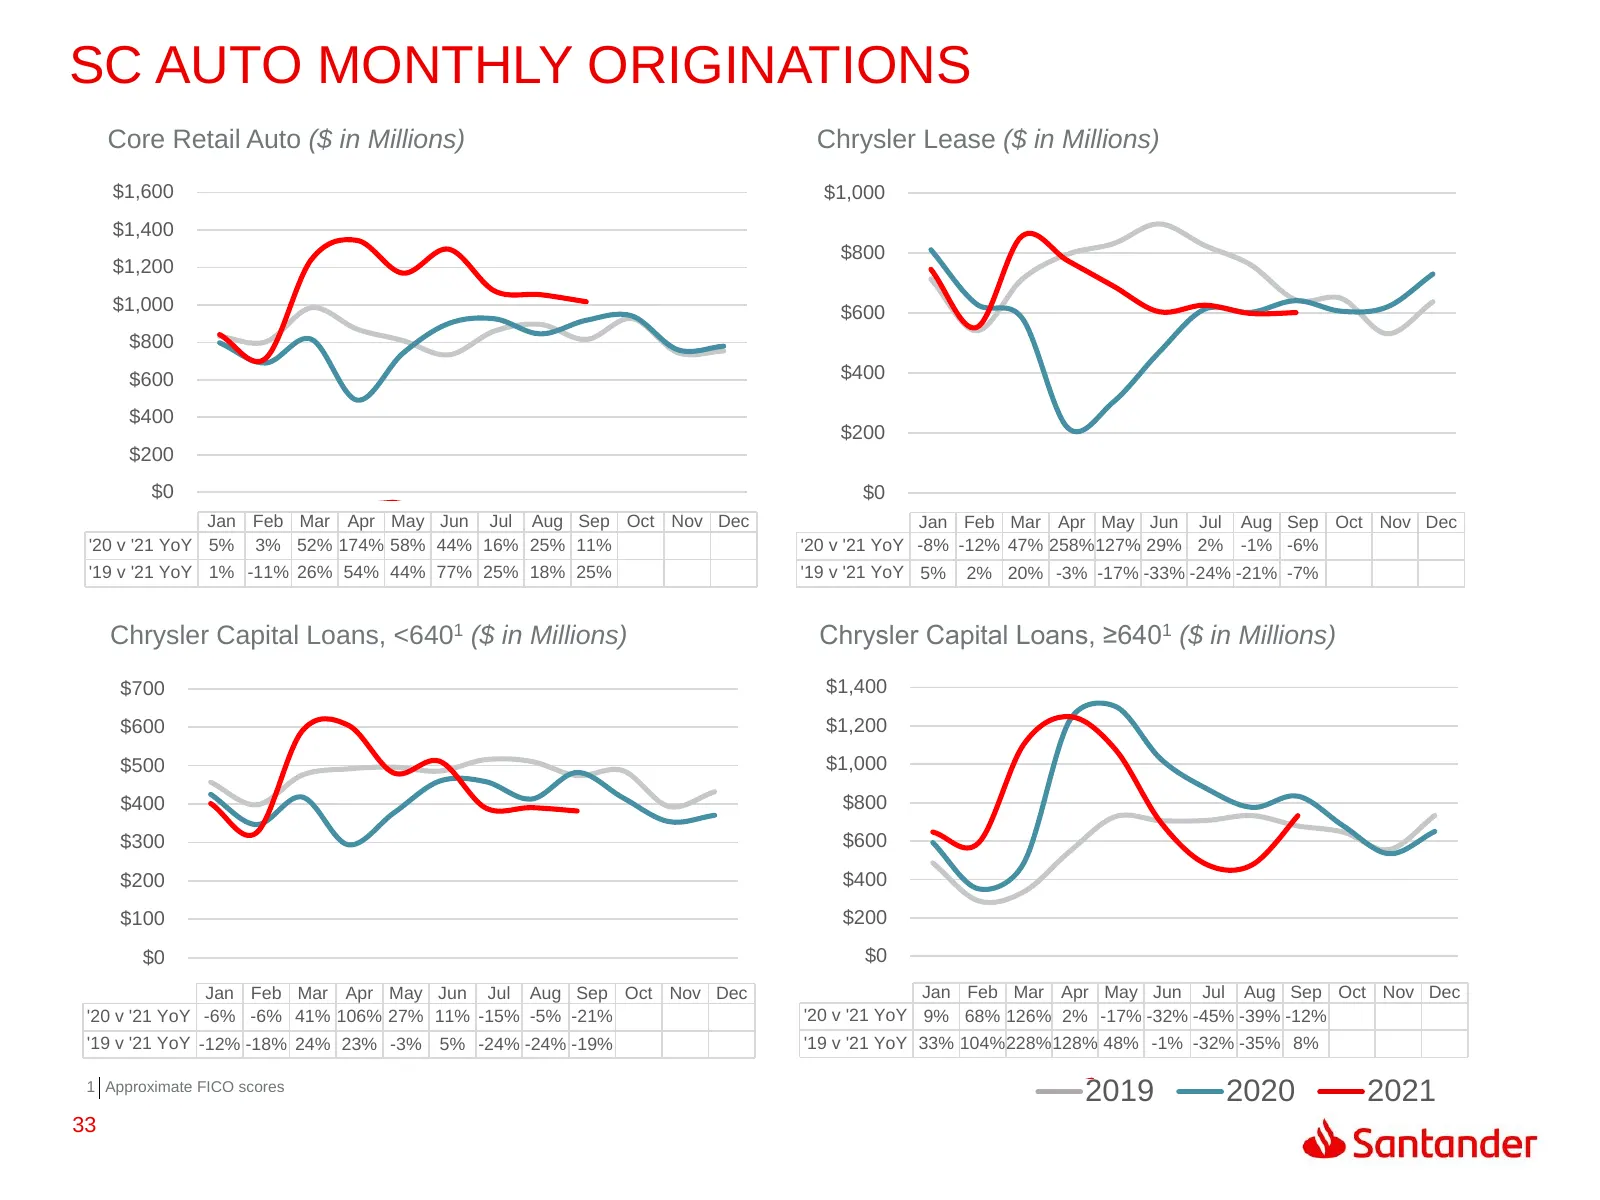
Slide 33: SC Auto Monthly Originations
SC AUTO MONTHLY ORIGINATIONS Core Retail Auto ($ in Millions) Chrysler Lease ($ in Millions) $1,600 $1,000 $1,400 $800 $1,200 $1,000 $600 $800 $600 $400 $400 $200 $200 $0 $0 Jan Feb Mar Apr May Jun Jul Aug Sep Oct Nov Dec Jan Feb Mar Apr May Jun Jul Aug Sep Oct Nov Dec '20 v '21 YoY 5% 3% 52% 174% 5
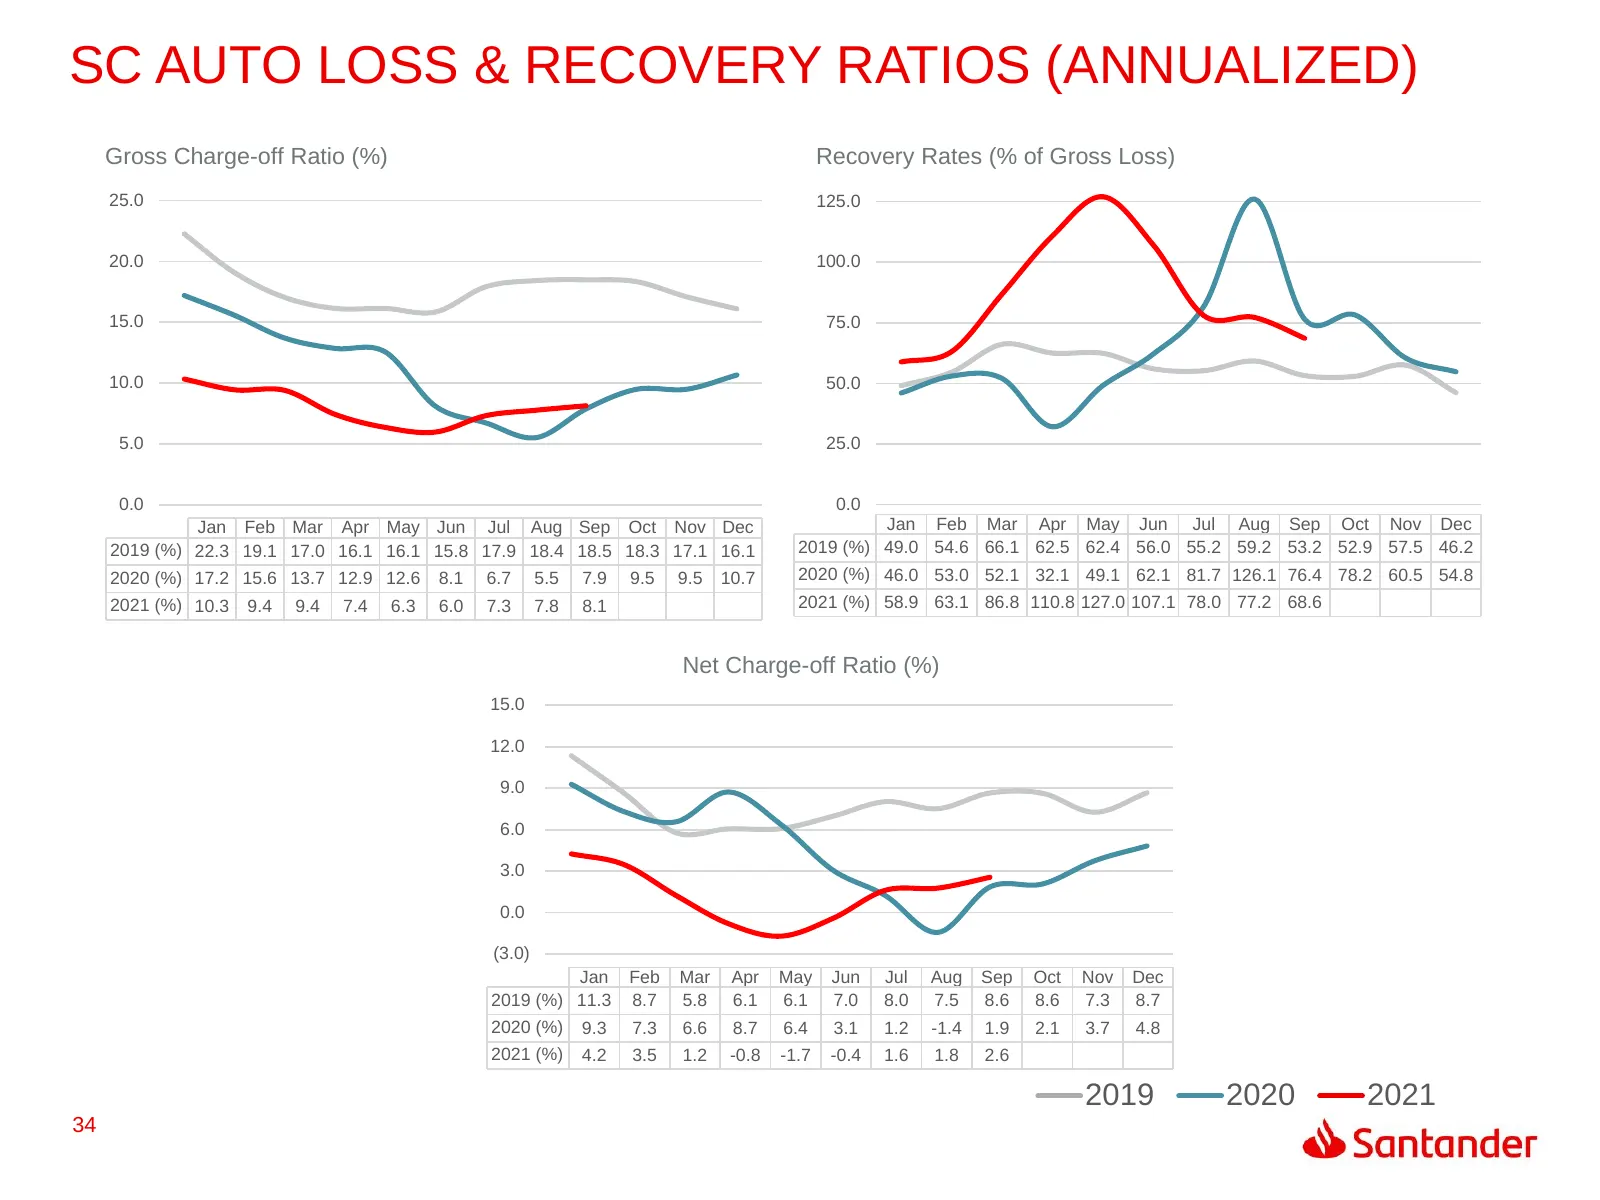
Slide 34: SC Auto Loss & Recovery Ratios (Annualized)
SC AUTO LOSS & RECOVERY RATIOS (ANNUALIZED) Gross Charge-off Ratio (%) Recovery Rates (% of Gross Loss) 25.0 125.0 20.0 100.0 15.0 75.0 10.0 50.0 5.0 25.0 0.0 0.0 Jan Feb Mar Apr May Jun Jul Aug Sep Oct Nov Dec Jan Feb Mar Apr May Jun Jul Aug Sep Oct Nov Dec 2019 (%) 22.3 19.1 17.0 16.1 16.1 15.8 17
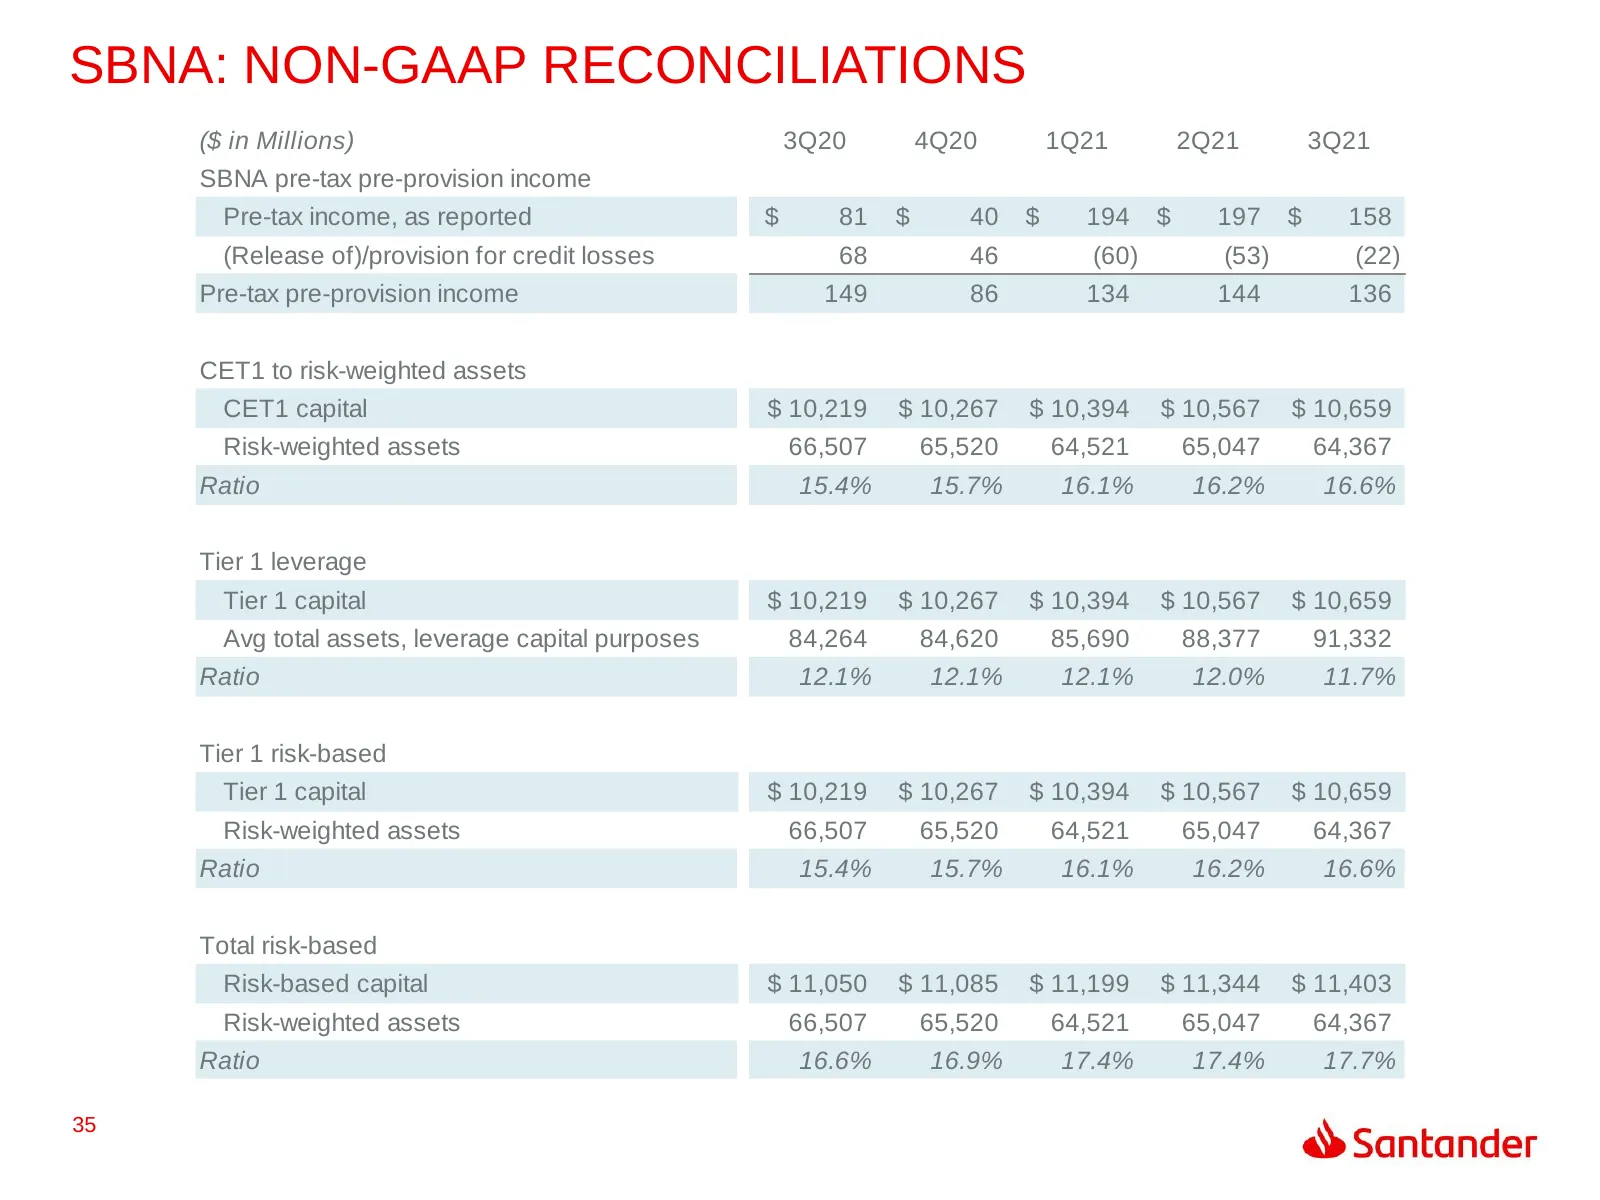
Slide 35: SBNA: Non-GAAP Reconciliations
SBNA: NON-GAAP RECONCILIATIONS ($ in Millions) 3Q20 4Q20 1Q21 2Q21 3Q21 SBNA pre-tax pre-provision income Pre-tax income, as reported $ 81 $ 40 $ 194 $ 197 $ 158 (Release of)/provision for credit losses 68 46 (60) (53) (22) Pre-tax pre-provision income 149 86 134 144 136 CET1 to risk-weighted assets
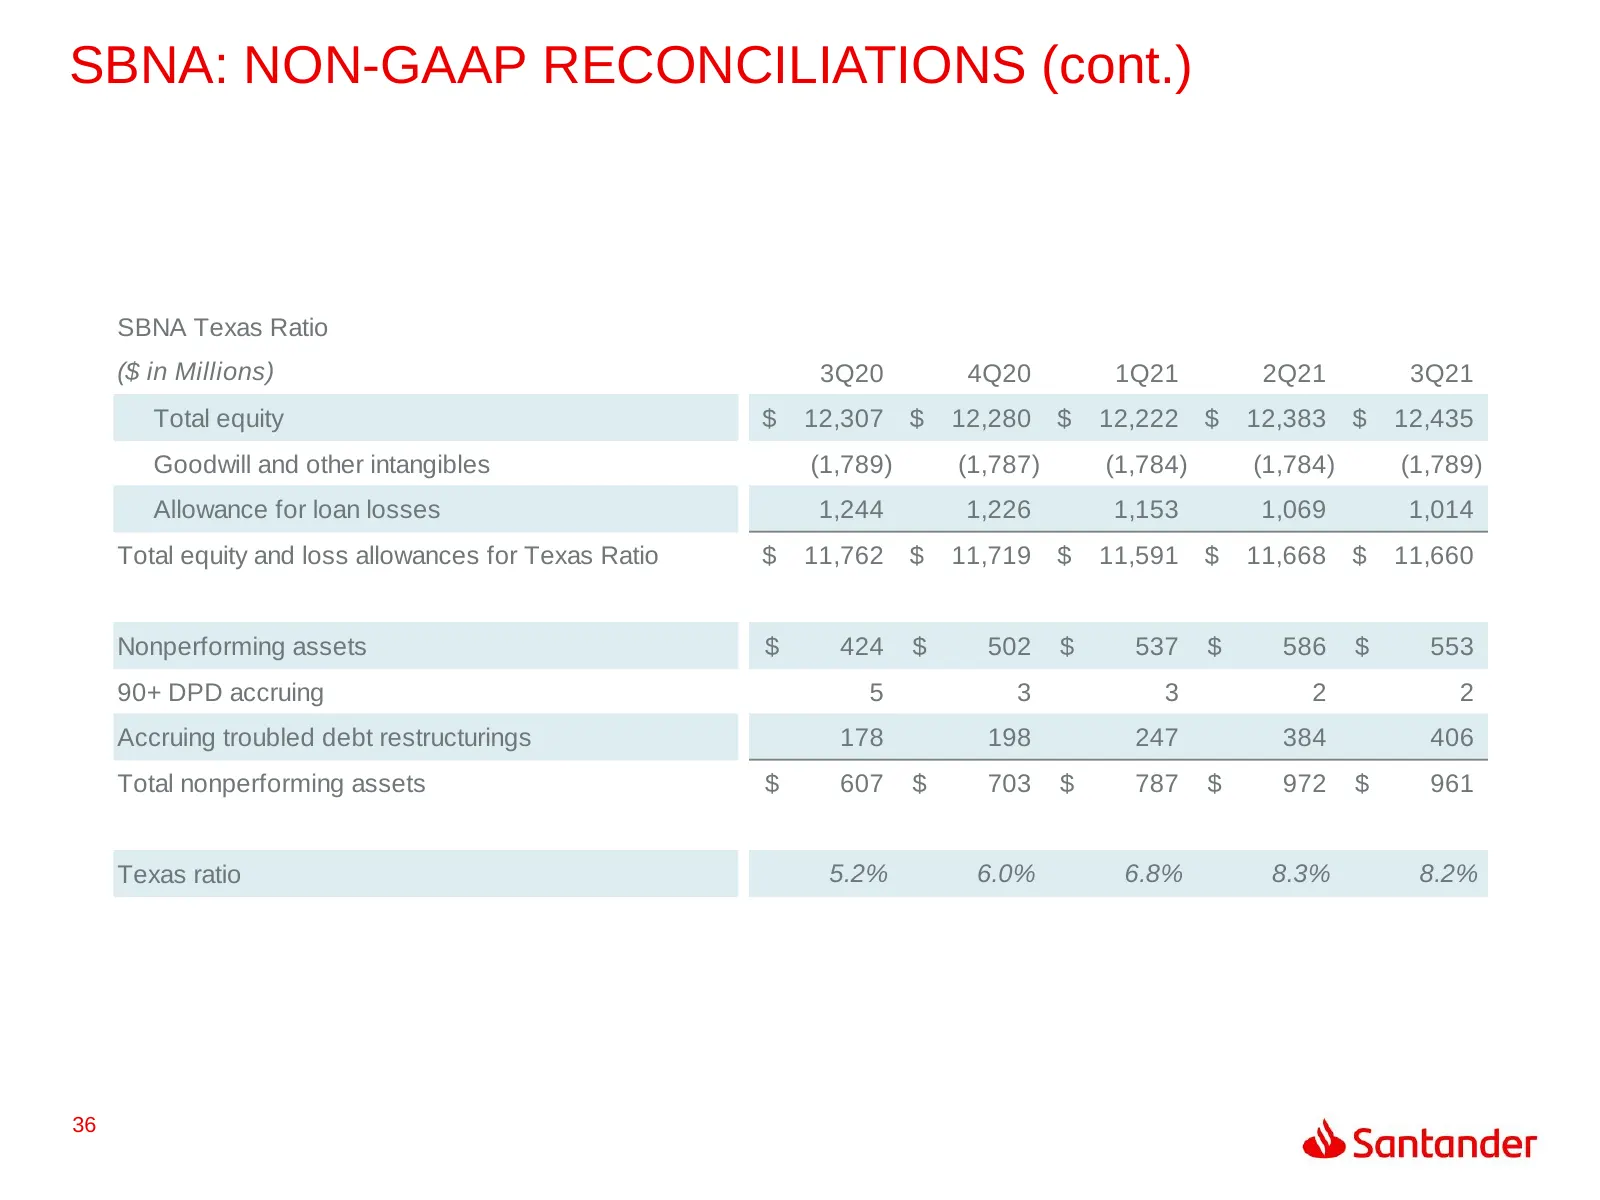
Slide 36: SBNA: Non-GAAP Reconciliations (cont.)
SBNA: NON-GAAP RECONCILIATIONS (cont.) SBNA Texas Ratio ($ in Millions) 3Q20 4Q20 1Q21 2Q21 3Q21 Total equity $ 12,307 $ 12,280 $ 12,222 $ 12,383 $ 12,435 Goodwill and other intangibles (1,789) (1,787) (1,784) (1,784) (1,789) Allowance for loan losses 1,244 1,226 1,153 1,069 1,014 Total equity and l
Slide 37: Thank You
THANK YOU Our purpose is to help people and businesses prosper. Our culture is based on believing that everything we do should be:
Source: company website
More decks from Santander Holdings USA Inc
 Debt Investor Presentation (August 2026)30 slides · Aug 12, 2026
 Debt Investor Presentation (August 2026)30 slides · Aug 12, 2026
 Debt Investor Presentation (June 2026)29 slides · Jun 12, 2026
 Debt Investor Presentation (June 2026)29 slides · Jun 12, 2026
 Debt Investor Presentation (March 2026)36 slides · Mar 6, 2026
 Debt Investor Presentation (March 2026)36 slides · Mar 6, 2026