Massey Energy — Corporate Update (September 2005)
21 slides from Massey Energy's corporate update, Sep 29, 2005
Slide 1: Transportation Overview
Transportation Overview Tom Kielty Vice President, Transportation and Distribution September 27, 2005
Slide 2: Transportation
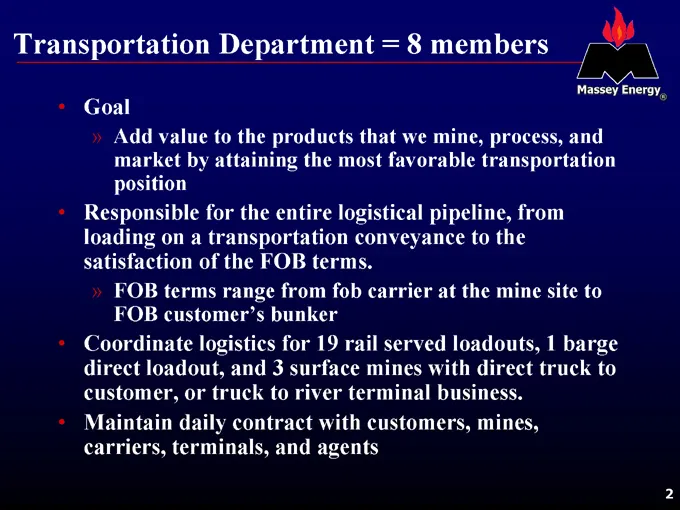
Transportation Department = 8 members Goal Add value to the products that we mine, process, and market by attaining the most favorable transportation position Responsible for the entire logistical pipeline, from loading on a transportation conveyance to the satisfaction of the FOB terms. FOB terms r
Slide 3: Rail Served Loadouts
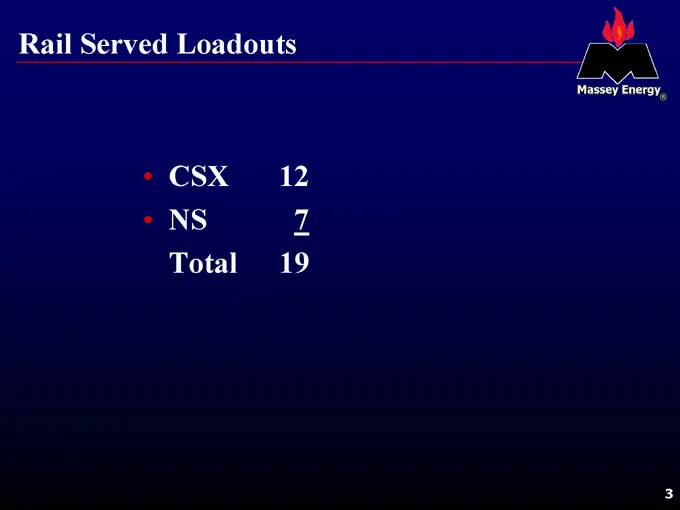
Rail Served Loadouts CSX 12 NS 7 Total 19
Slide 4: Tonnage Distribution
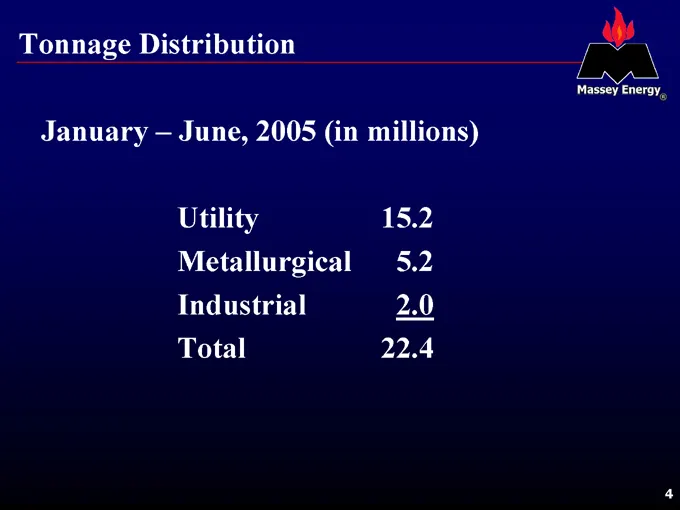
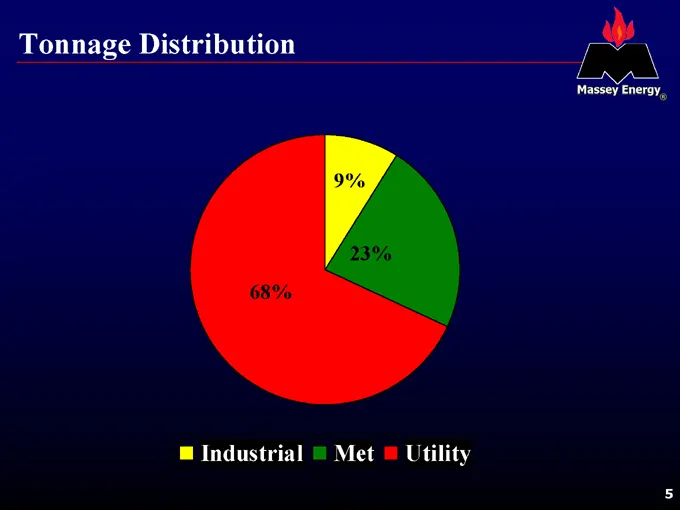
Tonnage Distribution January – June, 2005 (in millions) Utility 15.2 Metallurgical 5.2 Industrial 2.0 Total 22.4
Slide 5: Tonnage Distribution
Tonnage Distribution 9% 23% 68% Industrial Met Utility
Slide 6: 2005 Massey Energy Tons
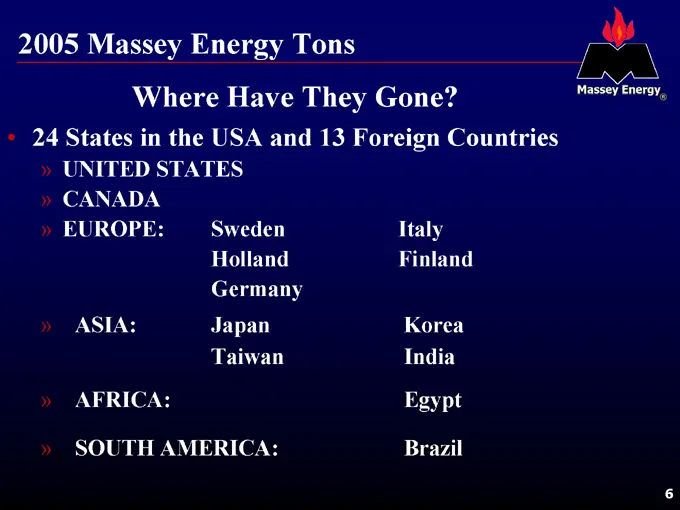
2005 Massey Energy Tons Where Have They Gone? 24 States in the USA and 13 Foreign Countries UNITED STATES CANADA EUROPE: Sweden Holland Germany Italy Finland ASIA: Japan Taiwan Korea India AFRICA: Egypt SOUTH AMERICA: Brazil
Slide 7: Export and USA Tonnage
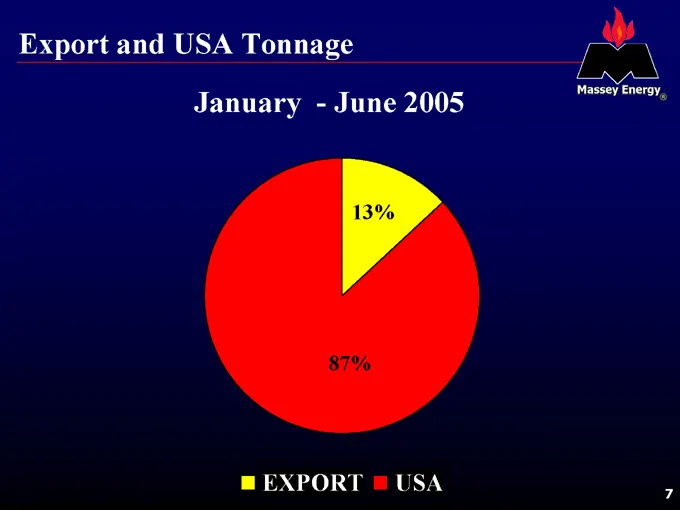
Export and USA Tonnage January—June 2005 13% 87% EXPORT USA
Slide 8: 2005 Great Lakes Tons
2005 Great Lakes Tons 1.6 Million Tons 7% of our Total
Slide 9: Inland River System 2005
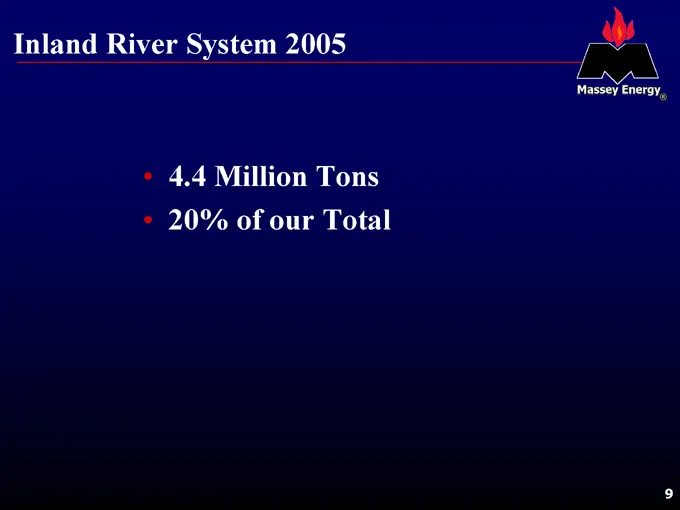
Inland River System 2005 4.4 Million Tons 20% of our Total
Slide 10: Tonnage Distribution by Mode
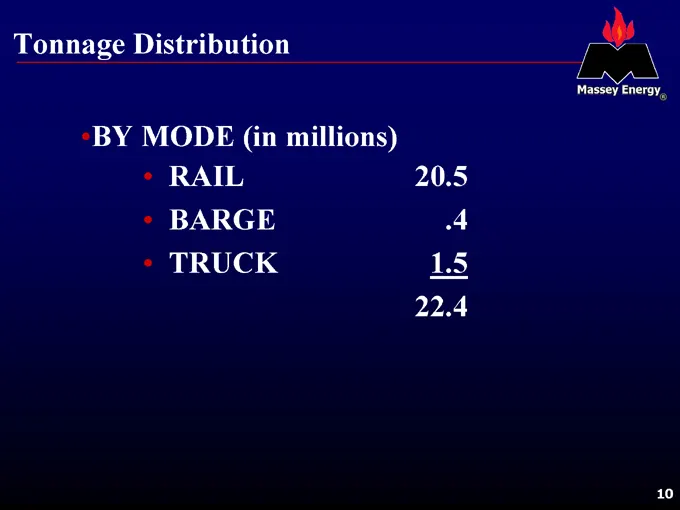
Tonnage Distribution BY MODE (in millions) RAIL 20.5 BARGE .4 TRUCK 1.5 22.4
Slide 11: Transportation Distribution
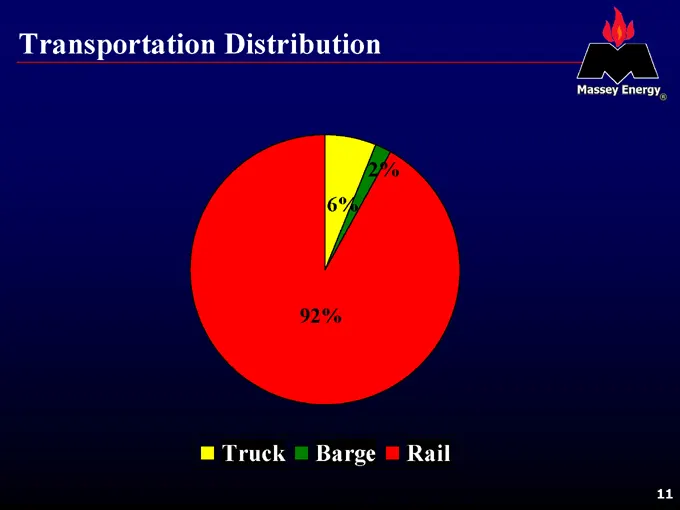
Transportation Distribution 6% 2% 92% Truck Barge Rail
Slide 12: Rail Tonnage Distribution by Carrier
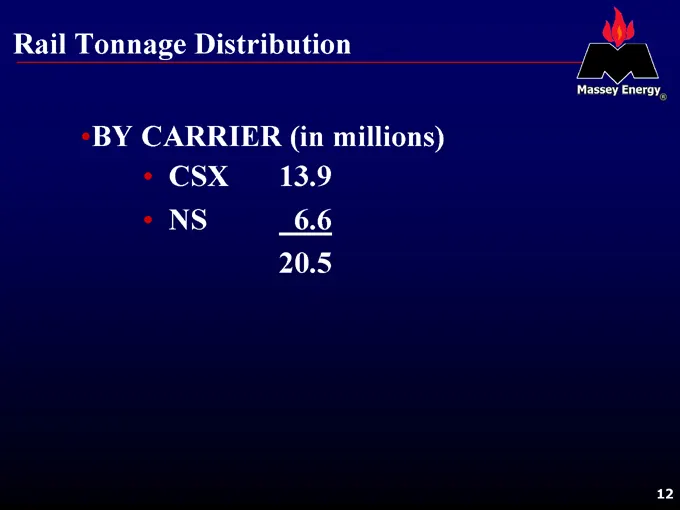
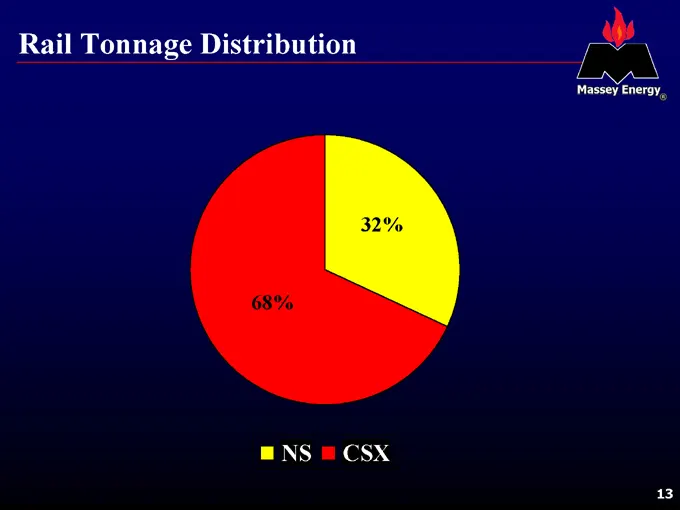
Rail Tonnage Distribution BY CARRIER (in millions) CSX 13.9 NS 6.6 20.5
Slide 13: Rail Tonnage Distribution
Rail Tonnage Distribution 68% 32% NS CSX
Slide 14: Working With Railroads to Maximize Efficiencies
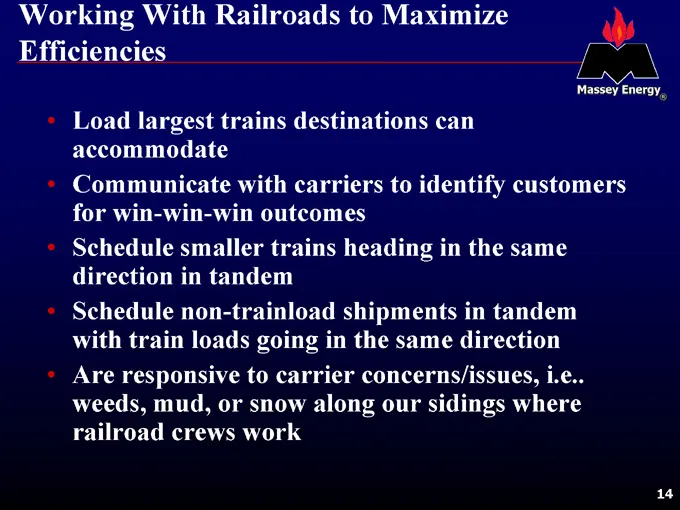
Working With Railroads to Maximize Efficiencies Load largest trains destinations can accommodate Communicate with carriers to identify customers for win-win-win outcomes Schedule smaller trains heading in the same direction in tandem Schedule non-trainload shipments in tandem with train loads going
Slide 15: Transportation Issues—2005
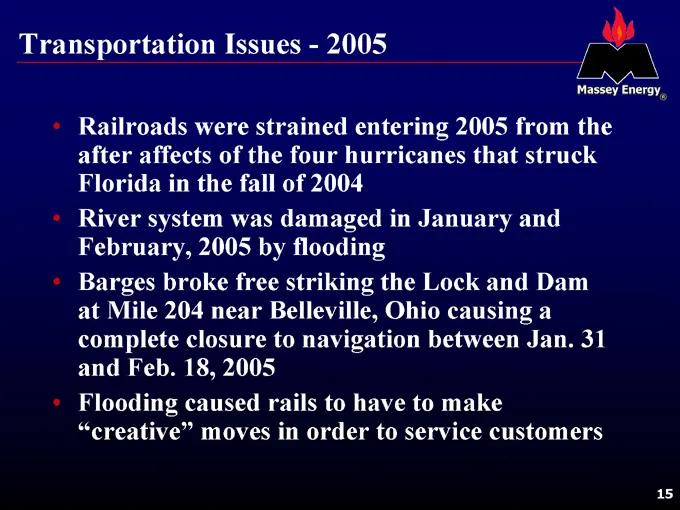
Transportation Issues—2005 Railroads were strained entering 2005 from the after affects of the four hurricanes that struck Florida in the fall of 2004 River system was damaged in January and February, 2005 by flooding Barges broke free striking the Lock and Dam at Mile 204 near Belleville, Ohio caus
Slide 16: Transportation Issues—2005
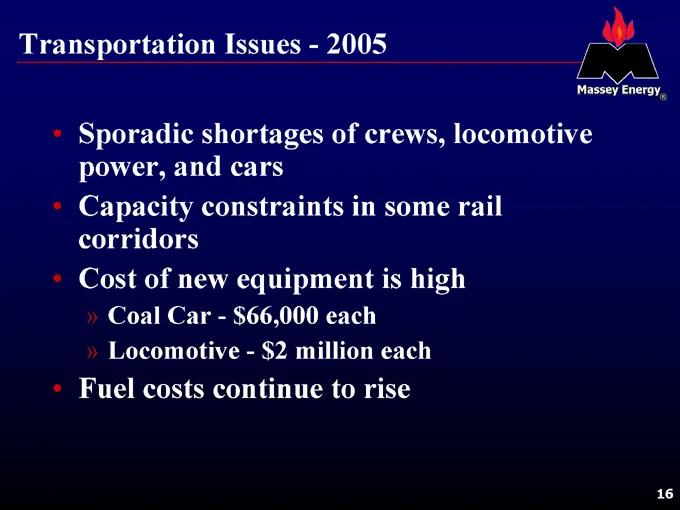
Transportation Issues—2005 Sporadic shortages of crews, locomotive power, and cars Capacity constraints in some rail corridors Cost of new equipment is high Coal Car—$66,000 each Locomotive—$2 million each Fuel costs continue to rise
Slide 17: Barge Capacity is Strained
Barge Capacity is Strained New Barge $ 400,000 New Tugboat $6,000,000 Lock and Dam System Needs Attention Barge industry was disrupted by Katrina
Slide 18: Rail Service Improvement Prospects in 2006
Rail Service Improvement Prospects in 2006 Railroads will show improvement in 2006 Crew schools are full Investment in new locomotives in 2004 and 2005 will begin to pay off Railroads are encouraging expansion of private fleets to relieve pressure on system equipment
Slide 19: Railroad Challenges—2006
Railroad Challenges—2006 Retention of new crew hires Hard and Dangerous Work Crazy Hours Business lines are up across the board on CSX & NS Must devote adequate resources to all Merchandise freight continues to rise as the economy continues its post 9/11 recovery
Slide 20: Railroad Challenges—2006 (cont'd)
Railroad Challenges -2006 (cont’d) Trucking company demand is up with a shortage of drivers New breed of trucker is not interested in being away from home overnight Motor carriers are partnering with railroads to cover long haul legs between terminals Motor carriers then cover the terminal to custom

Slide 21: Doing the Right Thing. with Energy
Doing the Right Thing. with Energy
Source: SEC EDGAR · 8-K/A filed Sep 29, 2005
More decks from Massey Energy Co
 Merger or Acquisition (March 2011)18 slides · Mar 9, 2011
 BMO Capital Markets 2011 Global Metals & Mining Conference27 slides · Mar 1, 2011
 Credit Suisse Energy Summit 201126 slides · Feb 10, 2011
 Merger or Acquisition (January 2011)19 slides · Jan 31, 2011
 Proxy Contest (May 2010)32 slides · May 5, 2010
 Proxy Contest (April 2010)26 slides · Apr 30, 2010