Cal Dive International — Q4 2012 Earnings Presentation
12 slides from Cal Dive International's earnings presentation, Feb 28, 2013

Slide 1: Cal Dive International 4th Quarter 2012 Earnings Conference Call
Cal Dive International 4th Quarter 2012 Earnings Conference Call
Slide 2: Forward-Looking Statements
Forward-Looking Statements This presentation may include "forward-looking" statements that are generally identifiable through the use of words such as "believe," "expect," "anticipate," "intend," "plan," "estimate," "project" and similar expressions and include any statements that are made regarding
Slide 3: Presentation Outline
Presentation Outline * Summary of 4Q 2012 Backlog Discussion of Financial Results Non-GAAP Reconciliations Q & A
Slide 4: Summary of 4Q 2012
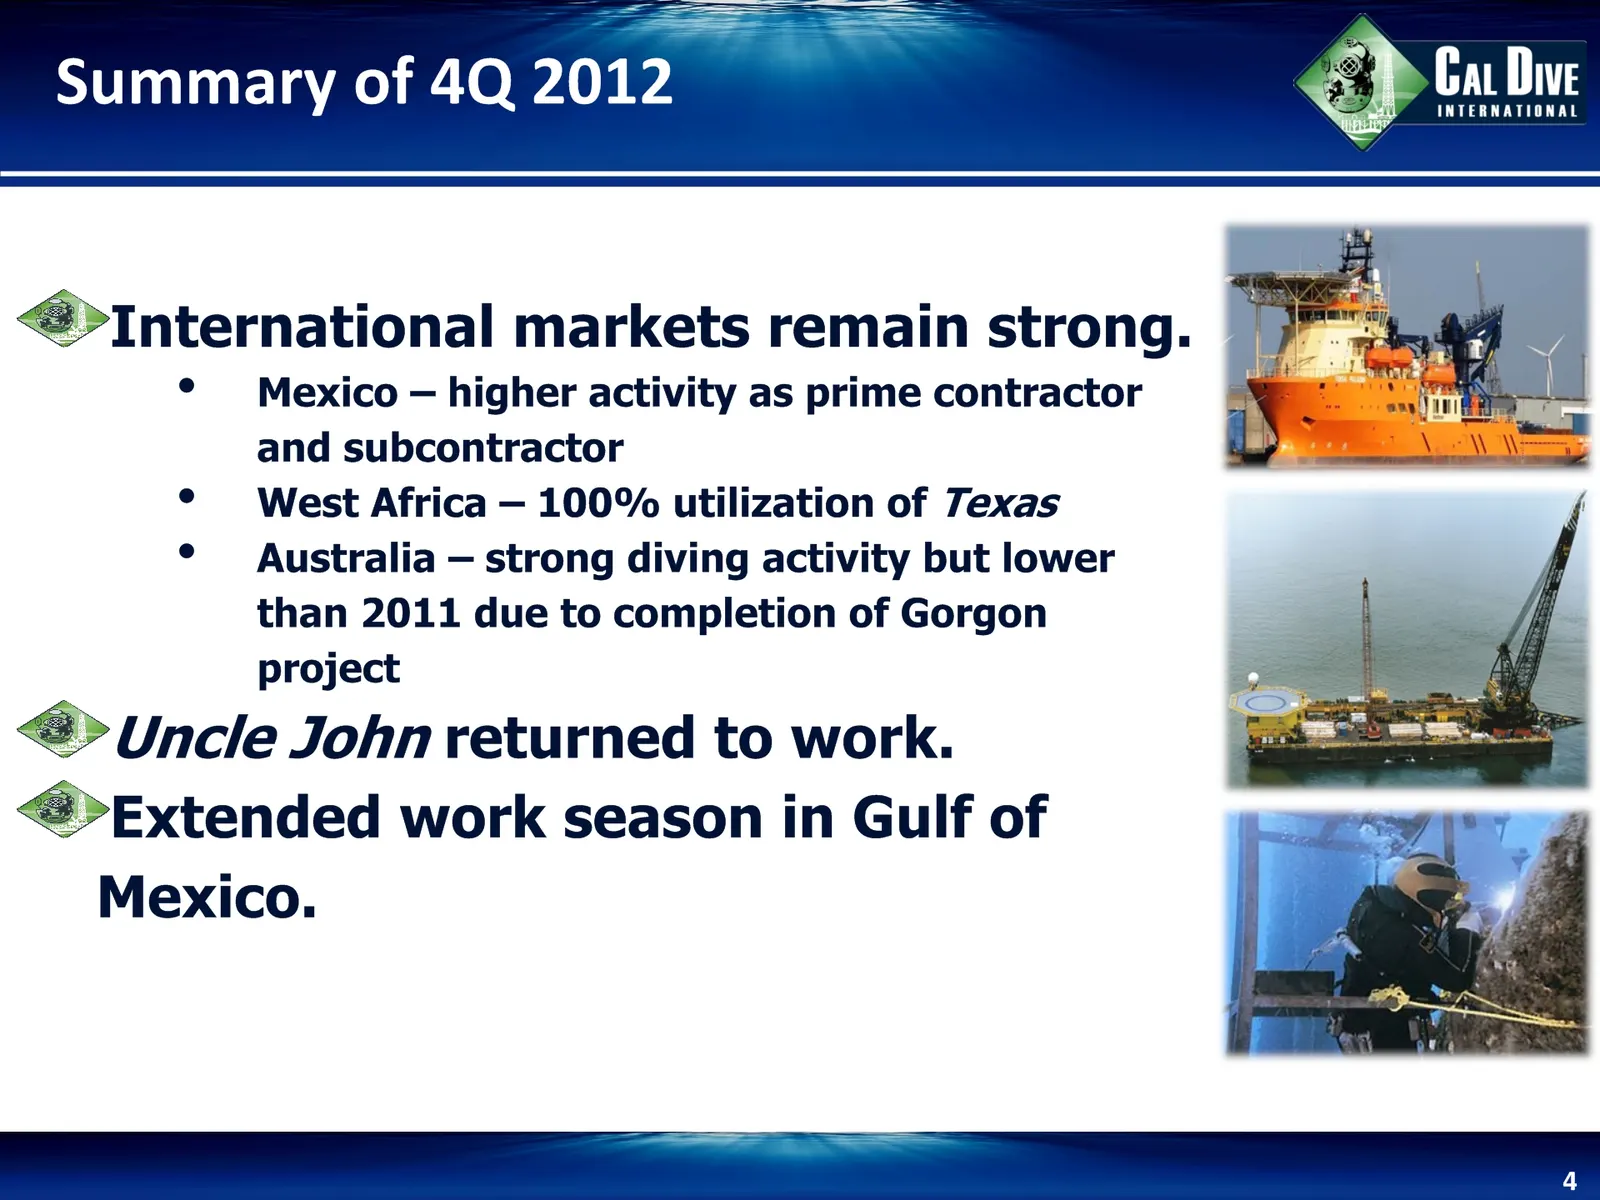
Summary of 4Q 2012 * International markets remain strong.Mexico – higher activity as prime contractor and subcontractorWest Africa – 100% utilization of TexasAustralia – strong diving activity but lower than 2011 due to completion of Gorgon projectUncle John returned to work.Extended work season in
Slide 5: Backlog ($ millions)
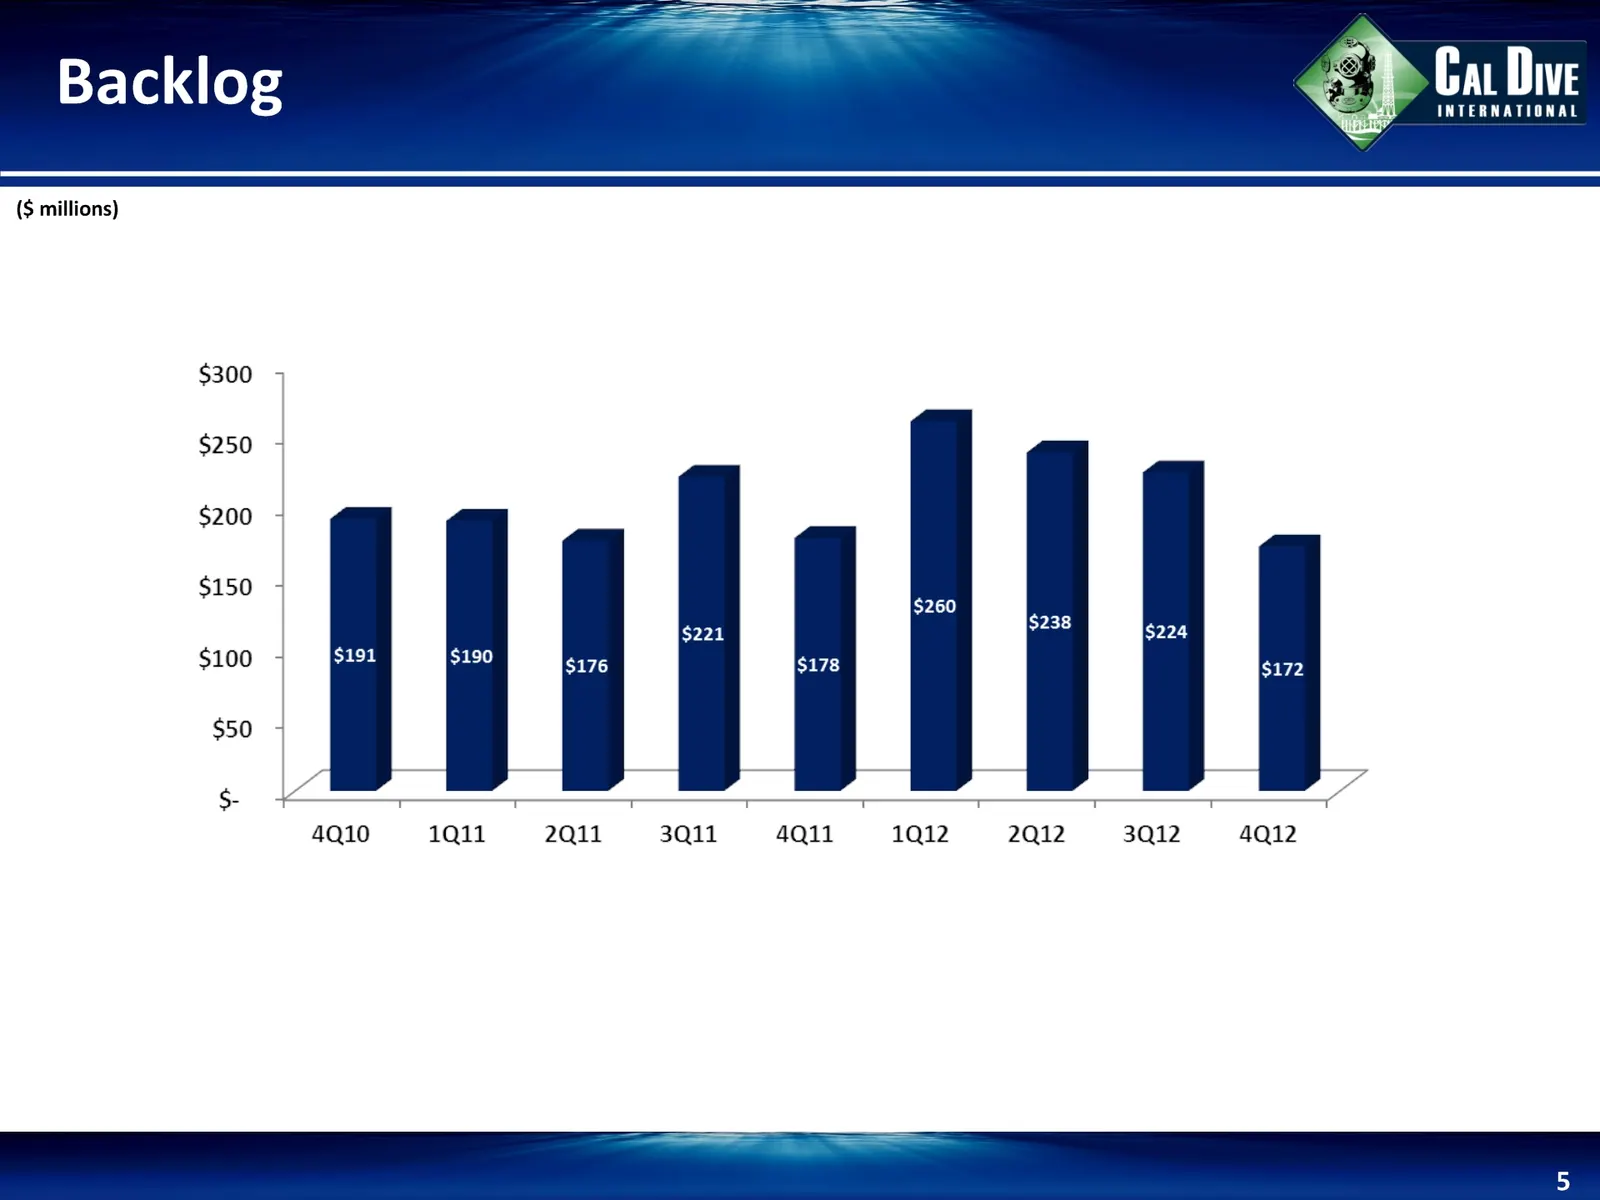
Cat Dive INTERNATIONAL ($ millions) $300 5 $250 4 $200 + $150 + $260 s100 . | el $221 Ree $224 $176 $178 $172 $50 T T T - : 1 4Q10 1Q11 2Q11 3Ql11 4Qi1 1Q12 2Q12 3Q12 4Q12
Slide 6: Financial Results
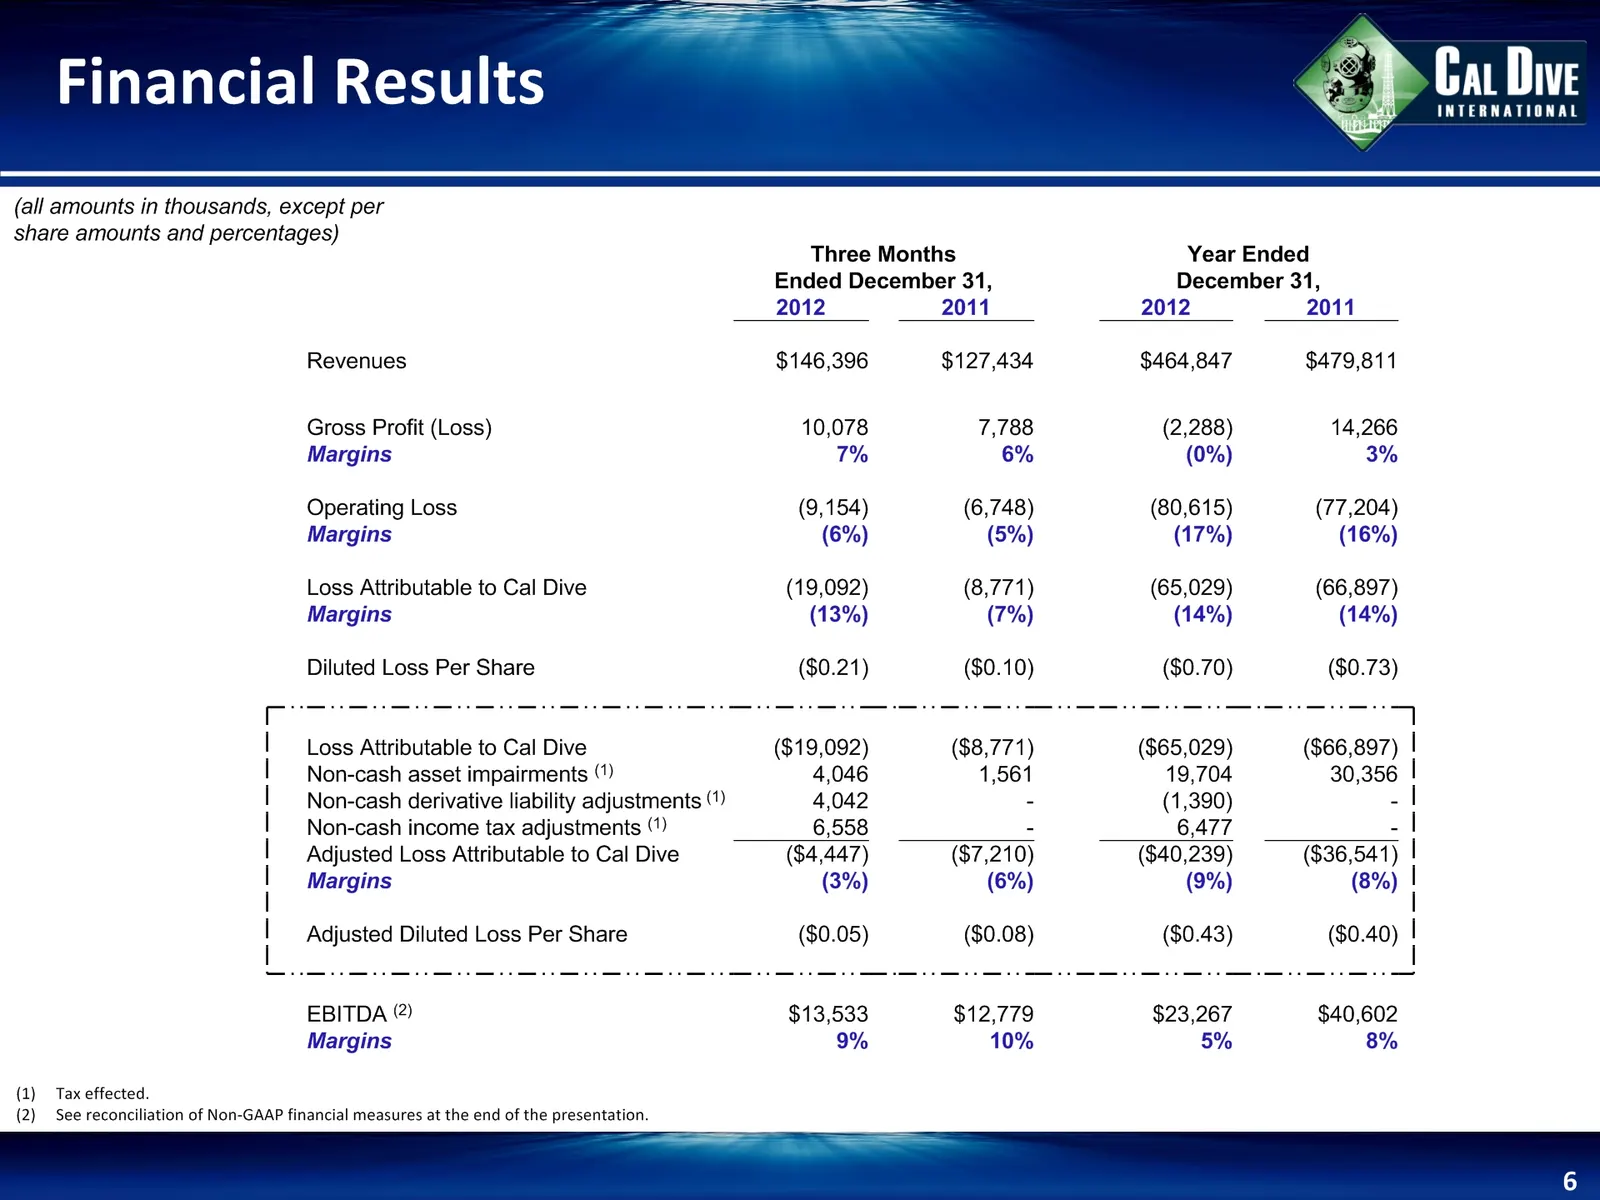
Financial Results * Tax effected.See reconciliation of Non-GAAP financial measures at the end of the presentation. (all amounts in thousands, except per share amounts and percentages) Three Months Three Months Three Months Year Ended Year Ended Year Ended Ended December 31, Ended December 31, Ended
Slide 7: Utilization
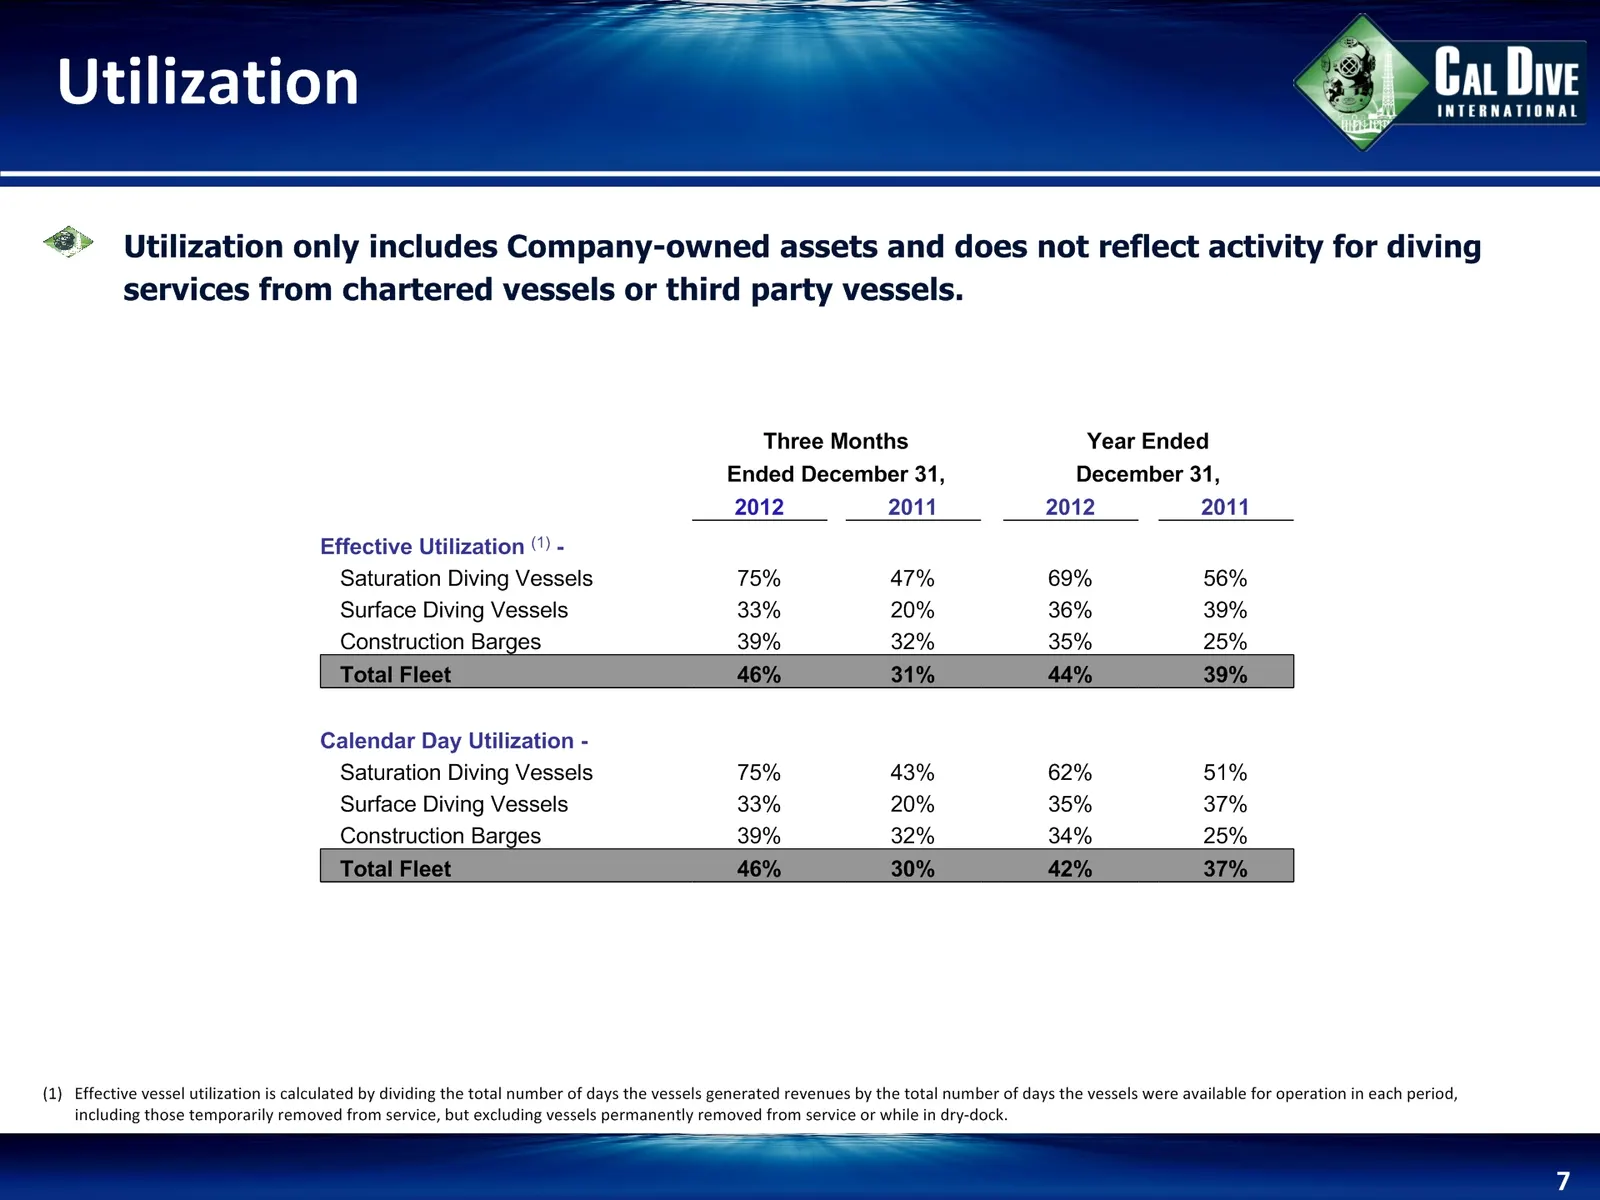
Utilization * (1) Effective vessel utilization is calculated by dividing the total number of days the vessels generated revenues by the total number of days the vessels were available for operation in each period, including those temporarily removed from service, but excluding vessels permanently re
Slide 8: Revenue Breakdown
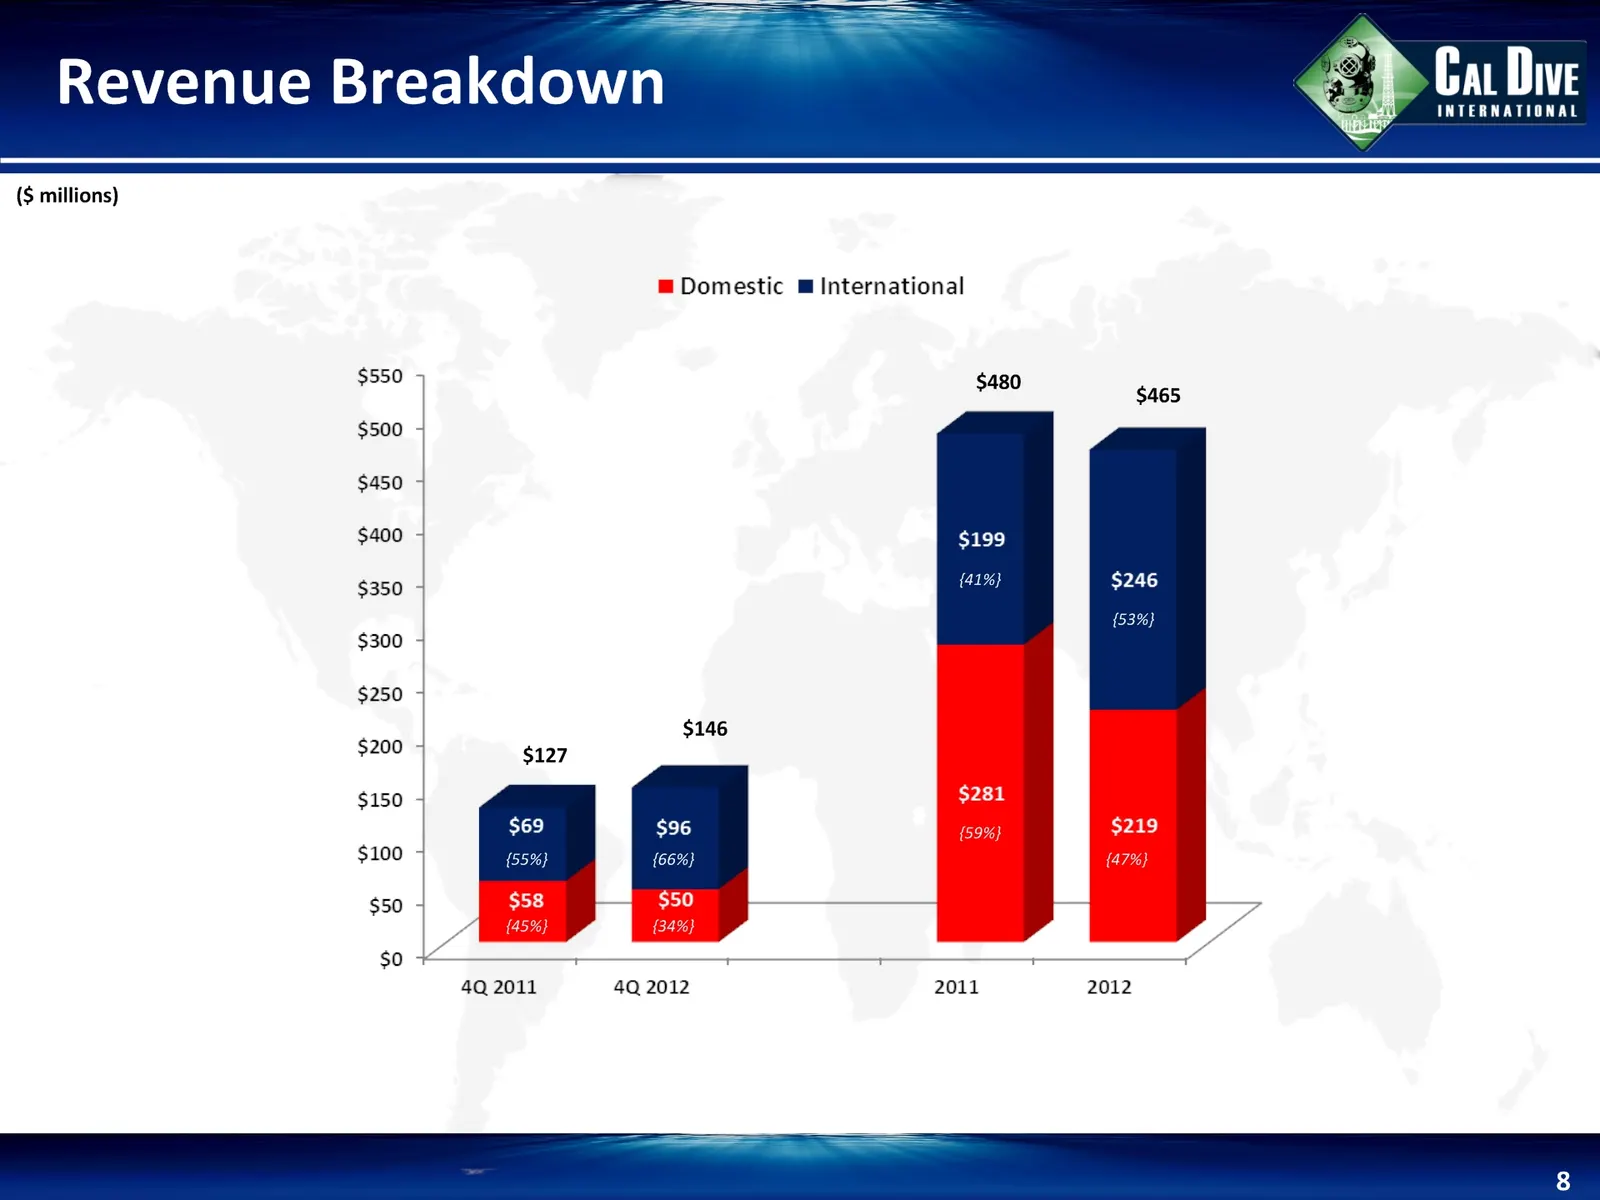
Revenue Breakdown * ($ millions) {55%} {45%} {34%} {41%} {59%} {47%} {53%} {55%} $127 $146 $480 {66%} $465
Slide 9: Debt Levels
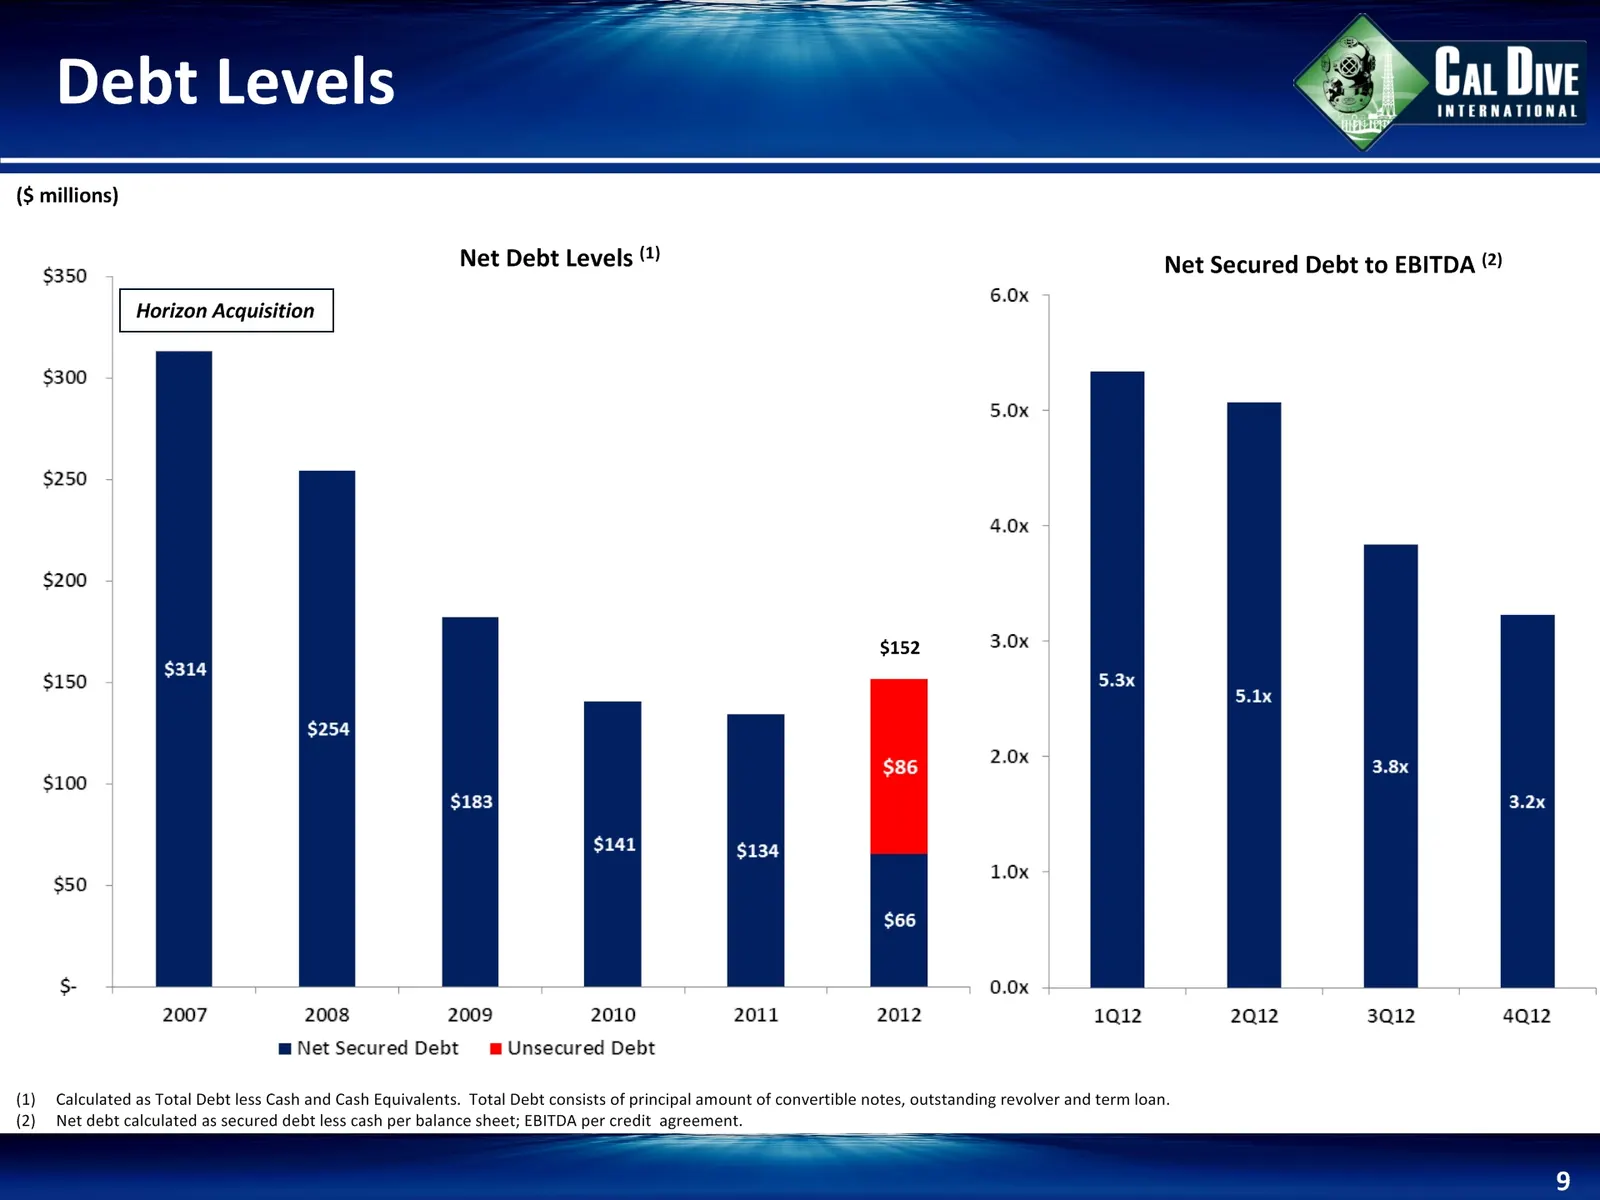
Debt Levels * Net Debt Levels (1) Net Secured Debt to EBITDA (2) ($ millions) Calculated as Total Debt less Cash and Cash Equivalents. Total Debt consists of principal amount of convertible notes, outstanding revolver and term loan.Net debt calculated as secured debt less cash per balance sheet; EBI
Slide 10: Revolver Capacity
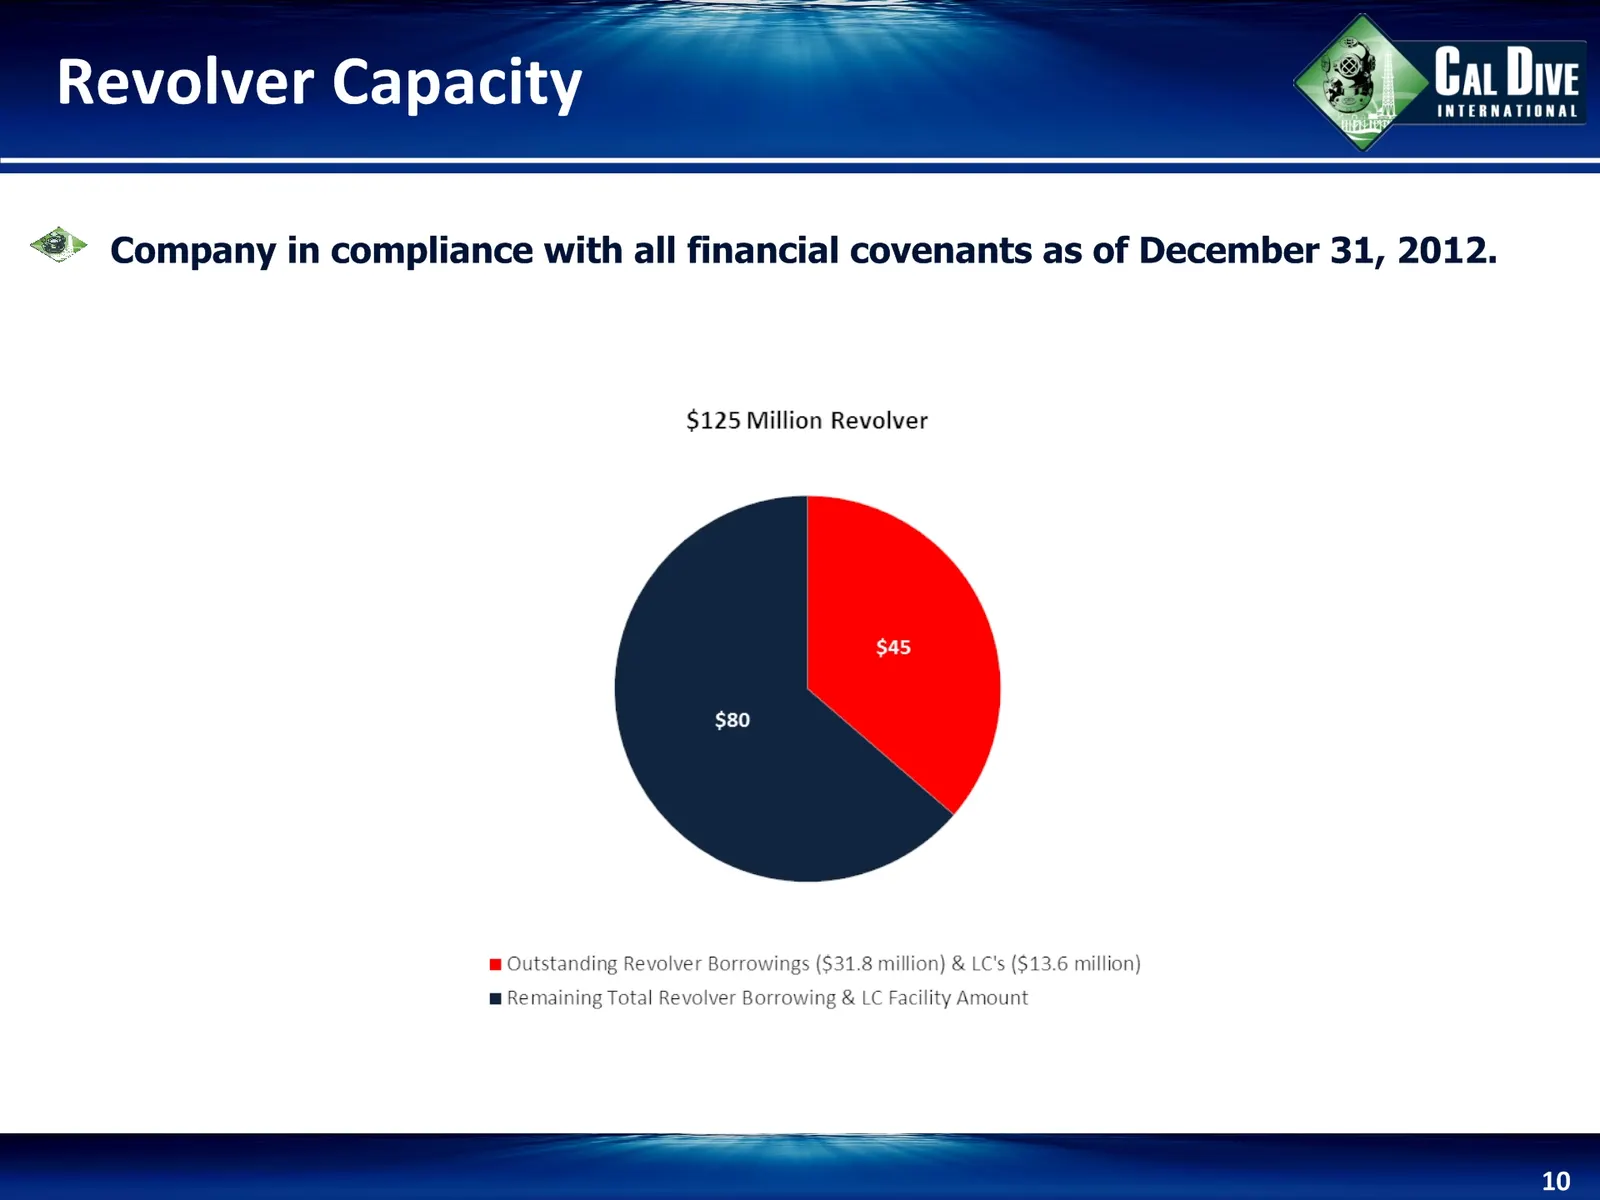
Revolver Capacity * Company in compliance with all financial covenants as of December 31, 2012.
Slide 11: Non-GAAP Reconciliations
Non-GAAP Reconciliations *
Slide 12: EBITDA Reconciliations
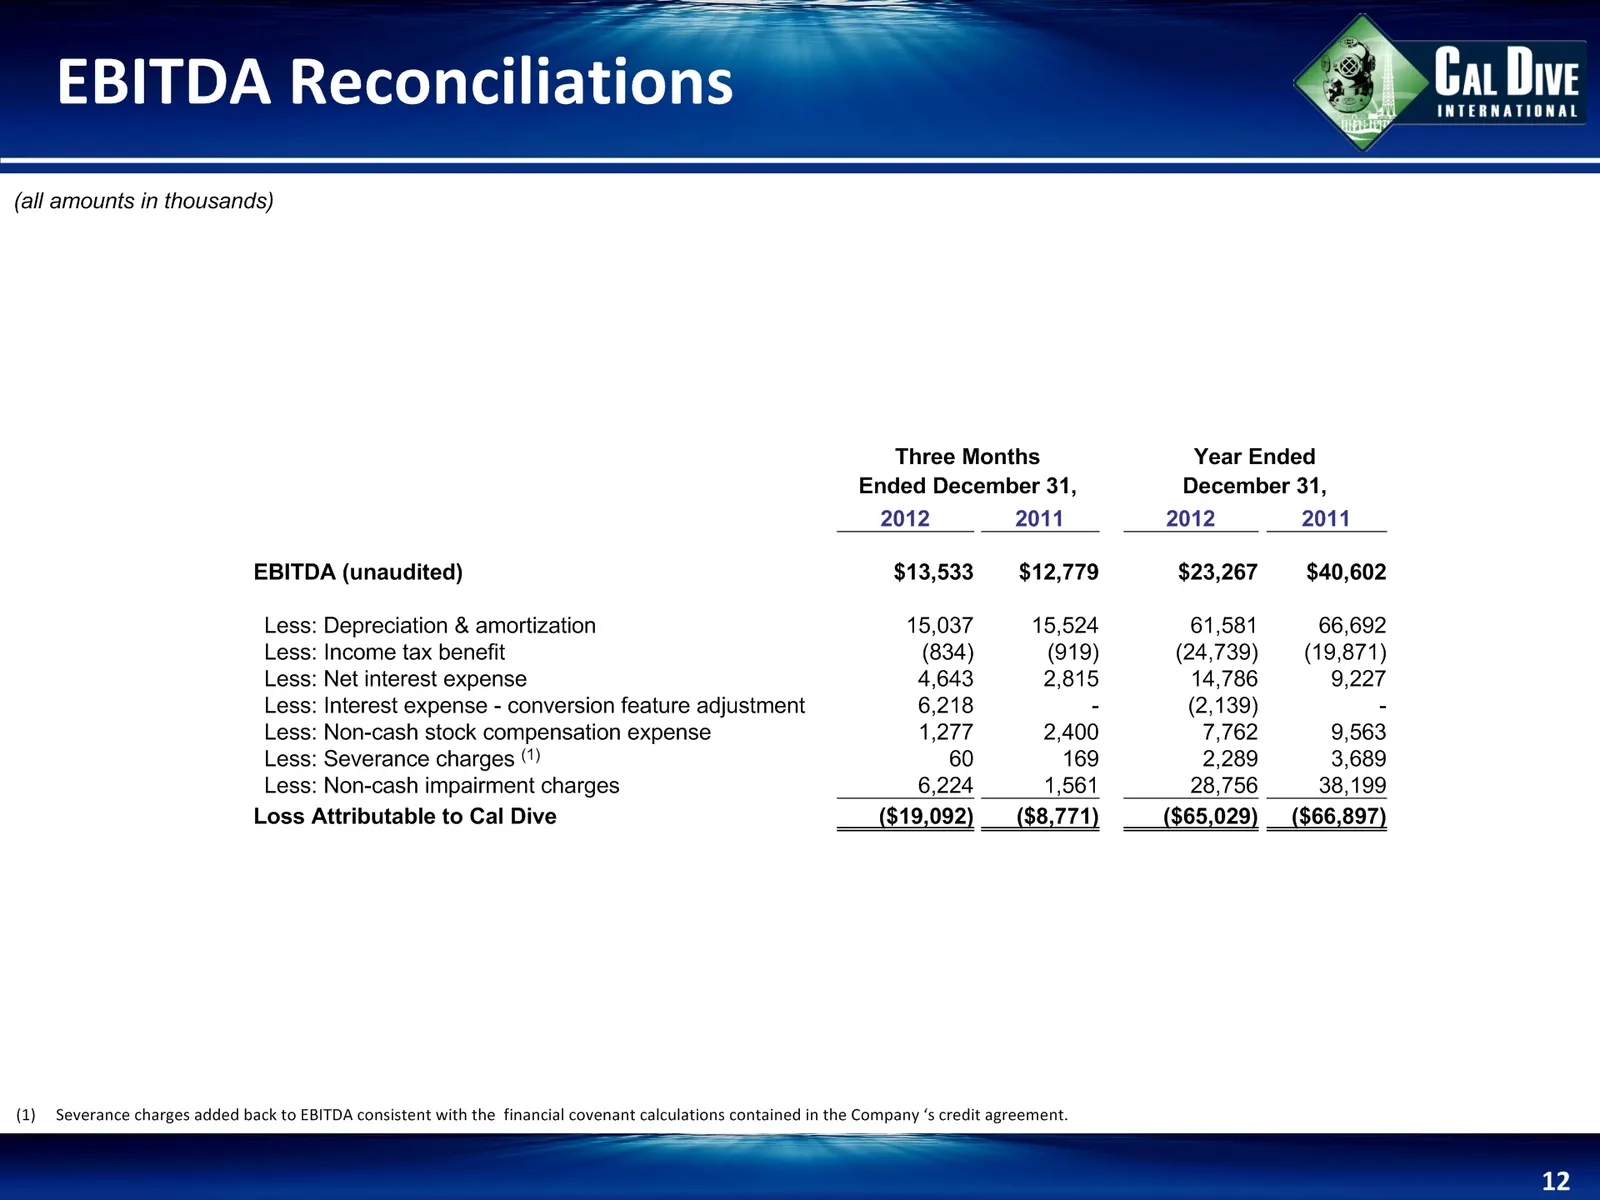
EBITDA Reconciliations * (all amounts in thousands) Severance charges added back to EBITDA consistent with the financial covenant calculations contained in the Company 's credit agreement. Three Months Three Months Three Months Year Ended Year Ended Year Ended Ended December 31, Ended December 31, E
Source: SEC EDGAR · 8-K filed Feb 28, 2013
More decks from Cal Dive International Inc
 Q3 2014 Earnings Presentation12 slides · Nov 6, 2014
 Q2 2014 Earnings Presentation12 slides · Aug 11, 2014
 Q1 2014 Earnings Presentation12 slides · May 9, 2014
 Q4 2013 Earnings Presentation11 slides · Mar 5, 2014
 Q3 2013 Earnings Presentation11 slides · Nov 7, 2013
 Q2 2013 Earnings Presentation11 slides · Aug 8, 2013