Heritage Oaks Bancorp — FIG 3rd Annual West Coast CEO Forum (February 2012)
24 slides from Heritage Oaks Bancorp's conference presentation, Feb 7, 2012
Slide 1: Heritage Oaks Bancorp 3rd Annual West Coast CEO Forum
FIG Heritage Oaks Jae 3*4 Annual West Coast Banco rp CEO Forum February 6, 2012
Slide 2: Forward-Looking Statements
Forward-Looking Statements Certain statements contained in this Report, including, without limitation, statements containing the words “believes”, ‘anticipates’, “intends”, "expects", and words of similar impact. constitute ‘forward-looking statements; within the meaning of Section 27A of the Securi
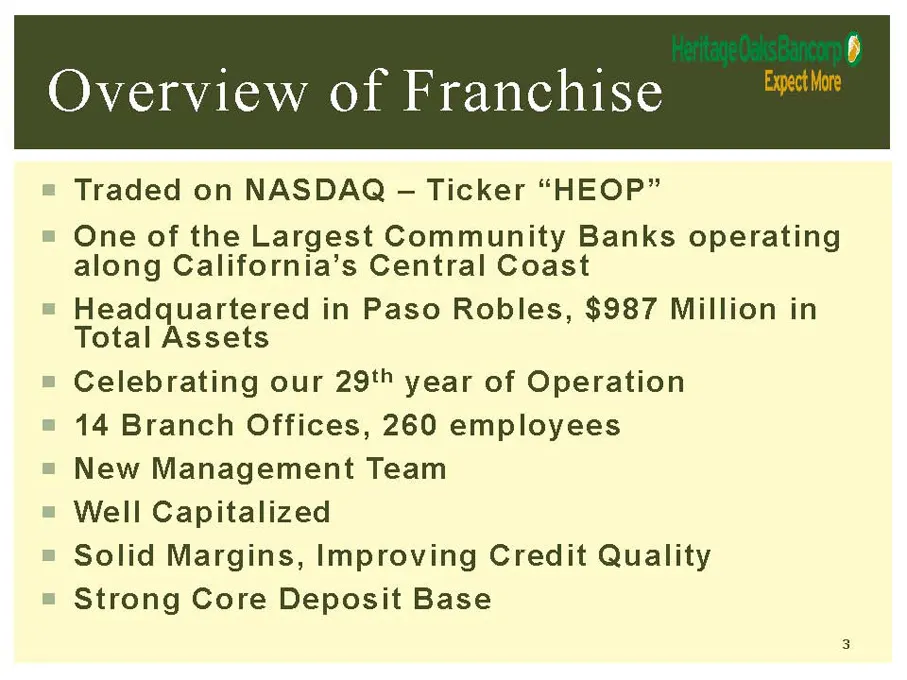
Slide 3: Overview of Franchise
Overview of Franchise Traded on NASDAQ - Ticker “HEOP” = One of the Largest Community Banks operating along California’s Central Coast Headquartered in Paso Robles, $987 Million in Total Assets = Celebrating our 29" year of Operation = 14 Branch Offices, 260 employees New Management Team = Well Capi
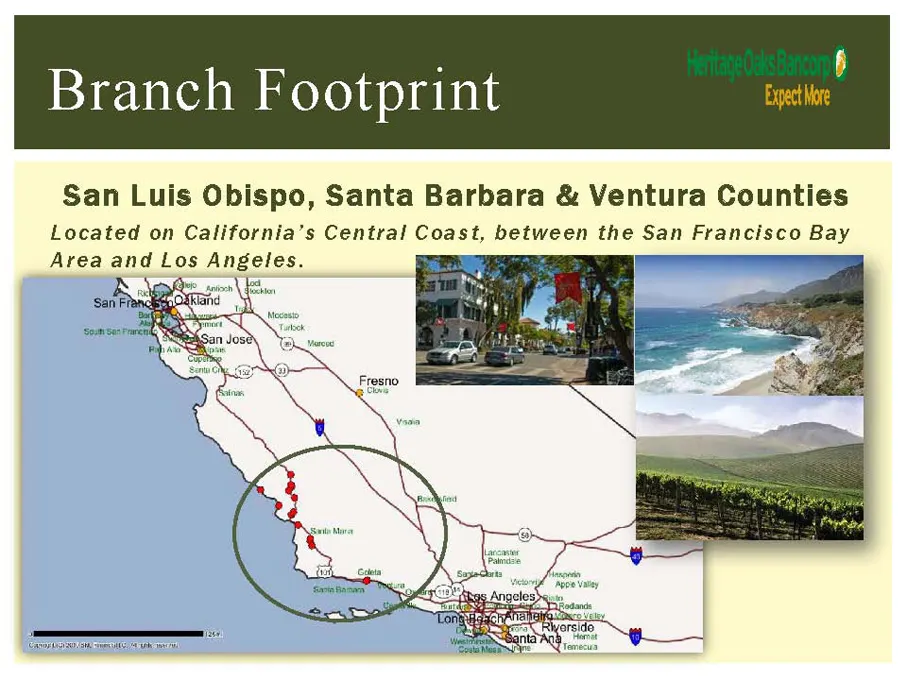
Slide 4: Branch Footprint
Branch Footprint San Luis Obispo, Santa Barbara & Ventura Counties Located on California’s Central Coast, between the San Francisco Bay Area and Los Angeles.
Slide 5: Market Share
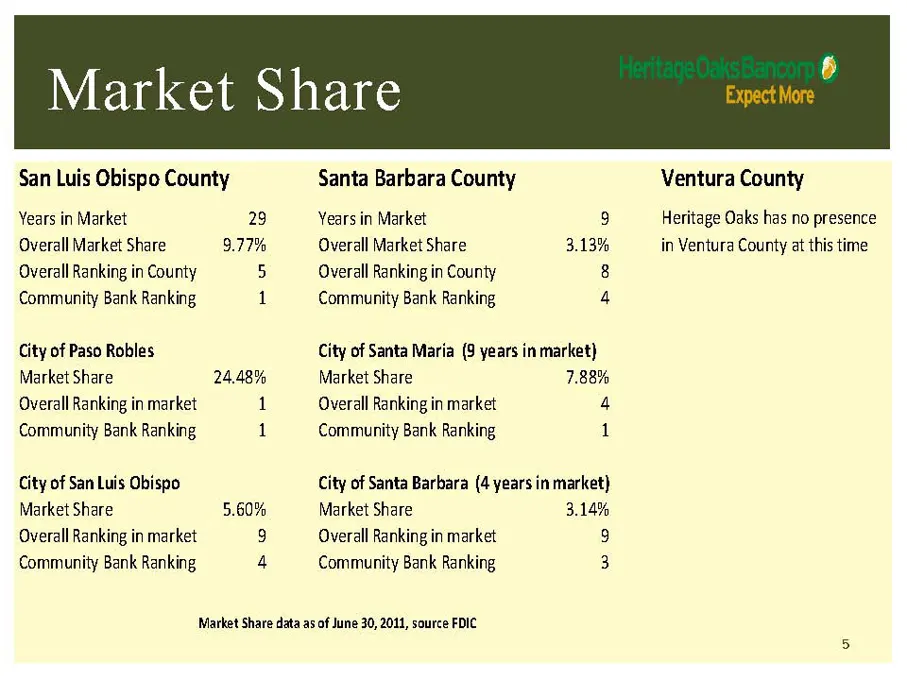
Market Share San Luis Obispo County Santa Barbara County Ventura County Years in Market 29 Years in Market 9 Heritage Oaks has no presence Overall Market Share 9.77% Overall Market Share 3.13% in Ventura County at this time Overall Ranking in County 5 Overall Ranking in County 8 Community Bank Ranki
Slide 6: Business Model
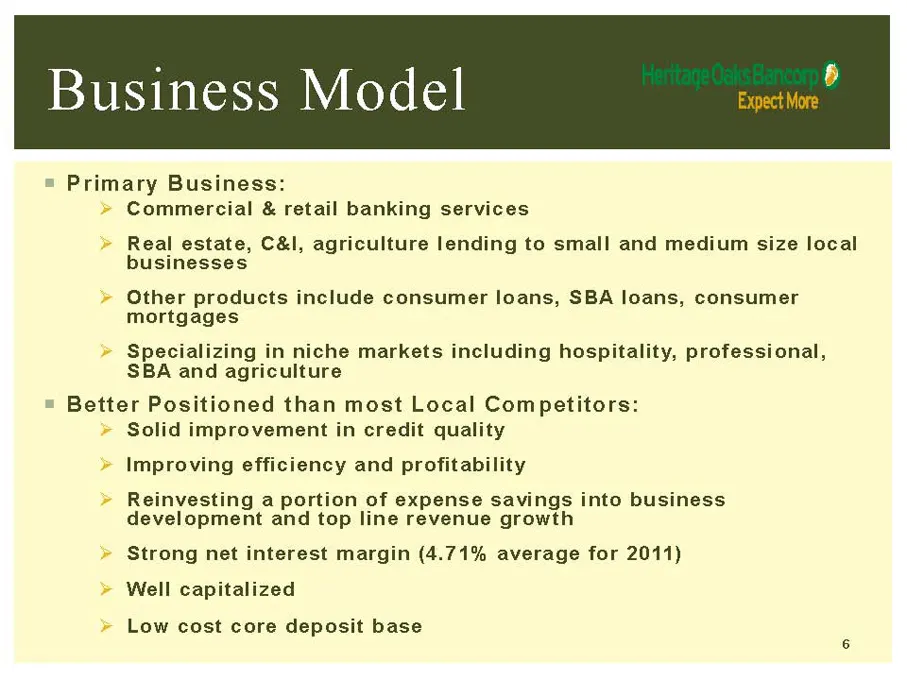
Business Model Primary Business: > v Commercial & retail banking services Real estate, C&l, agriculture lending to small and medium size local businesses Other products include consumer loans, SBA loans, consumer mortgages Specializing in niche markets including hospitality, professional, SBA and ag
Slide 7: Fourth Quarter & Full Year 2011 Highlights
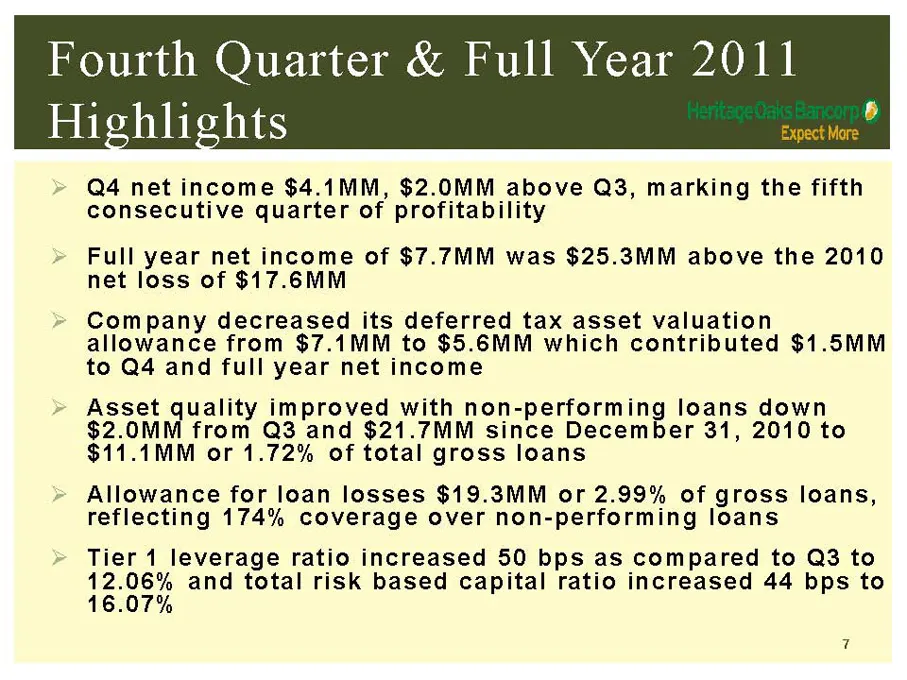
Fourth Quarter & Full Year 2011 Highlights Q4 net income $4.1MM, $2.0MM above Q3, marking the fifth consecutive quarter of profitability Full year net income of $7.7MM was $25.3MM above the 2010 net loss of $17.6MM Company decreased its deferred tax asset valuation allowance from $7.1MM to $5.6MM wh
Slide 8: Income Statement
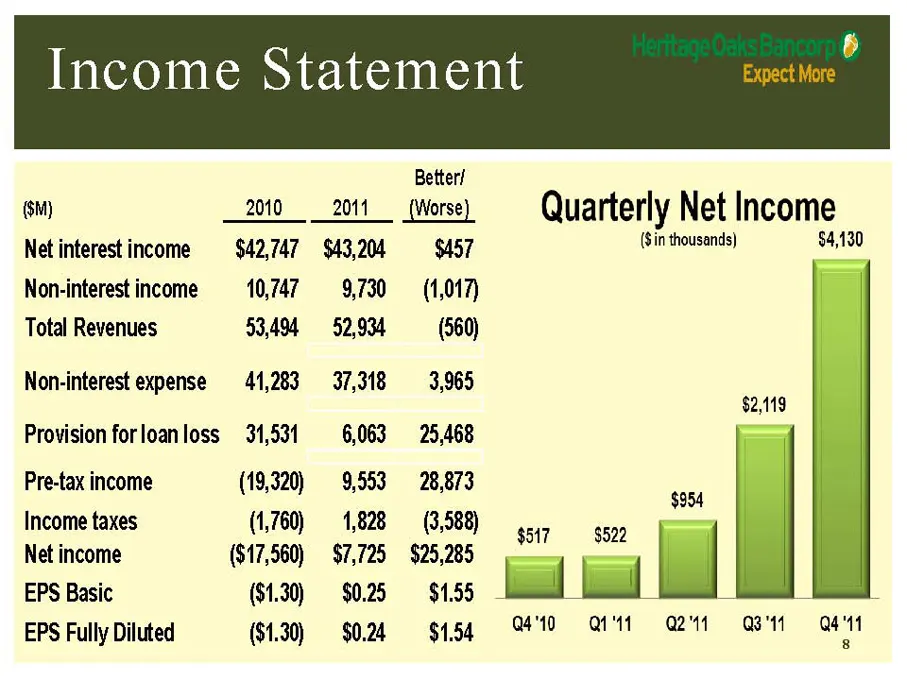
Income Statement (SM) Net interest income Non-interest income Total Revenues Non-interest expense Provision for loan loss Pre-tax income Income taxes Net income EPS Basic EPS Fully Diluted 2010 2011 $42,747 $43,204 10,747 9,730 53,494 52,934 41,283 37,318 34,531 6,063 (19,320) 9,553 (1,760) 1,828 (6
Slide 9: Improving Profitability Metrics
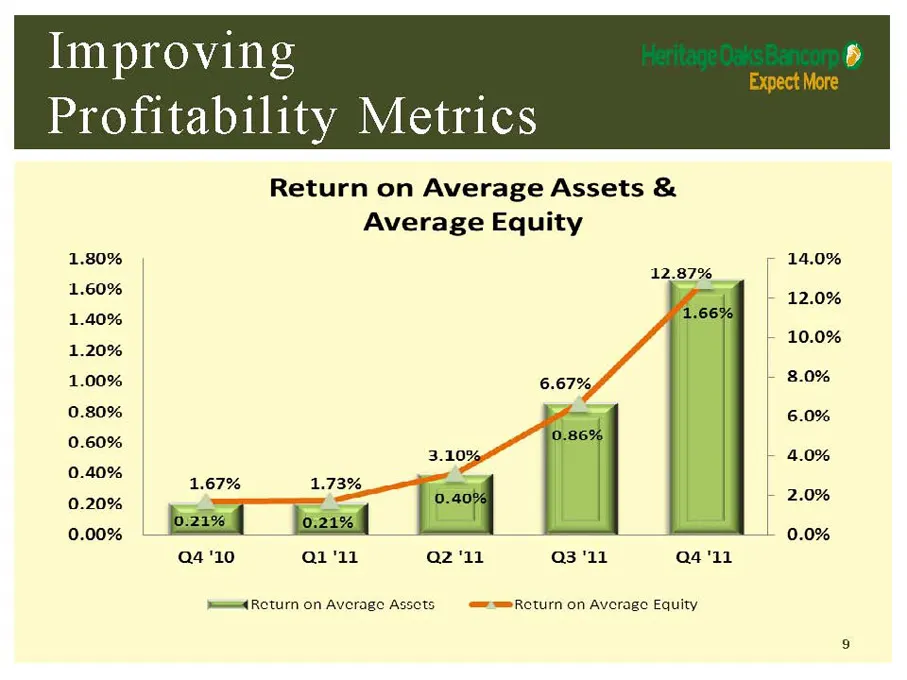
Improving Profitability Metrics Return on Average Assets & Average Equity 1.80% 1.60% 1.40% 1.20% 1.00% 0.80% 0.60% 0.40% 0.20% 0.00% Q4 ‘10 qQl‘1l Q2'11 Q3'11 Q4'11 yemeea Return on Average Asscts === Return on Average Equity 14.0% 12.0% 10.0% 8.0% 6.0% + 4.0% + 2.0% 0.0%
Slide 10: Net Interest Margin, Improving Efficiency
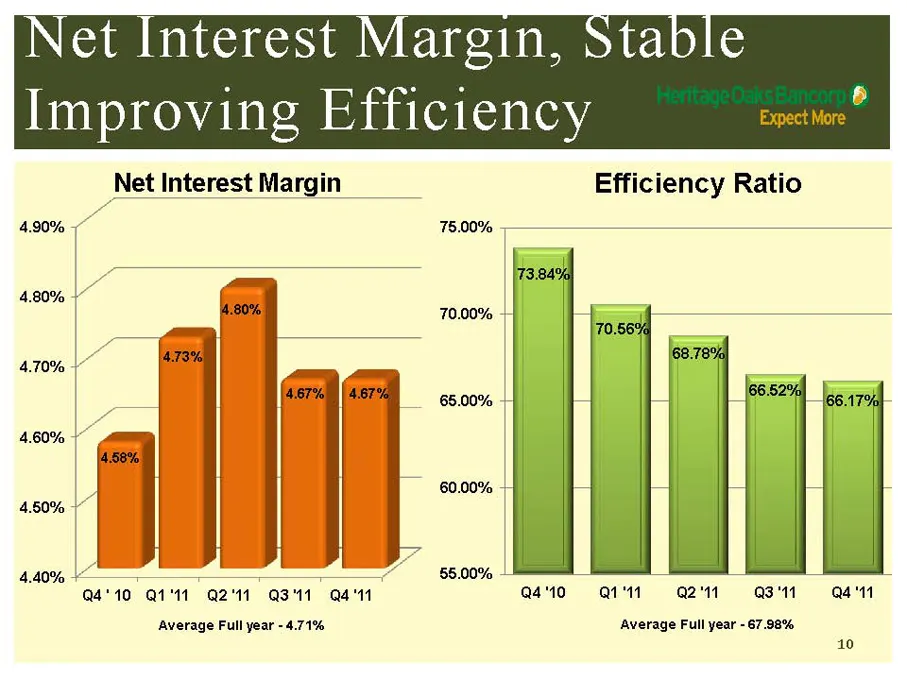
Net Interest Margin, Improving Efficiency Net Interest Margin 4.90% 4.80% /~ 4.70% 4.60% 4.50% 4.40% = a at Q4°10 Q111 Q2'1 Q341 O41 Average Full year - 4.71% 75.00% 70.00% +} 65.00% - 60.00% ++ 55.00% 73.845 Q410 Qi Q2'11 Q3"11 Average Full year - 67.98% a4 10
Slide 11: Balance Sheet
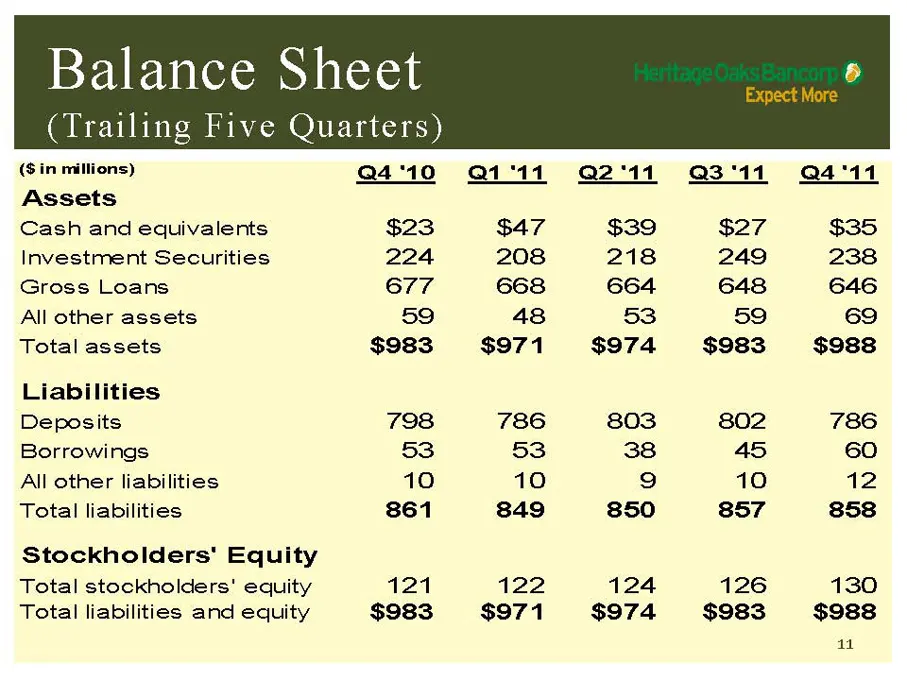
Balance Sheet (Trailing Five Quarters) (Sin millions) Q4‘10 Q1'11 @2'11 Q3'11 @4'11 Assets Cash and equivalents $23 $47 $39 $27 $35 Investment Securities 224 208 218 249 238 Gross Loans 677 668 664 648 646 All other assets 59 43 53 59 69 Total assets $983 $971 $974 $983 $988 Liabilities Deposits 798
Slide 12: Outstanding Core Deposit Base, Cost of Deposits Declining
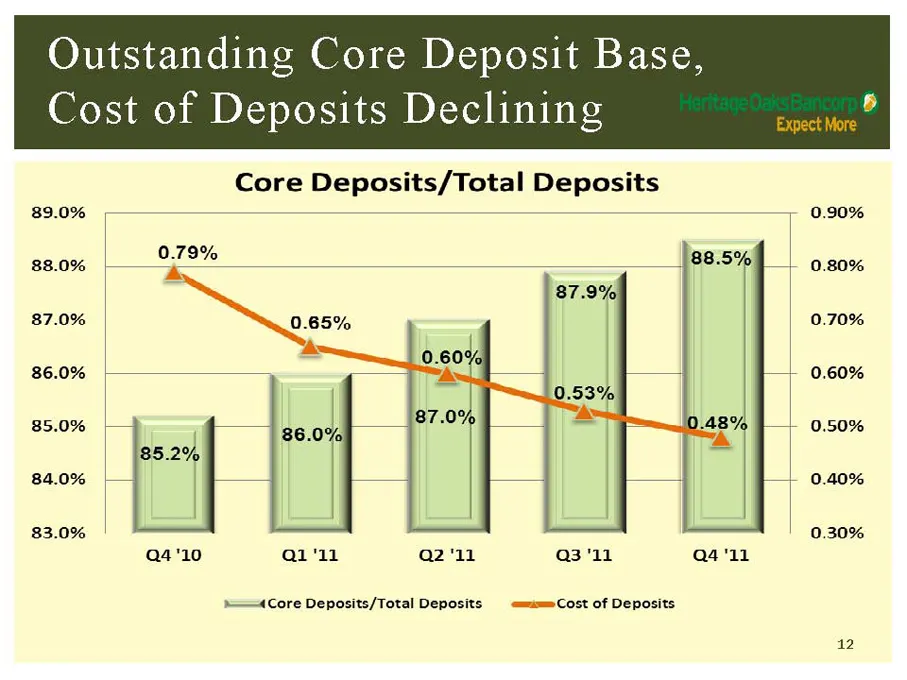
Outstanding Core Deposit Base, Cost of Deposits Declining 89.0% 88.0% 87.0% 86.0% 85.0% 84.0% 83.0% 0.79% Core Deposits/Total Deposits j 86.0 til Q4'10 oh Ba Q2'11 Q3'11 »——4Core Deposits/Total Deposits <==uee Cost of Deposits Q4'11 12
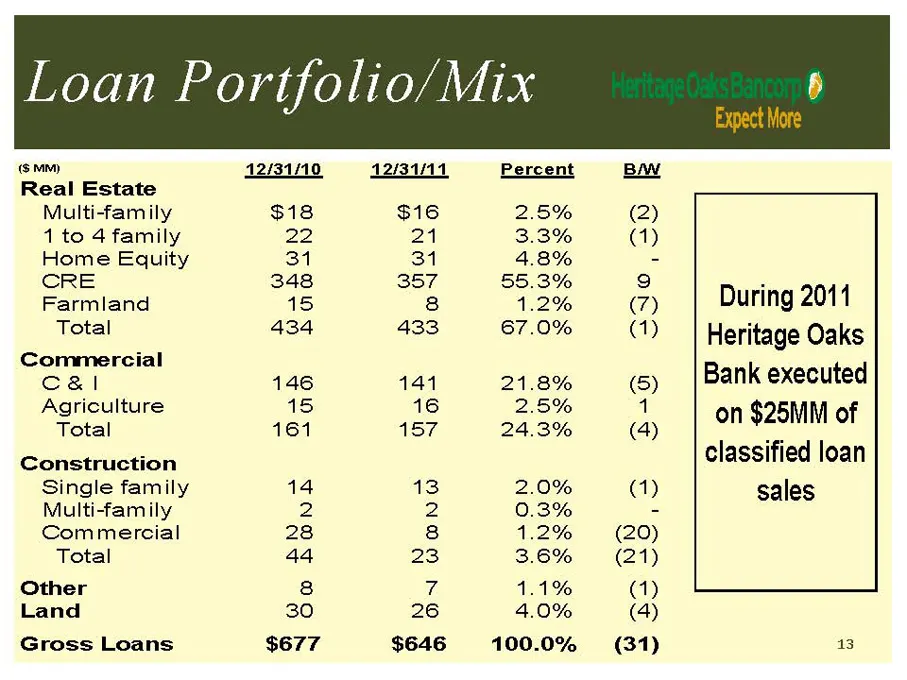
Slide 13: Loan Portfolio/Mix
Loan Portfolio/Mix (smmM) 12/31/10 12/31/11 Percent BAW Real Estate Multi-family $18 $16 2.5% (2) 1 to 4 family 22: 21 3.3% (1) Home Equity 31 Sal 4.8% - CRE 348 357 55.3% 9 , Farmland 15 8 1.2% (7) During 2011 Total 434 433 67.0% () | Heritage Oaks Commercial Cc&l 146 141 21.8% (6) |Bank executed A
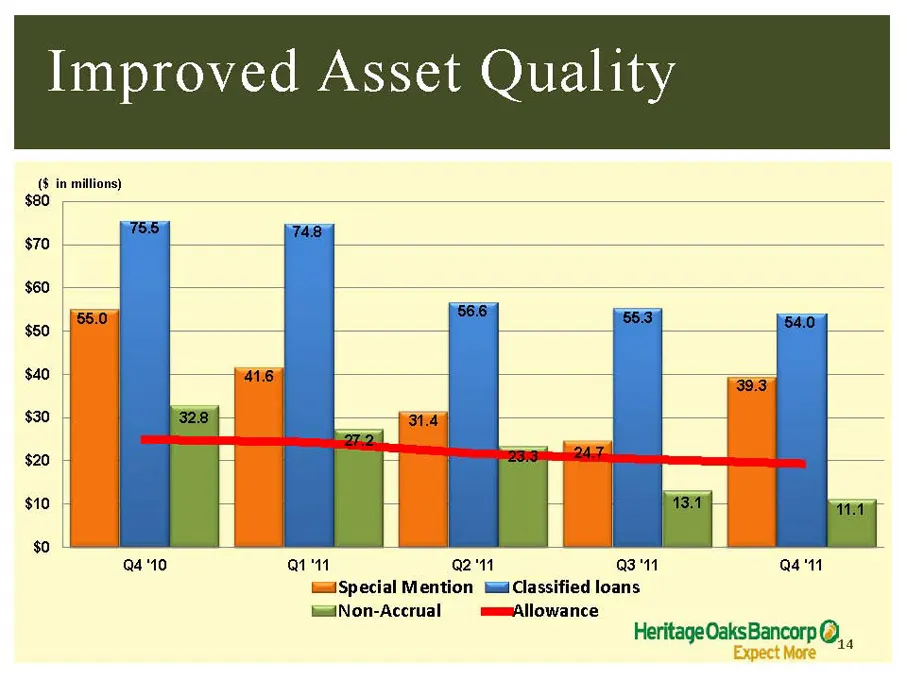
Slide 14: Improved Asset Quality
Improved Asset Quality (8 in millions) $80 755 $70 $60 $50 $40 $30 $20 $10 $0 Q4 10 ai Q2'11 O38 "11 Qa laiSpecial Mention tai Classified loans lmNon-Accrual — mmmAllowance Heritage OaksBancorp @, ; Expect More
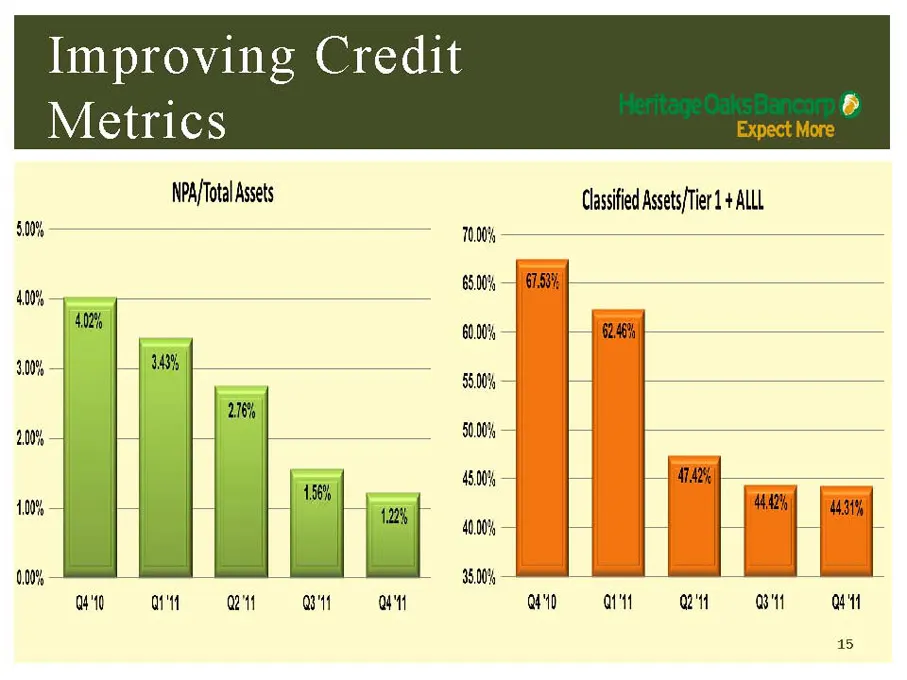
Slide 15: Improving Credit Metrics
Improving Credit Metrics NPA/Total Assets 5.00% a) at cet Ot Ont 1.00% Classified Assets/Tier 1 + ALLL 60.00% 55.00% $0.00% 5004 —) 41.004 —) 0h — 67.53% | | ca || AAR {Math | again ait Ott at cal) anit 15
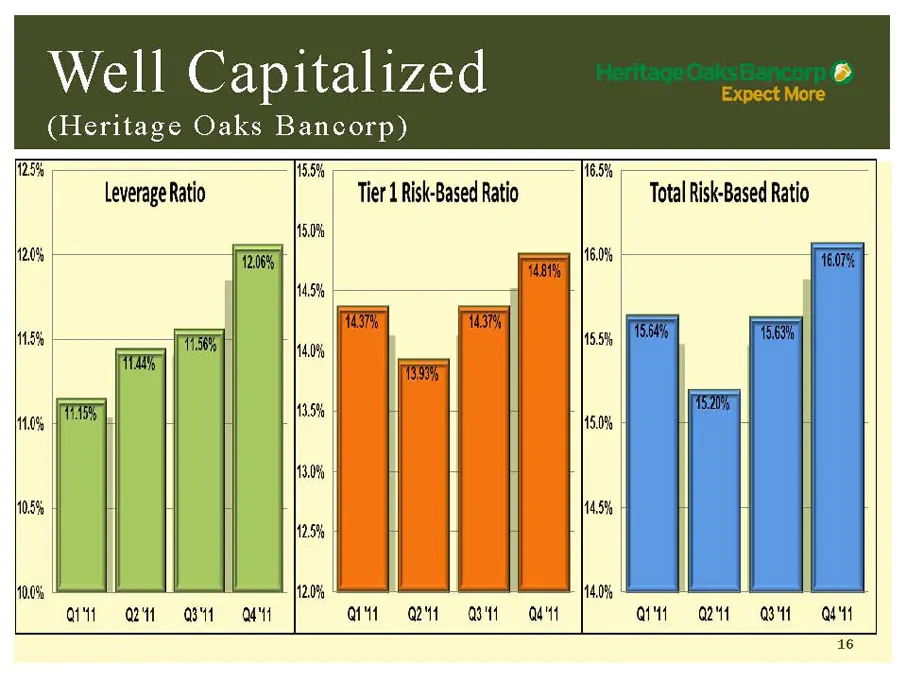
Slide 16: Well Capitalized
Well Capitalized (Heritage Oaks Bancorp) 25% = 15.5% i ; 16.5% 7 - Leverage Ratio Tier 4 Risk-Based Ratio Total Risk-Based Ratio (15.0% 12.0% ——— 148th {4.5% |] i, 5 14.5% 4.0% 15.5% 14.0% es 15.0% | 113.0% 105% 14.5% 12.5% 10.0% 112.0% 14.0% a att att ant Qt anit att aut a Ott Mt aut 16
Slide 17: New Management Team
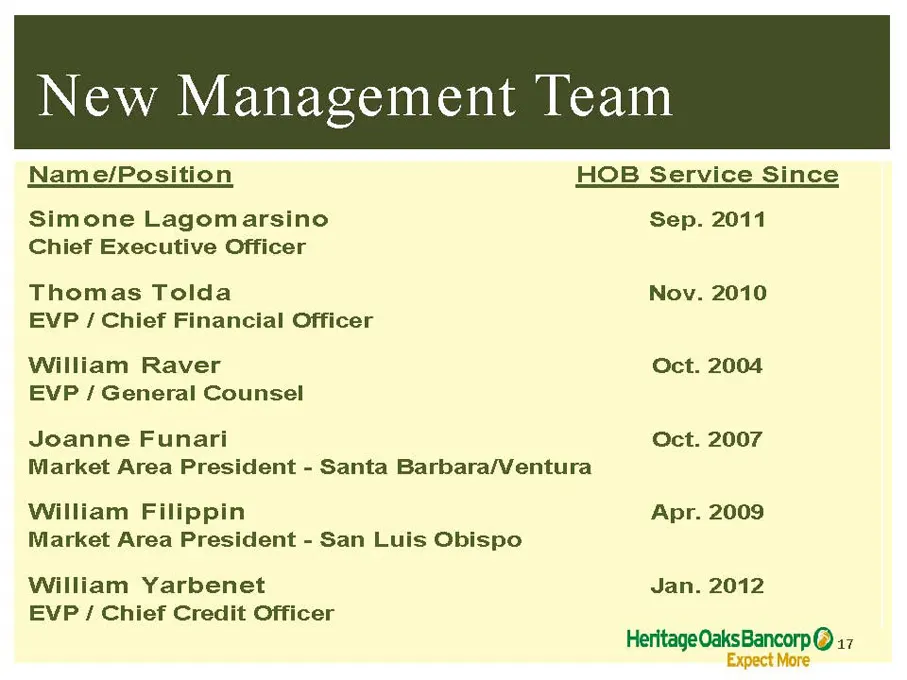
New Management Team Name/Position HOB Service Since Simone Lagomarsino Sep. 2011 Chief Executive Officer Thomas Tolda Nov. 2010 EVP / Chief Financial Officer William Raver Oct. 2004 EVP / General Counsel Joanne Funari Oct. 2007 Market Area President - Santa Barbara/Ventura William Filippin Apr. 2009
Slide 18: Business Development
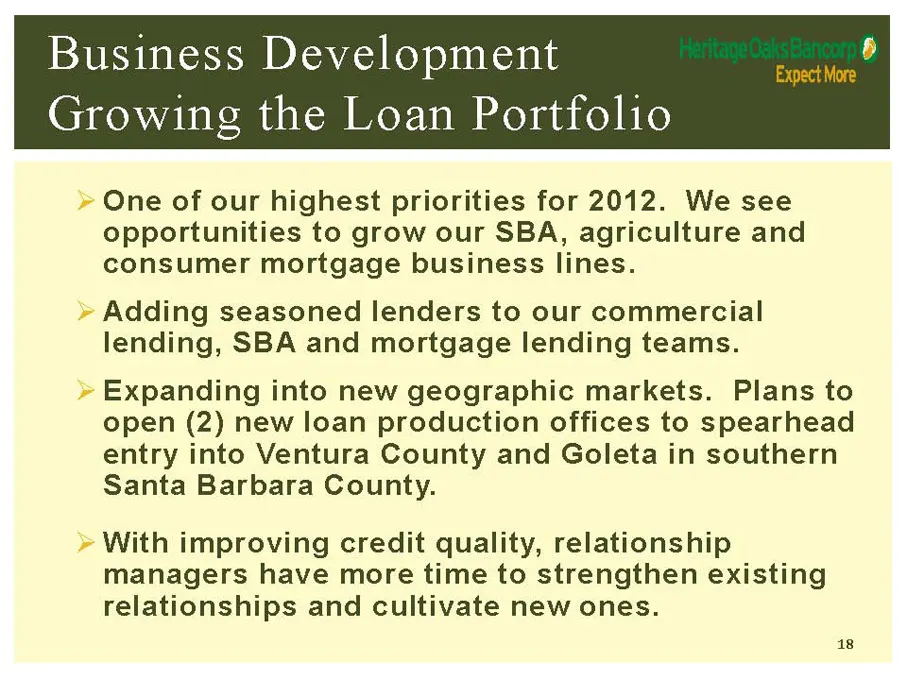
Business Development Growing the Loan Portfolio One of our highest priorities for 2012. We see opportunities to grow our SBA, agriculture and consumer mortgage business lines. Adding seasoned lenders to our commercial lending, SBA and mortgage lending teams. Expanding into new geographic markets. Pl
Slide 19: Expense Streamlining
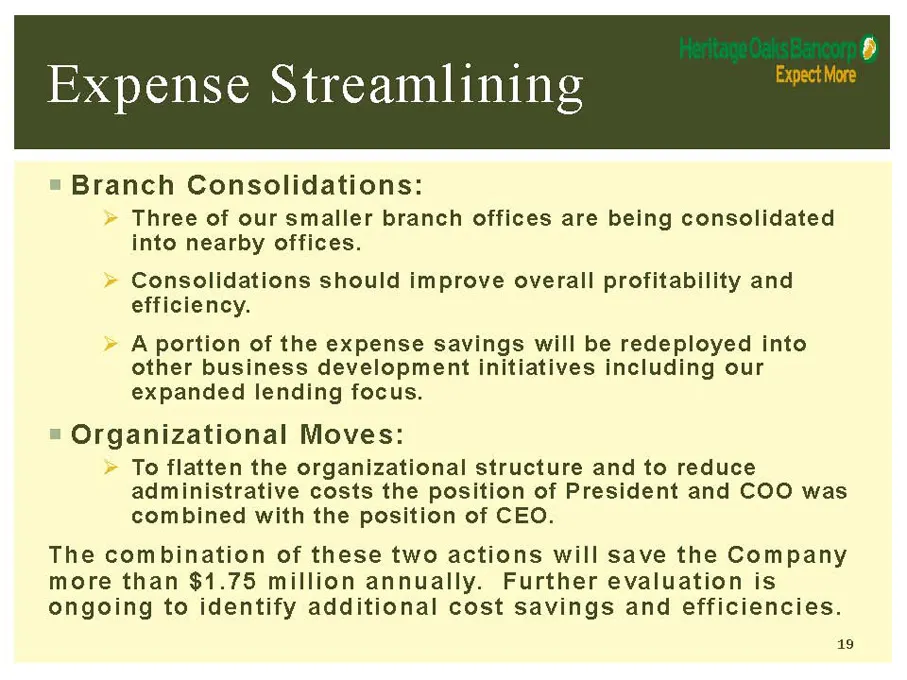
Expense Streamlining = Branch Consolidations: Three of our smaller branch offices are being consolidated into nearby offices. Consolidations should improve overall profitability and efficiency. A portion of the expense savings will be redeployed into other business development initiatives including
Slide 20: DTA Valuation Reserve
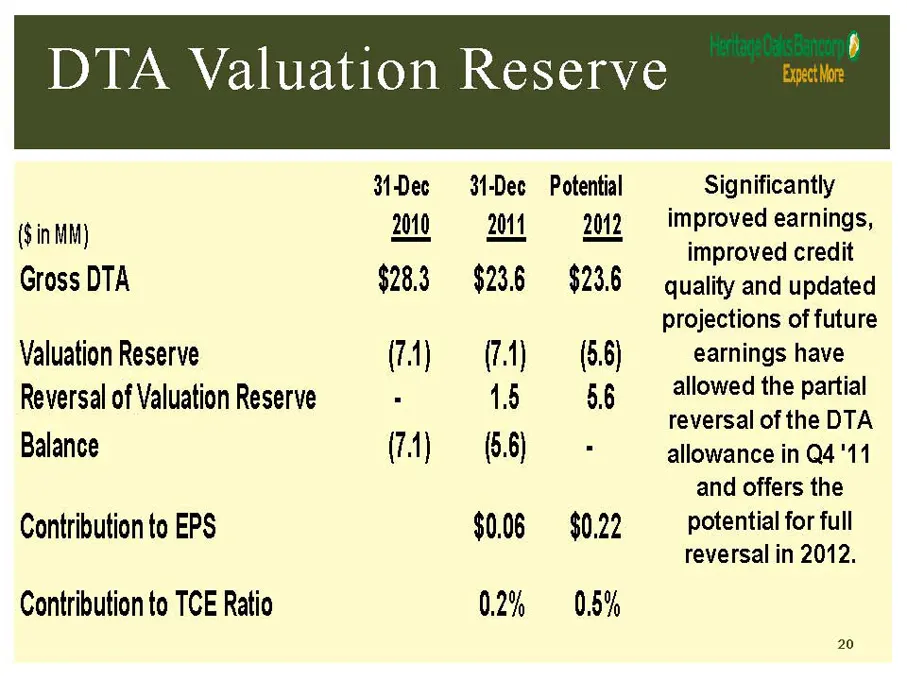
DTA Valuation Reserve Dec —34-Dec (Sin MM) 200 ott Gross DTA $28.3 $23.6 Valuation Reserve (74) (7.1) Reversal of Valuation Reserve . 15 Balance (71) (6.6) Contribution to EPS $0.06 Contribution to TCE Ratio 0.2% Potential 2012 $23.6 (5.6) 56 $0.22 0.5% Significantly improved earnings, improved cred
Slide 21: Strong Institutional Ownership
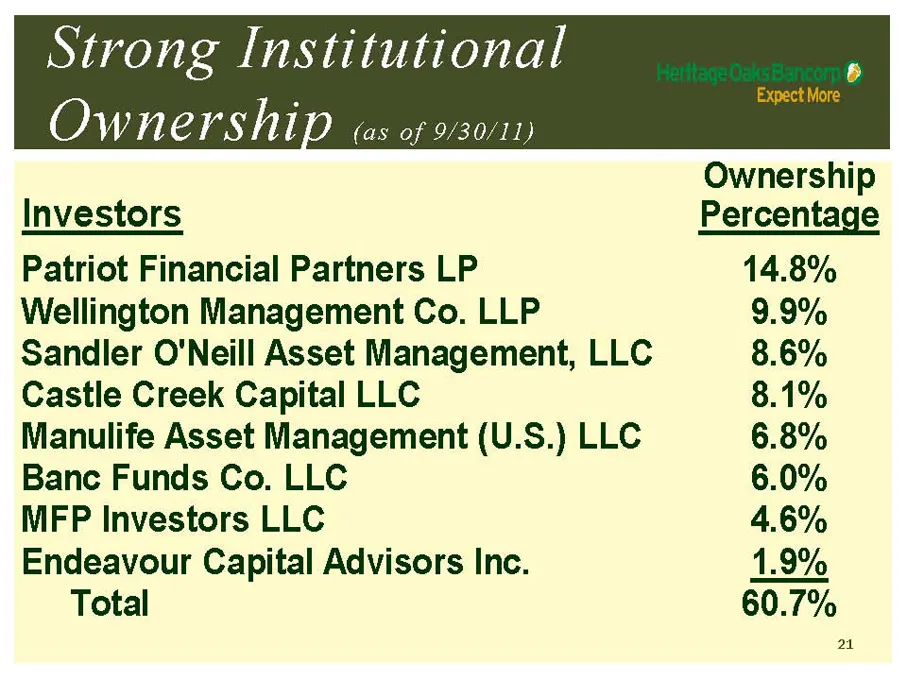
Strong Institutional Ownership (as of 9/30/11) Ownership Investors Percentage Patriot Financial Partners LP 14.8% Wellington Management Co. LLP 9.9% Sandler O'Neill Asset Management, LLC 8.6% Castle Creek Capital LLC 8.1% Manulife Asset Management (U.S.) LLC 6.8% Banc Funds Co. LLC 6.0% MFP Investor
Slide 22: Opportunity
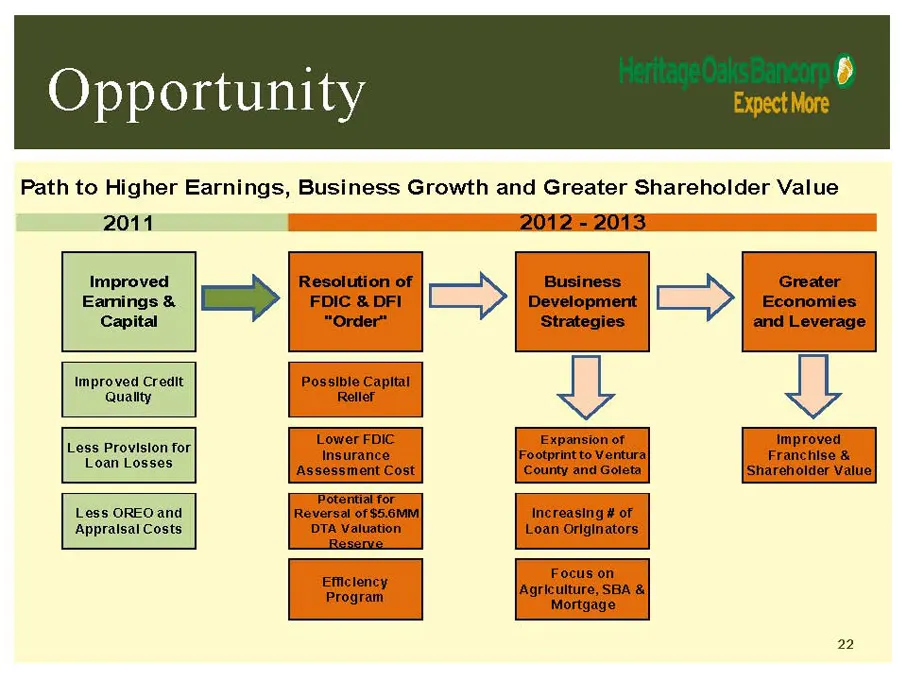
Opportunity Path to Higher Earnings, Business Growth and Greater Shareholder Value 2011 2012 - 2013 Improved Resolution of Business Greater Eamings & FDIC & DFI Development Economies Capital “Order” Strategies and Leverage Improved Creait Possible Capital Quailty Reller Lower FDIC Expansion of impro
Slide 23: Appendix: Ventura County Opportunity
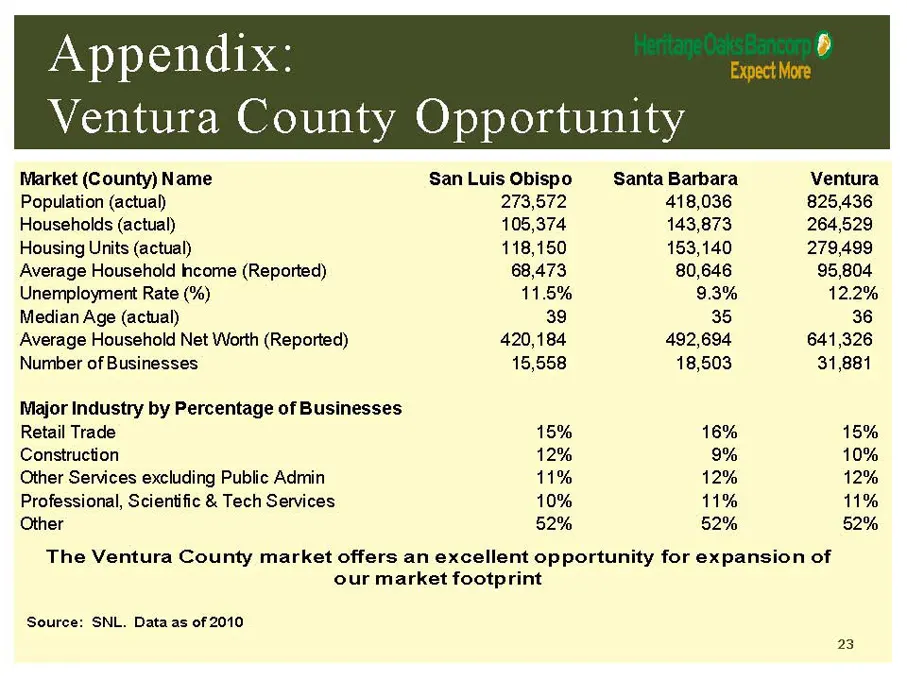
Appendix Ventura County Opportunity Market (County) Name San Luis Obispo Santa Barbara Ventura Population (actual) 273,572 418,036 825,436 Households (actual) 105,374 143,873 264,529 Housing Units (actual) 118,150 153,140 279,499 Average Household Income (Reported) 68,473 80,646 95,804 Unemployment

Slide 24: Thank you!
Thank you! Heritage Oaks Bancorp@ Expect More 24
Source: SEC EDGAR · 8-K filed Feb 7, 2012
More decks from Heritage Oaks Bancorp
 Merger or Acquisition (March 2017)6 slides · Mar 27, 2017
 Merger or Acquisition (February 2017)26 slides · Feb 1, 2017
 West Coast Financial Services Conference 201628 slides · Mar 7, 2016
 West Coast CEO Forum 201628 slides · Feb 3, 2016
 Investor Presentation (March 2015)28 slides · Mar 10, 2015
 Sandler O'Neill 2013 West Coast Financial Services Conference23 slides · Mar 11, 2014