Heritage Oaks Bancorp — Sandler O'Neill 2013 West Coast Financial Services Conference
23 slides from Heritage Oaks Bancorp's conference presentation, Mar 11, 2014
Slide 1: Heritage Oaks Bancorp - Sandler O'Neill West Coast Financial Services Conference
HERITAGE OAKS 7@ BANCORP Sandler O’Neill & Partners, L.P. 2013 West Coast Financial Services Conference March 10-11, 2014 Phoenix, Arizona
Slide 2: Forward Looking Statements
orward Looking Statements Certain statements contained in this Report, including, without limitation, statements containing the words “pelieves’, “anticipates”, “intends”, “expects’, and words of similar impact, constitute “forward-looking statements” within the meaning of Section 27A of the Securit
Slide 3: Overview of Heritage Oaks
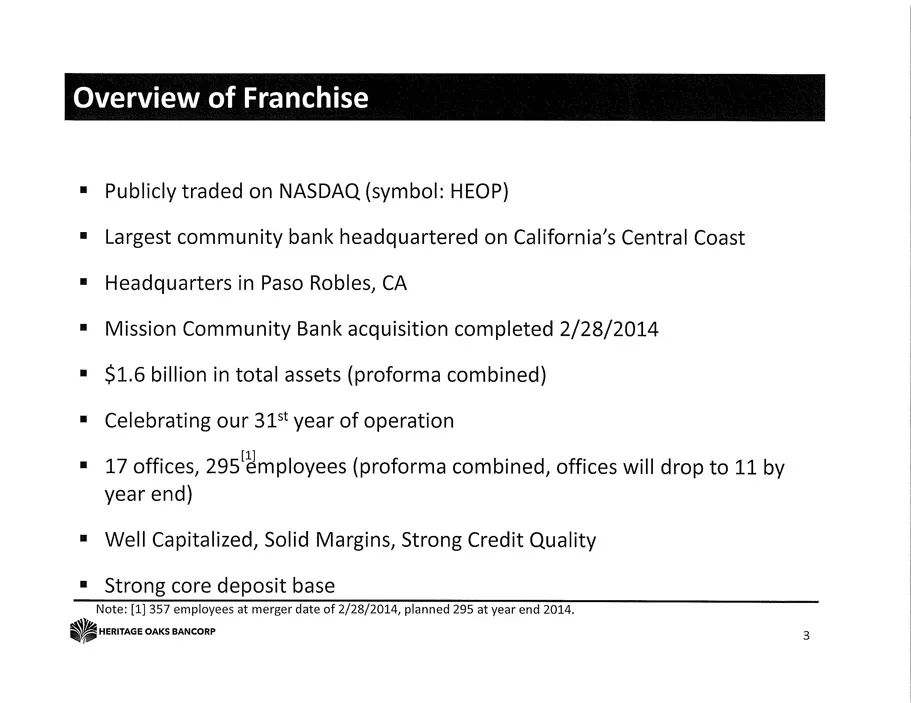
Overview of Fr. Publicly traded on NASDAQ (symbol: HEOP) = Largest community bank headquartered on California’s Central Coast Headquarters in Paso Robles, CA = Mission Community Bank acquisition completed 2/28/2014 $1.6 billion in total assets (proforma combined) = Celebrating our 31* year of operat
Slide 4: Leading Community Bank in Highly Attractive Market Area
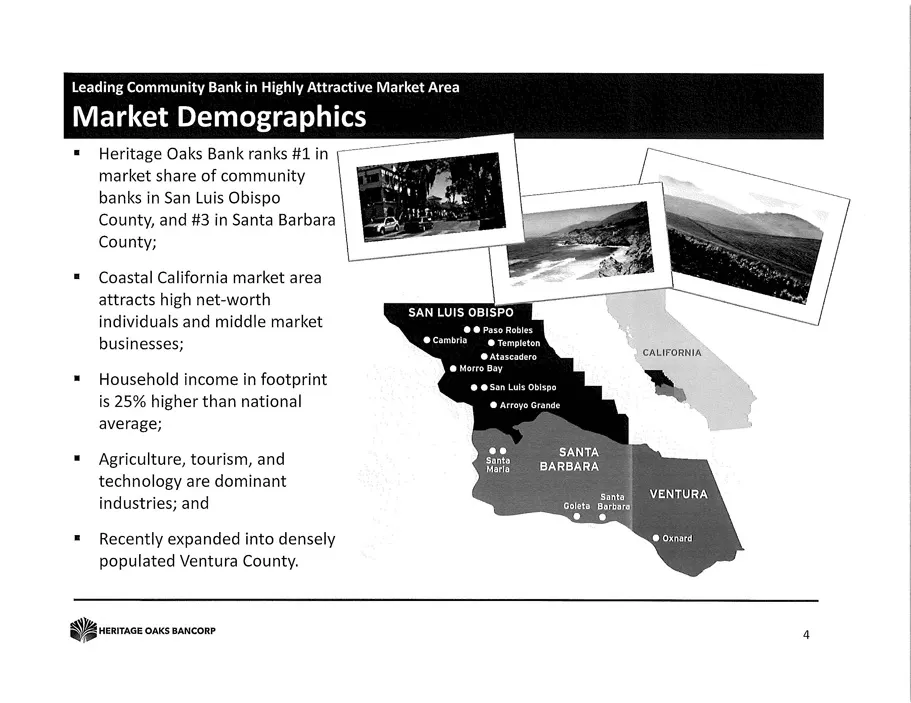
Leading Community Bank in Highly Attractive Market Area Market Demographics Heritage Oaks Bank ranks #2 in market share of community | banks in San Luis Obispo County, and #3 in Santa Barbara | County; Coastal California market area attracts high net-worth individuals and middle market businesses; H
Slide 5: Deposit Market Share
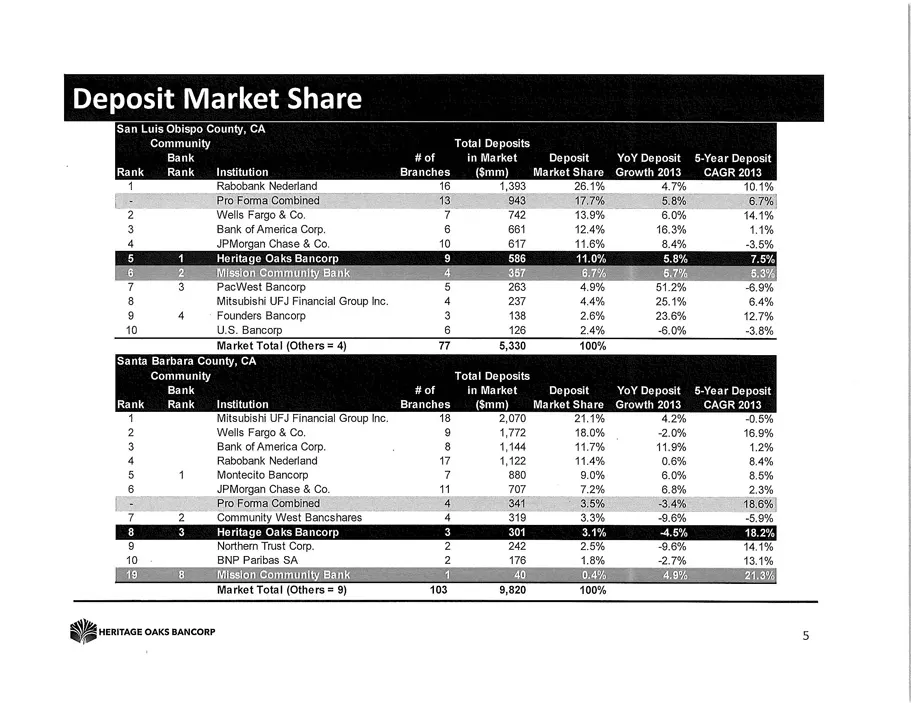
Deposit Market Share ‘Obispo County, CA ‘Community Bank Rank Institution Total Deposits Hof t Deposit Branches 16 YoY Deposit Market Share Growth 2013 3 8.1% 4.7% -Year Deposit CAGR 2013 Total Deposits fof in Market Deposit Branches __(smm) 18 2,070 YoY Deposit Market Share Growth 2013 21.1% 42% 6-Y
Slide 6: Business Model
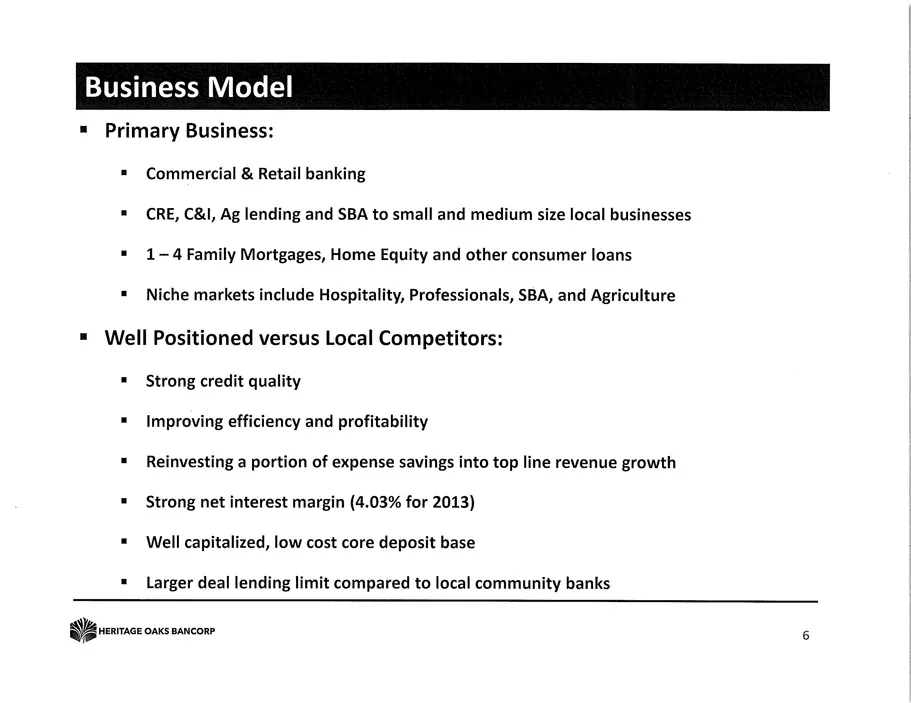
Business Model = Primary Business: = Commercial & Retail banking CRE, C&I, Ag lending and SBA to small and medium size local businesses 1-4 Family Mortgages, Home Equity and other consumer loans Niche markets include italit i SBA, and = Well Positi 1 versus Local C Strong credit quality Improving ef
Slide 7: Earnings High
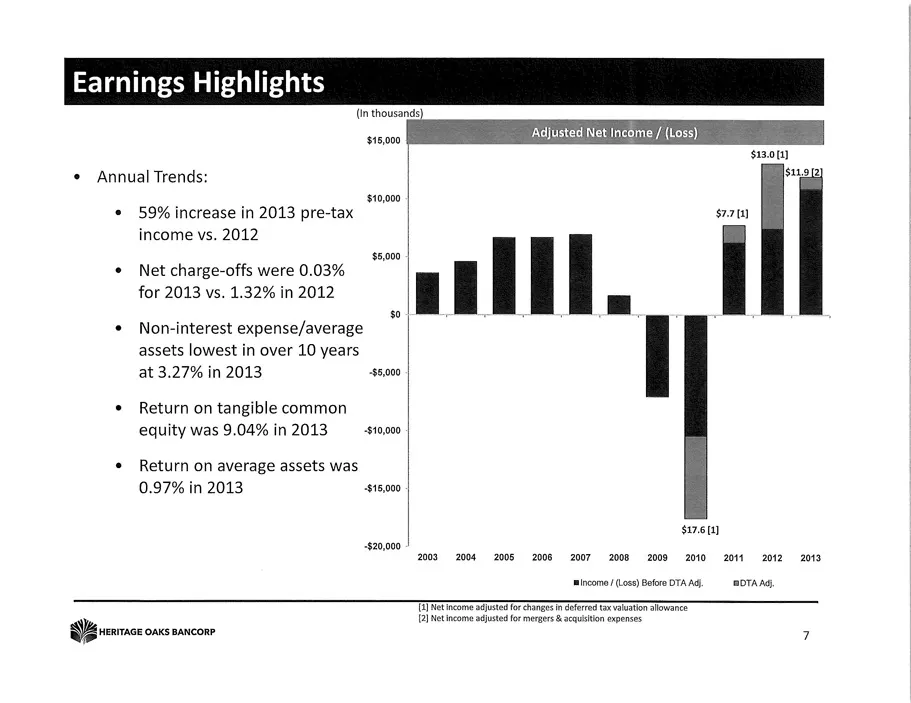
rnings High (In thousands) $15,000 Adjusted Net Incc * Annual Trends: $11.92) $10,000 59% increase in 2013 pre-tax srt) income vs. 2012 $5,000 Net charge-offs were 0.03% i for 2013 vs. 1.32% in 2012 | Es) ‘ Non-interest expense/average assets lowest in over 10 years at 3.27% in 2013 $5,000 Return on
Slide 8: Earnings Trends
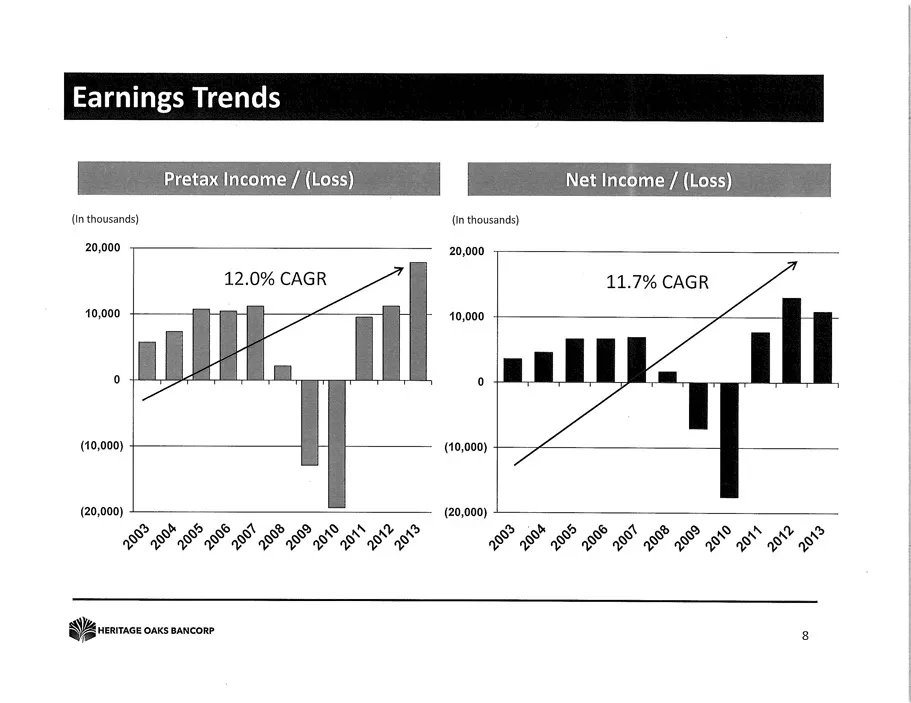
Earnings Trends {in thousands) (in thousands) 20,000, 20,000, 12.0% CAGR 11.7% CAGR 40,000 40,000 ° ai (10,000) (10,000) (20,000) (20,000) PSP PSP Pig gh gh ge FP PF FS PF PF GP Qh Qh GO LPP PP PP oP Gras FPF FPF 8 Mrernocoacencon
Slide 9: Robust Loan & Deposit Growth
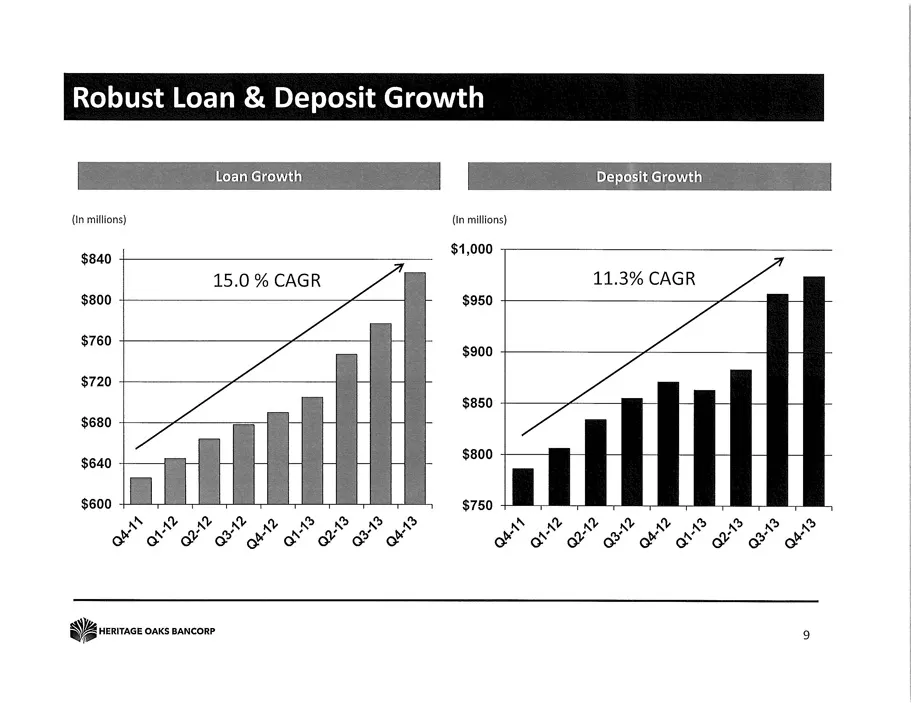
Robust Loan & Deposit Growt (in millions) (in mitions) $840 $1,000 ——£§$@———_————_— 15.0%CAGR 11.3% CAGR a $800 $950 ween $900 $720 + $850 $680 + $640 $800 $600 $750 QBrensoconsoncon
Slide 10: Key Credit Metrics
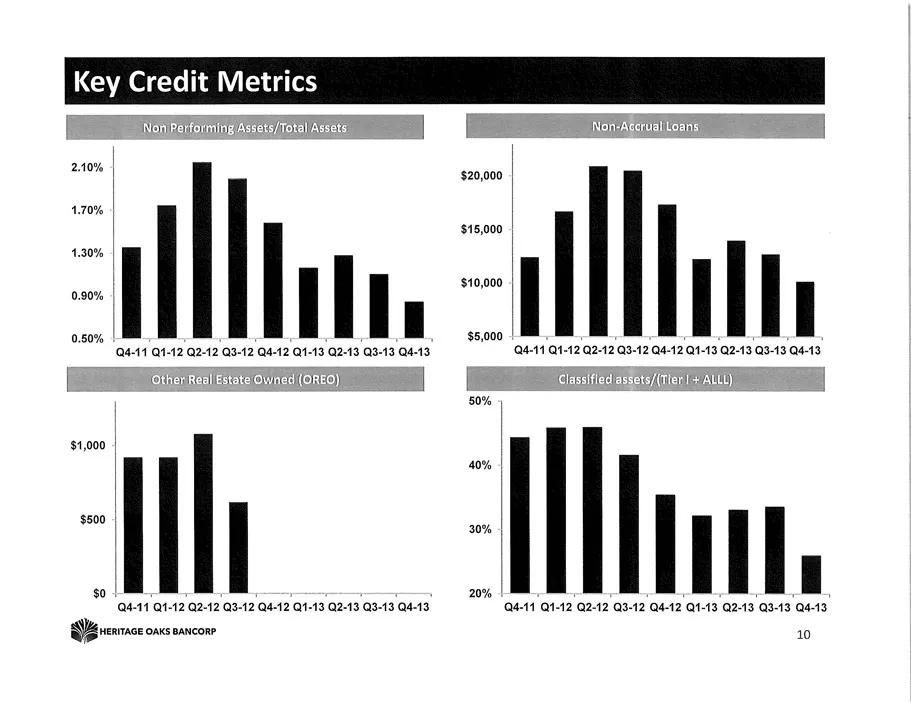
Key Credit Metrics Performing Assets/Total/Asset: f Non-Atcruallloans Non | | aso | | $20,000 | | 170% | | | $15,000 | 1.30% | | $10,000 | o90% | 050% | 06-11 at-2 a2-t2 oe-12 att2 F-19 azt8 2-19 O48 cuttariarnantzasiatsartsas-1att3 ‘lhe Real sate ovined (OREO) 1 | Classfed apts (Ter + AL sox | | |
Slide 11: Low Sensitivity to Market Risk
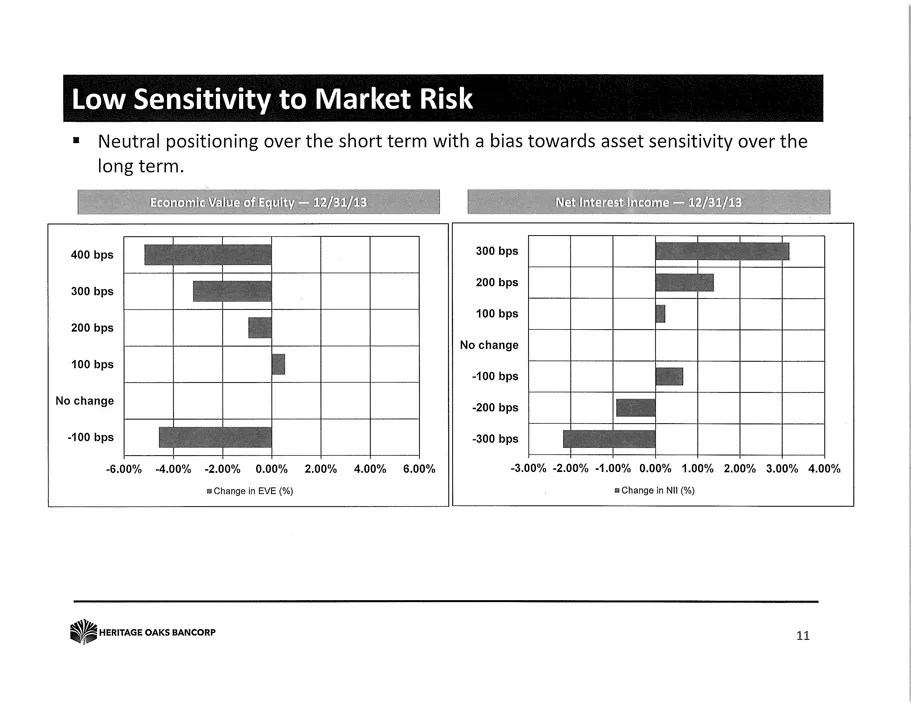
Low Sensitivity to Market Risk = Neutral positioning over the short term with a bias towards asset sensi long term. ivity over the 200 bps ‘Change n EVE (%) ‘Change in (8) QB rearaceomencon
Slide 12: Key 2013 and Recent Accomplishments
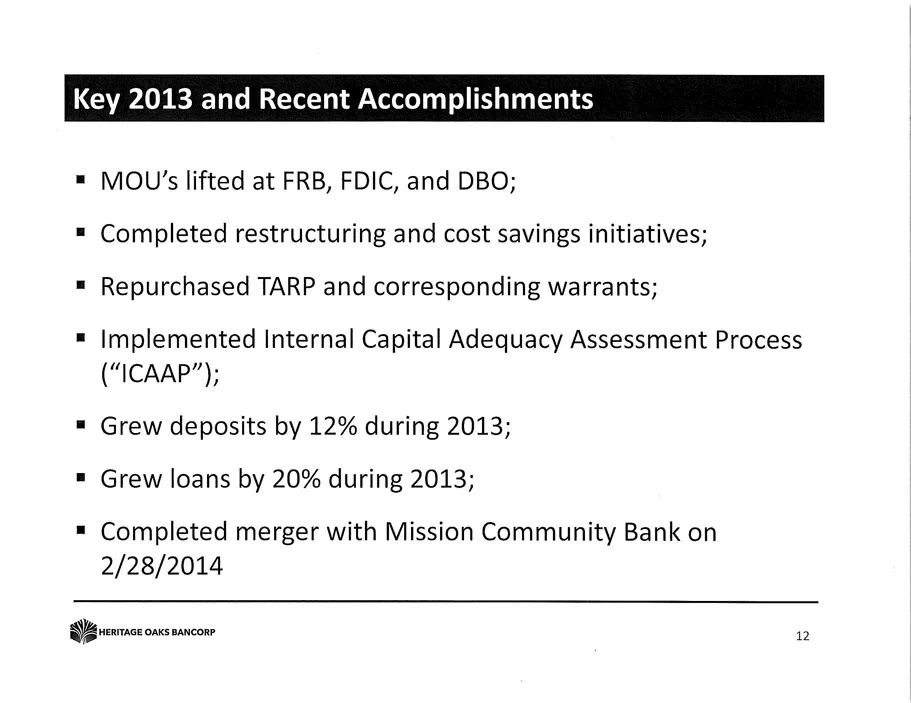
Key 2013 and Recent Accomplishments = MOU’s lifted at FRB, FDIC, and DBO; Completed restructuring and cost savings initiatives; Repurchased TARP and corresponding warrants; Implemented Internal Capital Adequacy Assessment Process (“ICAAP”); Grew deposits by 12% during 2013; Grew loans by 20% during
Slide 13: Significantly increases market share along the Central Coast of California
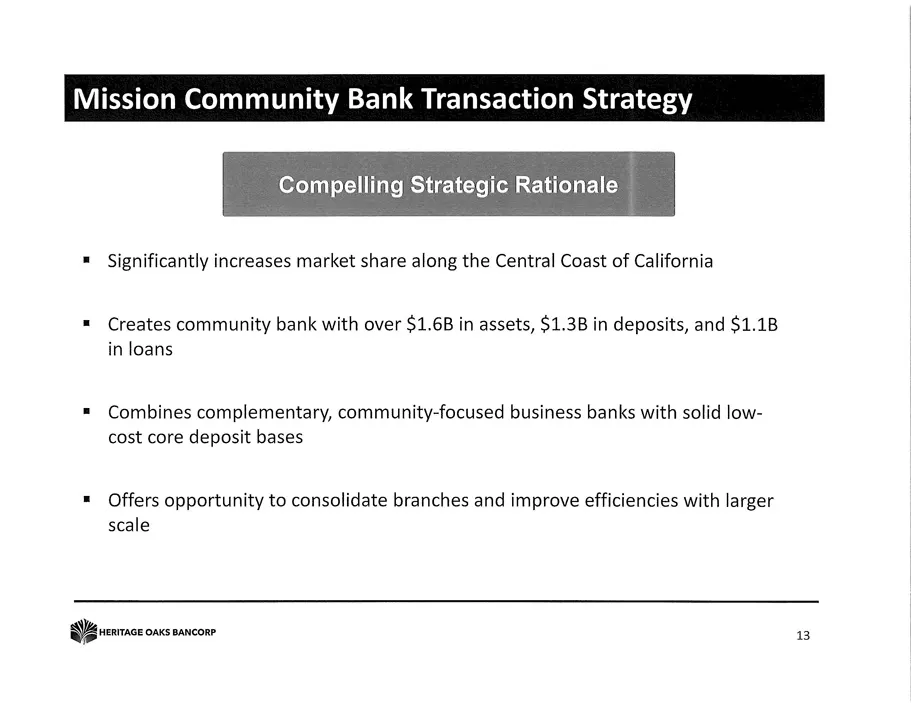
Significantly increases market share along the Central Coast of California Creates community bank with over $1.6B in assets, $1.3B in deposits, and $1.1B in loans Combines complementary, community-focused business banks with solid low- cost core deposit bases Offers opportunity to consolidate branch
Slide 14: Mission Community Bank Transaction Summary
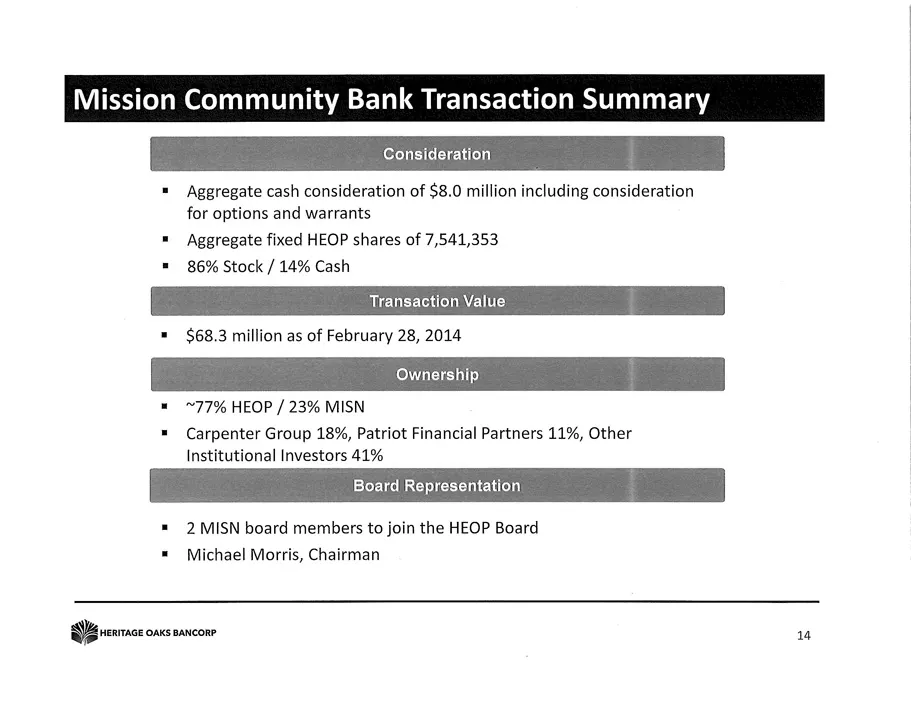
Mission Community Bank Transaction Summary "Aggregate cash consideration of $8.0 million including consideration for options and warrants * Aggregate fixed HEOP shares of 7,541,353 = 86% Stock / 14% Cash Transaction Value * $68.3 million as of February 28, 2014 ™ ~77% HEOP / 23% MISN = Carpenter Gro
Slide 15: Mission Community Bank Transaction Benefits
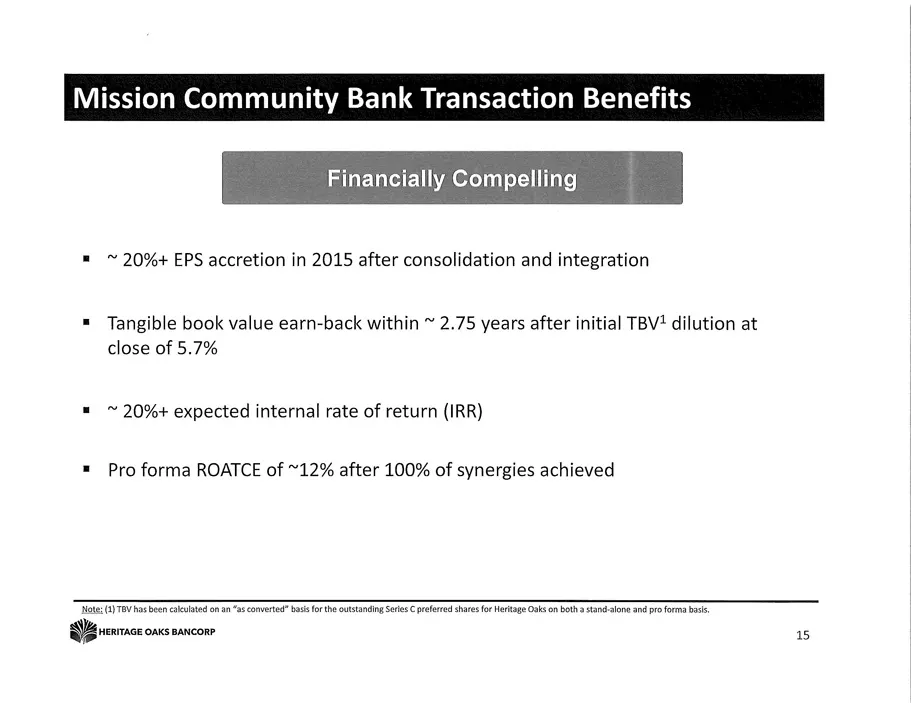
Mission Community Bank Transaction Benefits ~ 20%+ EPS accretion in 2015 after consolidation and integration Tangible book value earn-back within ~ 2.75 years after initial TBV? dilution at close of 5.7% ~ 20%+ expected internal rate of return (IRR) Pro forma ROATCE of ~12% after 100% of synergies a
Slide 16: Cost Savings & Revenue Enhancements Overview
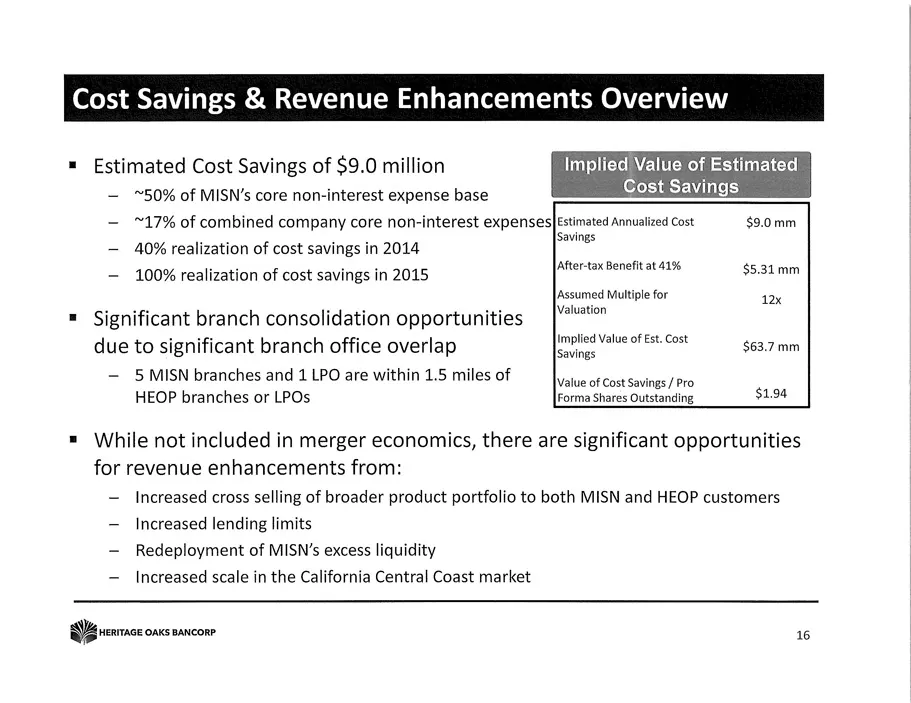
Cost Savings & Revenue Enhancements Overview = Estimated Cost Savings of $9.0 million — ~50% of MISN’s core non-interest expense base — “17% of combined company core non-interest - 40% realization of cost savings in 2014 - 100% realization of cost savings in 2015 savings after-tax Benefit at 41% $5.
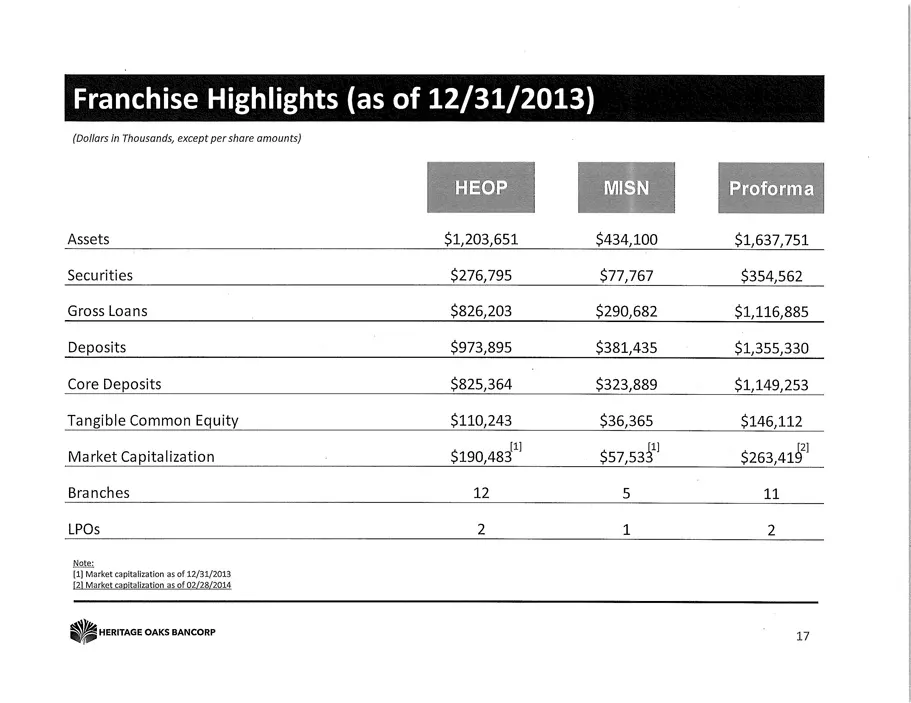
Slide 17: Pro Forma Combined Financial Summary
(Boitars in Thousands, except per share amounts) Ea ES Ea Assets $1,203,651 $434,100 $1,637,751 Securities $276,795 $77,767 $354,562 __ Gross Loans $826,203 $290,682 $1,116,885 Deposits $973,895 $381,435 $1,355,330 Core Deposits $825,364 $323,889 $1,149,253 Tangible Common Equity $110,243 $36,365 $1
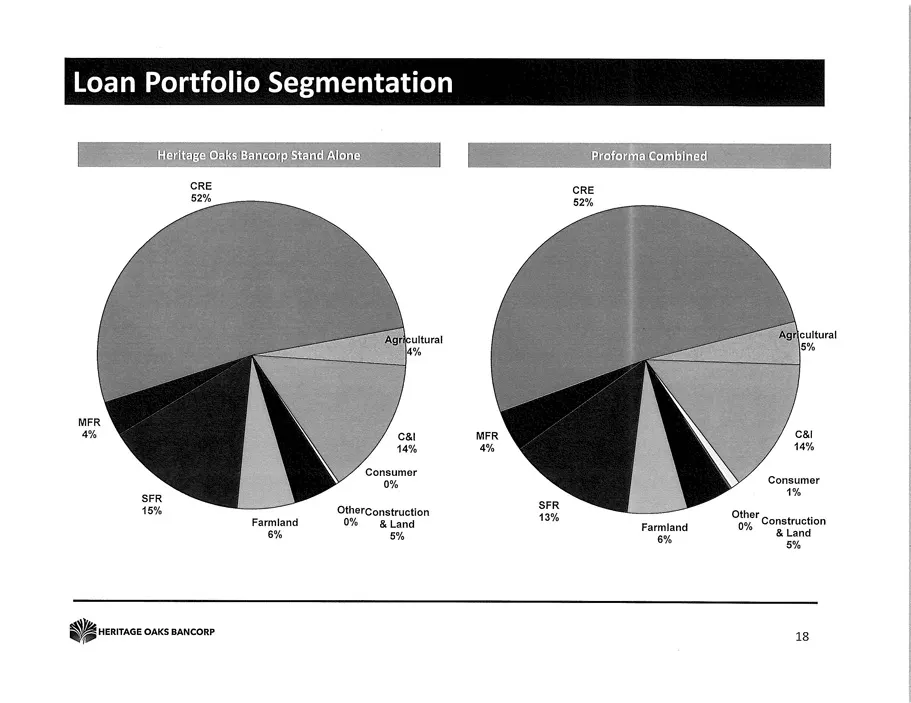
Slide 18: Loan Portfolio Segmentation
oan Portfolio Segmentati corp stand Alone Proforma Combined ore 52% MER a% MER +% Consumer 0% SFR 18% — Farmland 6% Otherconstruction Other, 0% Land snr whe, Construction &% pre ‘Land 5% QB rernnes ons anconr
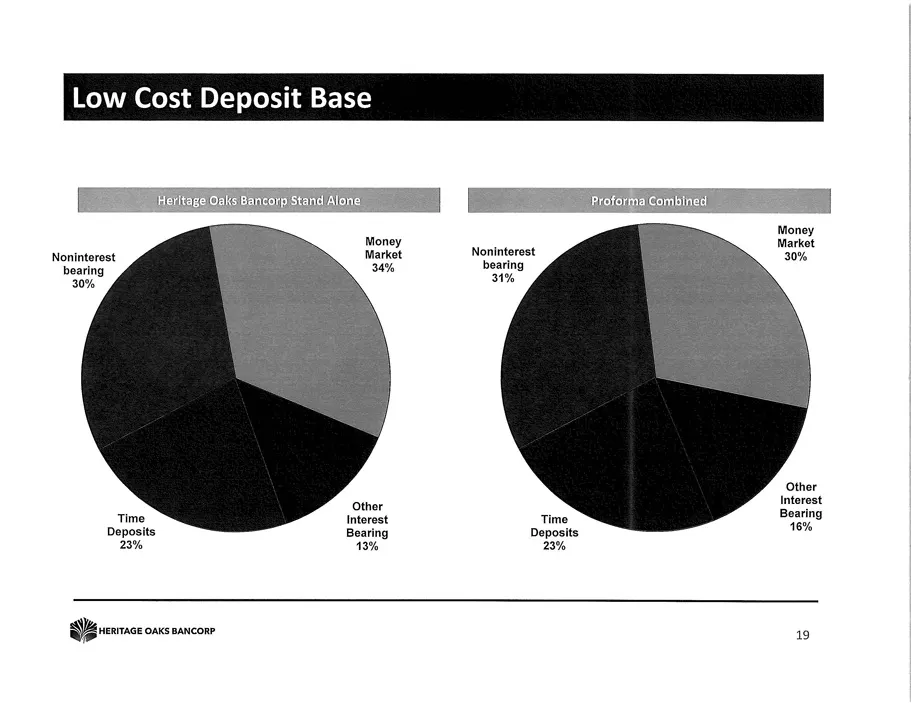
Slide 19: Low Cost Deposit Base
Low Cost Deposit Base Noninterest Market Noninterest "i jearing 31% Other Interest Bearing Time Deposits 23% Time Deposits 23% SBremoconesseon ”
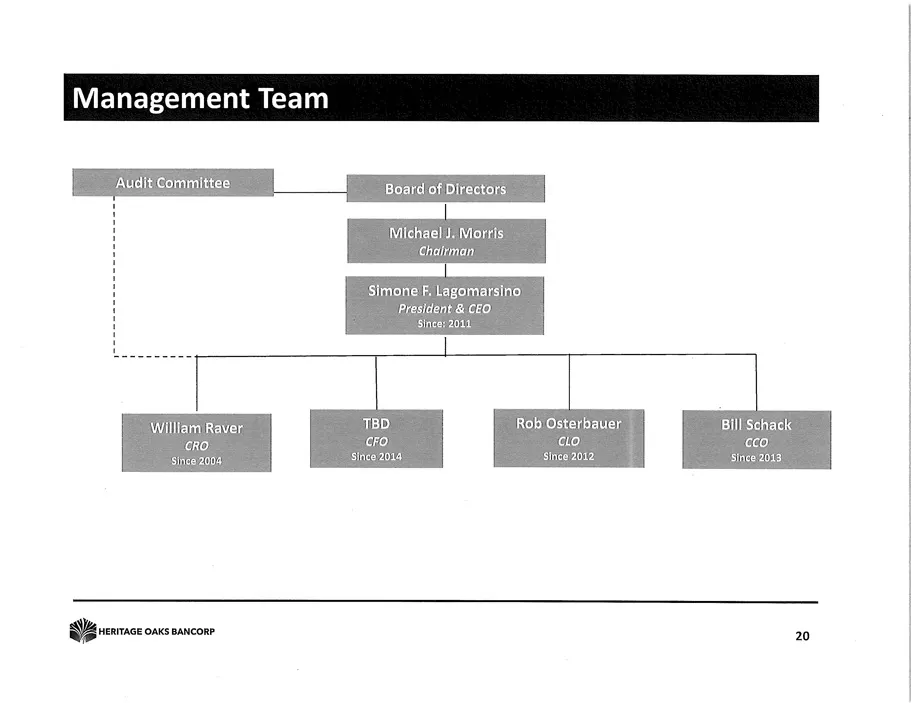
Slide 20: Management
Manage! Te: | Audit Committee Board of Directors Michael J. Mortis Ghalman Simone F. lagomarsino President & CEO sine! 2011 William Raver TBD Rob Osterbauer Bill Schack CRO Cro. cco. since 2004 since 2014 since2012 Since 2013 i remaceomeamcoe ‘s
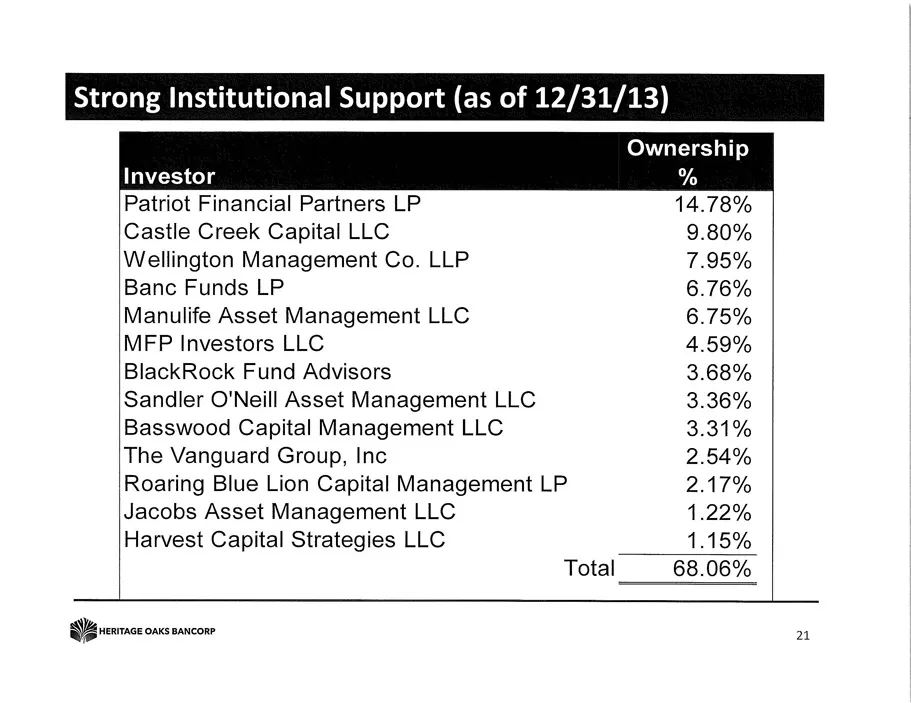
Slide 21: Institutional Support (as of 12/31/13)
Institutional Support (as of 12/31/13) Ownership Investor % Patriot Financial Partners LP 14.78% Castle Creek Capital LLC 9.80% Wellington Management Co. LLP 7.95% Banc Funds LP 6.76% Manulife Asset Management LLC 6.75% MFP Investors LLC 4.59% BlackRock Fund Advisors 3.68% Sandler O'Neill Asset Mana
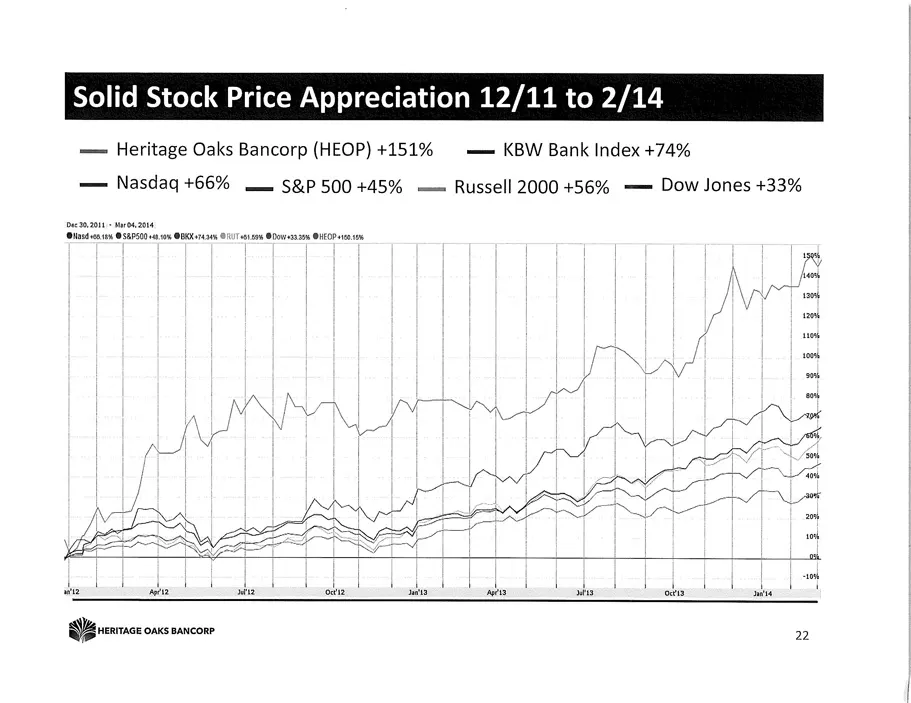
Slide 22: Solid Stock Price Appreciation 12/11 to 2/14
Solid Stock Price Appreciation 12/11 to 2/14 — Heritage Oaks Bancorp (HEOP) +151% = — KBW Bank Index +74% — Nasdaq +66% — S&P 500+45% — Russell 2000 +56% —= Dow Jones +33% Stamm aaa ease nan sage nate mnie aera masta Jsesieniasenlnis nanan QB rernsceomsenncon 2
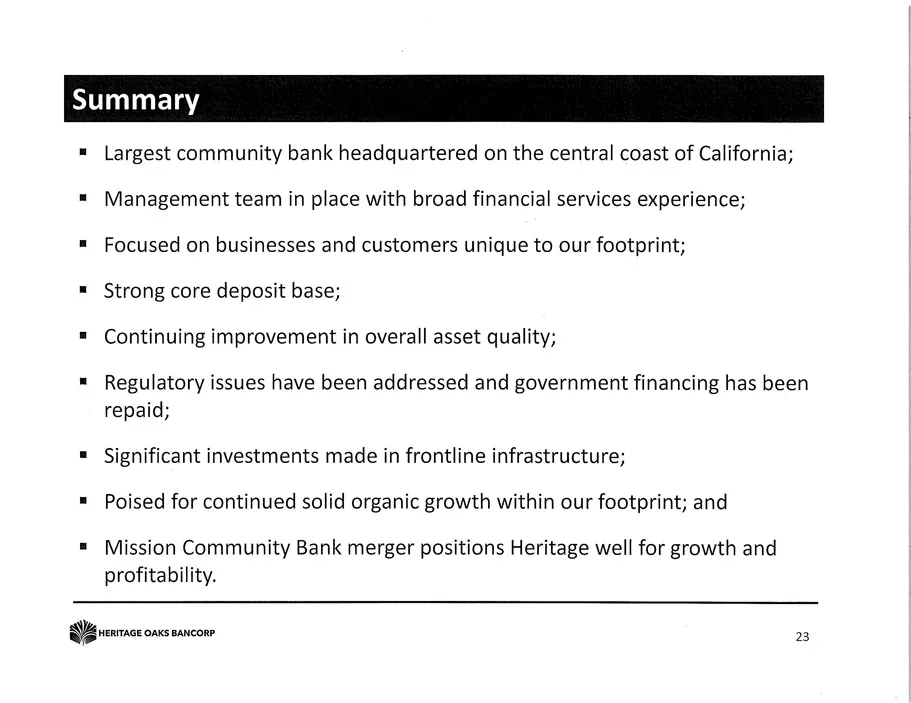
Slide 23: Largest community bank headquartered on the central coast of California
Largest community bank headquartered on the central coast of California; Management team in place with broad financial services experience; Focused on businesses and customers unique to our footprint; Strong core deposit base; Continuing improvement in overall asset quality; Regulatory issues have b
Source: SEC EDGAR · 8-K filed Mar 11, 2014
More decks from Heritage Oaks Bancorp
 Merger or Acquisition (March 2017)6 slides · Mar 27, 2017
 Merger or Acquisition (February 2017)26 slides · Feb 1, 2017
 West Coast Financial Services Conference 201628 slides · Mar 7, 2016
 West Coast CEO Forum 201628 slides · Feb 3, 2016
 Investor Presentation (March 2015)28 slides · Mar 10, 2015
 Sandler O'Neill Conference 201329 slides · Mar 6, 2013