Heritage Oaks Bancorp — West Coast Financial Services Conference 2016
28 slides from Heritage Oaks Bancorp's conference presentation, Mar 7, 2016
Slide 1: West Coast Financial Services Conference
West Coast Financial Services Conference March 7-8, 2016 | San Diego, CA NG SANDLER O’NEILL + PARTNERS HERITAGE OAKS BANCORP
Slide 2: Forward Looking Statements
FORWARD LOOKING STATEMENTS Certain statements contained in this Presentation, including, without limitation, statements containing the words “believes”, “anticipates”, “intends”, expects’, and words of similar impact, constitute “forward- looking statements” within the meaning of Section 27A of the
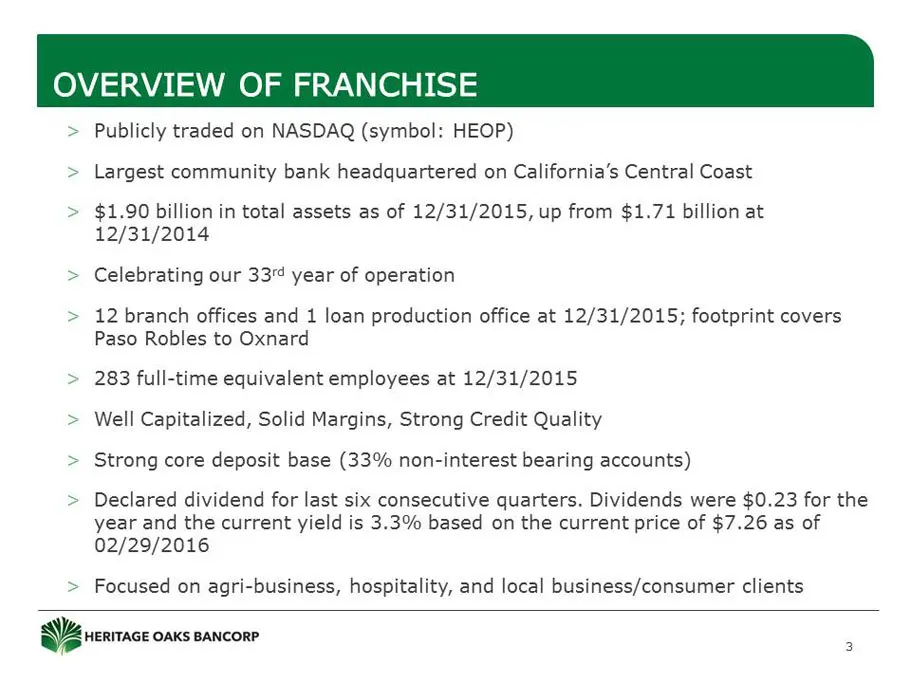
Slide 3: Overview of Franchise
OVERVIEW OF FRANCHIS v Vv v Publicly traded on NASDAQ (symbol: HEOP) Largest community bank headquartered on California’s Central Coast $1.90 billion in total assets as of 12/31/2015, up from $1.71 billion at 12/31/2014 Celebrating our 33 year of operation 12 branch offices and 1 loan production off
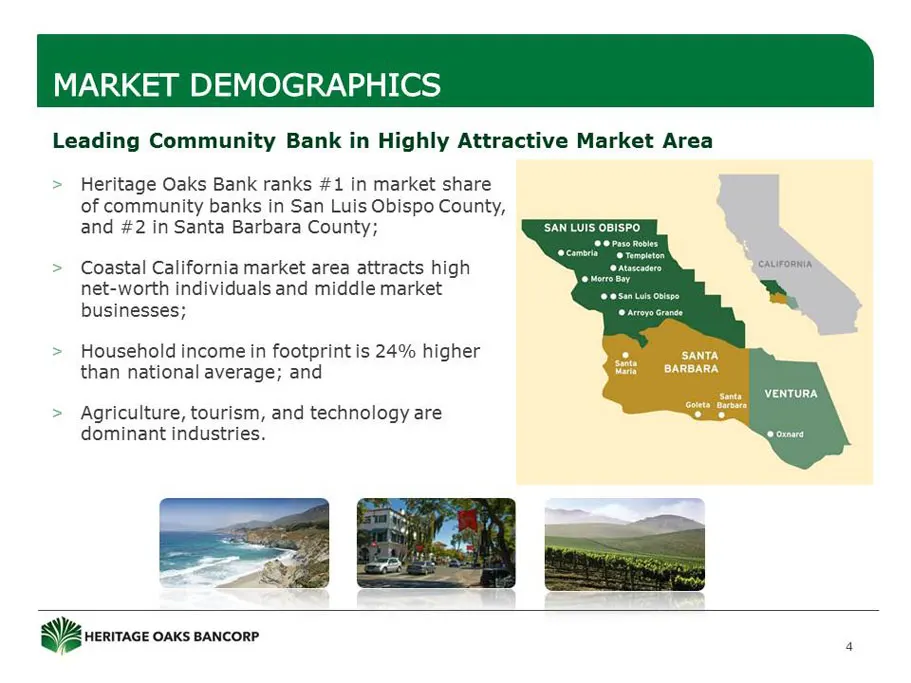
Slide 4: Market Demographics
MARKET DEMOGRAPHICS Leading Community Bank in Highly Attractive Market Area > Heritage Oaks Bank ranks #1 in market share of community banks in San Luis Obispo County, and #2 in Santa Barbara County; SAN LUIS Coastal California market area attracts high net-worth individuals and middle market busine
Slide 5: Business Model
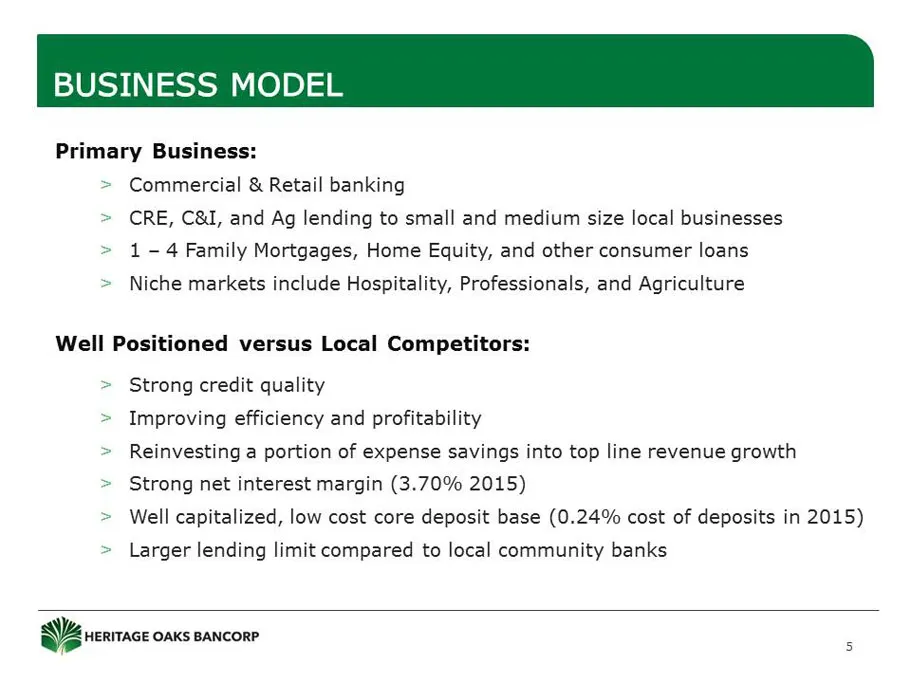
BUSINESS MODEL Primary Business: > Commercial & Retail banking > CRE, C&I, and Ag lending to small and medium size local businesses 1-4 Family Mortgages, Home Equity, and other consumer loans Niche markets include Hospitality, Professionals, and Agriculture Well Positioned versus Local Competitors:
Slide 6: Milestones
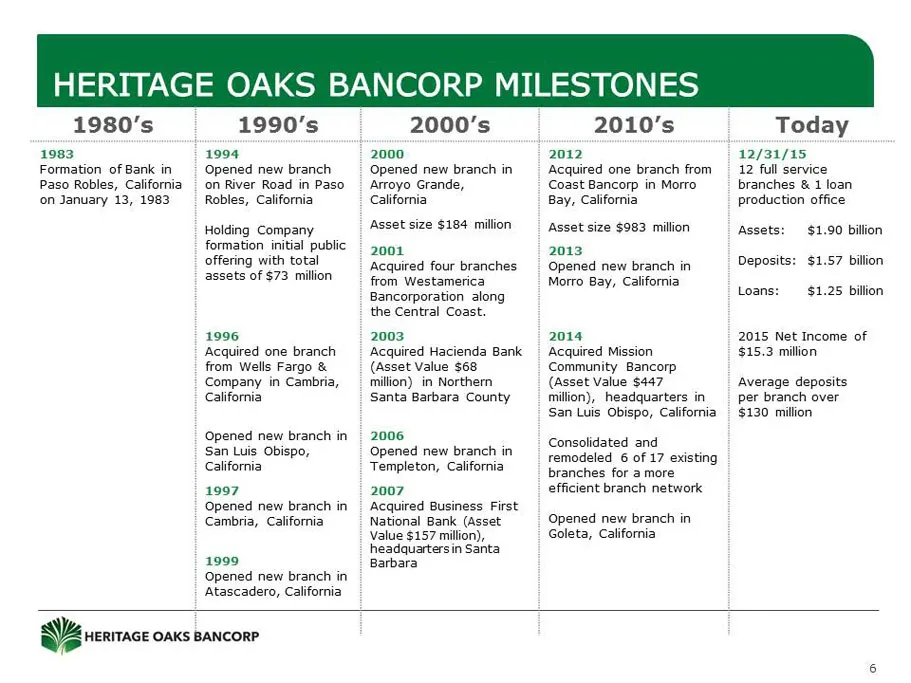
HERITAGE OAKS BANCORP MILESTONES r 1 1980's 1990's 1983 1994 Formation of Bank in — Opened new branch Paso Robles, California on River Road in Paso on January 13, 1983 Robles, California Holding Company formation initial public offering with total assets of $73 million 1996 Acquired one branch from
Slide 7: Market Share and Market Demographics
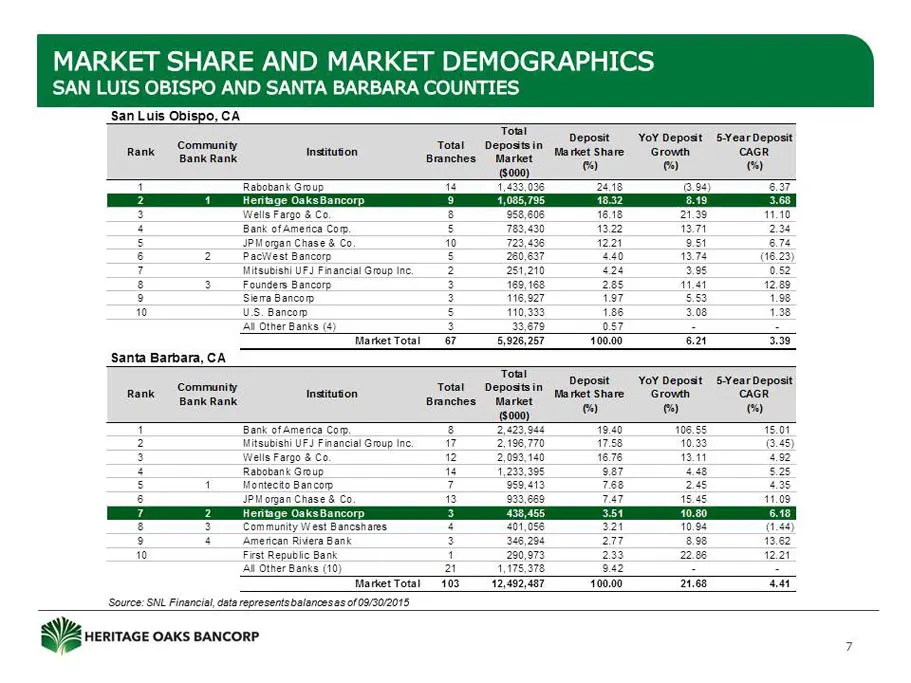
MARKET SHARE AND MARKET DEMOGRAPHICS SAN LUIS OBISPO AND SANTA BARBARA COUNTIES San Luis Obispo, CA = i ne Sn os see oa, eae atin “ora ee ($000) Santa Barbara, CA ‘cael Total oes Deposit YoY Depost 5-YearDeposit Rank bole Institufon Posts IM as ret Share. Growth: CAGR Seo LDL RE wt Seam os : ‘Source
Slide 8: Opportunities in Our Market
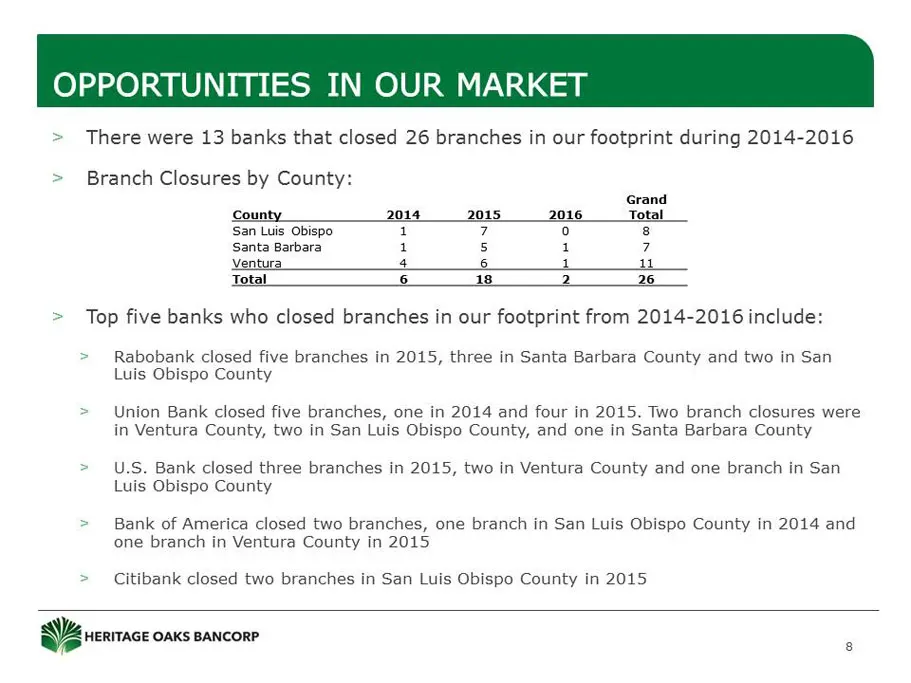
OPPORTUNITIES IN OUR MARKET There were 13 banks that closed 26 branches in our footprint during 2014-2016 v Branch Closures by County: Grand County 2014 2015 2016 Total San Luis Obispo 1 7 0 8 Santa Barbara 1 s 1 7 Ventura 4 6 1 iL Total a 18 2. 26 v Top five banks who closed branches in our footpri
Slide 9: Earnings Per Share
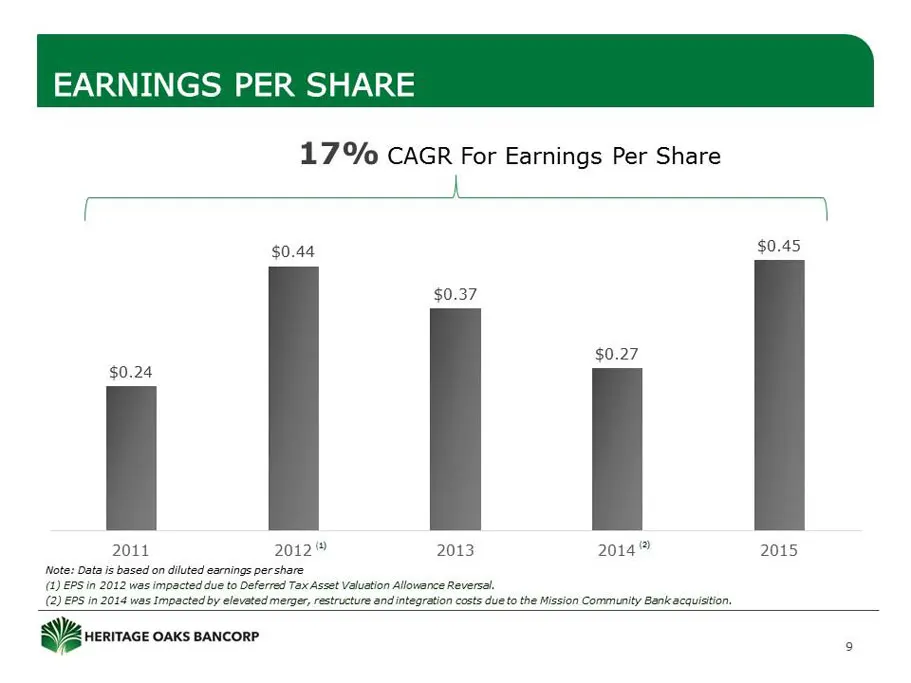
EARNINGS PER SHARE 17% CAGR For Earnings Per Share $0.44 $0.45 $0.37 $0.27 $0.24 ij 2011 20129 2013 2014” 2015 Note: Data is based on diluted earnings per share (2) EPS in 2012 was impacted due to Deferred Tax Asset Valuation Allowance Reversal. (2) EPS in 2014 was Impacted by elevated merger, restr
Slide 10: Outperforming Peers in Shareholder Return
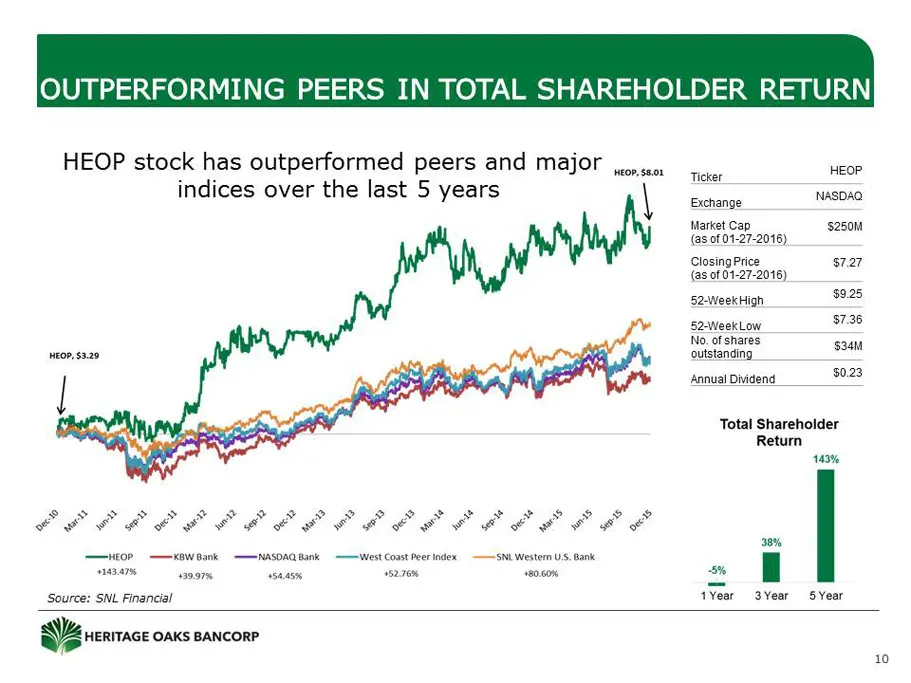
OUTPERFORMING PEERS IN L_ SHAREHOLDER RETURN HEOP stock has outperformed peers and Major jc...s60: indices over the last 5 years \ CEP PEP P PEP CEEP PCP EPO PE Hor —xowsank =~ —nasona sank —west Coast Peer index ——SNL Western US. Bank susarn 997% saan 52.76% 80.60% Source: SNL Financial Ticker EO E
Slide 11: Strong Capital Levels
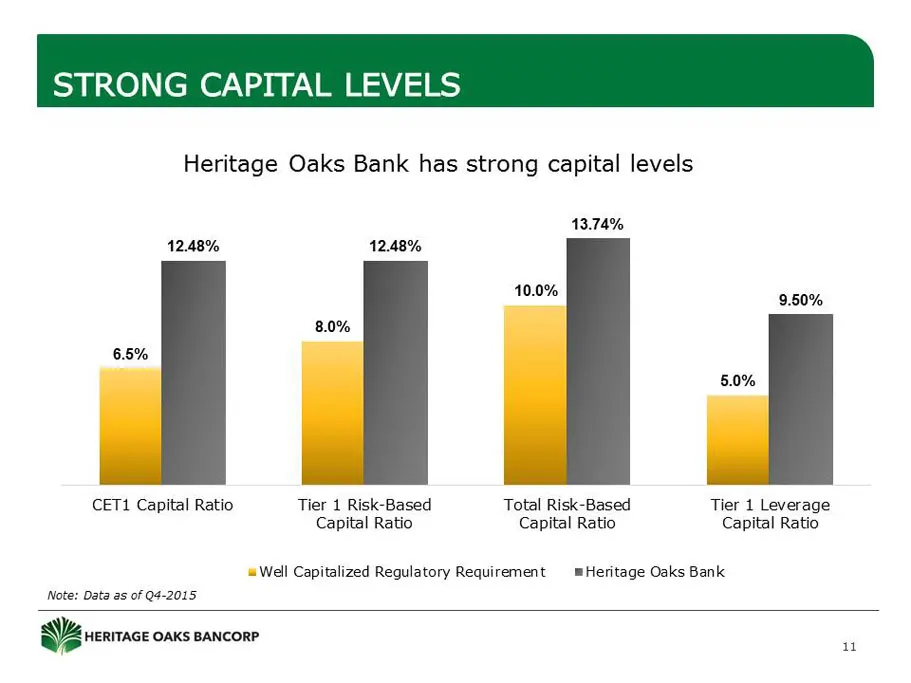
STRONG CAPITAL LEVELS Heritage Oaks Bank has strong capital levels 13.74% 12.48% 12.48% a 9.50% 8.0% 6.5% 5.0% CET1 Capital Ratio Tier 1 Risk-Based Total Risk-Based Tier 1 Leverage Capital Ratio Capital Ratio Capital Ratio = Well Capitalized Regulatory Requirement Heritage Oaks Bank Note: Data as of
Slide 12: Profitability Trends
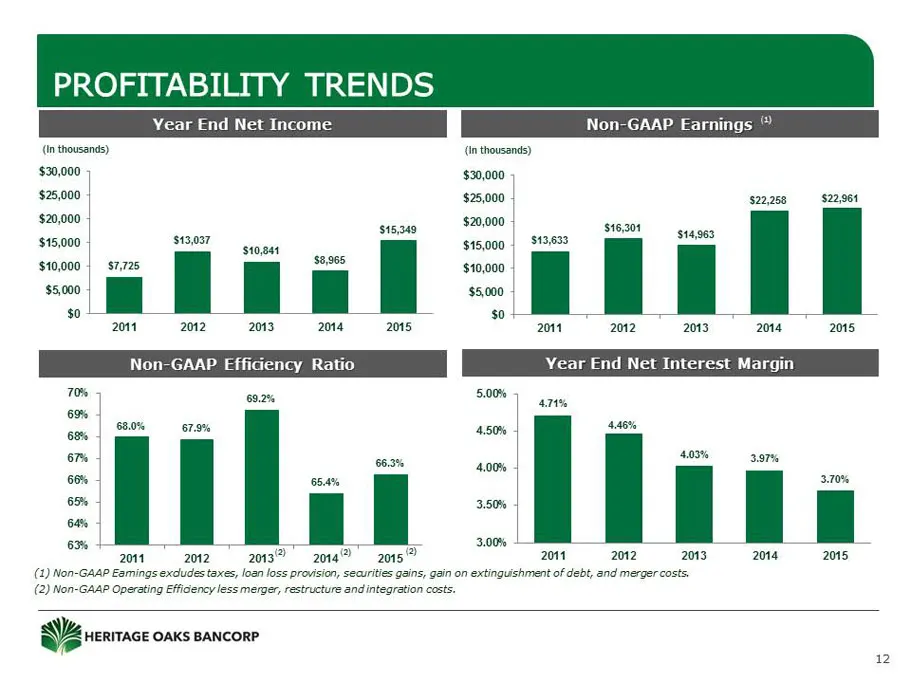
PROFITABILITY TRENDS (in thousands) (in thousands) $30,000 $30,000 $25,000 $25,000 $22,258 $22,961 520,000 : $13,037 paused pa saan sass $15,000 $10,041 $15,000 ‘ $10,000 a 725 ia ee $10,000 $0 $0 a 2013 al 2014 2013 2015 Non-GAAP Efficiency Ratio Year End Net Interest Margin 02% for 69% = cm | OR o
Slide 13: Key Credit Metrics
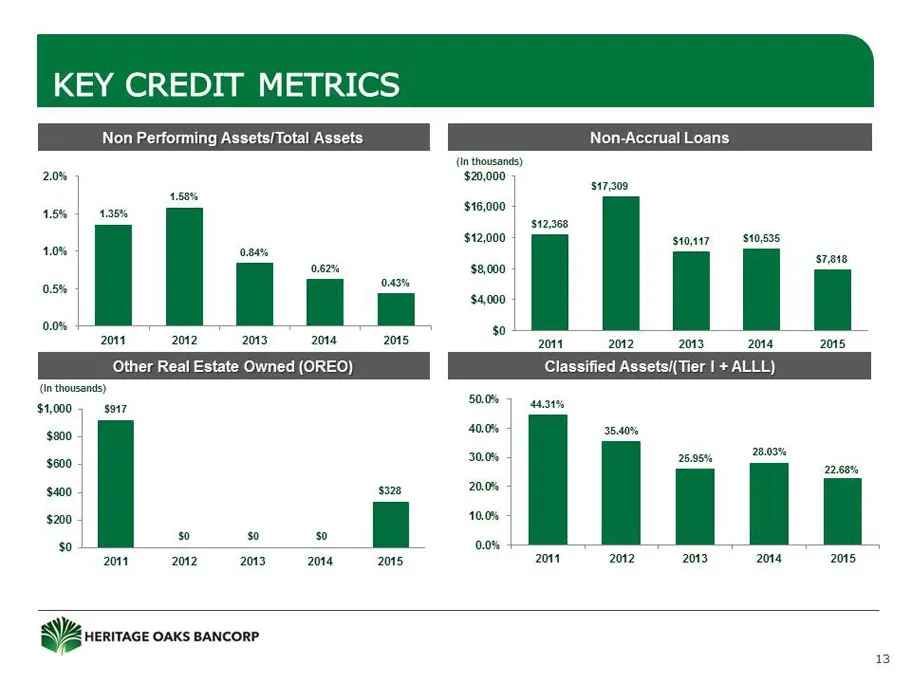
KEY CREDIT METRICS (in thousands) 2.0% $20,000 17.309 1.50% 15% | 135% seam) $12,368 $12,000 stoat7—$10595 1.0% s7318 i 82% $8,000 — 043% Be ~ 0.0% so 2011 22 203 2015 20120122013 Other Real Estate Owned (OREO) Classified Assets/(Tier | CHT) (in thousands) 50.0% $1,000 $917 4431 $200 40.0% 3540% 30.
Slide 14: Loan & Deposit Growth
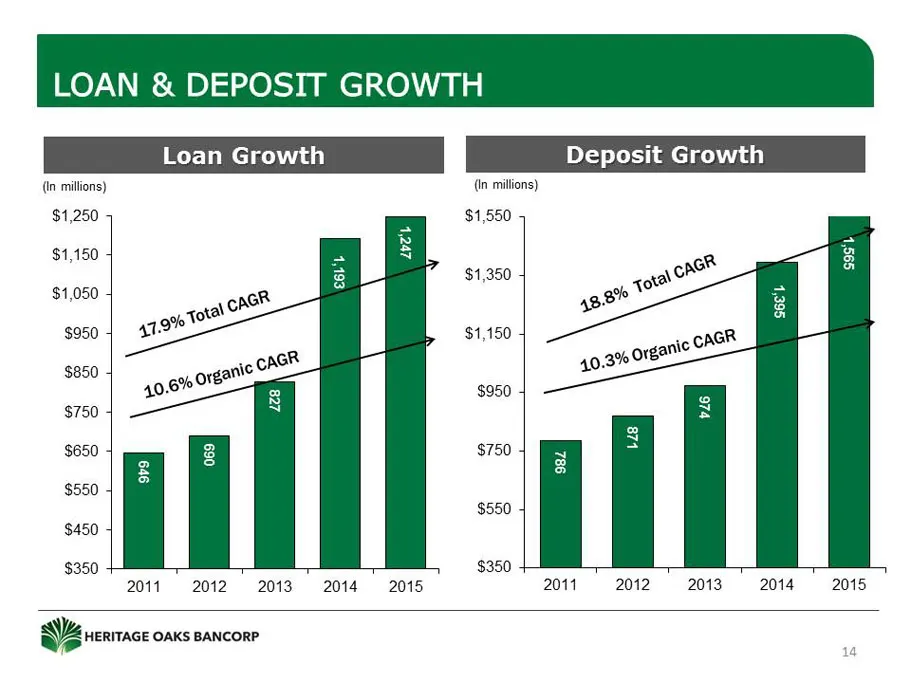
LOAN & DEPOSIT GROWTH PF toan Growth | (ln millions) (In millions) $1,250 $1,550 $1,150 $1,350 $1,050 $950 $1,150 $850 $950 $750 $650 $750 $550 $550 $450 $350 $350 2011-2012, 2013, 2014 2015 2011 2012-2013 2014. 2015 |ERITAGE OAKS BANCORP iw
Slide 15: Loan Portfolio Segmentation
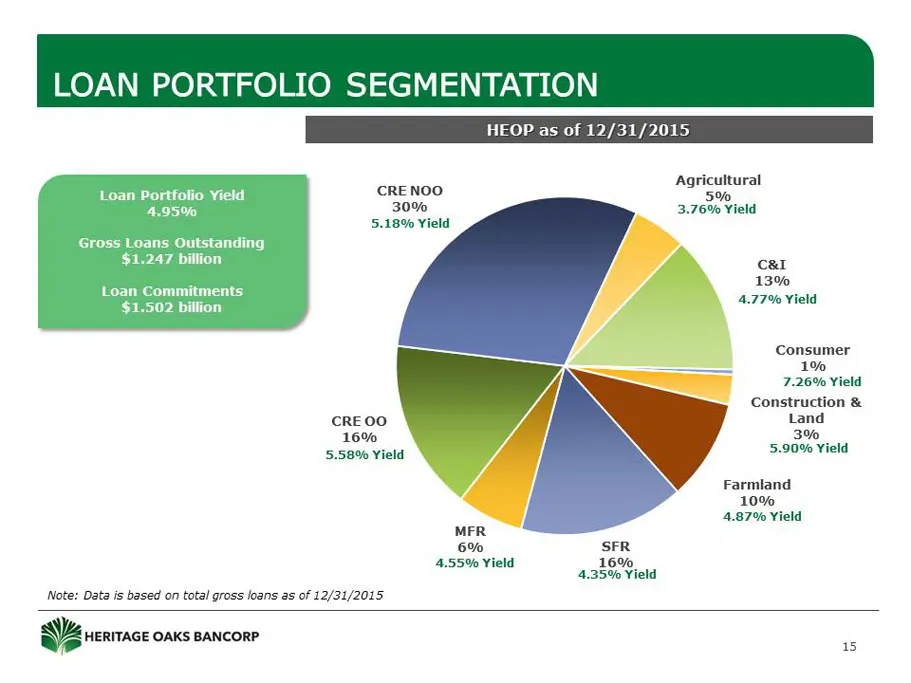
LOAN PORTFOLIO SEGMENTATION HEOP as of 12/31/2015 Agricultural CRENOO 5% 30 3.76% Yield 5.18% Yield Car 13% 4.77% Yield Consumer 1% 7.26% Yield Construction & CREOO Land 16% e 3% 5.58% Yield / 5.90% Yield L Farmland 10% 4.87% Yield MFR 6% SFR 4.55% Yield 16%. 4.35% Yield Data is based on total gross
Slide 16: CRE Loan Characteristics
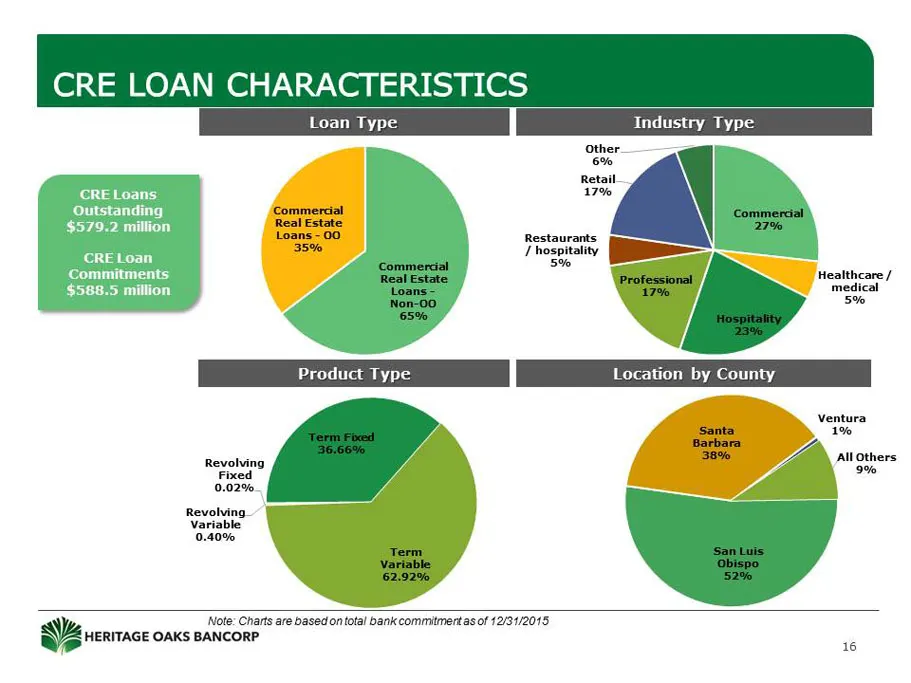
CRE LOAN CHARACTERISTICS Loan Type Industry Type Other oe Retail CRE Loans 1790 Outstanding commensal 579.2 million ton a ‘ Lee, Restaurants / hospitality ee CRE Loan ant Commitments Healthcare / $588.5 million medical 5% Product Type ocation by County Ventura Revolving Fixed 0.029%, Revolving Varia
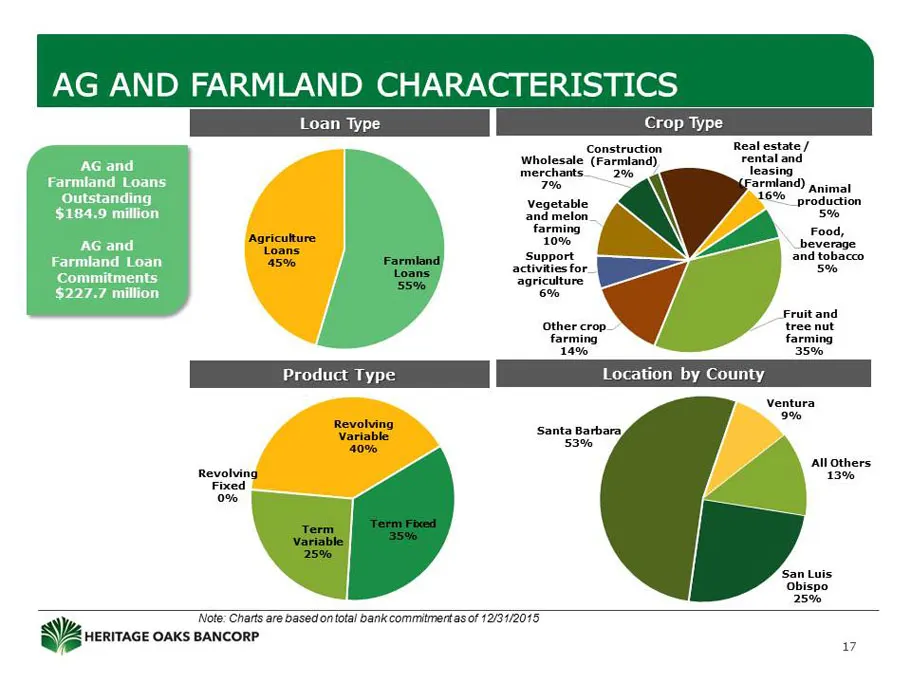
Slide 17: Ag and Farmland Characteristics
AG AND FARMLAND CHARACTERISTICS Construction Real estate / wholesale (Farmland) rental and merchants, Teasing 7% Vegetable activities for agriculture 6% Fruit and tree nut Ventura 9% Allothers 13% ‘San Luis Obispo 25% we Note: Charts are based on total bank commitments of 12/31/2075 HERITAGE OAKS BA
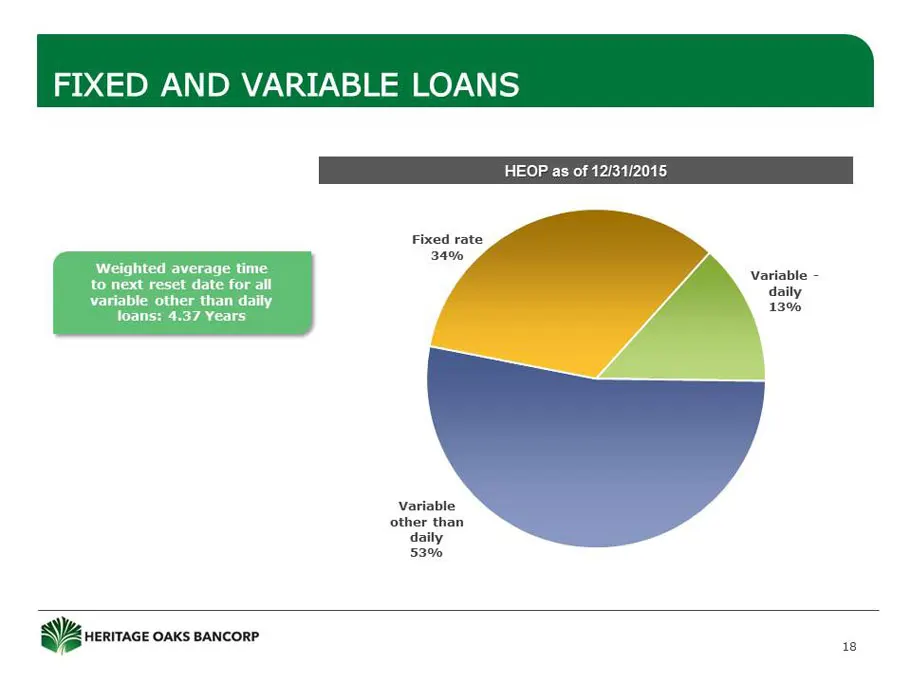
Slide 18: Fixed and Variable Loans
FIXED AND VARIABLE LOANS HEOP as of 12/31/2015 Fixed rate 34% Weighted average time to next reset date for all Variable - daily 13% variable other than daily loans: 4.37 Years Variable other than daily 53%
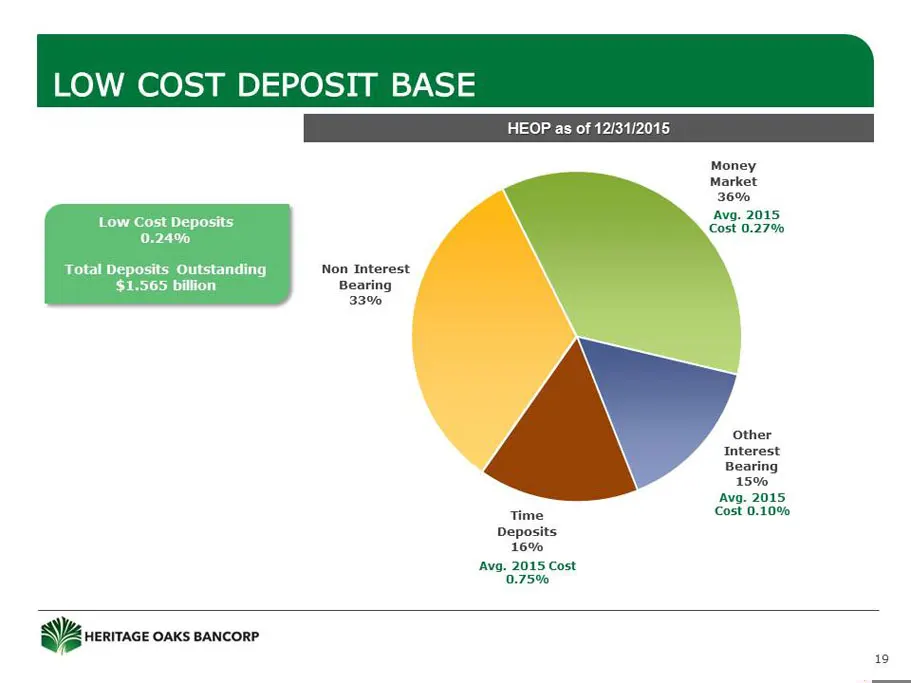
Slide 19: Low Cost Deposit Base
LOW COST DEPOSIT BASE HEOP as of 12/31/2015 Money Market 36% Avg. 2015 Cost 0.27% Low Cost Deposits 0.24% Total Deposits Outstanding Non Interest $1,565 billion Bearing 33% Other Interest Bearing 15% Avg. 2015 Time Cost 0.10% Deposits 16% Ava. 2015 Cost 0.75% NV HERITAGE OAKS BANCORP 19
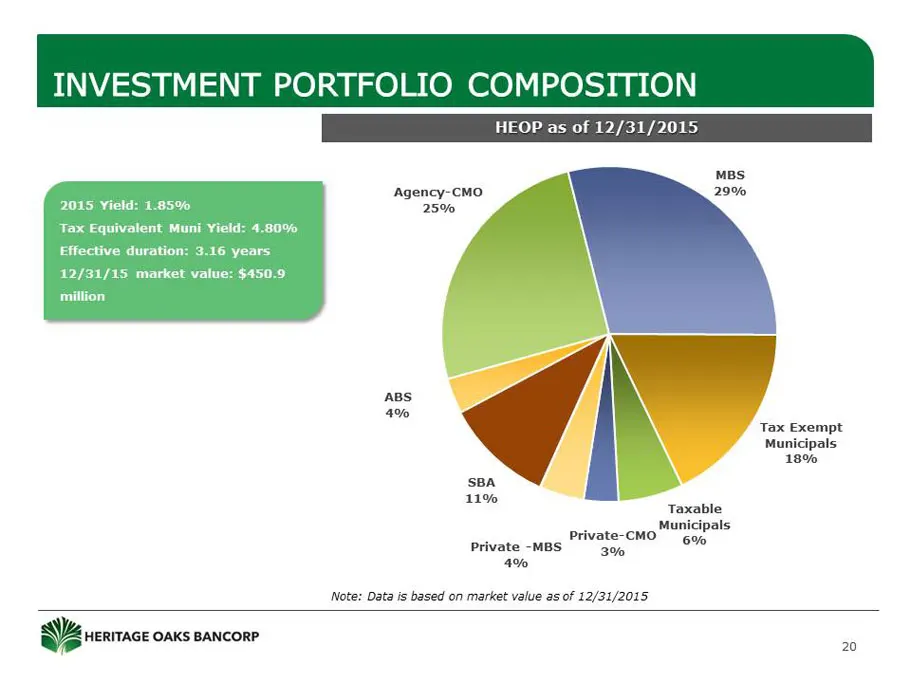
Slide 20: Investment Portfolio Composition
INVESTMENT PORTFOLIO COMPOSITIO HEOP as of 12/31/2015 MBs Agency-CMO 25% ABs 4% Tax Exempt 7 Municipals 18% 11% Taxable Municipals Private-CMO 60% Private -MBS 30%, 4% Note: Data is based on market value as of 12/31/2015 i HERITAGE OAKS BANCORP 20
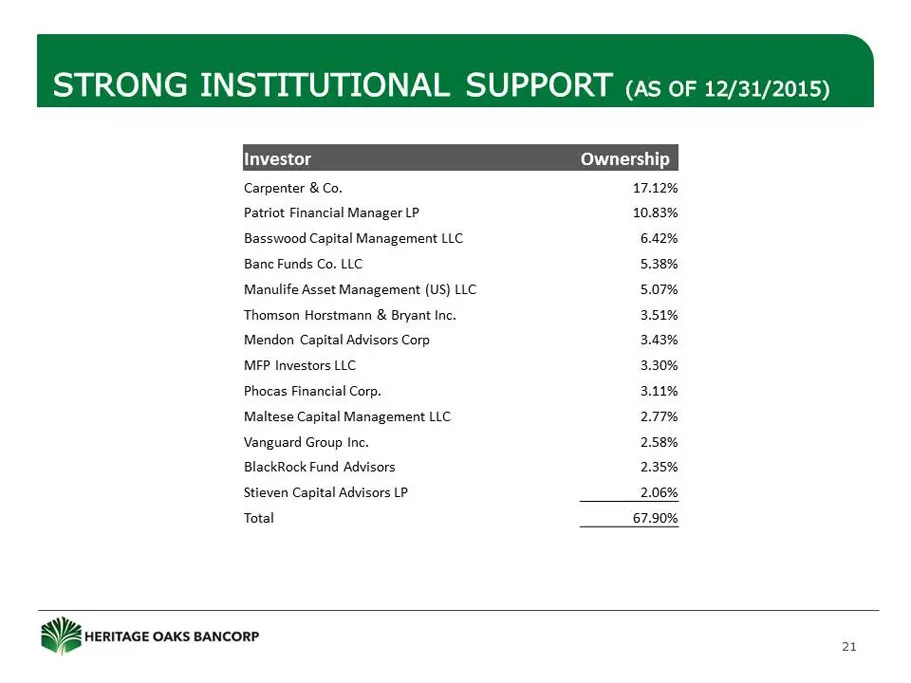
Slide 21: Strong Institutional Support
STRONG INSTITUTIONAL SUPPORT (as oF 12/31/2015) investor Carpenter & Co. Patriot Financial Manager LP Basswood Capital Management LLC Banc Funds Co. LLC Manulife Asset Management (US) LLC Thomson Horstmann & Bryant Inc. Mendon Capital Advisors Corp MEP Investors LLC Phocas Financial Corp. Maltese Ca
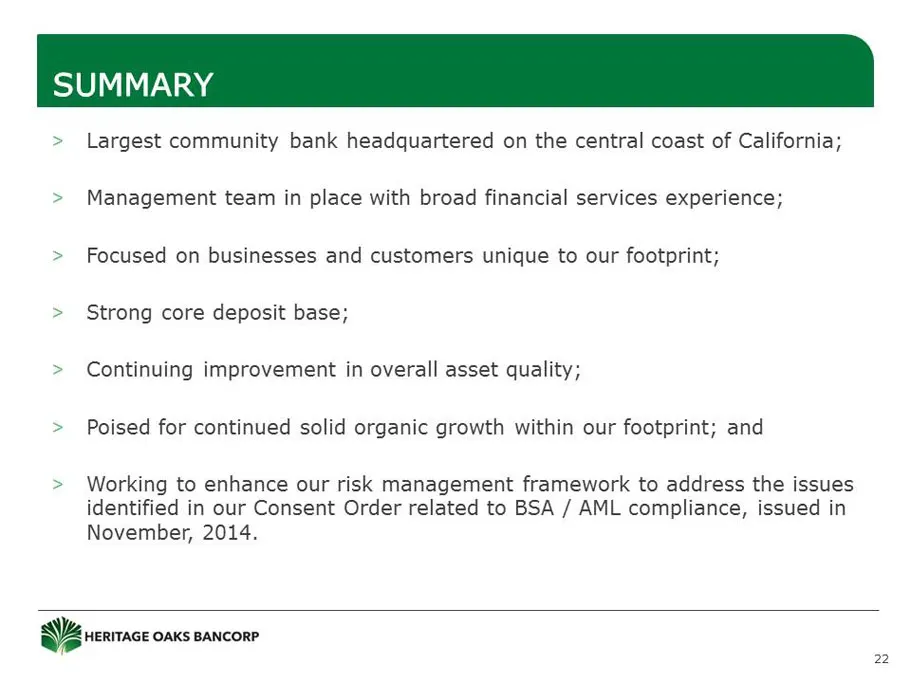
Slide 22: Summary
SUMMAR v v Largest community bank headquartered on the central coast of California; Management team in place with broad financial services experience; Focused on businesses and customers unique to our footprint; Strong core deposit base; Continuing improvement in overall asset quality; Poised for co
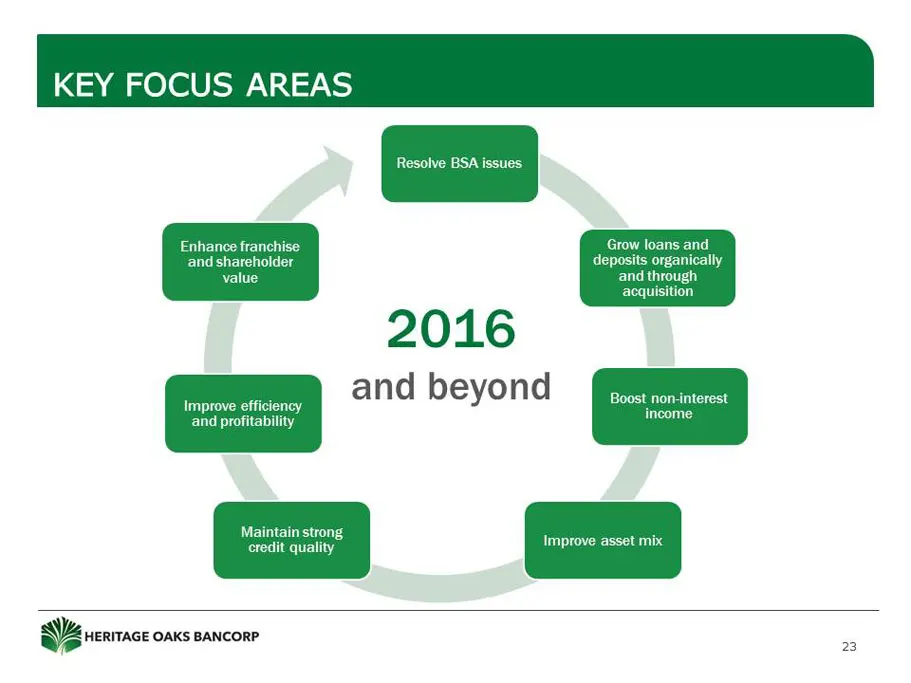
Slide 23: Key Focus Areas
KEY FOCUS AREAS Resolve BSA issues Grow loans and deposits organically and through equisition Enhanee franchise and shareholder value 2016 and beyond (eae Improve efficiency income and profitability Maintain strong ‘codit quallty Improve asset mix NV} HERITAGE OAKS BANCORP 8
Slide 24: Appendix
APPENDIX
Slide 25: Management Team
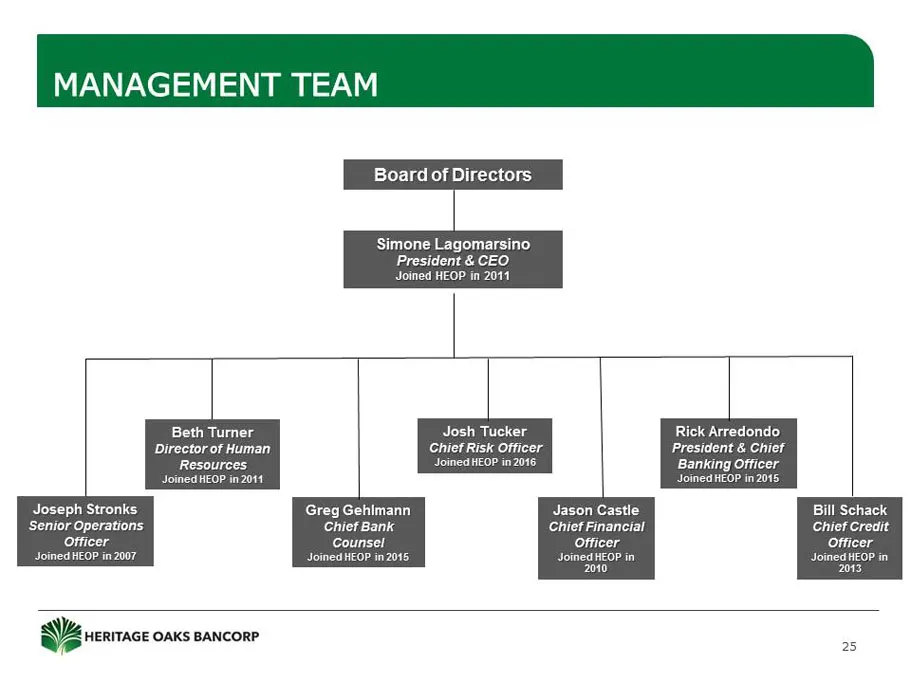
MANAGEMENT TEAM Board of Directors Simone Lagomarsino President & CEO Joined HEOP in 2011 Beth Turner Josh Tucker Rick Arredondo Director of Human Chief Risk Officer President & Chief Resources Joined HEOP in 2016 Banking Officer Joined HEOP in 2014 Joined HEOP in 2015 Joseph Stronks, Greg Gehimann
Slide 26: Consent Order - BSA / AML
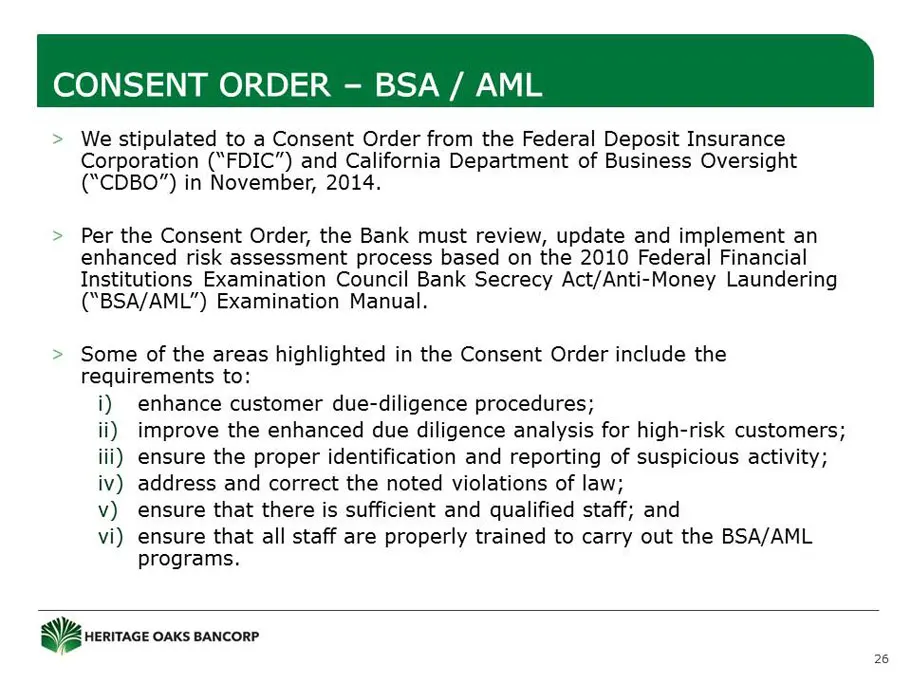
CONSENT ORDER - BSA / AML We stipulated to a Consent Order from the Federal Deposit Insurance Corporation (“FDIC”) and California Department of Business Oversight (“CDBO”) in November, 2014. Per the Consent Order, the Bank must review, update and implement an enhanced risk assessment process based o
Slide 27: Low Sensitivity to Market Risk
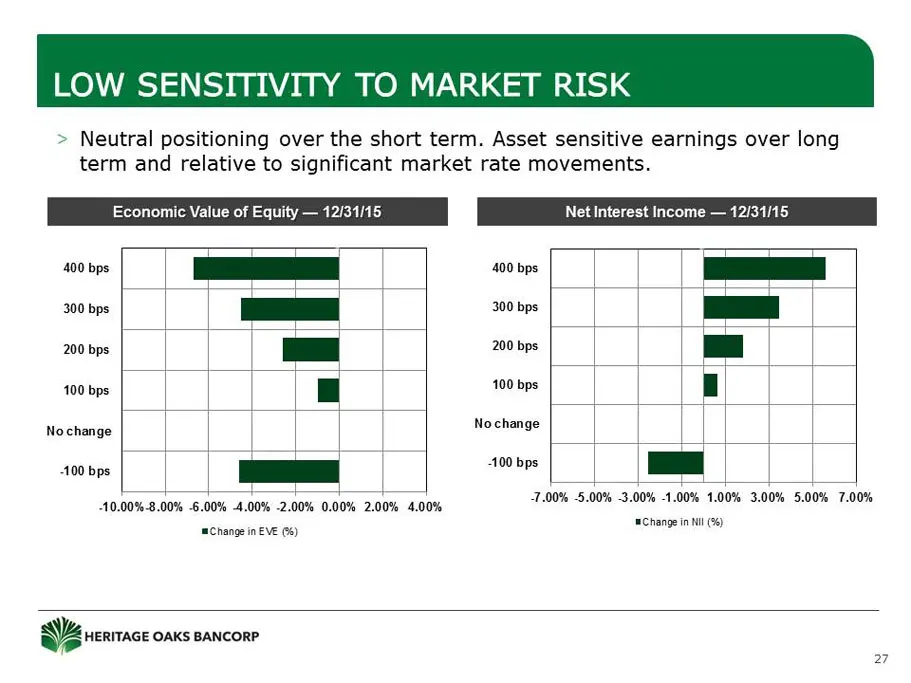
LOW SENSITIVITY TO MARKET RISK > Neutral positioning over the short term. Asset sensitive earnings over long term and relative to significant market rate movements. Economic Value of Equity — 12/31/15 Net Interest Income — 12/31/15 400 bps a 400 bps ; 300 bps a | 300 bps [ — 200 bps | | 200 bps | i
Slide 28: Managing Risk in a Low Rate Environment
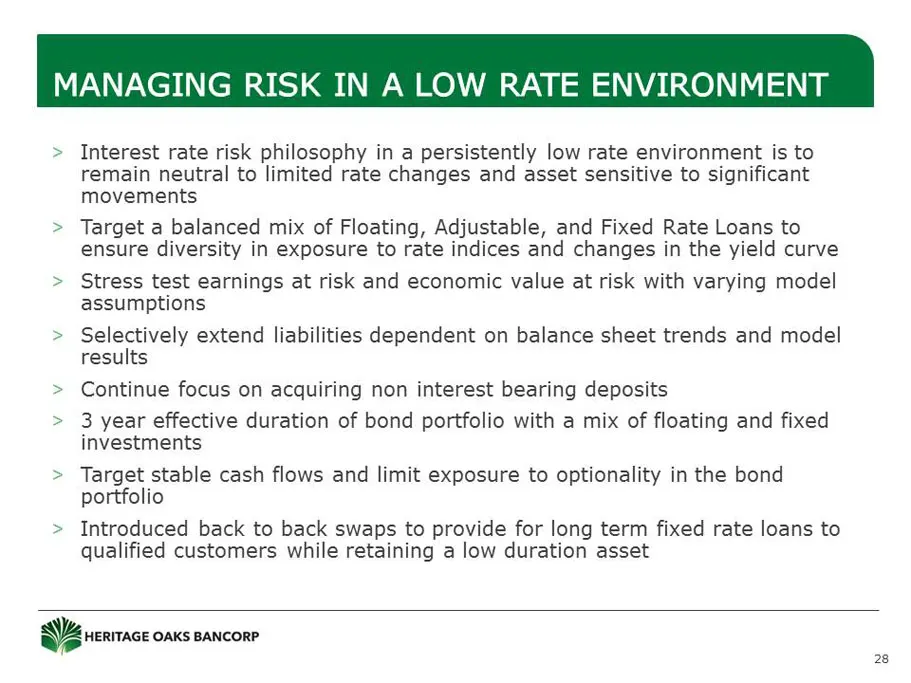
MANAGING RISK IN A LOW RATE ENVIRONMEN > Interest rate risk philosophy in a persistently low rate environment is to remain neutral to limited rate changes and asset sensitive to significant movements > Target a balanced mix of Floating, Adjustable, and Fixed Rate Loans to ensure diversity in exposur
Source: SEC EDGAR · 8-K filed Mar 7, 2016
More decks from Heritage Oaks Bancorp
 Merger or Acquisition (March 2017)6 slides · Mar 27, 2017
 Merger or Acquisition (February 2017)26 slides · Feb 1, 2017
 West Coast CEO Forum 201628 slides · Feb 3, 2016
 Investor Presentation (March 2015)28 slides · Mar 10, 2015
 Sandler O'Neill 2013 West Coast Financial Services Conference23 slides · Mar 11, 2014
 Sandler O'Neill Conference 201329 slides · Mar 6, 2013