Retail Properties of America Inc
Retail Properties of America — Inland Western Retail Real Estate Trust — Q2 2009 Earnings Presentation
26 slides from Retail Properties of America's earnings presentation, Aug 28, 2009
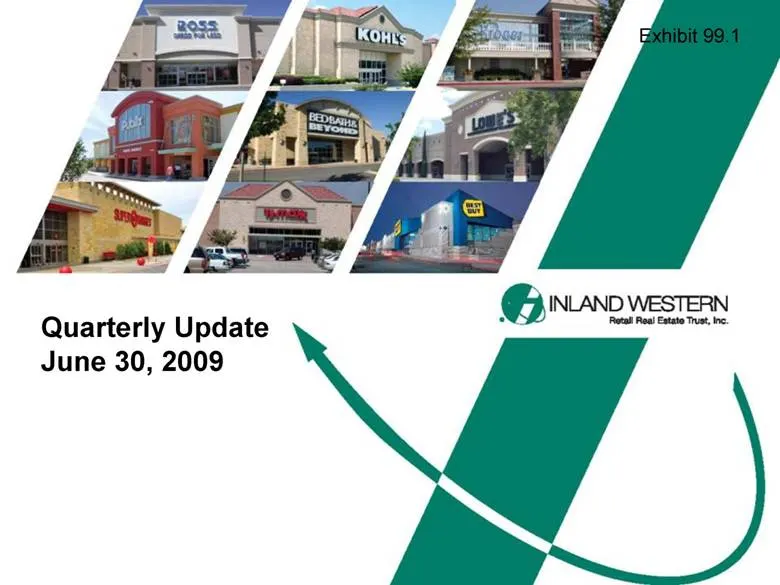
Slide 1: Quarterly Update June 30, 2009
Exhibit 99.1 Quarterly Update June 30, 2009
Slide 2: Forward-Looking Statements
Certain statements in this presentation may constitute “forward-looking statements.” Forward-looking statements are statements that are not historical, including statements regarding management’s intentions, beliefs, expectations, representations, plans or predictions of the future and are typically
Slide 3: Table of Contents
Table of Contents 3 Who We Are 4 Portfolio and Operating Performance 10 Focused on the Future 19 Contact Information 26
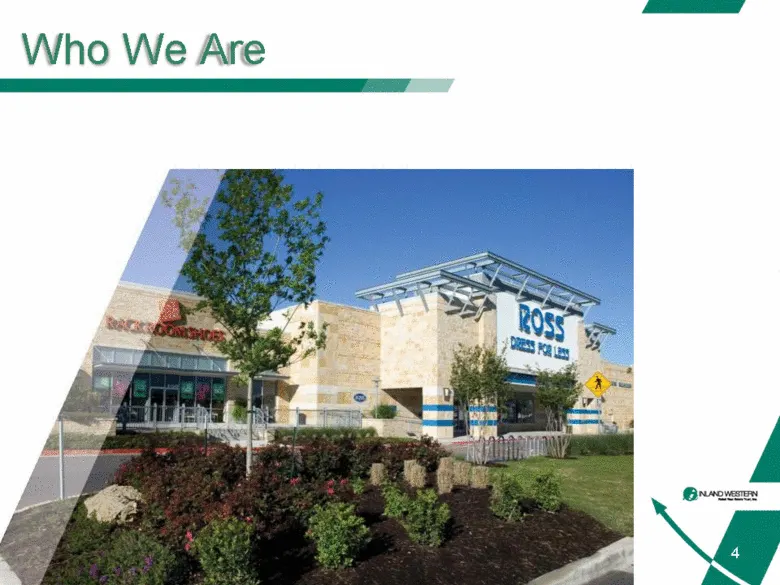
Slide 4: Who We Are
4 Who We Are
Slide 5: Who We Are
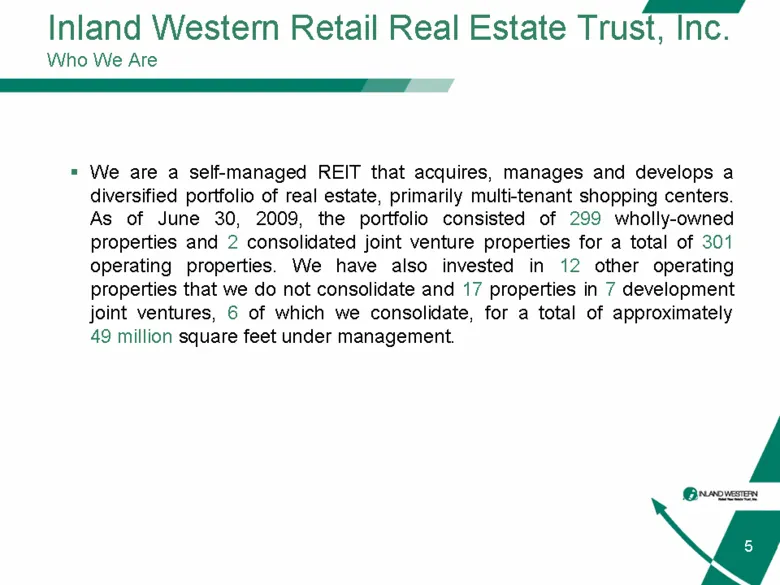
Inland Western Retail Real Estate Trust, Inc. Who We Are 5 We are a self-managed REIT that acquires, manages and develops a diversified portfolio of real estate, primarily multi-tenant shopping centers. As of June 30, 2009, the portfolio consisted of 299 wholly-owned properties and 2 consolidated jo
Slide 6: Solid Portfolio of Strategically Located Assets
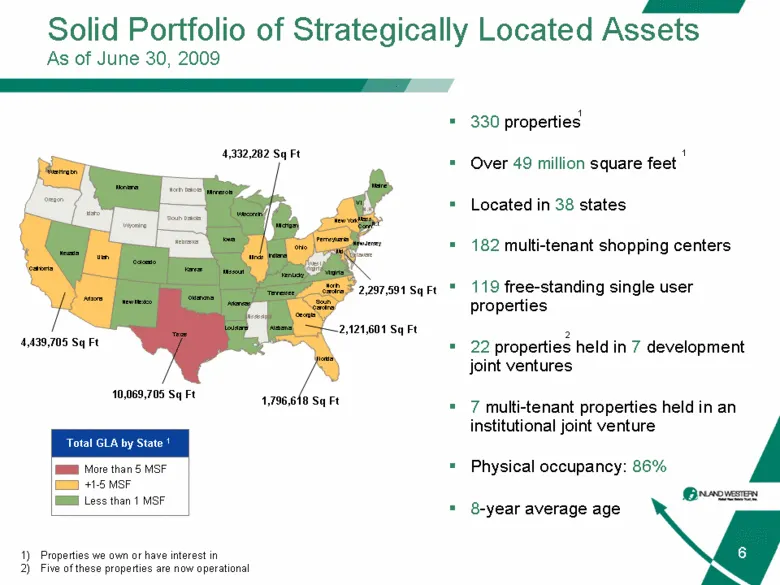
Solid Portfolio of Strategically Located Assets As of June 30, 2009 4,439,705 Sq Ft 10,069,705 Sq Ft 2,121,601 Sq Ft 1,796,618 Sq Ft 4,332,282 Sq Ft 2,297,591 Sq Ft Alabama Arizona Arkansas California Colorado Conn. Delaware Florida Georgia Idaho Illinois Indiana Iowa Kansas Kentucky Louisiana Maine
Slide 7: Portfolio Composition & Investment Allocation
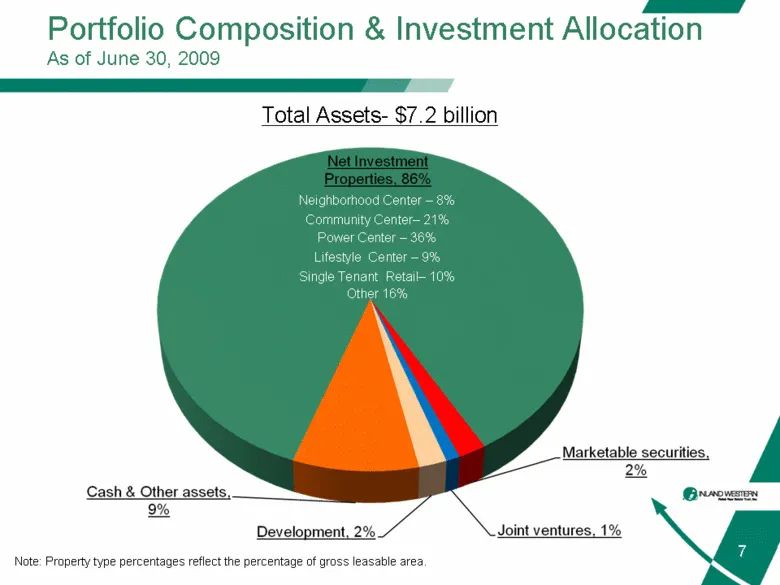
Portfolio Composition & Investment Allocation As of June 30, 2009 7 Total Assets- $7.2 billion Lifestyle Center – 9% Community Center– 21% Neighborhood Center – 8% Single Tenant Retail– 10% Other 16% Power Center – 36% Note: Property type percentages reflect the percentage of gross leasable area.
Slide 8: Capital Structure & Debt Analysis
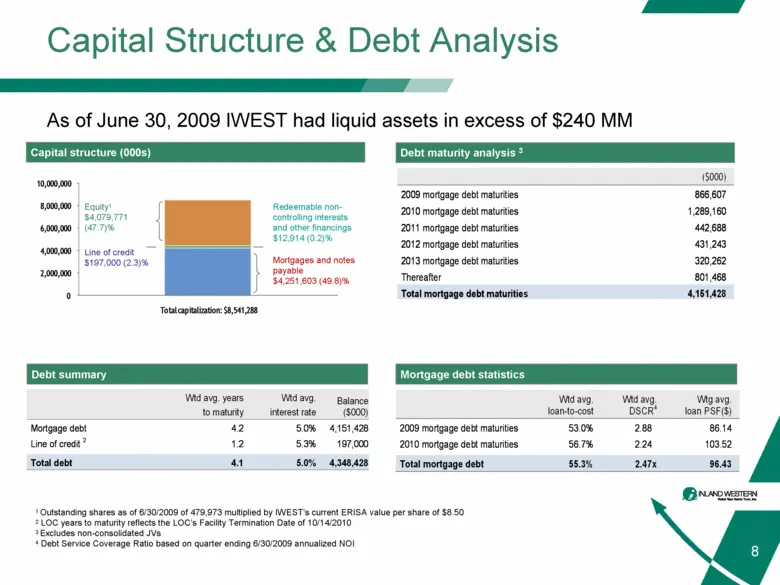
Capital Structure & Debt Analysis 8 Debt summary Equity1 $4,079,771 (47.7)% Redeemable non-controlling interests and other financings $12,914 (0.2)% Mortgages and notes payable $4,251,603 (49.8)% 1 Outstanding shares as of 6/30/2009 of 479,973 multiplied by IWEST’s current ERISA value per share of $
Slide 9: 2009 & 2010 Quarterly Debt Maturities
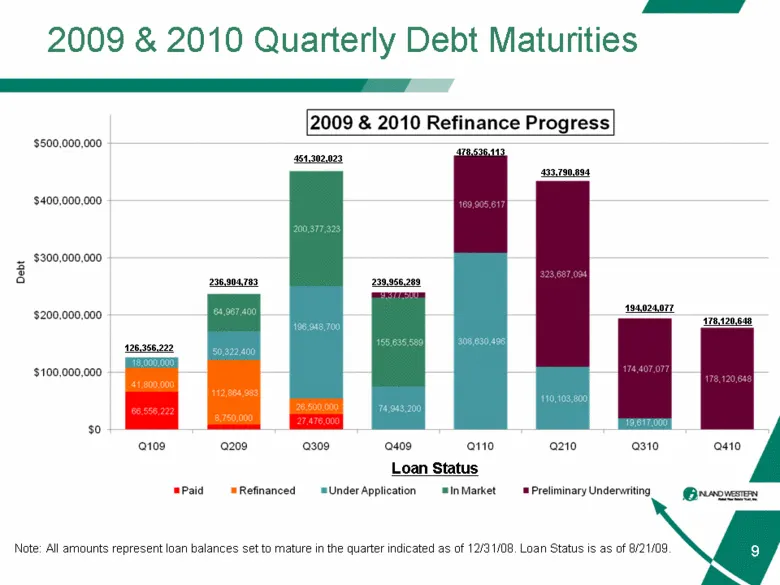
2009 & 2010 Quarterly Debt Maturities 9 Note: All amounts represent loan balances set to mature in the quarter indicated as of 12/31/08. Loan Status is as of 8/21/09. Loan Status 236,904,783 451,302,023 478,536,113 433,790,894 194,024,077 178,120,648 126,356,222 239,956,289
Slide 10: Portfolio and Operating Performance
10 Portfolio and Operating Performance
Slide 11: Portfolio Breakdown
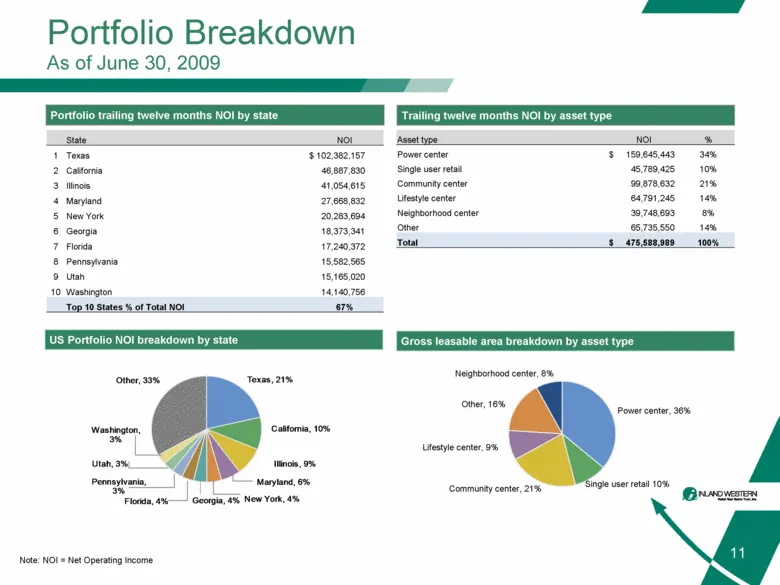
Portfolio Breakdown As of June 30, 2009 11 Portfolio trailing twelve months NOI by state Trailing twelve months NOI by asset type US Portfolio NOI breakdown by state Community center, 21% Neighborhood center, 8% Power center, 36% Lifestyle center, 9% Single user retail 10% Other, 16% Asset type NOI
Slide 12: Diversified Retail Portfolio
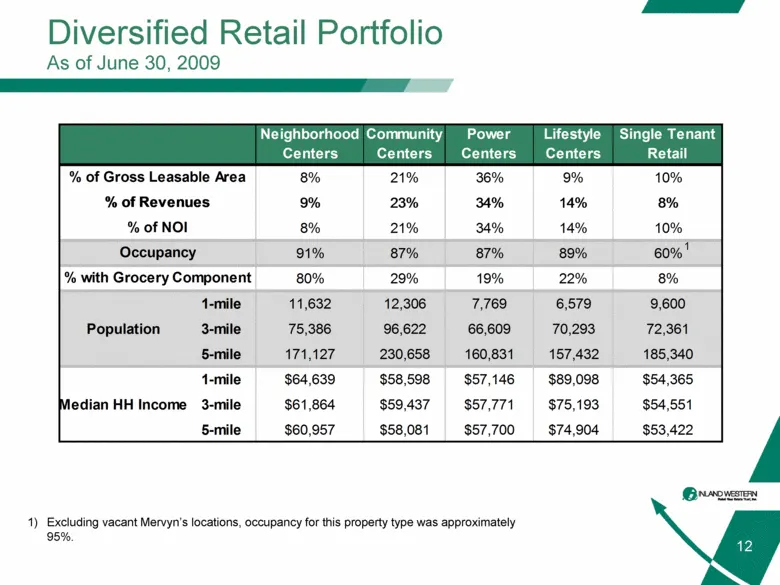
12 Excluding vacant Mervyn’s locations, occupancy for this property type was approximately 95%. Diversified Retail Portfolio As of June 30, 2009 Neighborhood Centers Community Centers Power Centers Lifestyle Centers Single Tenant Retail 8% 21% 36% 9% 10% 9% 23% 34% 14% 8% 8% 21% 34% 14% 10% 91% 87%
Slide 13: Increased Tenant Diversification Reduces Risk
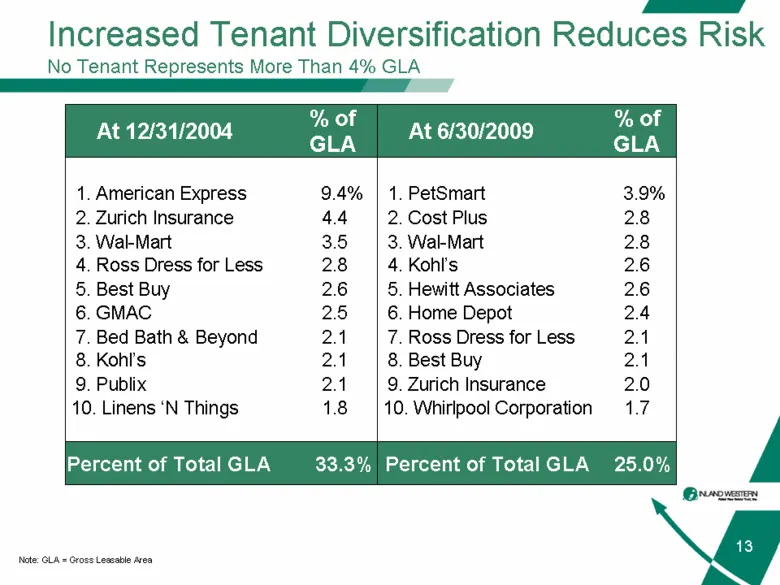
Increased Tenant Diversification Reduces Risk No Tenant Represents More Than 4% GLA 13 At 12/31/2004 % of GLA At 6/30/2009 % of GLA 1. American Express 9.4% 1. PetSmart 3.9% 2. Zurich Insurance 4.4 2. Cost Plus 2.8 3. Wal-Mart 3.5 3. Wal-Mart 2.8 4. Ross Dress for Less 2.8 4. Kohl’s 2.6 5. Best Buy
Slide 14: Investment-Grade Tenant Concentration
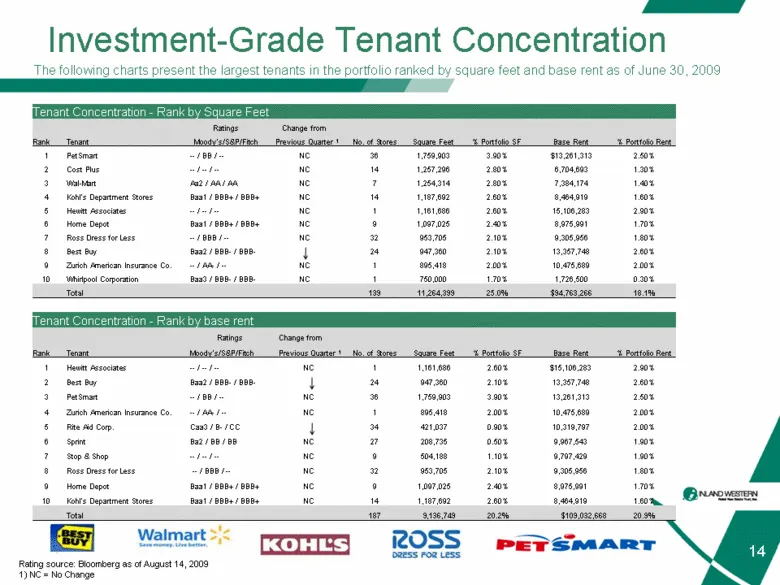
14 Investment-Grade Tenant Concentration The following charts present the largest tenants in the portfolio ranked by square feet and base rent as of June 30, 2009 Rating source: Bloomberg as of August 14, 2009 1) NC = No Change Tenant Concentration - Rank by Square Feet Ratings Change from Rank Tena
Slide 15: Historical Portfolio Occupancy Percentages
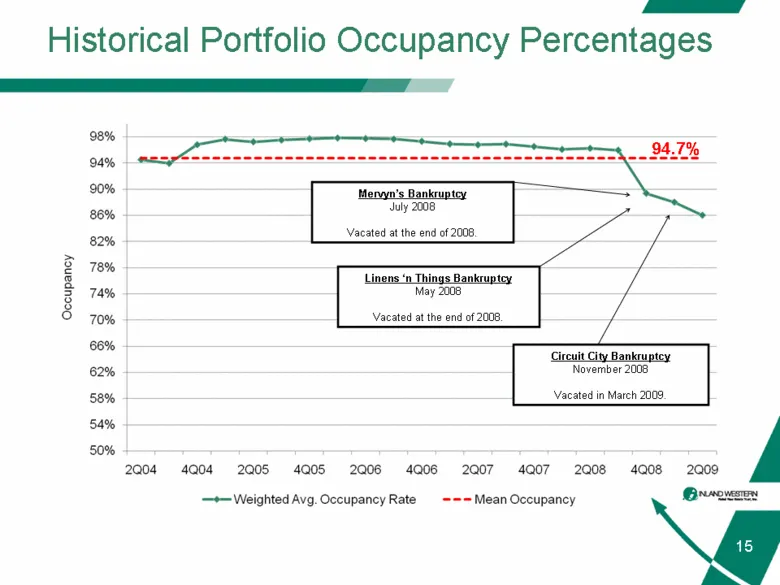
15 Historical Portfolio Occupancy Percentages Linens ‘n Things Bankruptcy May 2008 Vacated at the end of 2008. Circuit City Bankruptcy November 2008 Vacated in March 2009. Mervyn’s Bankruptcy July 2008 Vacated at the end of 2008. 94.7%
Slide 16: Strong Occupancy Across Wide Geographic Footprint
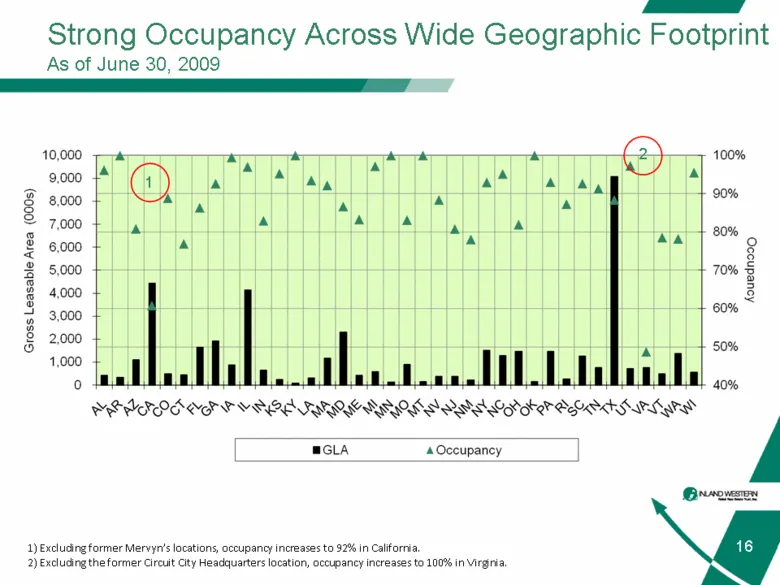
16 Strong Occupancy Across Wide Geographic Footprint As of June 30, 2009 1) Excluding former Mervyn’s locations, occupancy increases to 92% in California. 2) Excluding the former Circuit City Headquarters location, occupancy increases to 100% in Virginia. 1 2
Slide 17: Leasing Spreads
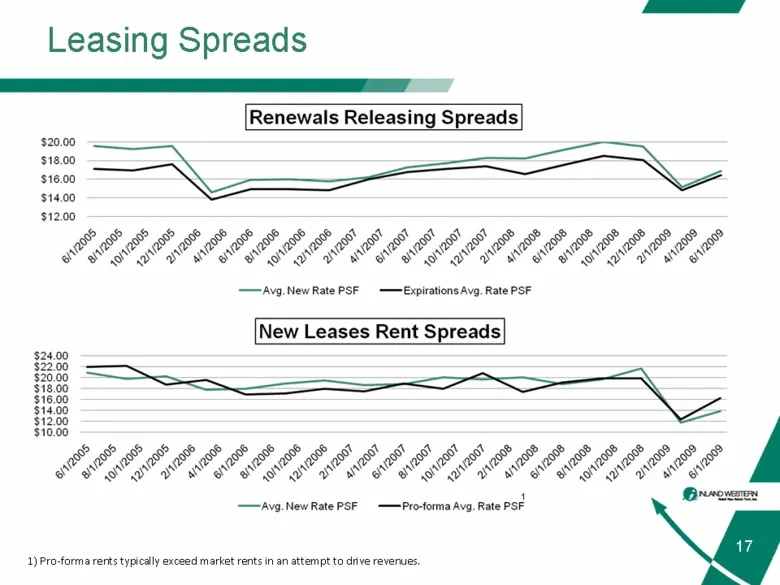
17 Leasing Spreads 1) Pro-forma rents typically exceed market rents in an attempt to drive revenues. 1
Slide 18: Significant Progress on Re-Leasing Vacancies
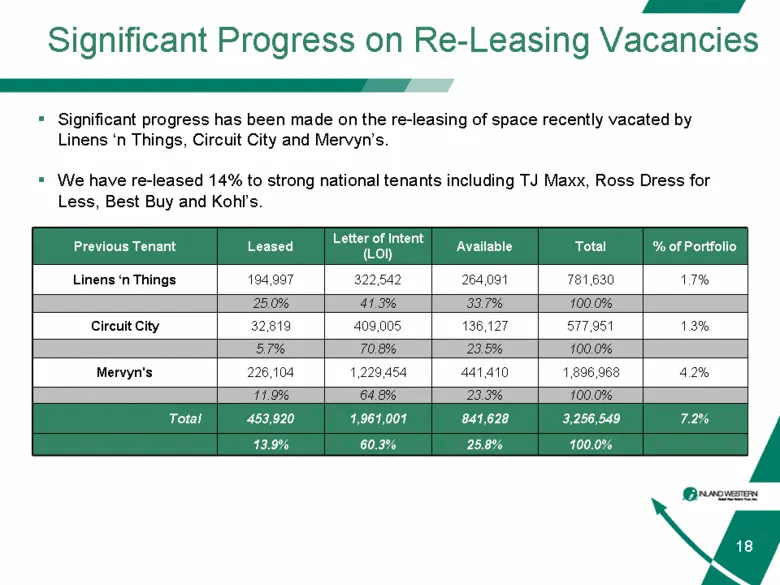
Significant Progress on Re-Leasing Vacancies 18 Previous Tenant Leased Letter of Intent (LOI) Available Total % of Portfolio Linens ‘n Things 194,997 322,542 264,091 781,630 1.7% 25.0% 41.3% 33.7% 100.0% Circuit City 32,819 409,005 136,127 577,951 1.3% 5.7% 70.8% 23.5% 100.0% Mervyn's 226,104 1,229,
Slide 19: Focused on the Future
19 Focused on the Future
Slide 20: Our Portfolio Capitalizes on Retail Sales Trends
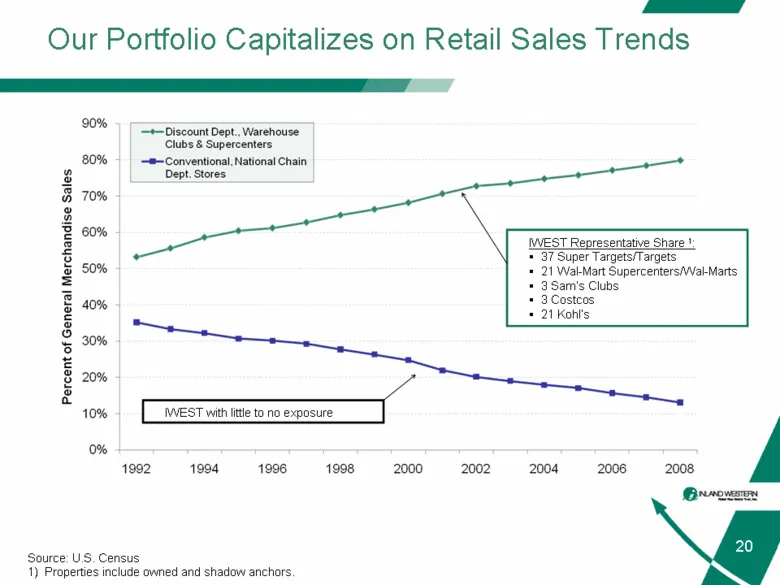
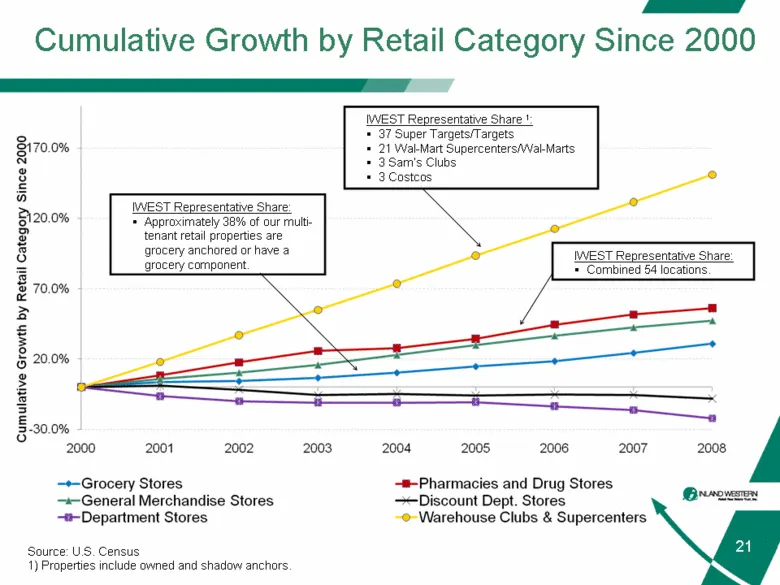
Our Portfolio Capitalizes on Retail Sales Trends 20 Source: U.S. Census 1) Properties include owned and shadow anchors. IWEST Representative Share 1: 37 Super Targets/Targets 21 Wal-Mart Supercenters/Wal-Marts 3 Sam’s Clubs 3 Costcos 21 Kohl’s IWEST with little to no exposure
Slide 21: Cumulative Growth by Retail Category Since 2000
Cumulative Growth by Retail Category Since 2000 21 Cumulative Growth by Retail Category Since 2000 Source: U.S. Census 1) Properties include owned and shadow anchors. IWEST Representative Share: Approximately 38% of our multi-tenant retail properties are grocery anchored or have a grocery component.
Slide 22: Retailer Expansion Benefit
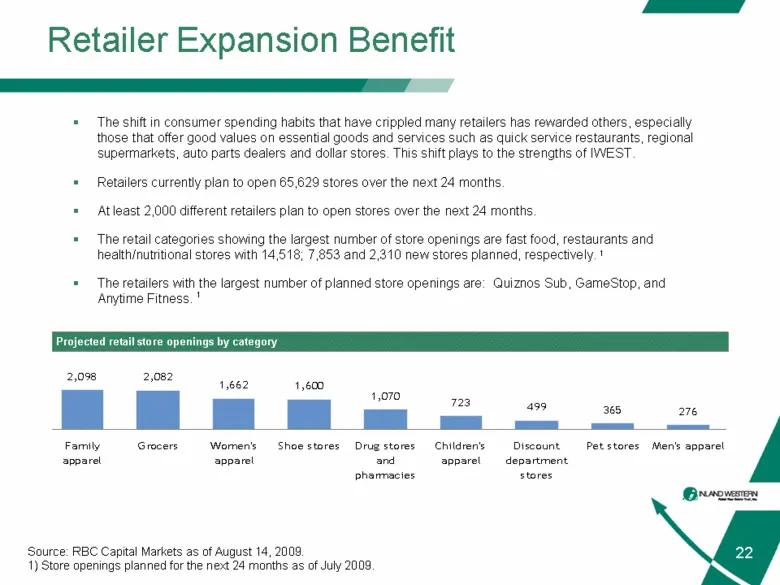
Retailer Expansion Benefit 22 Source: RBC Capital Markets as of August 14, 2009. 1) Store openings planned for the next 24 months as of July 2009. The shift in consumer spending habits that have crippled many retailers has rewarded others, especially those that offer good values on essential goods a
Slide 23: Focus on Liquidity, Occupancy and Balance Sheet
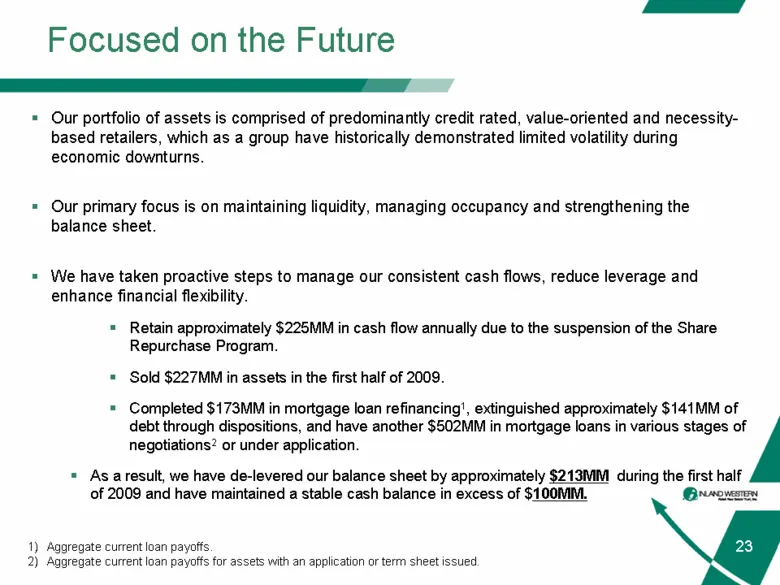
23 Our portfolio of assets is comprised of predominantly credit rated, value-oriented and necessity-based retailers, which as a group have historically demonstrated limited volatility during economic downturns. Our primary focus is on maintaining liquidity, managing occupancy and strengthening the b
Slide 24: Enhancing Liquidity through Asset Sales
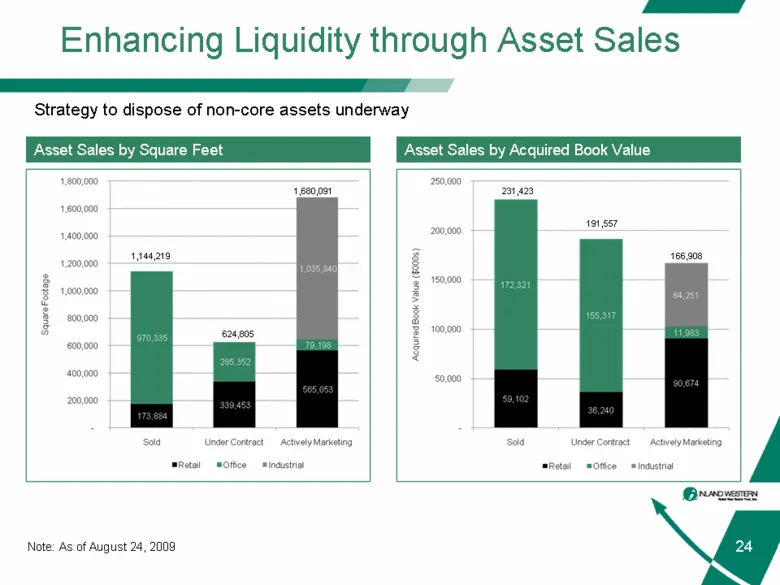
24 Enhancing Liquidity through Asset Sales Asset Sales by Square Feet Asset Sales by Acquired Book Value Strategy to dispose of non-core assets underway Note: As of August 24, 2009 231,423 191,557 166,908 1,144,219 624,805 1,680,091
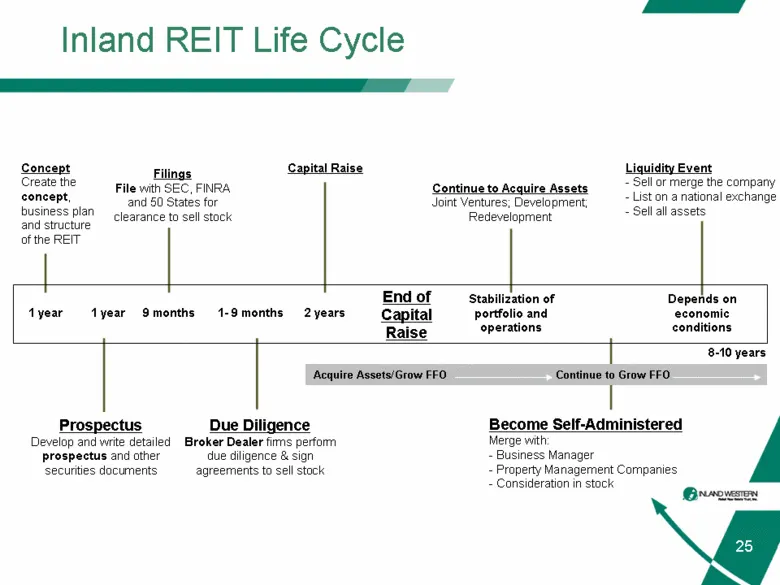
Slide 25: Inland REIT Life Cycle
25 Inland REIT Life Cycle Concept Create the concept, business plan and structure of the REIT 1 year Prospectus Develop and write detailed prospectus and other securities documents 1 year Filings File with SEC, FINRA and 50 States for clearance to sell stock 9 months Due Diligence Broker Dealer firm

Slide 26: Contact Information
26 Contact Information 2901 Butterfield Road Oak Brook, IL 60523 (800) 541-7661 www.inland-western.com
Source: SEC EDGAR · 8-K filed Aug 28, 2009
More decks from Retail Properties of America Inc
 Merger or Acquisition (July 2021)17 slides · Jul 19, 2021
 Investor Presentation (July 2020)23 slides · Jul 17, 2020
 Q2 2019 Earnings Presentation5 slides · Jul 30, 2019
 Investor Day (September 2016)100 slides · Sep 21, 2016
 Investor Day (June 2013)68 slides · Jun 27, 2013
 Q4 2012 Earnings Presentation21 slides · Feb 26, 2013