PowerSecure International — Conference Presentation (September 2012)
24 slides from PowerSecure International's conference presentation, Sep 7, 2012
Slide 1: Power - September 10-12, 2012
Power September 10-12, 2012
Slide 2: Forward Looking Statements Safe Harbor
Forward Looking Statements Safe Harbor All forward-looking statements made in this presentation are made under the safe harbor provisions of the Private Securities Litigation Reform Act of 1995. Forward-looking statements, which are all statements other than statements of historical facts and includ
Slide 3: PowerSecure: Utility Focused - Utilities and their Large Customers
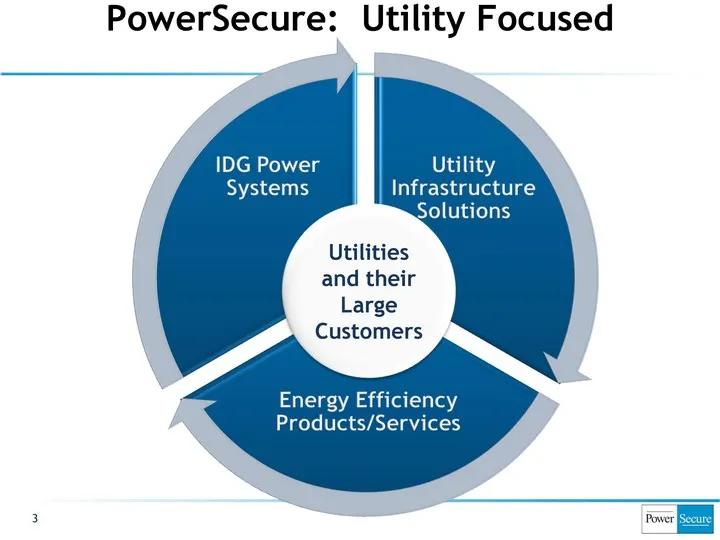
3 PowerSecure: Utility Focused Utilities and their Large Customers
Slide 4: Our Products, Services, and Customers
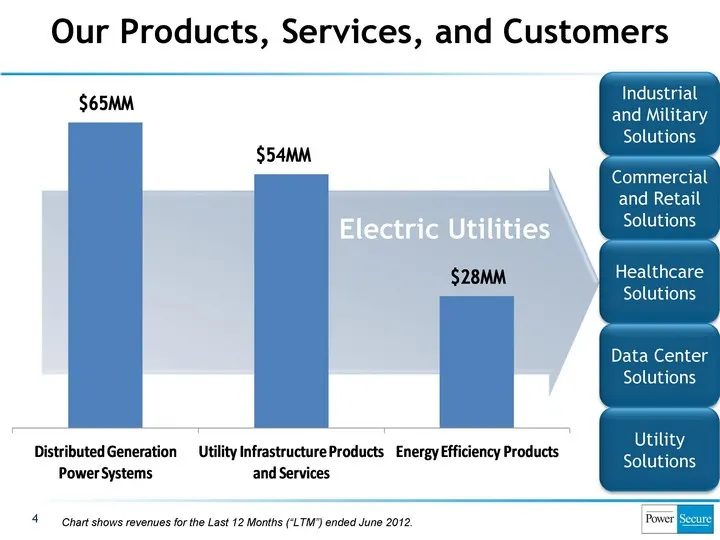
Electric Utilities 4 Our Products, Services, and Customers Chart shows revenues for the Last 12 Months ("LTM") ended June 2012. Industrial and Military Solutions Commercial and Retail Solutions Healthcare Solutions Data Center Solutions Utility Solutions
Slide 5: Our 2015 Goals
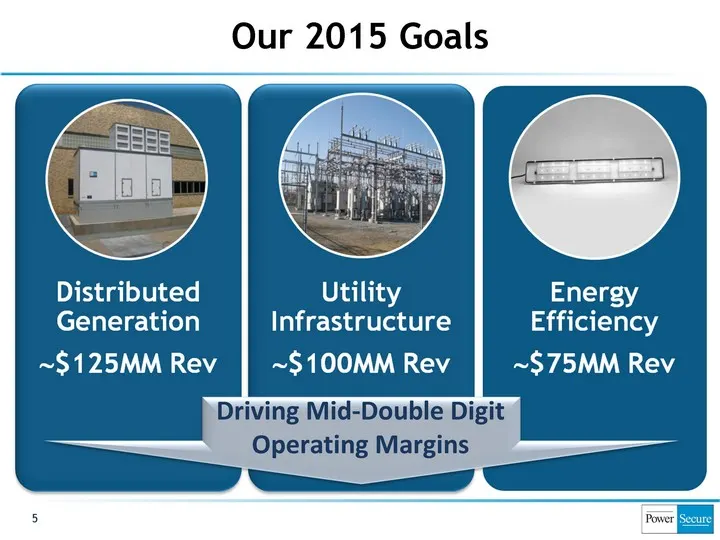
Our 2015 Goals Our 2015 Goals 5 Driving Mid-Double Digit Operating Margins
Slide 6: Our Growth and Diversification
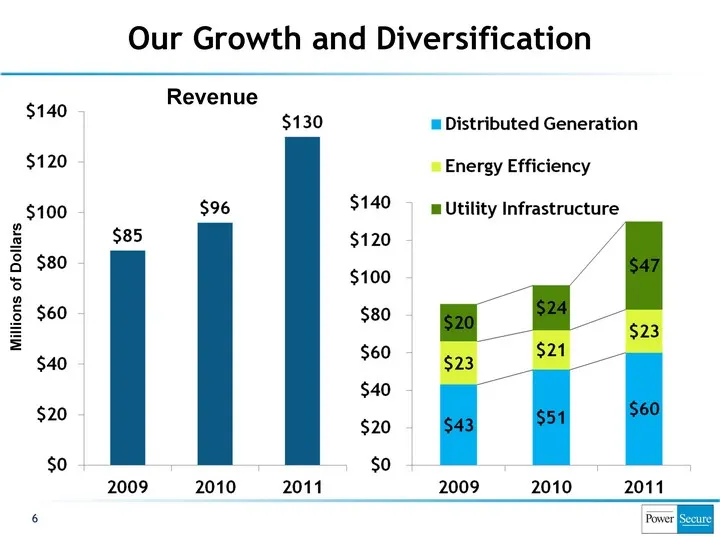
6 Revenue Millions of Dollars Our Growth and Diversification
Slide 7: 2011 Strong Progression: Replacing Profit from Divested Businesses
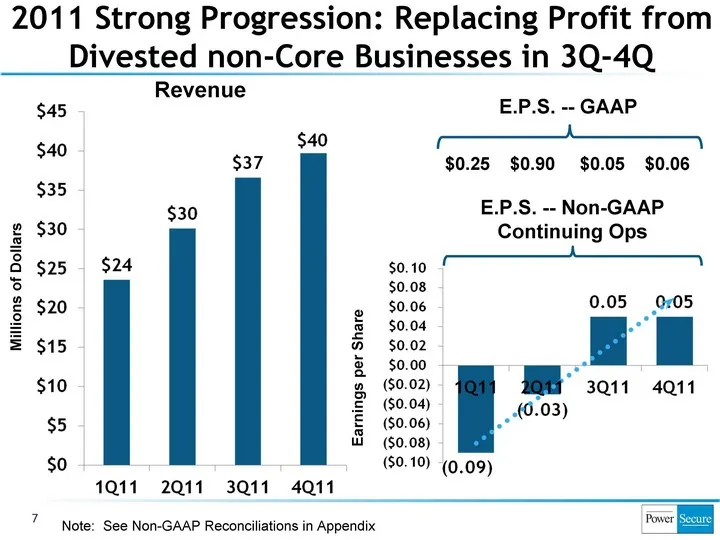
7 Revenue Millions of Dollars Earnings per Share 2011 Strong Progression: Replacing Profit from Divested non-Core Businesses in 3Q-4Q E.P.S. -- Non-GAAP Continuing Ops E.P.S. -- GAAP $0.25 $0.90 $0.05 $0.06 Note: See Non-GAAP Reconciliations in Appendix
Slide 8: 2Q12 Results
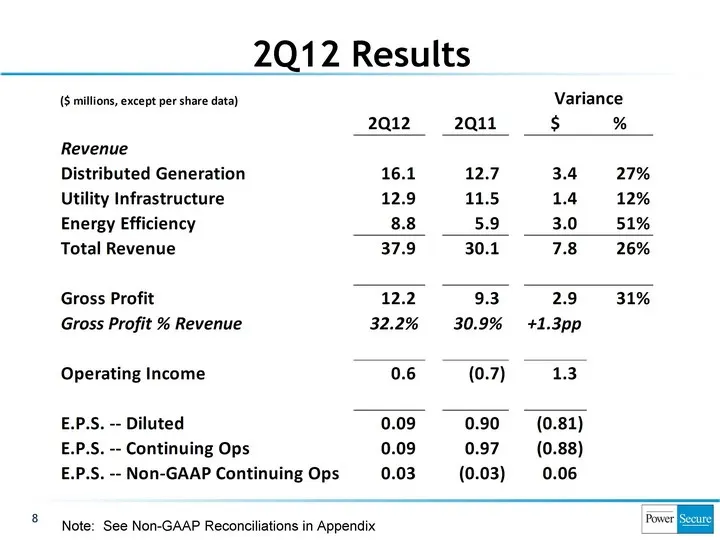
8 2Q12 Results Note: See Non-GAAP Reconciliations in Appendix
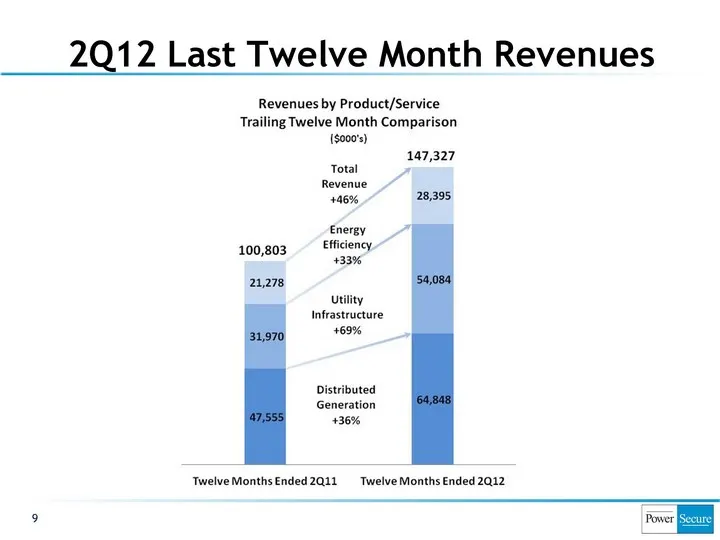
Slide 9: 2Q12 Last Twelve Month Revenues
9 2Q12 Last Twelve Month Revenues
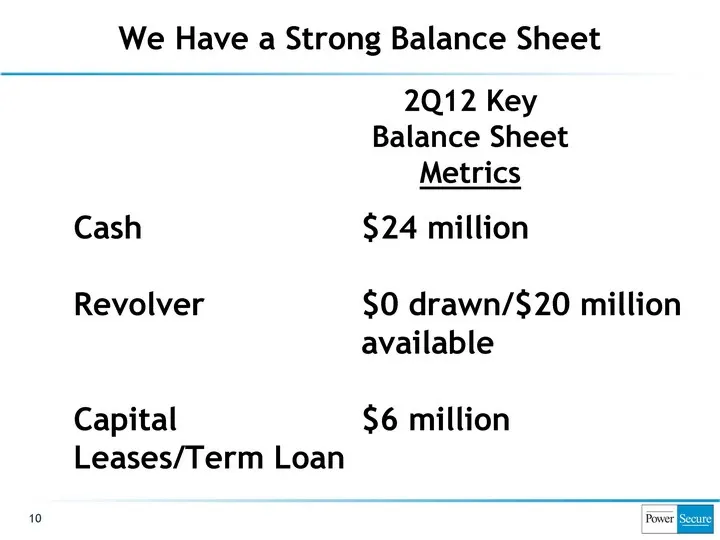
Slide 10: We Have a Strong Balance Sheet
10 We Have a Strong Balance Sheet Cash Revolver Capital Leases/Term Loan $24 million $0 drawn/$20 million available $6 million 2Q12 Key Balance Sheet Metrics
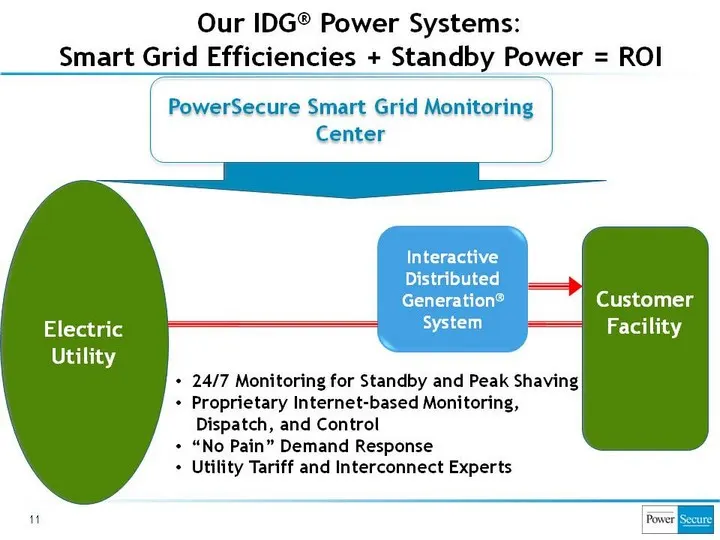
Slide 11: Our IDG Power Systems: Smart Grid Efficiencies + Standby Power = ROI
11 Our IDG(r) Power Systems: Smart Grid Efficiencies + Standby Power = ROI Electric Utility Customer Facility PowerSecure Smart Grid Monitoring Center Interactive Distributed Generation(r) System 24/7 Monitoring for Standby and Peak Shaving Proprietary Internet-based Monitoring, Dispatch, and Contro
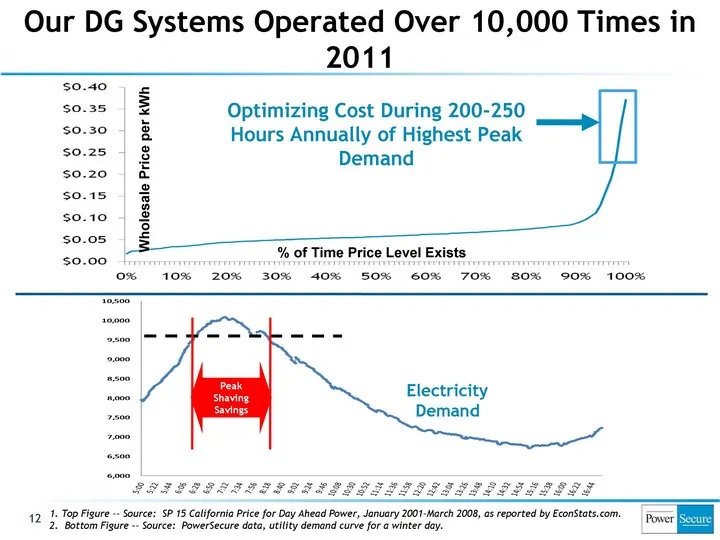
Slide 12: Our DG Systems Operated Over 10,000 Times in 2011
12 Wholesale Price per kWh % of Time Price Level Exists 1. Top Figure -- Source: SP 15 California Price for Day Ahead Power, January 2001-March 2008, as reported by EconStats.com. 2. Bottom Figure -- Source: PowerSecure data, utility demand curve for a winter day. Our DG Systems Operated Over 10,000
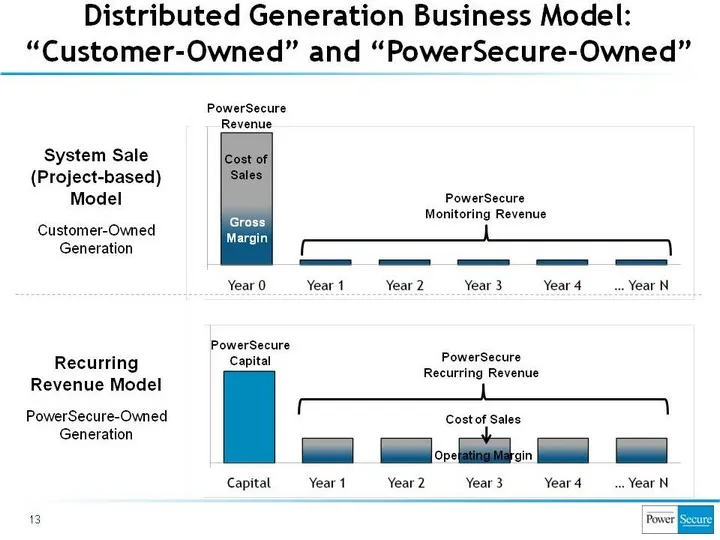
Slide 13: Recurring Revenue Model
13 Recurring Revenue Model PowerSecure-Owned Generation PowerSecure Monitoring Revenue Distributed Generation Business Model: "Customer-Owned" and "PowerSecure- Owned" System Sale (Project-based) Model Customer-Owned Generation PowerSecure Recurring Revenue PowerSecure Revenue Cost of Sales Gross Ma
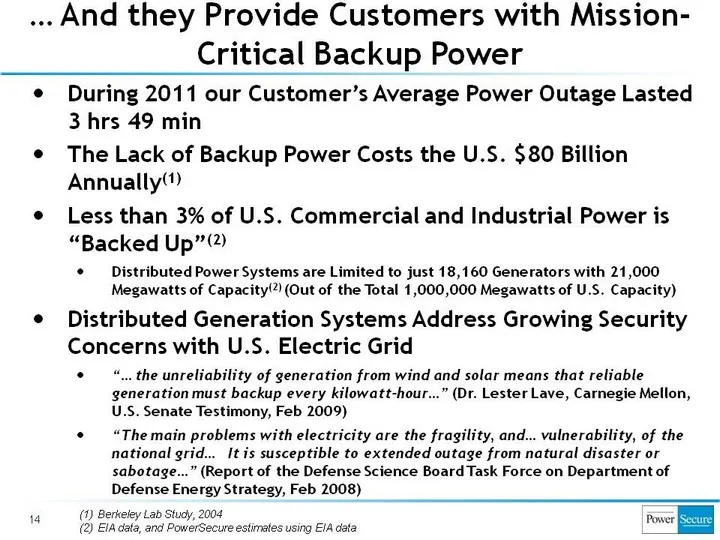
Slide 14: The Lack of Backup Power Costs the U.S. $80 Billion Annually
During 2011 our Customer's Average Power Outage Lasted 3 hrs 49 min The Lack of Backup Power Costs the U.S. $80 Billion Annually(1) Less than 3% of U.S. Commercial and Industrial Power is "Backed Up"(2) Distributed Power Systems are Limited to just 18,160 Generators with 21,000 Megawatts of Capacity
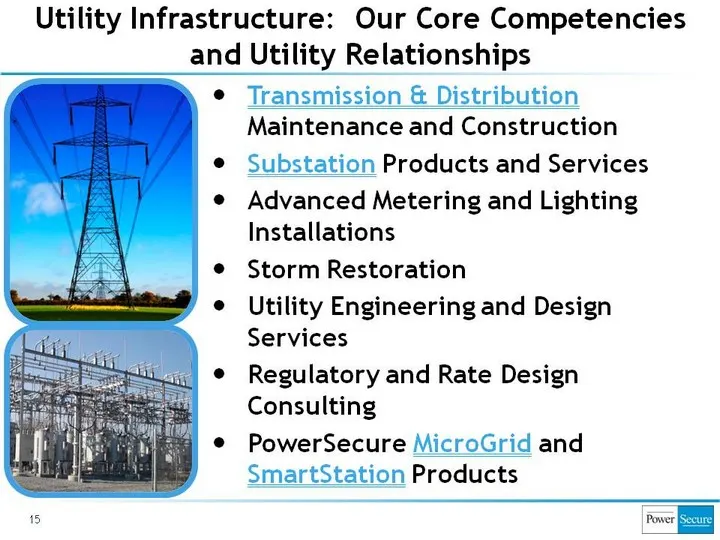
Slide 15: Utility Infrastructure: Our Core Competencies and Utility Relationships
Utility Infrastructure: Our Core Competencies and Utility Relationships 15 15 Transmission & Distribution Maintenance and Construction Substation Products and Services Advanced Metering and Lighting Installations Storm Restoration Utility Engineering and Design Services Regulatory and Rate Design Co
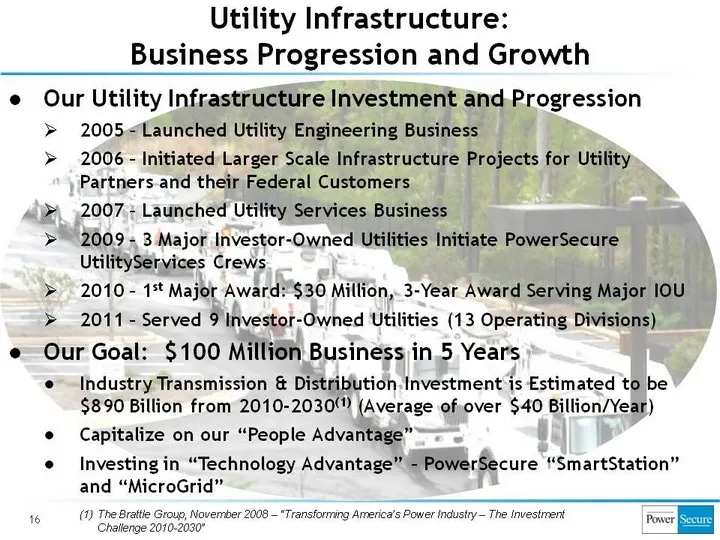
Slide 16: Utility Infrastructure: Business Progression and Growth
Utility Infrastructure: Business Progression and Growth 16 Our Utility Infrastructure Investment and Progression 2005 - Launched Utility Engineering Business 2006 - Initiated Larger Scale Infrastructure Projects for Utility Partners and their Federal Customers 2007 - Launched Utility Services Busine
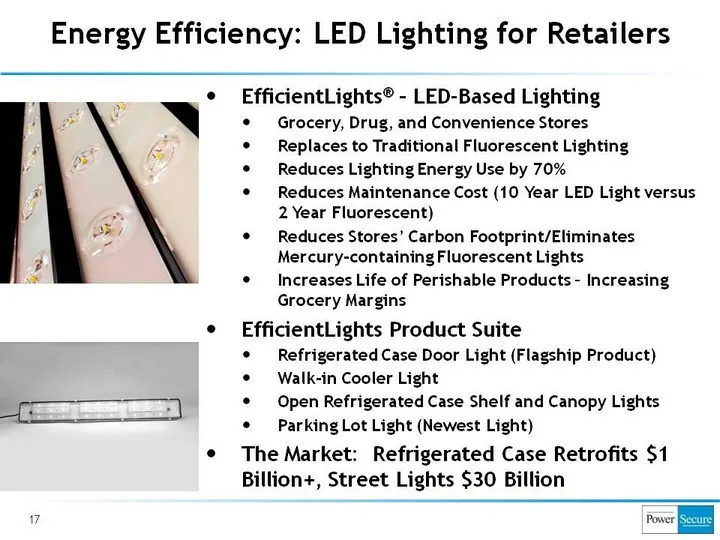
Slide 17: Energy Efficiency: LED Lighting for Retailers
Energy Efficiency: LED Lighting for Retailers 17 EfficientLights(r) - LED-Based Lighting Grocery, Drug, and Convenience Stores Replaces to Traditional Fluorescent Lighting Reduces Lighting Energy Use by 70% Reduces Maintenance Cost (10 Year LED Light versus 2 Year Fluorescent) Reduces Stores' Carbon
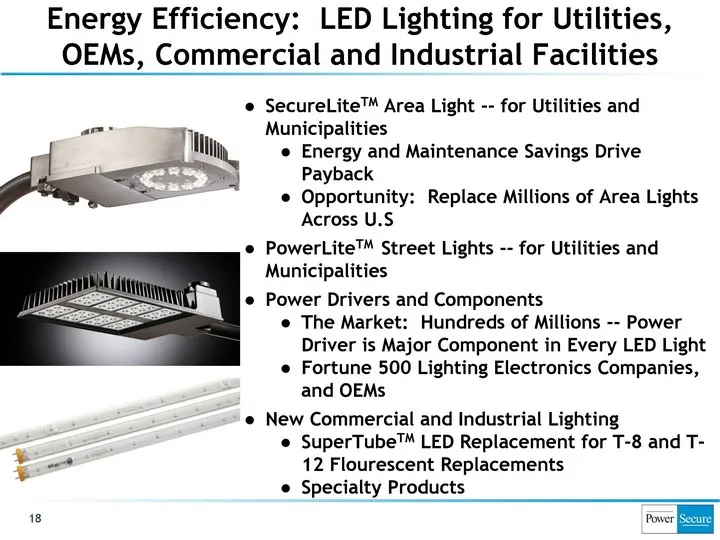
Slide 18: Energy Efficiency: LED Lighting for Utilities, OEMs, Commercial and Industrial
SecureLiteTM Area Light -- for Utilities and Municipalities Energy and Maintenance Savings Drive Payback Opportunity: Replace Millions of Area Lights Across U.S PowerLiteTM Street Lights -- for Utilities and Municipalities Power Drivers and Components The Market: Hundreds of Millions -- Power Driver
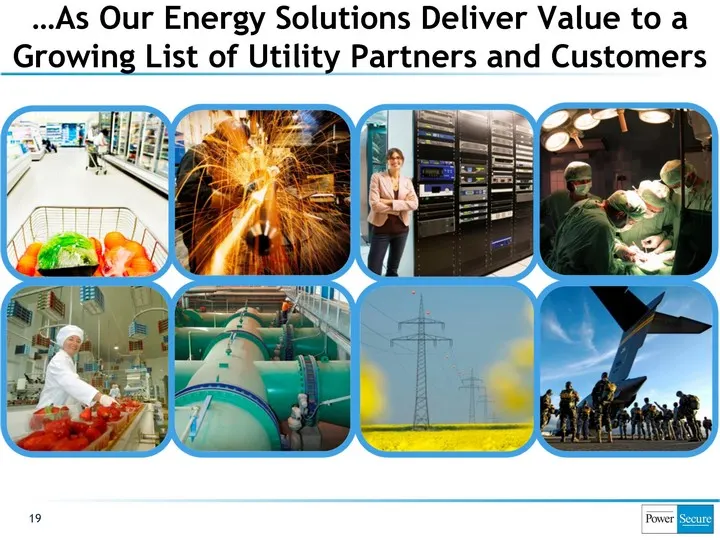
Slide 19: A Growing List of Utility Partners and Customers
19 ...As Our Energy Solutions Deliver Value to a Growing List of Utility Partners and Customers
Slide 20: Questions? www.PowerSecure.com
NASDAQ: POWR www.PowerSecure.com 20 Questions?
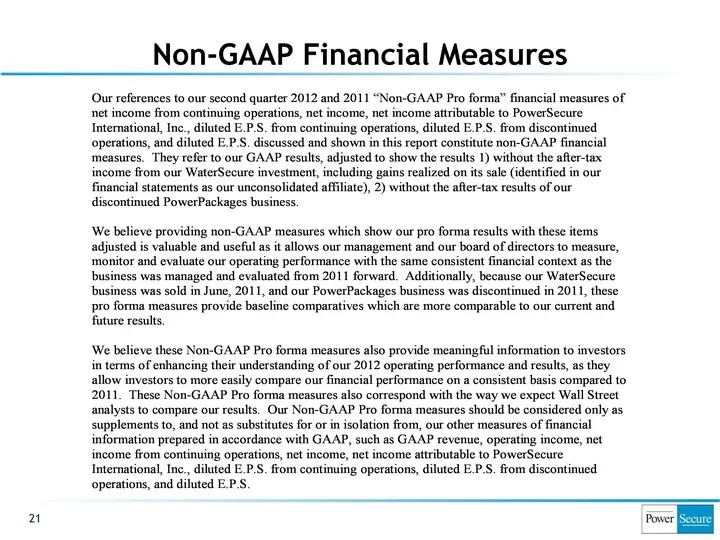
Slide 21: Non-GAAP Financial Measures
Non-GAAP Financial Measures 21
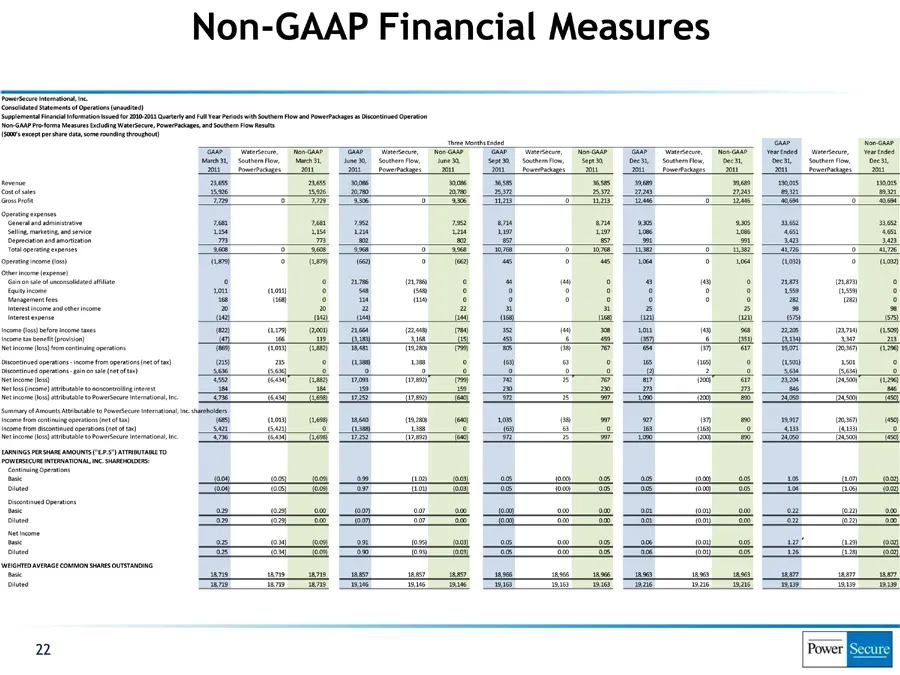
Slide 22: Non-GAAP Financial Measures PowerSecure International, Inc.
Non-GAAP Financial Measures PowerSecure International, Inc. Consolidated Statements of Operations (unaudited) Supplemental Financial Information Issued for 2010 2011 Quarterly and Full Year Periods with Southern Flow and PowerPackages as Discontinued Operation Non GAAP Pro forma Measures Excluding W
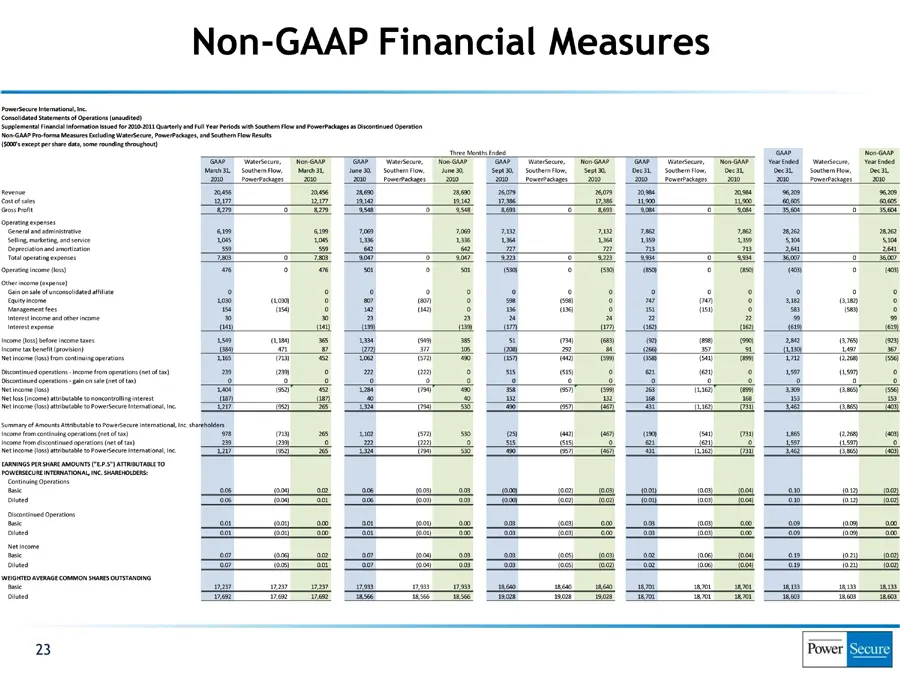
Slide 23: Non-GAAP Financial Measures - Consolidated Statements of Operations
Non-GAAP Financial Measures PowerSecure International, Inc. Consolidated Statements of Operations (unaudited) Supplemental Financial Information Issued for 2010?2011 Quarterly and Full Year Periods with Southern Flow and PowerPackages as Discontinued Operation Non?GAAP Pro?forma Measures Excluding W
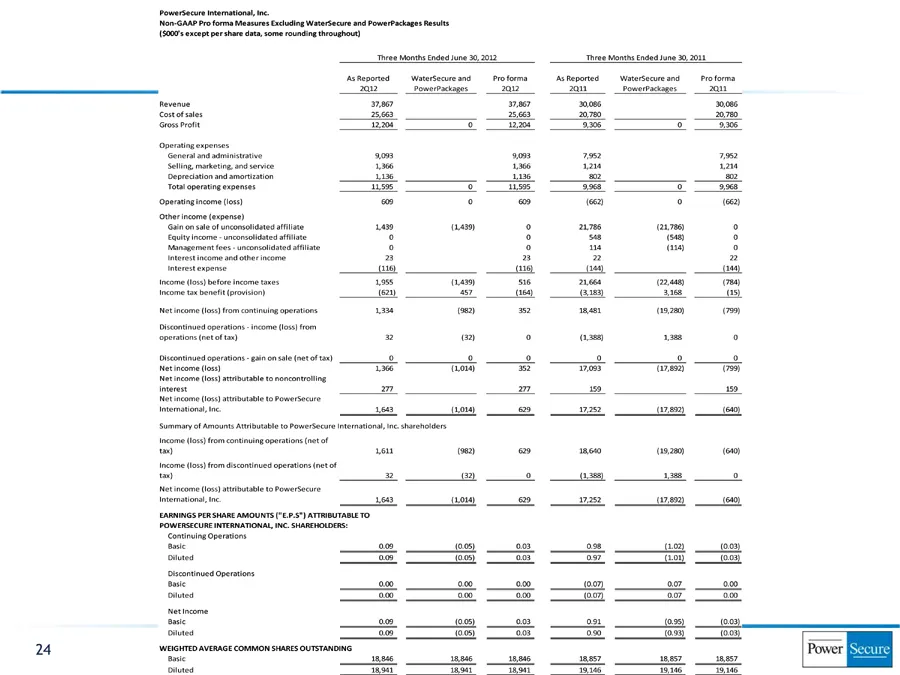
Slide 24: Non GAAP Pro forma Measures Excluding WaterSecure and PowerPackages
PowerSecure International, Inc. Non GAAP Pro forma Measures Excluding WaterSecure and PowerPackages Results ($000’s except per share data, some rounding throughout) Three Months Ended June 30, 2012 Three Months Ended June 30, 2011 As Reported WaterSecure and Pro forma As Reported WaterSecure and Pro
Source: SEC EDGAR · 8-K filed Sep 7, 2012
More decks from PowerSecure International Inc
 Investor Presentation (January 2016)19 slides · Jan 13, 2016
 Q3 2015 Earnings Presentation19 slides · Nov 9, 2015
 Investor Presentation (September 2015)19 slides · Sep 2, 2015
 Investor Presentation (August 2015)16 slides · Aug 10, 2015
 Investor Presentation (May 2015)21 slides · May 26, 2015
 Investor Presentation (May 2015)18 slides · May 6, 2015