MainSource Financial Group Inc
MainSource Financial — Shareholder Meeting (April 2009)
68 slides from MainSource Financial's shareholder meeting presentation, Apr 29, 2009

Slide 1: To meet the financial needs of our customers and help them achieve their dreams
[LOGO] To meet the financial needs of our customers and help them achieve their dreams
Slide 2: Welcome 2009 Annual Meeting of Shareholders
Welcome 2009 Annual Meeting of Shareholders Robert E. Hoptry, Chairman
Slide 3: Introduction of Director Nominees
Introduction of Director Nominees Philip A. Frantz
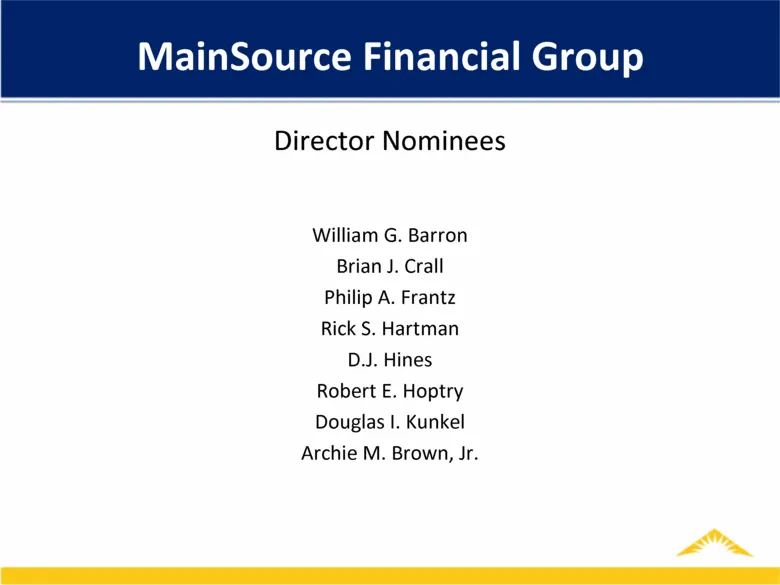
Slide 4: Director Nominees
Director Nominees William G. Barron Brian J. Crall Philip A. Frantz Rick S. Hartman D.J. Hines Robert E. Hoptry Douglas I. Kunkel Archie M. Brown, Jr. MainSource Financial Group
Slide 5: Increase in Number of Authorized Shares
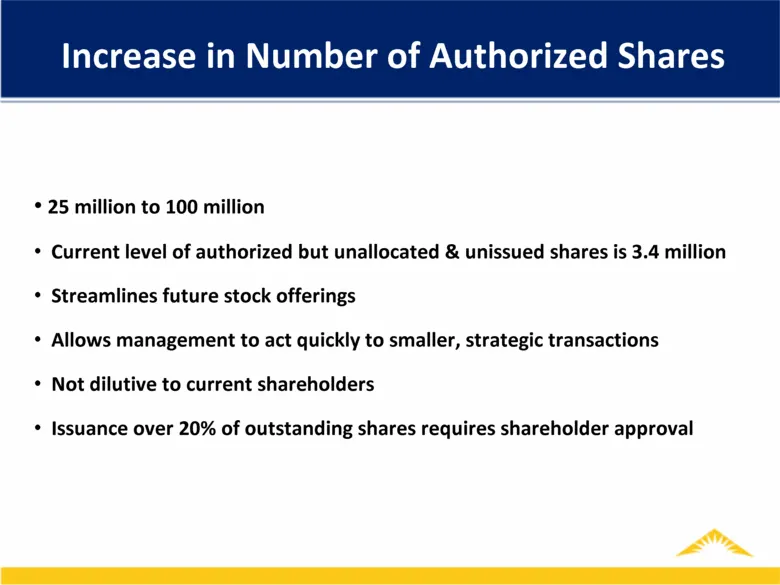
Increase in Number of Authorized Shares
Slide 6: Increase in Number of Authorized Shares
25 million to 100 million Current level of authorized but unallocated & unissued shares is 3.4 million Streamlines future stock offerings Allows management to act quickly to smaller, strategic transactions Not dilutive to current shareholders Issuance over 20% of outstanding shares requires sharehol
Slide 7: Advisory Vote on Executive Compensation Policies and Procedures
Advisory Vote on Executive Compensation Policies and Procedures
Slide 8: Advisory Vote on Executive Compensation: Say on Pay
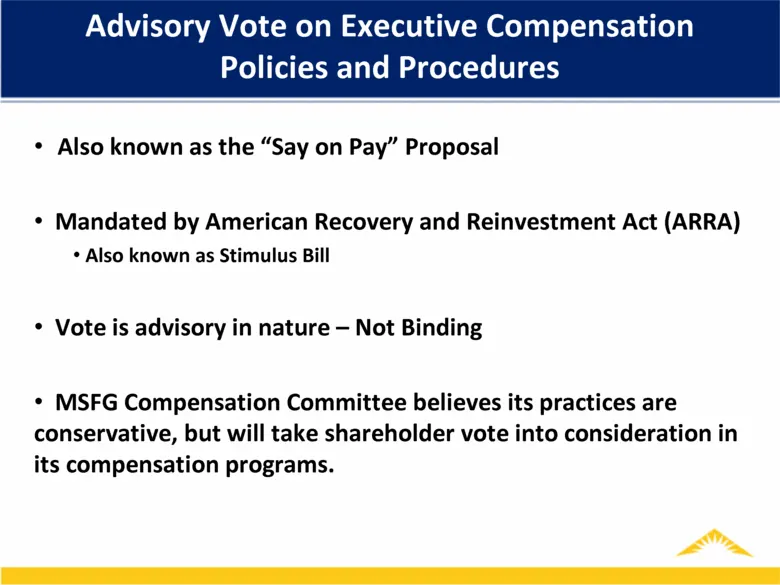
Advisory Vote on Executive Compensation Policies and Procedures Also known as the “Say on Pay” Proposal Mandated by American Recovery and Reinvestment Act (ARRA) Also known as Stimulus Bill Vote is advisory in nature – Not Binding MSFG Compensation Committee believes its practices are conservative,
Slide 9: Introductions
Introductions
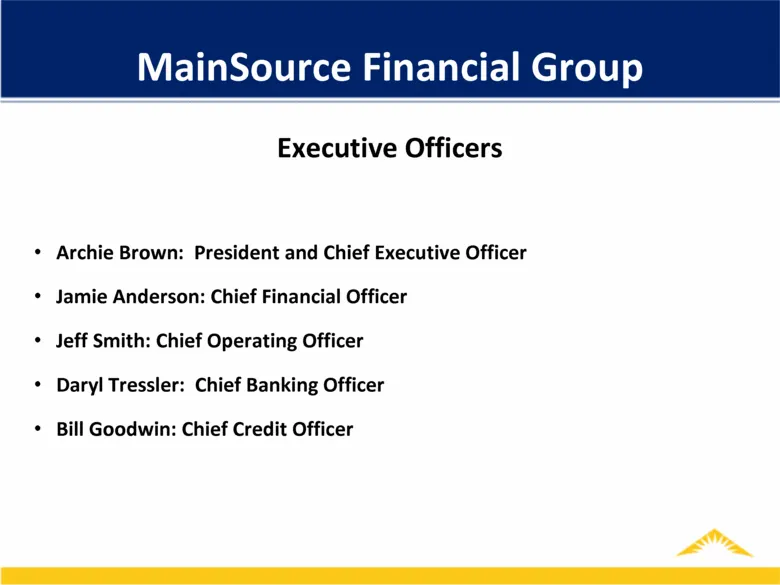
Slide 10: MainSource Financial Group Executive Officers
MainSource Financial Group Executive Officers Archie Brown: President and Chief Executive Officer Jamie Anderson: Chief Financial Officer Jeff Smith: Chief Operating Officer Daryl Tressler: Chief Banking Officer Bill Goodwin: Chief Credit Officer
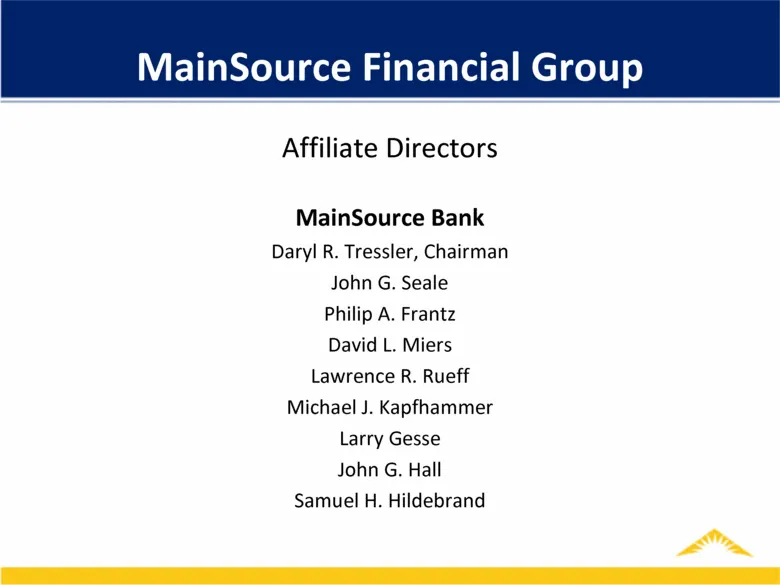
Slide 11: Affiliate Directors: MainSource Bank
MainSource Financial Group Affiliate Directors MainSource Bank Daryl R. Tressler, Chairman John G. Seale Philip A. Frantz David L. Miers Lawrence R. Rueff Michael J. Kapfhammer Larry Gesse John G. Hall Samuel H. Hildebrand
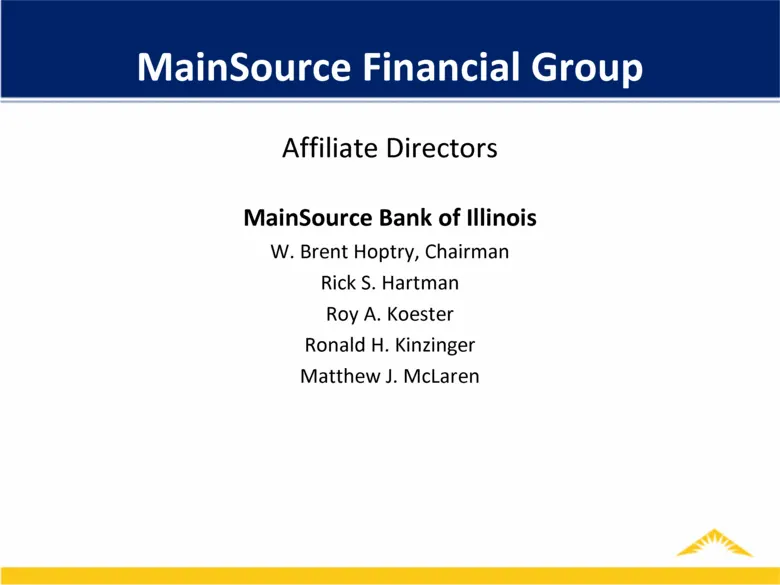
Slide 12: Affiliate Directors: MainSource Bank of Illinois
MainSource Financial Group Affiliate Directors MainSource Bank of Illinois W. Brent Hoptry, Chairman Rick S. Hartman Roy A. Koester Ronald H. Kinzinger Matthew J. McLaren
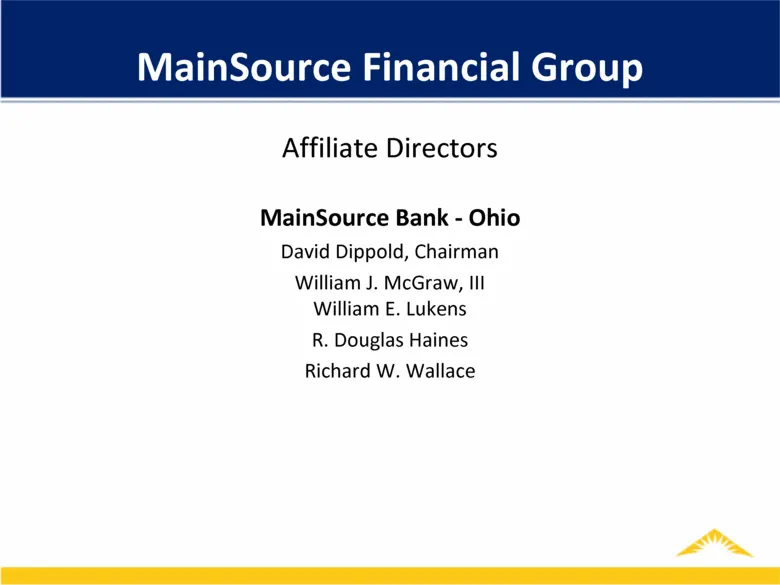
Slide 13: Affiliate Directors: MainSource Bank - Ohio
MainSource Financial Group Affiliate Directors MainSource Bank - Ohio David Dippold, Chairman William J. McGraw, III William E. Lukens R. Douglas Haines Richard W. Wallace
Slide 14: 2008 Financial Performance
2008 Financial Performance Jamie Anderson Chief Financial Officer
Slide 15: Disclosure Regarding Forward Looking Statements
We will achieve our vision by: Disclosure Regarding Forward Looking Statements This presentation may include forward-looking statements regarding, among other things, MainSource’s business strategy, financial position and prospects, dividend policy, business results, strategic initiatives, credit qu
Slide 16: 2008 Balance Sheet
2008 Balance Sheet
Slide 17: Total Assets
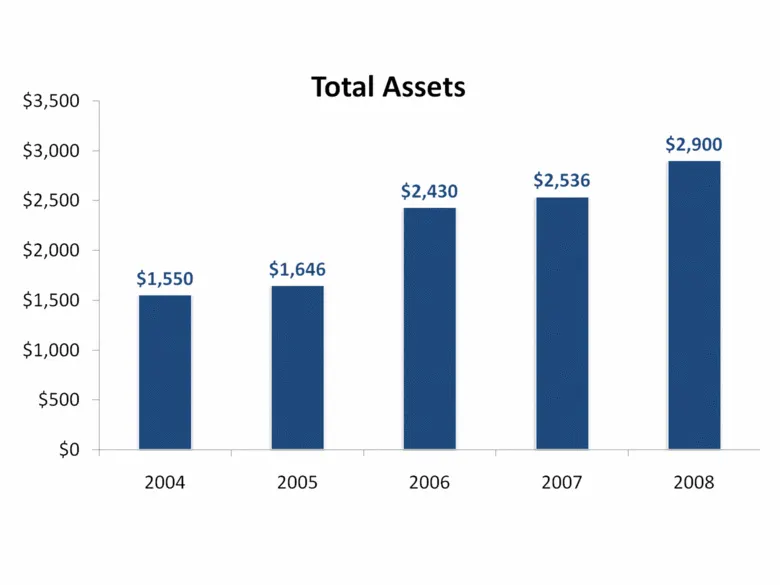
$3,500 $3,000 $2,500 $2,000 $1,500 $1,000 $500 $0 $1,550 2004 Total Assets $1,646 2005 $2,430 2006 $2,536 2007 $2,900 2008
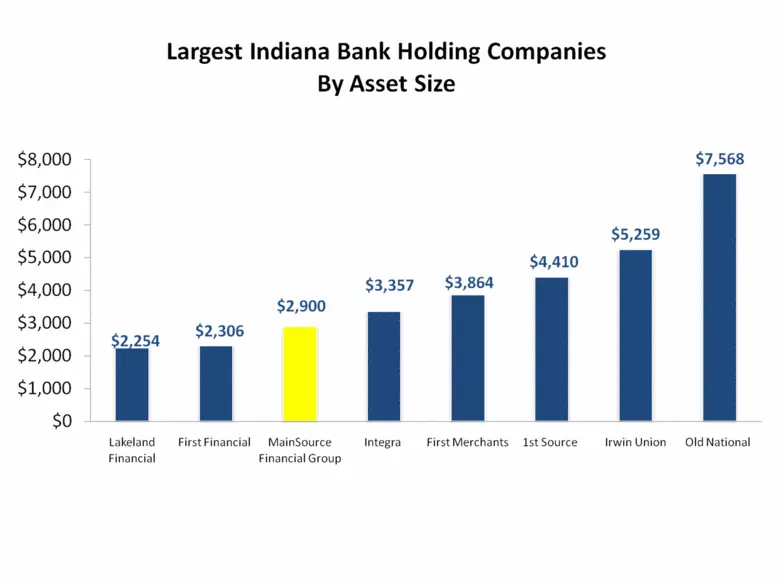
Slide 18: Largest Indiana Bank Holding Companies By Asset Size
Largest Indiana Bank Holding Companies By Asset Size
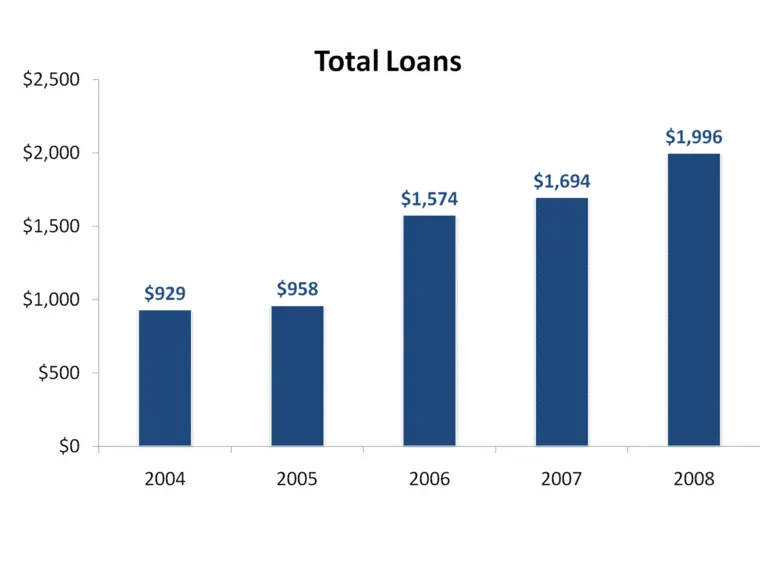
Slide 19: Total Loans
$2,500 $2,000 $1,500 $1,000 $500 $o $929 2004 Total Loans $958 2005 $1,574 2006 $1,694 2007 $1,996 2008
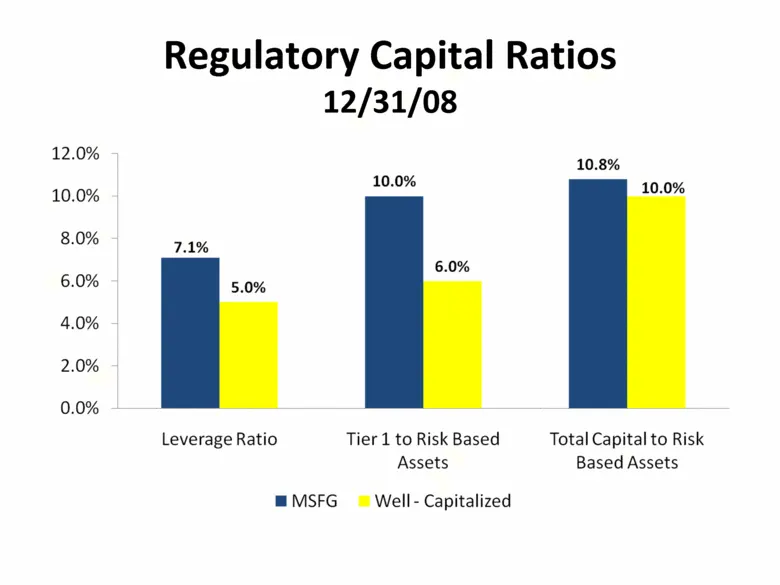
Slide 20: Regulatory Capital Ratios 12/31/08
Regulatory Capital Ratios 12/31/08
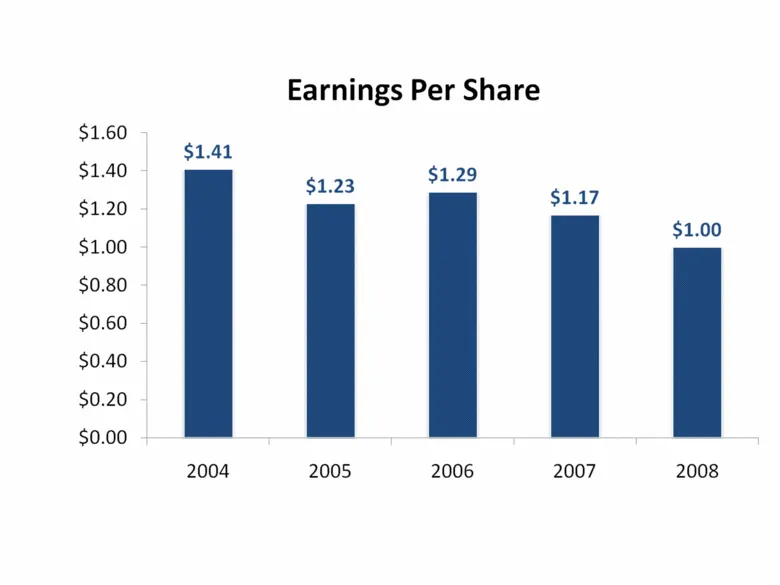
Slide 21: Earnings Per Share
Earnings Per Share $1.60 $1.41 can $1.23 $1.29 Pie $1.20 - $1.00 eae $0.80 $0.60 $0.40 $0.20 $0.00 2004 2005 2006 2007 2008
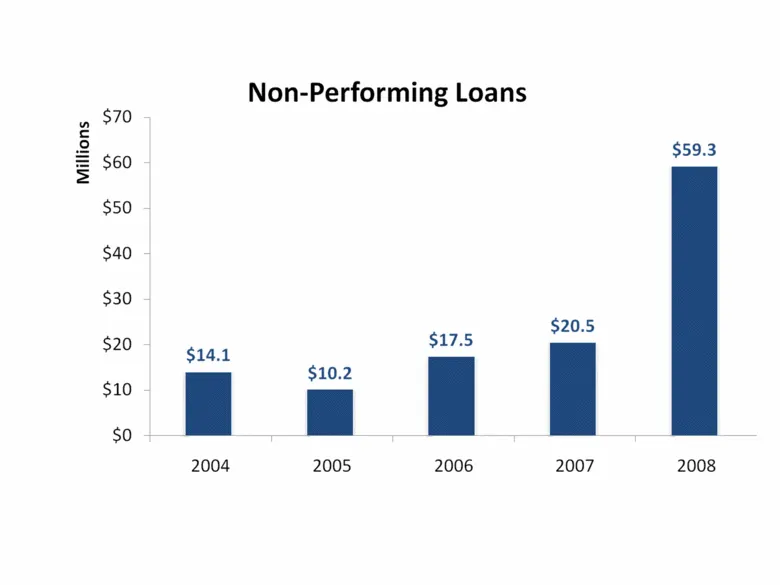
Slide 22: Non-Performing Loans
Millions Non-Performing Loans un XQ ro) $59.3 n a 3 wn a oS $40 $30 $20.5 $20 $14.1 ean $10.2 ° Tos U $o 2004 2005 2006 2007 2008
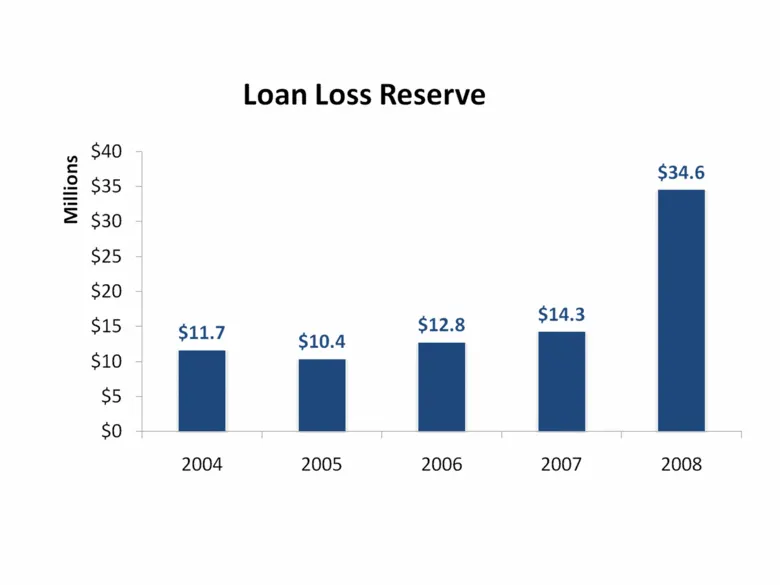
Slide 23: Loan Loss Reserve
Millions $40 wn w a $30 un N a $20 wo ae a $10 nH ou Loan Loss Reserve $34.6 $14.3 $12.8 $11.7 $10.4 [| [| 2004 2005 2006 2007 2008
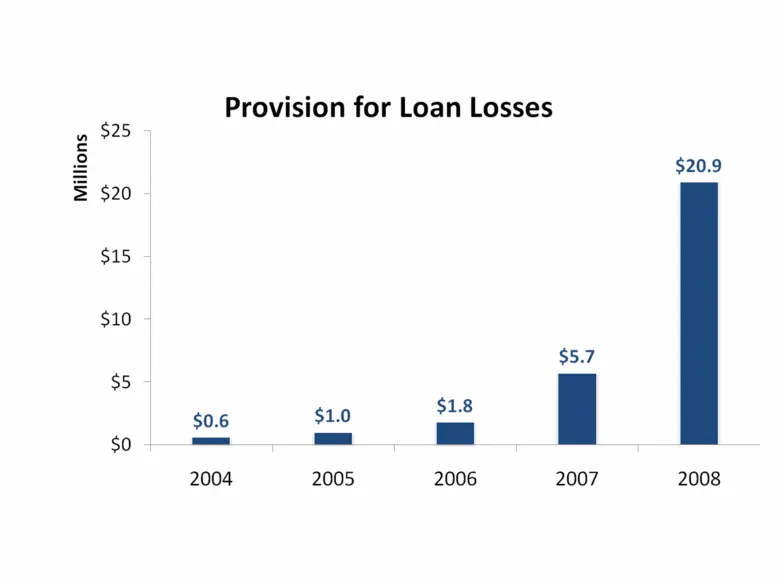
Slide 24: Provision for Loan Losses
w 925 2 5 $20 $15 $10 $5 $o Provision for Loan Losses $20.9 2008
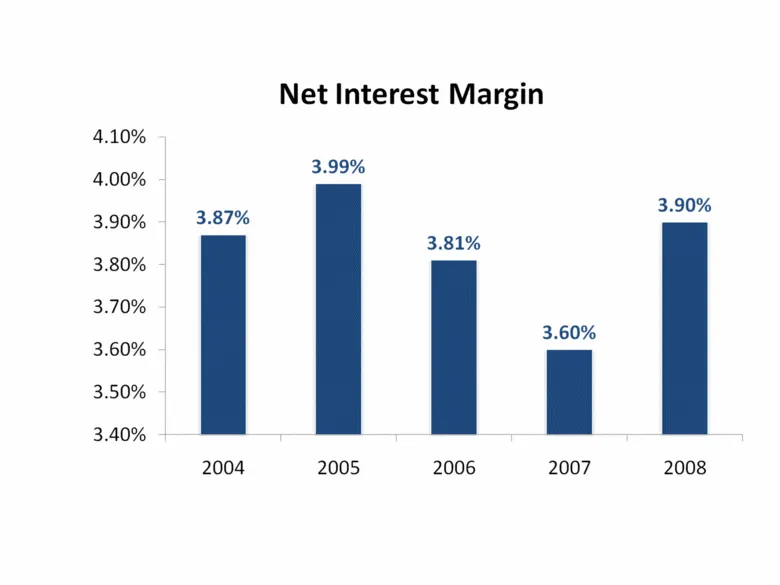
Slide 25: Net Interest Margin
4.10% 4.00% 3.90% 3.80% 3.70% 3.60% 3.50% 3.40% 3.87% 2004 Net Interest Margin 3.99% : 3.81% 2005 2006 3.60% 2007 3.90% 2008
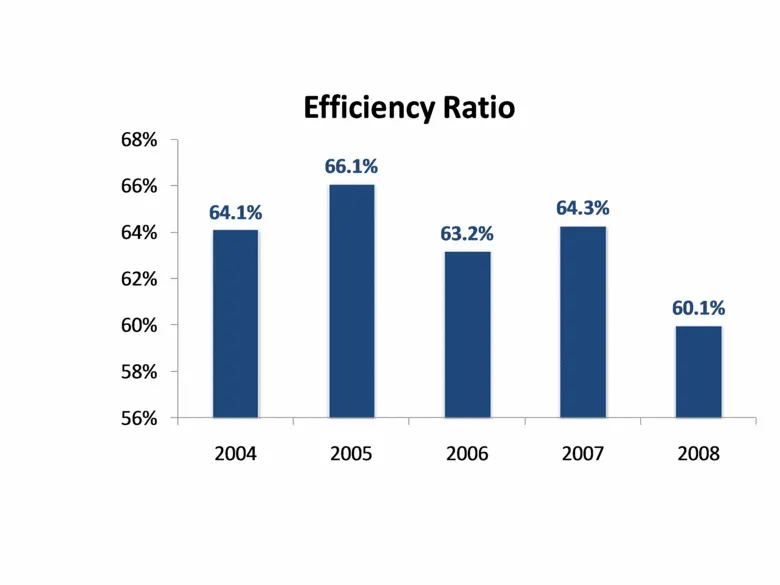
Slide 26: Efficiency Ratio
68% 66% 64% 62% 60% 58% 56% Efficiency Ratio 66.1% 64.3% 63.2% I | [J 2005 2006 2007 2008
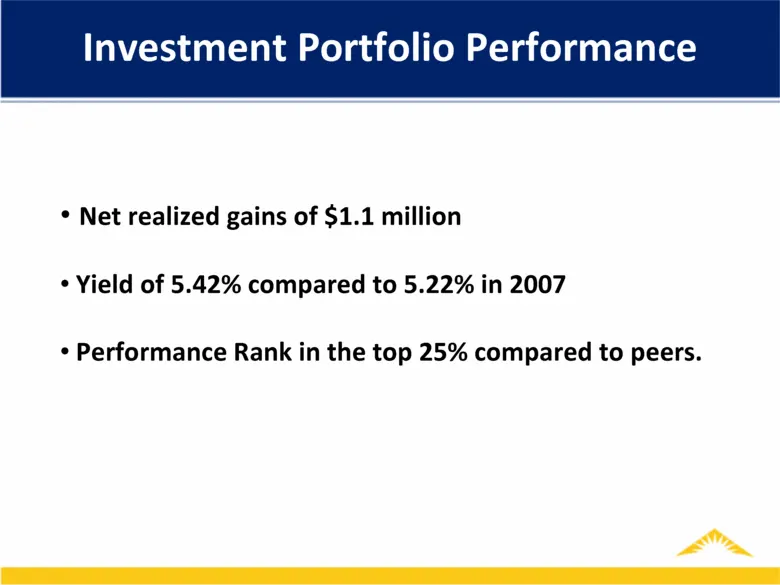
Slide 27: Investment Portfolio Performance
Investment Portfolio Performance Net realized gains of $1.1 million Yield of 5.42% compared to 5.22% in 2007 Performance Rank in the top 25% compared to peers.
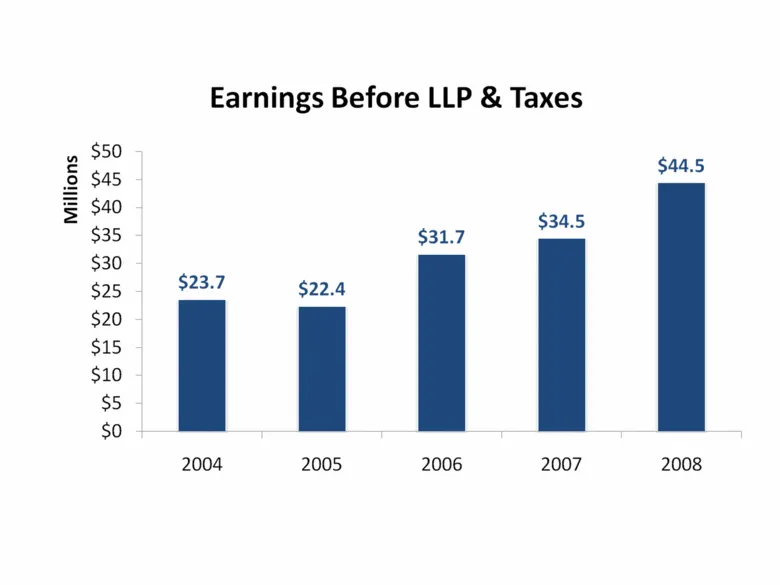
Slide 28: Earnings Before LLP & Taxes
Millions $50 $45 $40 $35 $30 $25 $20 $15 $10 $5 $o Earnings Before LLP & Taxes $23.7 2004 $22.4 2005 $31.7 2006 $34.5 2007 $44.5 2008
Slide 29: MainSource Financial Group NASDAQ Stock Symbol MSFG
MainSource Financial Group NASDAQ Stock Symbol MSFG
Slide 30: 2008 Stock Performance
2008 Stock Performance
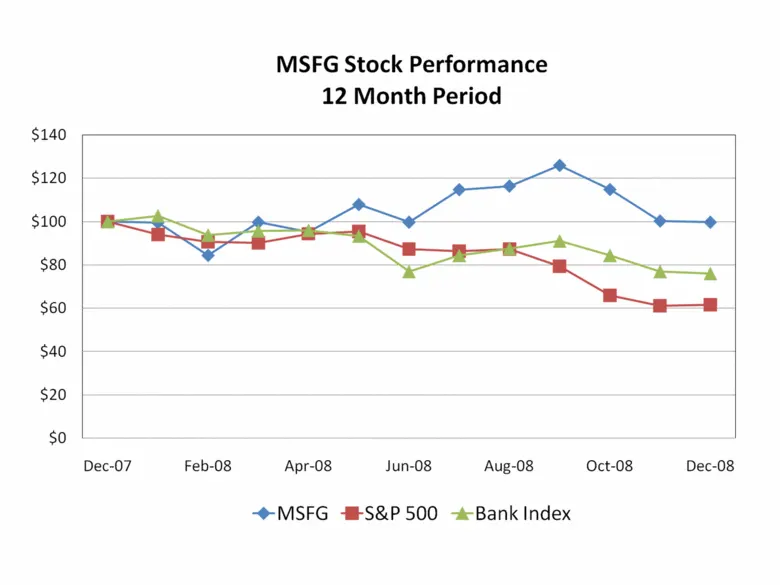
Slide 31: MSFG Stock Performance Month Period
MSFG Stock Performance 12 Month Period
Slide 32: 2008 – 1st Qtr. 2009 Stock Performance
2008 – 1st Qtr. 2009 Stock Performance
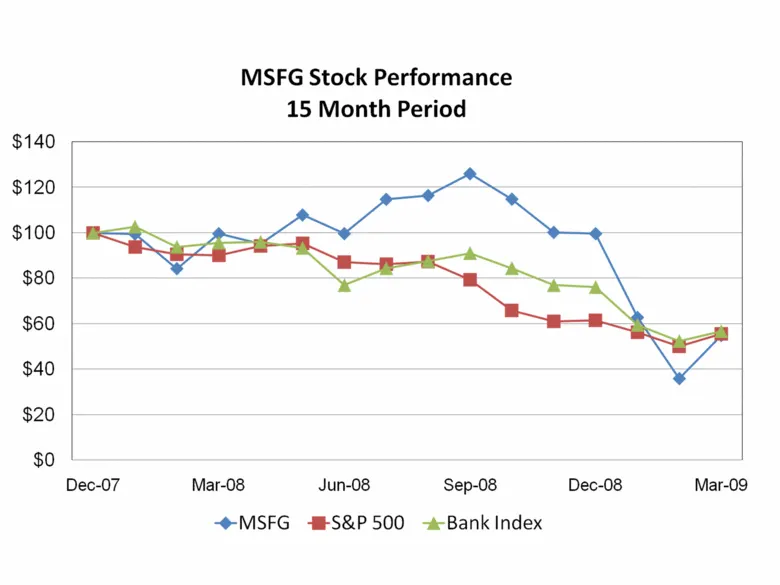
Slide 33: MSFG Stock Performance Month Period
MSFG Stock Performance 15 Month Period
Slide 34: MSFG Compared to Other Midwest Companies
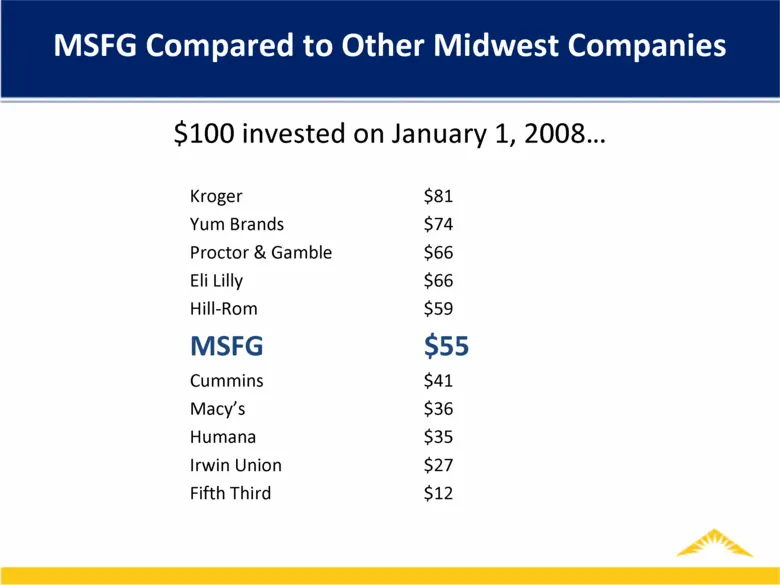
MSFG Compared to Other Midwest Companies $100 invested on January 1, 2008 Kroger $81 Yum Brands $74 Proctor & Gamble $66 Eli Lilly $66 Hill-Rom $59 MSFG $55 Cummins $41 Macy’s $36 Humana $35 Irwin Union $27 Fifth Third $12
Slide 35: 2009 Outlook
2009 Outlook Archie Brown
Slide 36: Credit Quality
Credit Quality
Slide 37: Non-Performing Loans
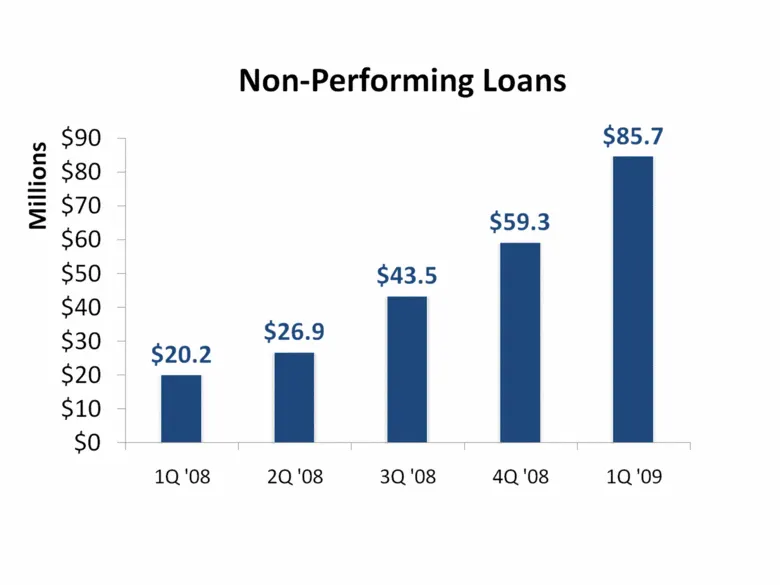
Millions Non-Performing Loans $59.3 $43.5 2Q'08 3Q ‘08 4Q '08 $85.7 1Q'09
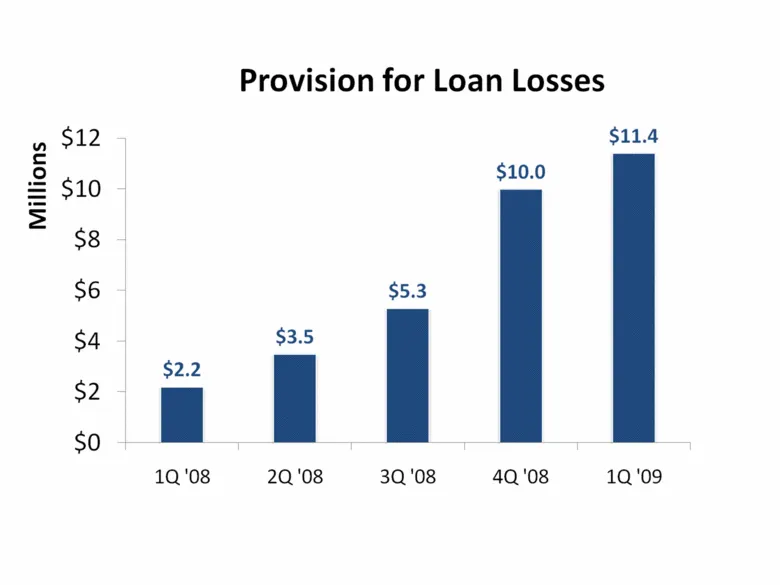
Slide 38: Provision for Loan Losses
$12 $10 $8 $6 $4 $2 so Millions Provision for Loan Losses $10.0 i 5 $2.2 1Q'08 2Q'08 3Q'08 4Q '08 $11.4 1Q'09
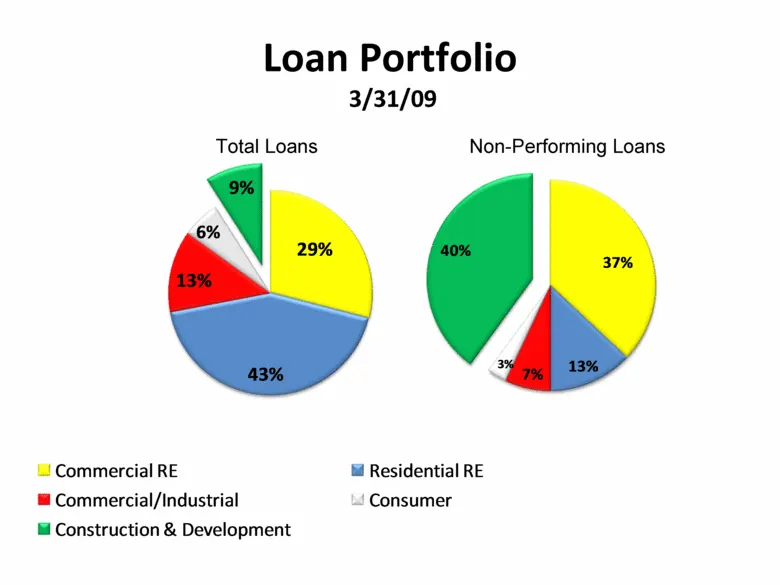
Slide 39: Loan Portfolio 3/31/09
Loan Portfolio 3/31/09 Total Loans Non-Performing Loans 37% 13% 7% 3% 40% 29% 43% 13% 6% 9% Commercial RE Residential RE Commercial/Industrial Consumer Construction & Development
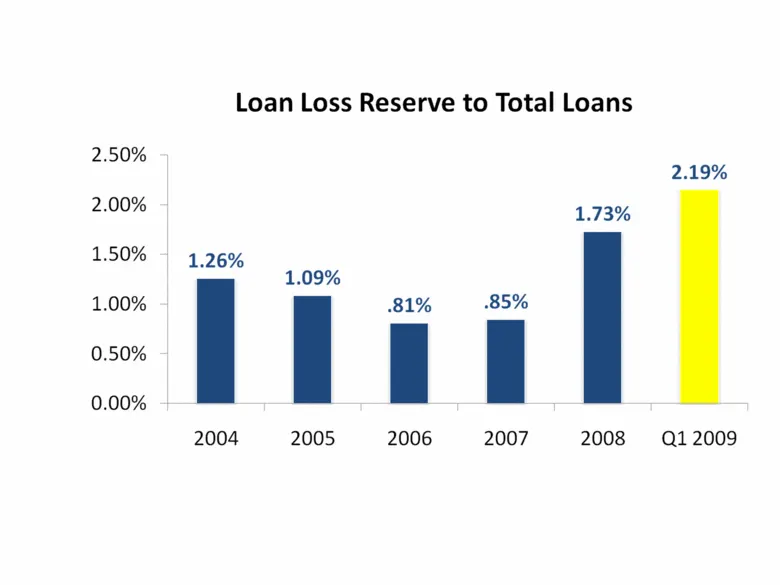
Slide 40: Loan Loss Reserve to Total Loans
Loan Loss Reserve to Total Loans
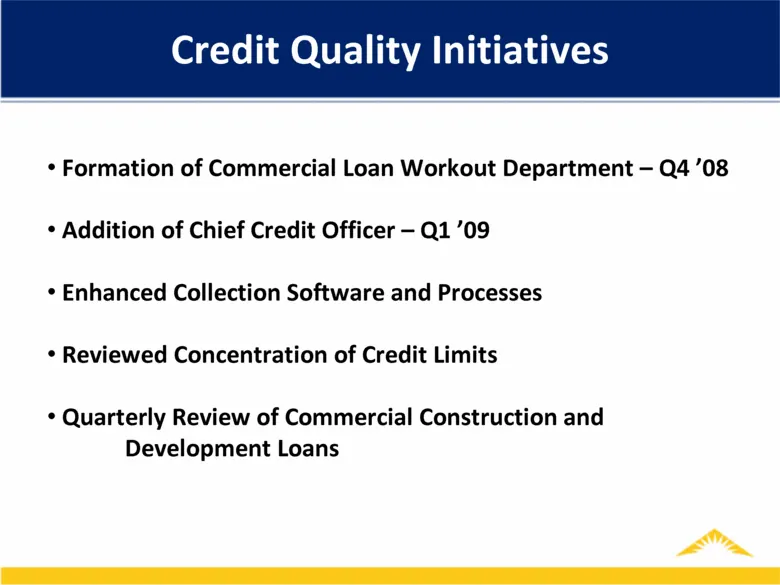
Slide 41: Credit Quality Initiatives
Credit Quality Initiatives Formation of Commercial Loan Workout Department – Q4 ’08 Addition of Chief Credit Officer – Q1 ’09 Enhanced Collection Software and Processes Reviewed Concentration of Credit Limits Quarterly Review of Commercial Construction and Development Loans
Slide 42: Acquisitions
Acquisitions
Slide 43: 1st Independence Financial Group
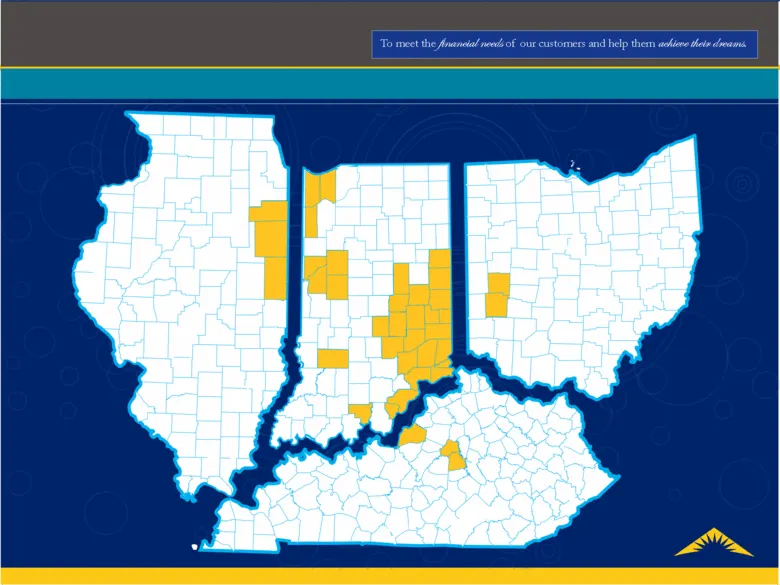
1st Independence Financial Group Acquired in August 2008 $320 Million in assets 7 branch locations Located in: Clark and Floyd counties in Indiana Mercer, Jefferson and Anderson counties in Kentucky
Slide 44: 1st Independence Financial Group Strategic Benefit
1st Independence Financial Group Strategic Benefit Increased from 4.4% to 7.4% in market share in Clark County, Indiana Increased from 11.2% to 14.7% in market share in Floyd County, Indiana Fits our community bank operating model
Slide 45: ‘To meet the Ananedal news of ou customers and help them ankle thee dowas
‘To meet the Ananedal news of ou customers and help them ankle thee dowas
Slide 46: American Founders Branch Purchase
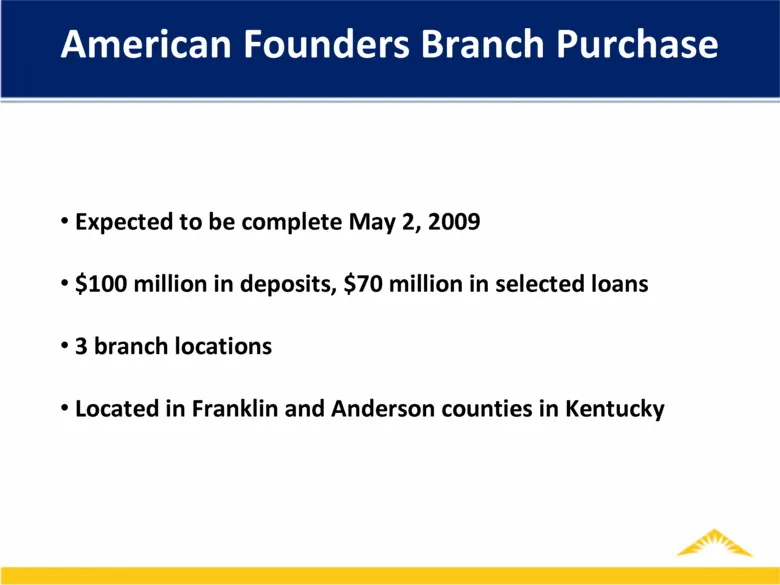
American Founders Branch Purchase Expected to be complete May 2, 2009 $100 million in deposits, $70 million in selected loans 3 branch locations Located in Franklin and Anderson counties in Kentucky
Slide 47: American Founders Branch Purchase Strategic Benefits
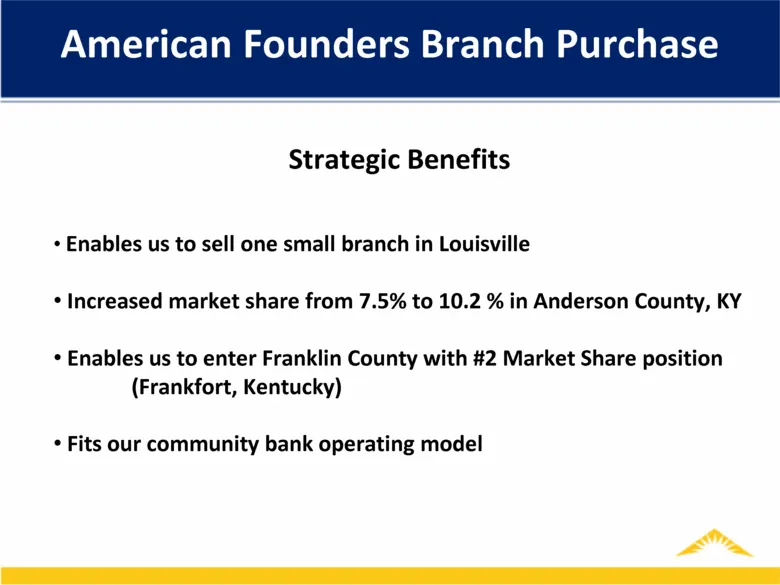
American Founders Branch Purchase Strategic Benefits Enables us to sell one small branch in Louisville Increased market share from 7.5% to 10.2 % in Anderson County, KY Enables us to enter Franklin County with #2 Market Share position (Frankfort, Kentucky) Fits our community bank operating model
Slide 48: Upon Acquisition: Kentucky branch locations
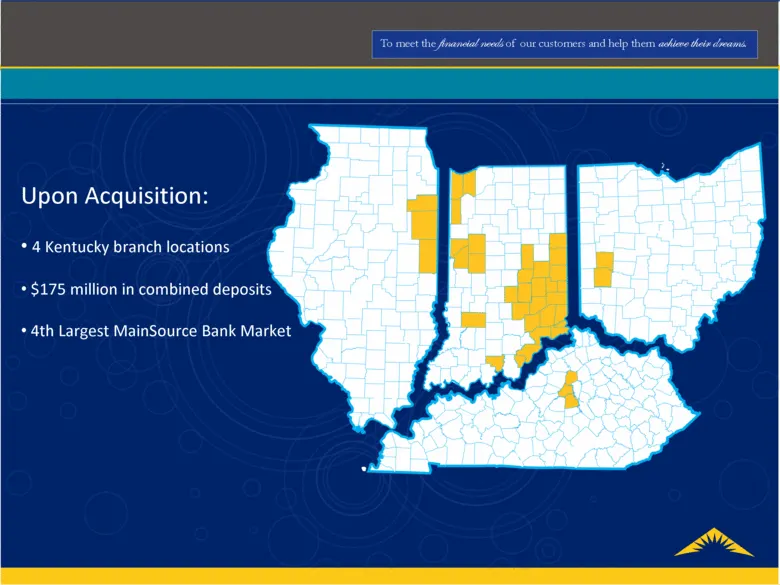
Upon Acquisition: 4 Kentucky branch locations $175 million in combined deposits 4th Largest MainSource Bank Market
Slide 49: Acquisition Strategy
Acquisition Strategy
Slide 50: Capital Purchase Program
Capital Purchase Program January 16, 2009: MainSource Financial Group issued $57 million of preferred stock .
Slide 51: Why We Participated
Why We Participated
Slide 52: Capital Purchase Program Investment vs. “Bail-Out”
Capital Purchase Program Investment vs. “Bail-Out”
Slide 53: Capital Purchase Program Investment vs. “Bail-Out”: Capital Ratios
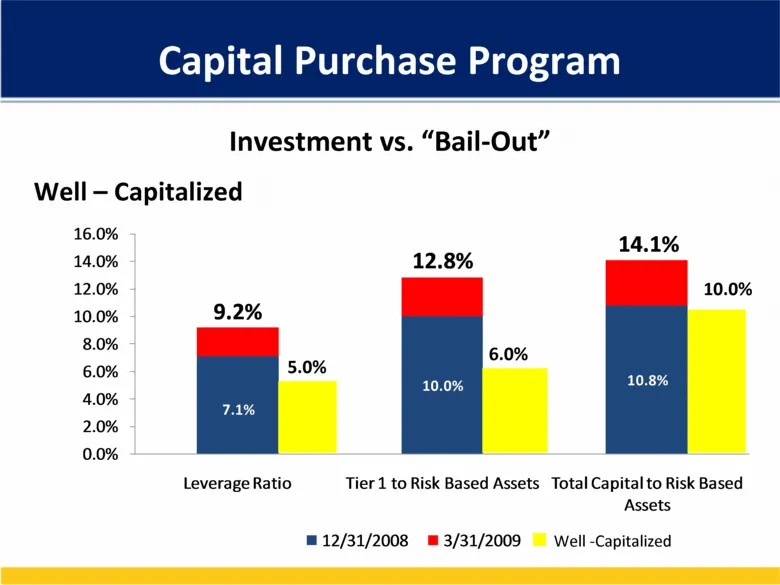
Capital Purchase Program Investment vs. “Bail-Out” Well – Capitalized 5.0% 6.0% 10.0% Well -Capitalized 7.1% 10.0% 10.8% 9.2% 12.8% 14.1% 0.0% 2.0% 4.0% 6.0% 8.0% 10.0% 12.0% 14.0% 16.0% Leverage Ratio Tier 1 to Risk Based Assets Total Capital to Risk Based Assets 12/31/2008 3/31/2009
Slide 54: Capital Purchase Program Investment vs. “Bail-Out”
Capital Purchase Program Investment vs. “Bail-Out” Profitable 5% dividend paid to Treasury Preferred shares to be repurchased in the future.
Slide 55: Capital Purchase Program: How we are using the capital?
Capital Purchase Program How we are using the capital? Increased lending capacity Replacing American Founders Bank in Frankfort, KY Insurance in the event of a deeper recession
Slide 56: Plans for Repurchase of Preferred Shares
Plans for Repurchase of Preferred Shares
Slide 57: Dividend Information
Dividend Information
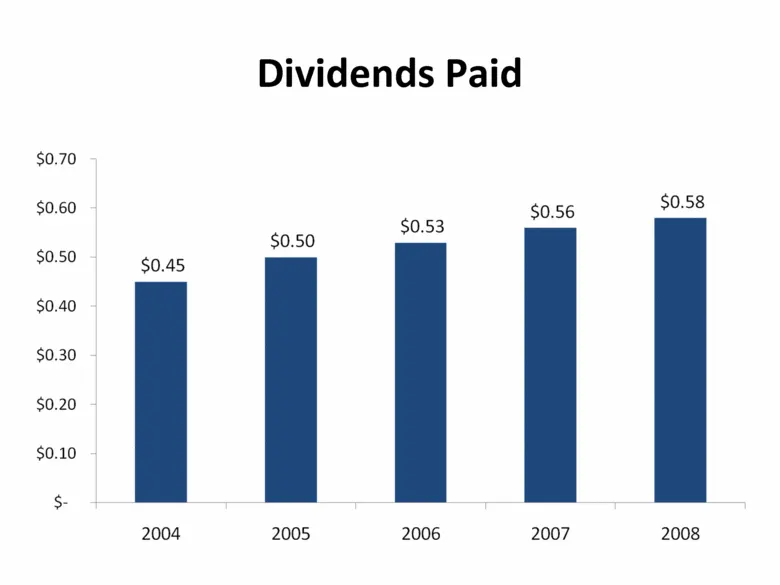
Slide 58: Dividends Paid
$0.45 2004 Dividends Paid $0.53 2006 $0.50 2005 $0.56 2007 $0.58 2008
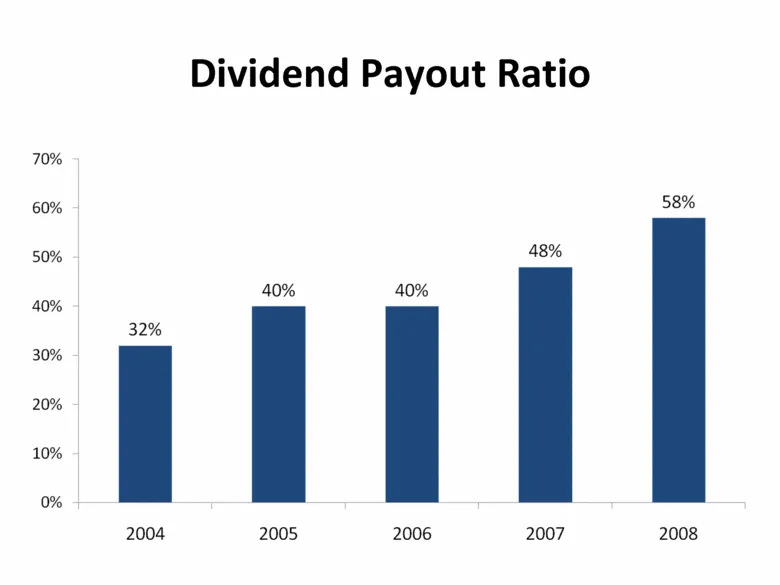
Slide 59: Dividend Payout Ratio %
70% 60% 50% 40% 30% 20% 10% 0% 2004 Dividend Payout Ratio 48% 40% 40% ' : 2005 2006 2007 58% 2008
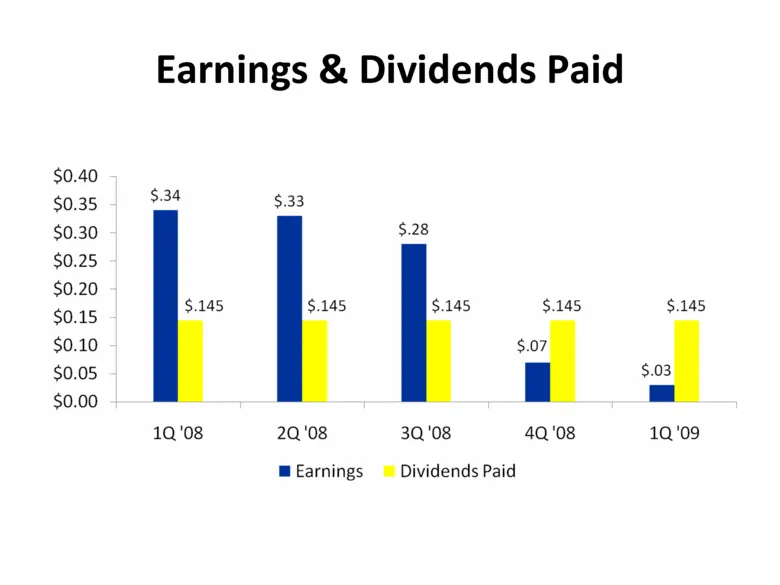
Slide 60: Earnings & Dividends Paid
$0.40 $0.35 $0.30 $0.25 $0.20 $0.15 $0.10 $0.05 $0.00 Earnings & Dividends Paid $.34 $.33 $.28 $.145 $.145 $.145 $.145 $.145 $.07 $.03 1Q'08 2Q'08 3Q'08 4Q'08 1Q'09 Earnings © Dividends Paid
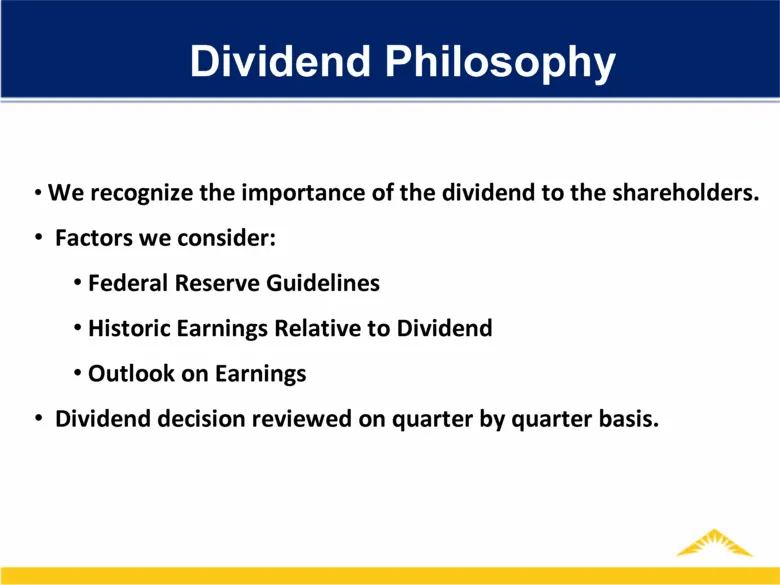
Slide 61: Dividend Philosophy
Dividend Philosophy We recognize the importance of the dividend to the shareholders. Factors we consider: Federal Reserve Guidelines Historic Earnings Relative to Dividend Outlook on Earnings Dividend decision reviewed on quarter by quarter basis.
Slide 62: Strategic Objectives
Strategic Objectives
Slide 63: Corporate Vision
To be the Premier Financial Services Company in the Midwest. Corporate Vision
Slide 64: Corporate Purpose
To meet the financial needs of our customers and help them achieve their dreams. Corporate Purpose
Slide 65: Corporate Values
Integrity Teamwork Ownership Corporate Values
Slide 66: Strategic Positions
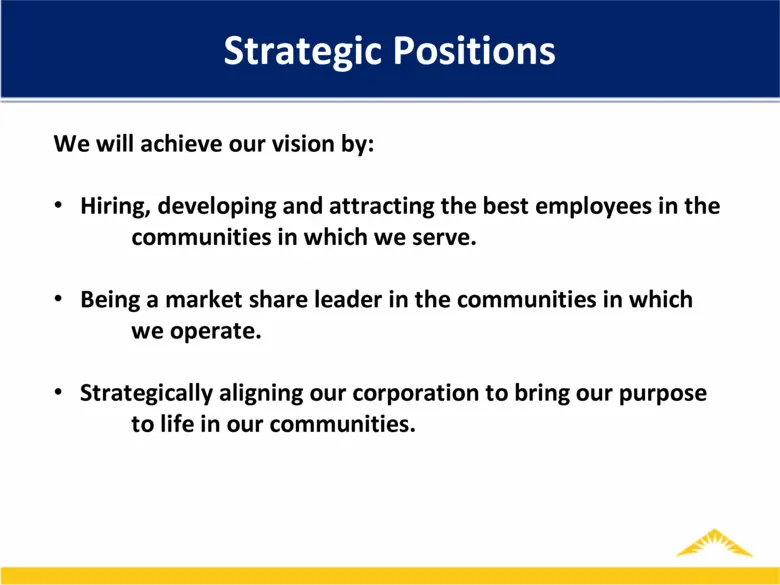
Strategic Positions We will achieve our vision by: We will achieve our vision by: We will achieve our vision by: We will achieve our vision by: Hiring, developing and attracting the best employees in the communities in which we serve. Being a market share leader in the communities in which we operat
Slide 67: Questions
Questions

Slide 68: To meet the financial needs of our customers and help them achieve their dreams
[LOGO] To meet the financial needs of our customers and help them achieve their dreams
Source: SEC EDGAR · 8-K filed Apr 29, 2009
More decks from MainSource Financial Group Inc
 Merger or Acquisition (October 2017)25 slides · Oct 31, 2017
 Merger or Acquisition (July 2017)23 slides · Jul 31, 2017
 Merger or Acquisition (July 2017)19 slides · Jul 26, 2017
 Shareholder Meeting (May 2017)67 slides · May 3, 2017
 Merger or Acquisition (December 2016)7 slides · Dec 19, 2016
 Investor Presentation (September 2016)34 slides · Sep 22, 2016