Cal Dive International — Q2 2011 Earnings Presentation
12 slides from Cal Dive International's earnings presentation, Aug 3, 2011
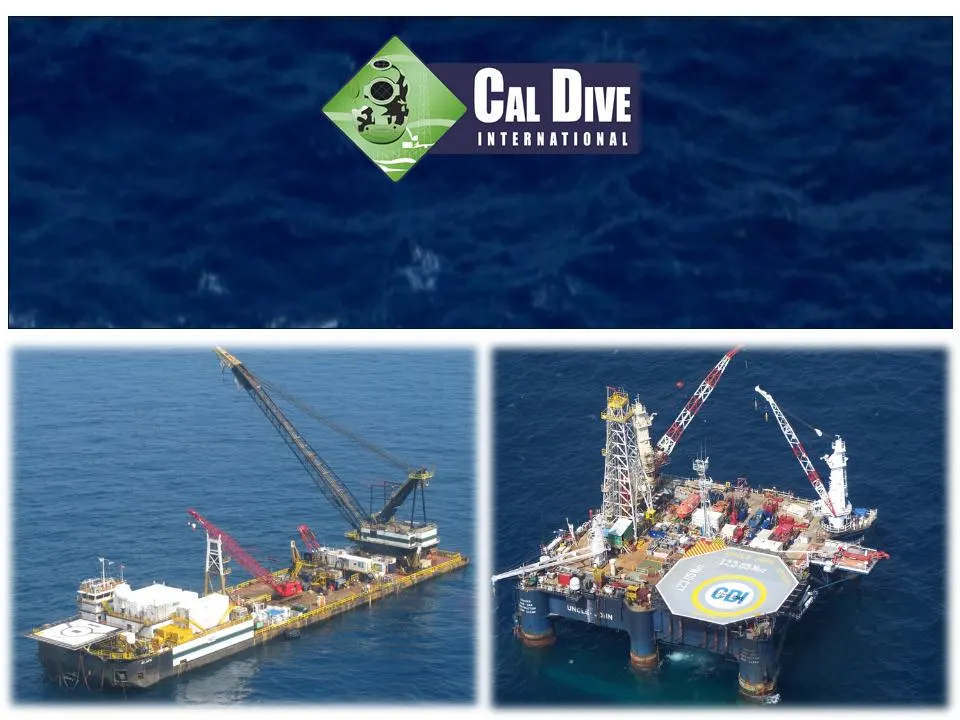
Slide 1: Cal Dive International 2nd Quarter 2011 Earnings Conference Call
Cal Dive International 2 nd Quarter 2011 Earnings Conference Call
Slide 2: Forward-Looking Statements
Forward-Looking Statements This presentation may include “forward-looking” statements that are generally identifiable through our use of words such as “believe,” “expect,” “anticipate,” “intend,” “plan,” “estimate,” “project” and similar expressions and include any statements that we make regarding
Slide 3: Presentation Outline
Presentation Outline • Summary of 2Q 2011 Results • Backlog • Discussion of Financial Results • Non-GAAP Reconciliations • Questions & Answers

Slide 4: Summary of 2Q Results
Summary of 2Q Results • Construction project in Bahamas completed. • Increased profitability in Australia for diving related work on Gorgon project. • Increased tax benefit. • Slow activity levels continue in GOM. • Slower than expected recovery in permitting process. • No oil spill cleanup related
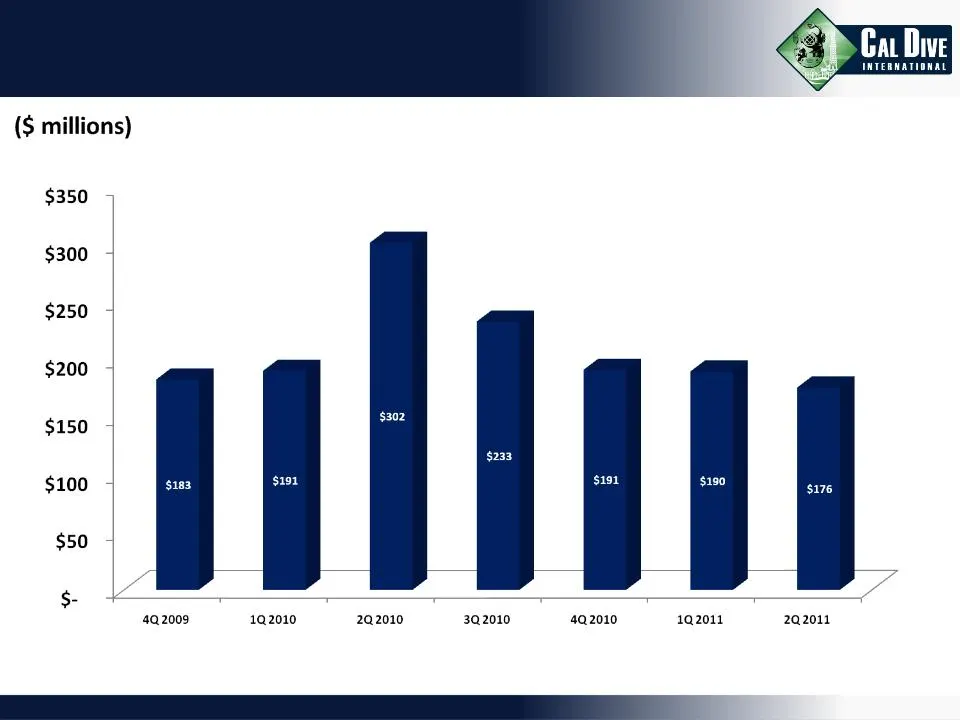
Slide 5: Quarterly Revenues
Ca Dive INTERMATIONAL ($ millions) $350 $300 $250 - $200 $150 $100 - $183 $191 $190 $50 - S$- + 4Q.2009 1Q2010 2Q2010 3Q2010 492010 1Q2011 2Q2011

Slide 6: Financial Results
Financial Results (all amounts in thousands, except per share amounts and percentages) Three Months Six Months Ended June 30, Ended June 30, 2011 2010 2011 2010 Revenues $124,040 $124,217 $219,471 $181,635 Gross Profit (Loss) $1,654 $7,457 ($5,572) ($7,952) Margins 1% 6% (3%) (4%) Net Loss ($5,014)

Slide 7: Utilization
Utilization (The following statistics are for owned and operated vessels only) Three Months Six Months Ended June 30, Ended June 30, 2011 2010 2011 2010 Effective Utilization (1) - Saturation Diving Vessels 60% 62% 54% 50% Surface Diving Vessels 46% 61% 40% 42% Construction Barges 27% 25% 21% 16% To
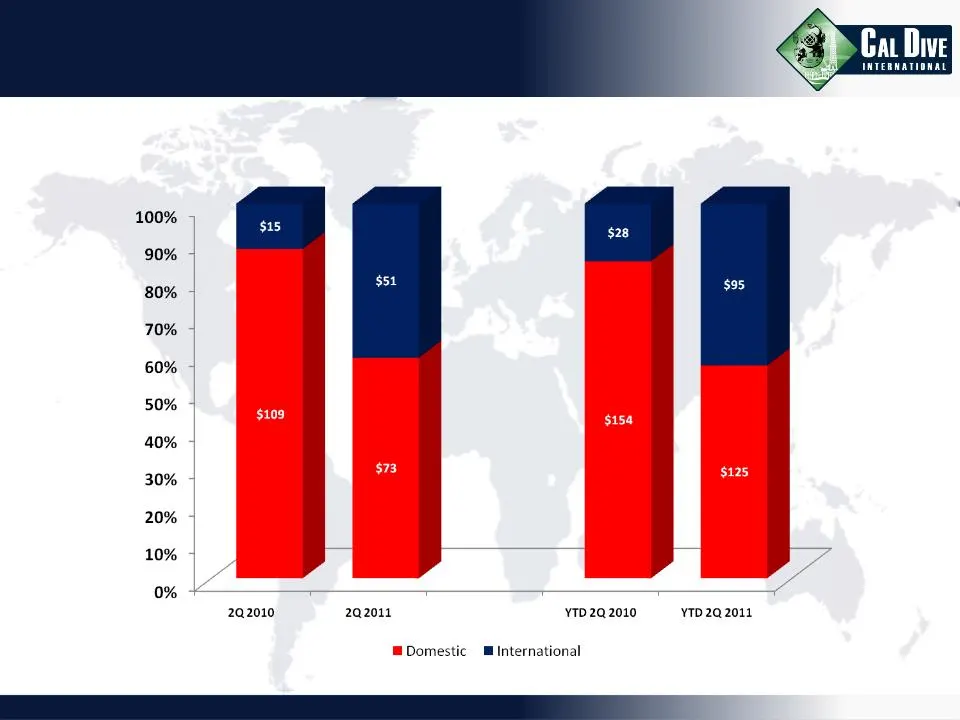
Slide 8: International Revenue
International Revenue ($ millions)
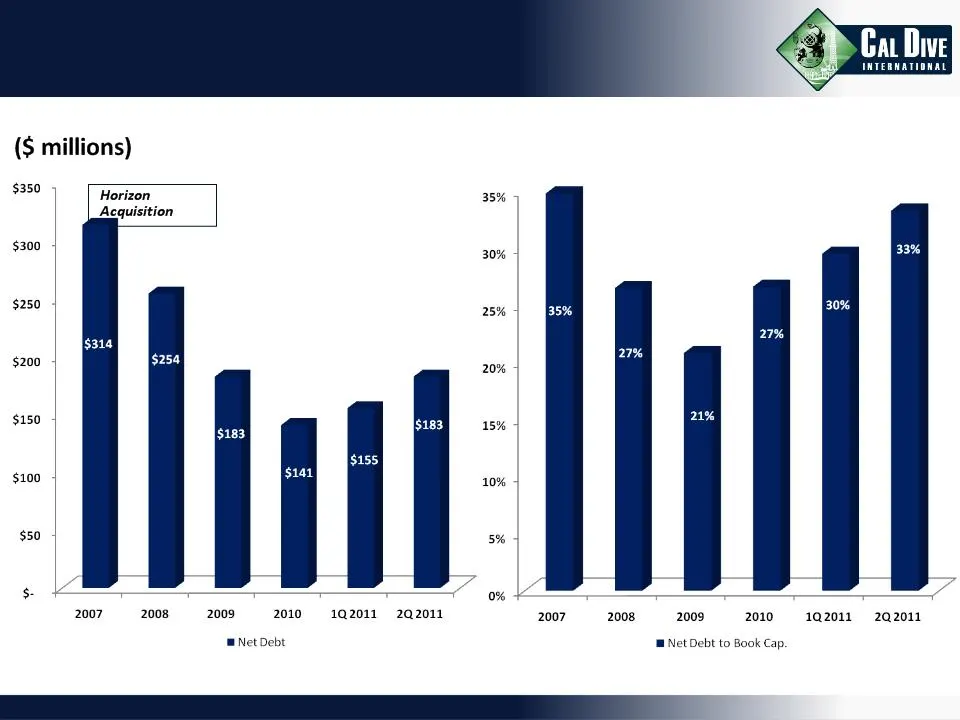
Slide 9: Debt Levels and Net Debt
Debt Levels Net Debt Levels (1) Net Debt to Book Cap. % (2) (1) Calculated as Total Debt less Cash and Cash Equivalents. (2) Calculated as Net Debt divided by Stockholders’ Equity plus Net Debt.
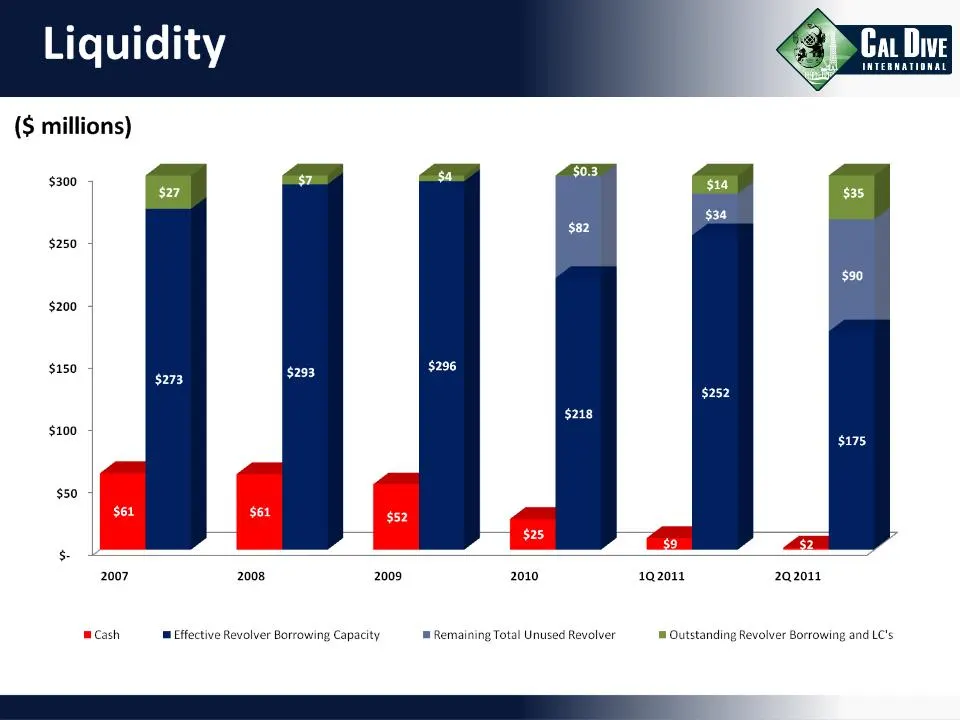
Slide 10: Liquidity
Ca Dive INTERMATIONAL Liquidity ($ millions) $0.3 $300 $14 $35 $34 $82 $250 | $90 $200 + $150 $252 $218 100 s: $175 $50 6 L es — _— —— = 2007 2008 2009 2010 192011 2Q2011 Cash Effective Revolver Borrowing Capacity '™ Remaining Total Unused Revolver ™ Outstanding Revolver Borrowing and LC's
Slide 11: arr
: _ arr ¥ a ~ ‘ bs oF sept ; * + 43, Ta — ee Ca Dive INTERMATIONAL

Slide 12: EBITDA Reconciliations
EBITDA Reconciliations (all amounts in thousands) Three Months Six Months Ended June 30, Ended June 30, 2011 2010 2011 2010 EBITDA (unaudited) $7,278 $10,344 $5,939 $1,854 Less: Depreciation & Amortization 17,476 16,563 34,352 34,825 Less: Non-Cash Stock Comp. Expense 2,318 1,795 4,598 3,578 Less: I
Source: SEC EDGAR · 8-K filed Aug 3, 2011
More decks from Cal Dive International Inc
 Q3 2014 Earnings Presentation12 slides · Nov 6, 2014
 Q2 2014 Earnings Presentation12 slides · Aug 11, 2014
 Q1 2014 Earnings Presentation12 slides · May 9, 2014
 Q4 2013 Earnings Presentation11 slides · Mar 5, 2014
 Q3 2013 Earnings Presentation11 slides · Nov 7, 2013
 Q2 2013 Earnings Presentation11 slides · Aug 8, 2013