
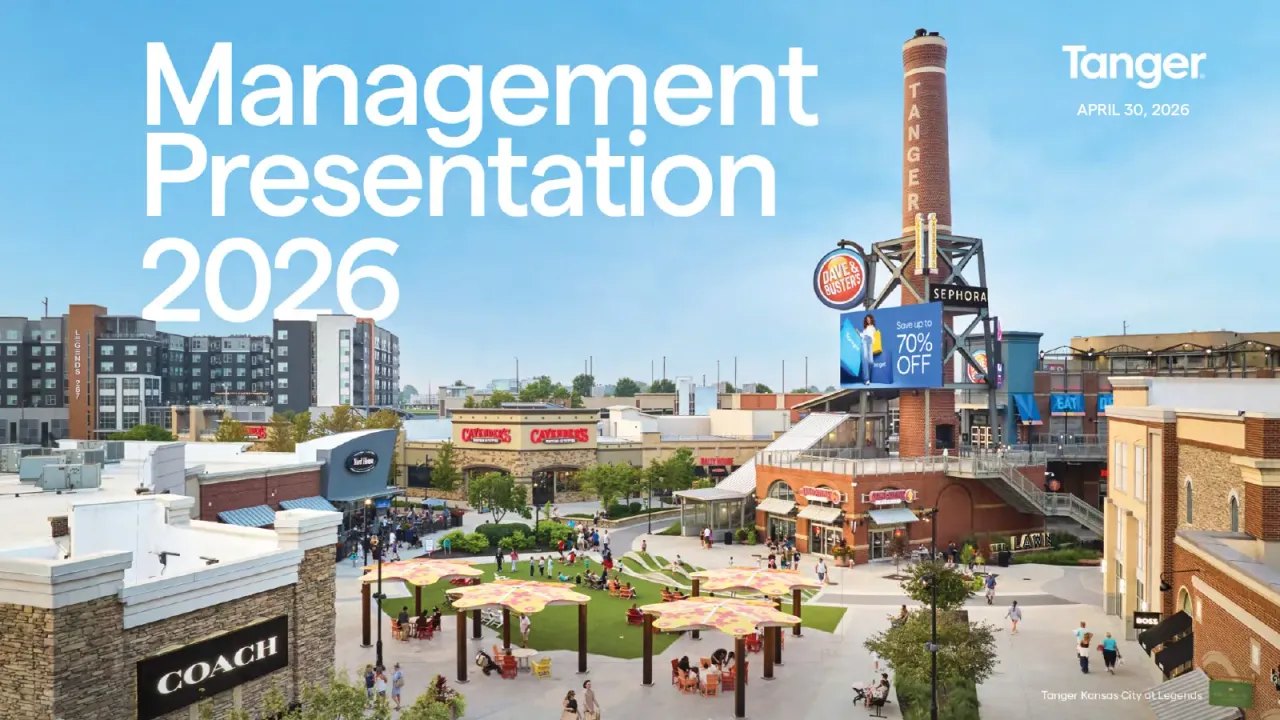
NOVEMBER 4, 2026
Table of ContentsOur Company and Strategy | 3 | |
Activating Growth Leasing, Operations, and Marketing | 16 | |
Accelerating Growth A Portfolio Positioned in the Path of Demand | 24 | |
External Growth Accretive Portfolio Expansion Drives Value | 34 | |
Appendix | 41 | |
Tanger Outlets Charleston | 3Q 2026 | | 2 |
Tanger Outlets Asheville 3Q 2026 | 3
Innovating Retail for 45 Years1981 Founded | 1993 Listed (NYSE: SKT) | ~17M SF of open-air shopping | 42 Outlet and Lifestyle centers |
$4.1B | $5.9B | 3,000+ | 800+ |
Market capitalization | Enterprise value (1) | Stores (average store size only ~5,000 SF) | Unique brands and retail concepts |
4.6x | 4.6x | 95% | 90%+ |
Net debt / Adj. EBITDAre (1) | Interest coverage ratio (2) | of portfolio is open air | of SF in leading tourist destination or top 50 MSA (3) |
Refer to presentation notes beginning on page 52.
Our Mission
We create shopping destinations that entertain, inspire, and bring our communities together
Our Vision
To lead the evolution of shopping
3Q 2026 | 4
Outlet Center Lifestyle Center Strategic Partnership
Corporate Headquarters
Open-Air Retail Portfolio in Dynamic Markets42
Retail Centers*
~17M
Square Feet
3K+
Stores
800+
Brands
High-quality, open-air Outlet and Lifestyle portfolio attractive to retailers, brands, and shoppers
Focused in high-growth suburban markets and high-frequency tourist destinations
Strong tenant demand and limited new retail supply drives performance of existing portfolio
Portfolio well positioned in the path of population growth and migration trends
Emphasis on market-dominant and unique-to-market centers, with multiple traffic drivers
Led by local teams in each market, backed by national platform
Attractive merchandising mix curated to drive traffic, sales and dwell time
EXPERIENCE OUR CENTERS
*Includes 35 consolidated centers, six unconsolidated joint venture properties, and one managed property through a strategic partnership 3Q 2026 | 5
Tanger's Strategic AdvantagesOpen-air portfolio in sought-after destinations
Well positioned in the path of population migration trends, with in-demand retailers and high-quality food, beverage, and entertainment
Proven track record of operational excellence
Active asset management by both the corporate and local field teams to maximize center value
Loyal retailer partnerships and customer relationships
Provide us with unique insights to anticipate shopper trends and expectations
Experienced leadership team and best-in-class platform
Over the last five years, a refreshed management team is growing Tanger and harnessing opportunities through its differentiated and best-in-class leasing, marketing, and operating platform
Strong NOI growth potential
Driving rents, maximizing occupancy, diversifying brand assortment, growing other revenues, activating peripheral land, and operating efficiently
Balance sheet positioned for growth
Investment grade, well-laddered, and low-leveraged balance sheet with additional liquidity from untapped credit capacity, undrawn forward equity, and free cash flow after dividends
Pinecrest | Cleveland, OH 3Q 2026 | 6
A Differentiated Platform Driving Growth The Pillars driving our growthInternal Growth
Deliver strong NOI growth through active leasing, operating, and marketing initiatives
Real Estate Intensification
Enhance and create value from existing real estate asset base
External Growth
Expand portfolio through selective and disciplined acquisition and development
A Conservative and Flexible Balance Sheet
The Foundationsupporting our growth
Target Net Debt/EBITDA range of ~5-6x
Optimize cost of capital - equity and debt
Increase sources of capital to fund growth
A Platform Evolution Driving Performance and Growth3.5%-4.25% 2026 Same Center NOI Growth (Guidance) | $487 Sales Per Square Foot (3Q26 TTM) | +11.0% Rent Spreads (3Q26 TTM) | 2.6M SF Leases Executed (3Q26 TTM) |
Vs. -0.7% (FY19) | Vs. $398 (4Q19 TTM) | Vs. -11.6% (4Q19 TTM) | Vs. 1.5M (4Q19 TTM) |
8.6% | 4.6x | $4.1B | $5.9B |
Core FFO Per Share | Net Debt / Adj. EBITDAre | Market Cap | Enterprise Value |
3-Year Avg. Growth (1) | (3Q26 TTM) | (3Q26) | (3Q26) |
Vs. -0.7% (3YE 2019) | Vs. 5.7x (4Q19 TTM) | Vs. $1.4B (4Q19) | Vs. $3.2B (4Q19) |
Refer to presentation notes beginning on page 52. |
Through Accretive Portfolio Expansion
8Additions
$840MInvested
$185MOutlet
Sold (10 dispositions since 2019)
Tanger Palm Beach | Palm Beach, FL
Lifestyle
Strategic Partnership - July 2022
Tanger Nashville | Nashville, TN
New Development - October 2023
Tanger Asheville | Asheville, NC
Acquired - November 2023
Tanger Kansas City | Kansas City, KS
Acquired - September 2025
Bridge Street Town Centre Huntsville, AL
Acquired - November 2023
The Promenade at Chenal Little Rock, AR
Acquired - December 2024
Pinecrest Cleveland, OH Acquired - February 2025
Levis Commons Town Center Toledo, OH
Acquired - May 2026
32%
Non-apparel/footwear
GLA, up from 19% in 2019
Driving GrowthThrough Merchandising
Exciting new
entertainment and service options
Elevating and
expanding food & beverage choices
Incorporating top
beauty and wellness brands
Enhanced mix of
in-demand brands
Stronger sense of place with experiential amenities and brand mix
A curated mix of national, regional, and local favorites
Growing & New
Brand Additions
3Q 2026 | 10
Driving GrowthConnecting with the growing youth sports industry to drive sales and traffic
Growing ancillary revenues through sponsored events and partnerships
Reinvesting in our asset base to drive traffic and extend dwell time
Through a Data-Driven Approach to Leasing, Marketing, and Operating Our Portfolio
Activating peripheral land to maximize value
Empowering retailer partners with a digital-first shopper engagement platform
Modernizing our loyalty program to reach wider and younger audiences
Investing in sustainability with an ROI approach
Utilizing AI to drive efficiencies
Leveraging unique traffic drivers in each market
The foundation supporting our growth
Strong NOI growth potential
Prudent balance sheet management with a low-leveraged, investment grade, and flexible balance sheet
Disciplined and targeted approach to external growth
Attractive dividend yield and above average retained cash flow given low dividend payout ratio
Data-driven and analytical approach
Broad investment community exposure to Tanger assets, team, and long-term growth potential
Strategic Use of Secured Financing (1)
$334M
18%
$1.8
BILLION NET DEBT
30%
$5.9
BILLION TOTAL ENTERPRISE VALUE
70%
$4.1
BILLION EQUITY
$1.5B
82%
Unsecured financing Secured financing
Limited Floating Rate Exposure (1)
7% $127M
Capital Structure (1)
(% of Total Enterprise Value)
$618MLine Availability
4.6xNet debt /
Adj. EBITDAre (2)
64%FAD Payout Ratio (3)
BBBCredit Rating
(or equivalent)
$1.7B
93%
Fixed rate debt Variable rate debt
As of September 30, 2026. Refer to reconciliations of Net debt, Adjusted EBITDAre, and Funds Available for Distribution (FAD) beginning on page 46. Refer to presentation notes beginning on page 52.
3Q 2026 | 13
Debt
4.1%
3.8
$1.8B Pro Rata
Effective Interest Rate (1)
Years to Maturity (2)
Cash and Restricted Cash (i)
$115
$618 in available borrowing capacity
$400
$2
$350
$300
$250
$136
$650
$0
Cash (i) 2026 2027 2028 2029 2030 2031 2032 2033
$36
$47
$52
$200
$415
$486
Lines of Credit (ii) Mortgage Debt (at pro rata share) Unsecured Term Loans Exchangeable Notes Unsecured Bonds
Cash
Refer to presentation notes beginning on page 52.
(i) Includes cash of $20M and restricted cash of $32M
(ii) $620M in commitments maturing in 2029; $2M outstanding at 9/30/2026.
3Q 2026 | 14
Solid Debt Position
As of September 30, 2026
In millions, unless otherwise noted
Total Liquidity
Line of credit availability
Cash and Short-term investments
Proceeds available from settlement of forward sale agreements
($ M)
$618
$20
$24
$662M
Earnings and 2026 GuidanceHigh Range
Low Range
Guidance for 2026
Net income per diluted share $1.08 $1.12 Depreciation and amortization of real estate assets -
$ PER SHARE
consolidated and the Company's share of unconsolidated joint ventures
$1.41 $1.41
$3.00
$2.00
$1.00
Core FFO per diluted share (3) $2.49 $2.53
High Range
Low Range
Guidance Assumptions for 2026 (4)
($ in millions)
Same Center NOI growth - total portfolio at pro rata share 3.50% 4.25% General and administrative expense $80.5 $83.5
Interest expense, net of interest income - consolidated $70.5 $71.7
Annual recurring capital expenditures, renovations, and
$2.33
$2.13
$2.53
$2.49
$1.87
$1.70
$1.12
$0.88
$0.99
$1.08
$0.71
$0.82
FY24(1)
FY25 (2)
FY26
Guidance
3Q25 YTD(2) 3Q26 YTD
second generation tenant allowances and other leasing costs
$-
$70.0 $75.0
Net Income Core FFO
Guidance as of November 4, 2026. Charts are based on net income and Core FFO available to common shareholders; refer to reconciliations of net income to FFO and Core FFO beginning on page 46. Refer to presentation notes beginning on page 52.
3Q 2026 | 15
Activating GrowthLeasing, Operations, and Marketing
Localized teams
Working together to drive:
Growth
Efficiency
Exceptional shopping experiences
Supported by our national platform
Leasing
Marketing
Operations
Development
Asset Management and Investments
A Fully Integrated Platform
Fueling the performance of our open-air outlet and lifestyle centers
Operating Metrics97.3% Occupancy (1) | 3.5% Change in Same Center NOI YTD26 vs. YTD25 (2) | 9.7% Occupancy cost ratio (3) | |
2.6 Million SF executed in last 12 Months from 564 leases (4)(5)(6) | $487 Tenant sales per SF (4) Up 2.5% from 3Q25 (7) | ||
+11.0%
Blended cash rent spreads for executed comparable leases (4)(5)(8)
19
Consecutive quarters of positive rent spreads
Refer to presentation notes beginning on page 52.
Tanger Outlets Phoenix 3Q 2026 | 18
LeasingPartnering with brands to drive mutual success
Driving rents with higher rent spreads, shifting variable rent to fixed, and converting temp space to permanent deals
Enhancing portfolio with an elevated and diversified retailer mix
Introducing non-retail uses including food, entertainment, and experiential, along with digitally native concepts
Focusing on opportunities to attract new visitors, increase visit frequency, and extend dwell time
Strong, Dynamic, and Diverse Tenant Mix
Top 10 Tenant Brands
71.2%
5.1%
4.3%
3.2%
3.2%
2.9%
2.2%
2.2%
2.0%
1.9%
1.8%
Corporate Parent
Other Brands
Opportunity17%
17%
19%
21%
Upcoming expirations offer opportunity to continue driving rents, diversification, and elevation.
+11.0%
Blended Cash Rent Spreads for Executed Comparable Leases (3)
Percentage of Annual Base Rent (4)
Percentage of Total GLA (4)
3Q26
3Q25
3Q26
3Q25
2025
2024
2023
2022
2021
2020
2019
2018
2017
2016
2015
2014
4%
3%
13%
13%
12%
12%
9%
9%
6%
7%
5%
5%
4%
3%
3%
3%
8%
7%
2026 2027 2028 2029 2030 2031 2032 2033 2034 2035 2036+
Occupancy
We've delivered solid performance with sustained occupancy for 10+ years.
97.9% 97.5% 97.5% 97.2%
96.8%
97.1%
97.0% 97.3% 98.0% 98.1% 97.4% 97.3% 97.4% 97.3%
95.3%
92.2%
Refer to presentation notes beginning on page 52.
Same Center (2)
Total Portfolio (1)
An empowered team driving efficiency and value
Decentralized to empower field managers to drive the performance of their asset
Maximizing center value through redevelopments, renovations, and expansions
Leveraging AI technology to optimize customer service, enhance predictive functionality, and drive efficiency
Generating operating expense efficiencies without impacting the shopper experience
Participating in revenue generation:
Focus on business development opportunities, including sponsorships and paid media
Local leasing focused on iconic local brands
Marketing strategies customized to each asset
MarketingA differentiated strategic advantage
Leveraging data to unlock greater value for our shoppers and retail partners to drive topline sales
Connecting our shoppers to the brands and value they want through a digital-first platform
Broadening our addressable audience with multiple membership tiers and channels of our enhanced loyalty program, TangerClub
Growing our customer database and optimizing our marketing spend with an ROI focus
Reaching a younger and broader audience by evolving our messaging and media channels
Engaging with local communities through events and celebrations
A Portfolio Positioned in the Path of Demand
Tanger Outlets Charleston 3Q 2026 | 24
Brick-and-Mortar Retail Demand Shoppers want:In-demand brands and new retail experiences
Social, experiential shopping
Tactile interaction with products and instant gratification of in-person shopping
Holistic, social experience with food, beverage, and entertainment
Retailers want:Direct touchpoint with customers
Omnichannel structure to support both online and physical store sales
High-traffic retail locations in a time of limited real estate supply
Growth beyond DTC channel
Tanger Outlets Grand Rapids 3Q 2026 | 25
Positioned in the Path of Demand2015
Our shopping centers are in fast-growing markets with above average population growth, that benefit from tourism, seasonal residents, and today's flexible workforce.
90%+
SF in leading tourist destination or top 50 MSA
2xAverage population growth in
U.S. portfolio markets compared to national average (2010-2025)
65%+
Centers in U.S. markets with projected above average population growth (2025-2030)
Tanger Outlets Savannah
Source: U.S. Census Bureau, ESRI
3Q 2026 | 26
Tanger + Retail Brands
A unique partnership that drives mutual success
Large, well-positioned portfolio with growth opportunities
Quality, in-demand brands in each center
Proven retail partnership, with local team support
Onsite media and community engagement opportunities
Digital-first loyalty and marketing platforms
Productive sales model and clearance channel
Lower occupancy cost and higher margins
Lower customer acquisition costs
Direct touchpoint with consumers
Ability to maintain brand integrity
Multiple use cases to support retailers' business strategy:
Clear excess inventory while maintaining brand integrity
Ability to offer a mix of clearance, made-for-outlet, and full price product
"Pop-up" model allows national brands to test the channel and new locations
Avenue for best-in-class local and regional brands to gain exposure alongside proven national brands, plus dining and entertainment
The Outlet Channel
Highly profitable and core to retailers' omnichannel strategy
Tanger's Outlet PortfolioWhy shoppers choose Tanger's outlets
38outlet centers in
the U.S. and Canada*
45years as a leading outlet owner and operator
90%+
of outlet SF in leading tourist destination or top 50 MSA
Top brands on sale every day
Expanded and elevated food, beverage, and entertainment options for every friend and member of the family
All the benefits of in-person shopping:
Social, experiential environment
Direct product interaction
Instant gratification
Easy access for daily and travel shopping, as modern migration patterns put our centers in the path of growth
*Includes consolidated and six unconsolidated joint venture properties 3Q 2026 | 29
Strategic Merchandising
Adding In-Demand Retailers and Food, Beverage, and Entertainment Options
Apparel
Psycho Bunny Fort Worth | September 2026
Buckle Savannah | September 2026
Athletic
Toys & Games
Fabletics Phoenix | September 2026
Toys R Us Gonzales | October 2026
Health & Beauty
Ulta Sevierville | June 2026
Happy Beauty Savannah | October 2026
Accessories
Kendra Scott Sevierville | August 2026
Pandora Kansas City | August 2026
Home
Serena & Lily San Marcos | July 2026
Footwear
Hoka National Harbor | October 2026
Food, Beverage & Entertainment
Starbucks Asheville | August 2026
Shake Shack Charleston | September 2026
3Q 2026 | 30
Tanger's Lifestyle Portfolio
4Open-air lifestyle centers
1.9MTotal SF
Market-dominant, full-price centers with robust residential and economic drivers
Open-air retail formats with similar retail tenant mix, operational efficiencies, and sense of place and purpose to Tanger's outlet portfolio
Leverages Tanger's existing platform and management team to create value
3Q 2026 | 31
Creating ValueThrough Tanger's Proven Platforms
Coming Soon!
New!
New!
(under ground lease)
New!
New!
Main Event 1
Coming Soon!
New!
New!
New!
New!
3Q 2026 | 32
Expansion
ComNinegwS!oon!
New!
(under ground llease)
Property boundary Separately owned
~50%
of centers have peripheral land opportunity
Each opportunity is evaluated for highest and best use, across multiple avenues for value growth:
Ground Lease
Build to Suit
Redevelopment
Recent Examples
Planet Fitness
Tanger Outlets Savannah Build to Suit
Portillo's
Tanger Outlets Fort Worth Ground Lease
Chick-fil-A
Tanger Outlets Ottawa Ground Lease
Shake Shack
Tanger Outlets Riverhead Redevelopment
3Q 2026 | 33
Enhancing Portfolio Value Through Strategic Asset Intensification
Strategic, Disciplined, Data-Driven Intensification
External GrowthAccretive Portfolio Expansion Drives Value
Bridge Street Town Centre, Huntsville
3Q 2026 | 34
Growing Our Platform to Create ValueOur Strategic Advantages:
Ability to leverage the strength of our operating, leasing, and marketing platforms
Experienced in-place team with expertise across the retail spectrum
Dynamic and diversified tenancy growing in our existing portfolio - full-price stores, food and beverage, and entertainment venues
4
Attractive returns and ability to add value
Each offers a strong going-in return with upside potential, funded with existing cash and available liquidity.
Strong and flexible balance sheet with ample sources of liquidity = capacity for growth
How do our Recent Portfolio Additions align with our Investment Targets?
1
Dominant open-air centers
New centers are in primary retail and entertainment destinations in their regions.
2
Robust residential and economic drivers
All are in sought-after suburban locations amid high-income neighborhoods and premium amenities.
3
Outlets and complementary open-air retail
Our last seven additions include three outlet centers and four lifestyle centers.
$840M
Deployed
Since 2023
Accretive ExpansionRecent additions continue to advance our external growth strategy to add value
Outlets
Acquisitions, development, joint ventures, strategic management agreements
Leverage Tanger's well-established outlet platform and expertise
(development)
(acquisition)
(acquisition, formerly Asheville Outlets)
(acquisition, formerly Legends Outlets)
(acquisition)
(acquisition)
(management, formerly Palm Beach Outlets)
Lifestyle
Similar open-air retail format and tenant mix, with operational efficiencies and sense of place and purpose
Leverage existing Tanger platform and personnel
(acquisition)
Adjacent
Retail and land sites near Tanger's existing asset base
Leverage Tanger platform and brand, retailer relationships, local and regional operating teams, and opportunities for additional densification
(Various outparcels acquired adjacent to existing centers)
(Acquisition of adjacent land from Arizona DOT)
Key Facts
LEV IS COMMONS TOWN CENTER
Acquired May 27, 2026 for ~$60M
Funded using cash on hand and available liquidity
Market-dominant lifestyle center in growing mixed-use district
~300K SF that is 96.9% occupied* with a mix of 40+ shopping, dining, and entertainment uses, surrounded by strong immediate demand drivers, including existing and planned residential, office, healthcare, and hotels
Located in an affluent Toledo submarket
Perrysburg, one of Ohio's most desirable communities for families, professionals, and business development
Strong yield with ~8.5% estimated first-year return
Expectation for additional growth by enhancing the center's productivity through Tanger's proven leasing, marketing, and operating platforms
Advances external growth strategy
Eighth portfolio addition of market-dominant, open-air center leveraging the Tanger platform and strong balance sheet
*As of September 30, 2026
3Q 2026 | 37
LEV IS COMMONS TOWN CENTER
3Q 2026 | 38
Residential - 288 units
Residential - 18 units
Office Space with Ground Floor Retail
184 Rooms
Residential - 382 units
Residential - 216 units
Office Space with Ground Floor Retail
18k SF Retail Building Under Construction
O-I Glass Global Headquarters (100K SF)
105 Rooms
Conference & Event Facility
Future Medical Office New Development
Medical Office and Cancer Center (80K SF)
40+ Shopping, Dining, and Entertainment Uses
Property boundary
3Q 2026 | 39
Levis CommonsTown Center
N
Major Proximate Cities
Detroit (70 mi)
Cleveland (115 mi)
Columbus (130 mi)
MI
SYLVANIA
OH
LAMBERTVILLE
DETROIT, MI
(70 miles)
TEMPERANCE
LAKE ERIE
Toledo, OH
MSA Demographics
Chicago (240 mi)
Avg. Daily Traffic
FULTON COUNTY
CHICAGO, IL
LUCAS COUNTY
University of Toledo
Owens
OREGON
~600KPopulation
I-475 - 72K AADT
Hwy 25 - 33K AADT
53% of the U.S. population
(240 miles)
SWANTON
TOLEDO
Community College
CLEVELAND, OH
39.5
Median Age (U.S. 39.6)
Strong 5 Mile Demographics
lives within a day's drive
Gateway to the Midwest
Strategically positioned within a day's drive of the Midwest's major metros
Seamless access to Detroit,
WHITEHOUSE
PERRYSBURG
WOOD COUNTY
Levis Commons Town Center
(115 miles)
$127K48%
2025 ESRI Demographics
Avg Household Income (MSA $95K | U.S. $116K)
Bachelor's Degree + (MSA 31% | U.S. 37%)
Chicago, Cleveland, Columbus and beyond
Central location connects businesses and consumers to key markets across the region with ease
Toledo, OH MSA
Bowling Green State University
BOWLING GREEN
COLUMBUS, OH
(130 miles)
Toledo, OH MSA
Top U.S. Glass Manufacturing Metro (home to 4 largest glass companies: Owens Corning, Libbey Glass, Pilkington, and Owens-Illinois)
#4 Housing Market in the U.S. (based on existing home sales and price growth rates, 2026 Realtor.com)
Top 10 Metro for Business Investment in the East North Central Region of U.S.
Market Tourism
15.9M Tourists (2024)
$1.5B Visitor Spend (2024)
Market Attractions:
Toledo Zoo & Aquarium
Toledo Museum of Art + Glass Pavilion
Nature Based Recreation: Metroparks / Nationally known Birding areas / Lake & River activities
Minor League, Youth and Amateur Sports
Higher Education & Employment Strength
Colleges & Universities1
Bowling Green State University
20K Enrollment, 2.8K Employees Toledo University
14K Enrollment, 5.8K Employees Owens Community College
7.4K Enrollment, 1.3K Employees
Corporate Headquarters: ProMedica Health Systems (15K) 2, The Anderson's Inc (1.6K), Dana Inc (1.5K), Owens Corning (1.5K), Libbey Inc. (1.2K), GEM Inc. (1.1K), Block Communications Inc. (500), Owens-Illinois (O-I) (600)
Premier Submarket Location
Perrysburg Zip Code 43551:
#1 Best Public Schools in MSA 2026 Niche
#1 Largest Zip in MSA (Population of 45K)
#1 Population Growth in MSA, +20% 2010 to 2025 3
#2 Highest Avg. Household Income ($134K)3
Surrounding Density (w/in 5 miles):
72K resident population
2.9M SF Class A+B Office
9K Multi-Family Units
40 Hotels / 3.5K Rooms
1Sources: ESRI, Placer.ai, Inrix, CoStar, Niche, Bowling Green State University, Toledo University, Owens Community College, Destination Toledo, Regional Growth Partnership Northwest Ohio.
2Regional employee counts in parentheses - 2024. 3 Zips with 10K+ people.
3Q 2026 | 40