Whitney — Gulf South Bank Conference 2005
41 slides from Whitney's conference presentation, May 10, 2005

Slide 1: Gulf South Bank Conference
Exhibit 99.1 May 10, 2005 Gulf South Bank Conference

Slide 2: Forward-Looking Statements
This presentation may include forward-looking statements containing expectations about future conditions and descriptions of future plans and strategies. Whitney's ability to accurately predict the effects of future plans or strategies is inherently limited such that actual results and performance c

Slide 3: Whitney's Corporate Philosophy
Soundness Profitability Growth In that order of priority Whitney’s Corporate Philosophy

Slide 4: Whitney
& 7 WHITNEY

Slide 5: Asset Quality
Asset Quality
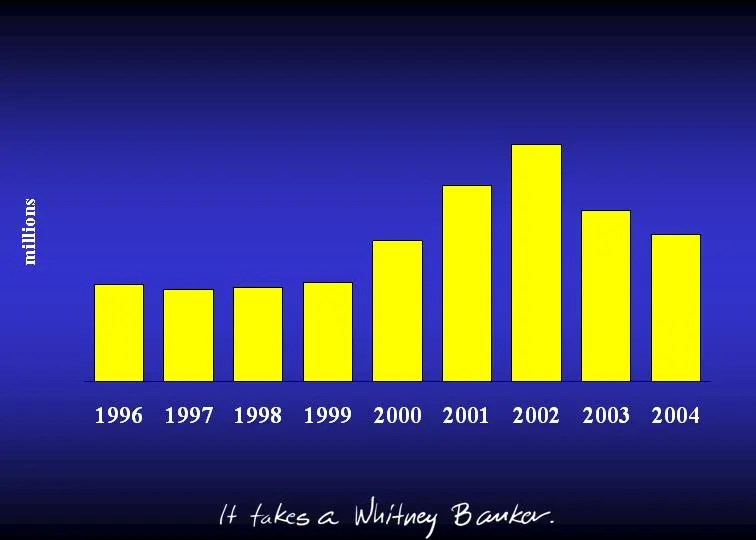
Slide 6: Nonperforming Assets
$17.3 $16.4 $16.8 $17.5 $25.0 $34.8 $42.1 $30.4 $26.1 Nonperforming Assets
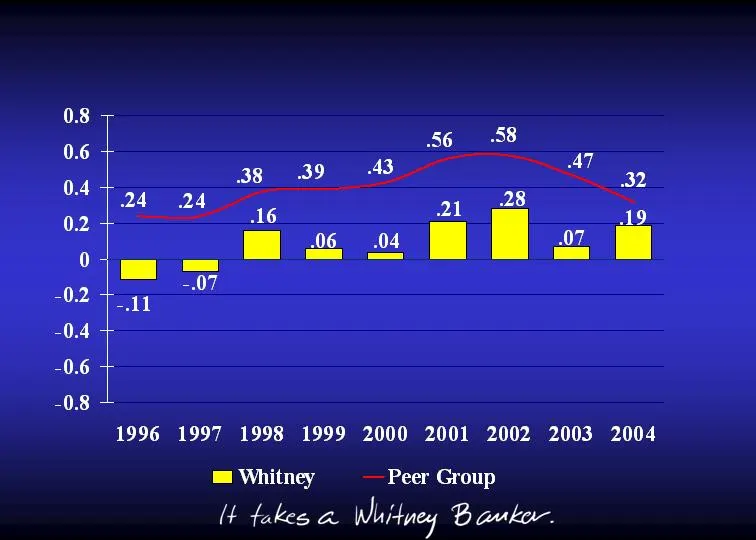
Slide 7: Credit Quality
Credit Quality Percent Net Charge-offs to Average Loans
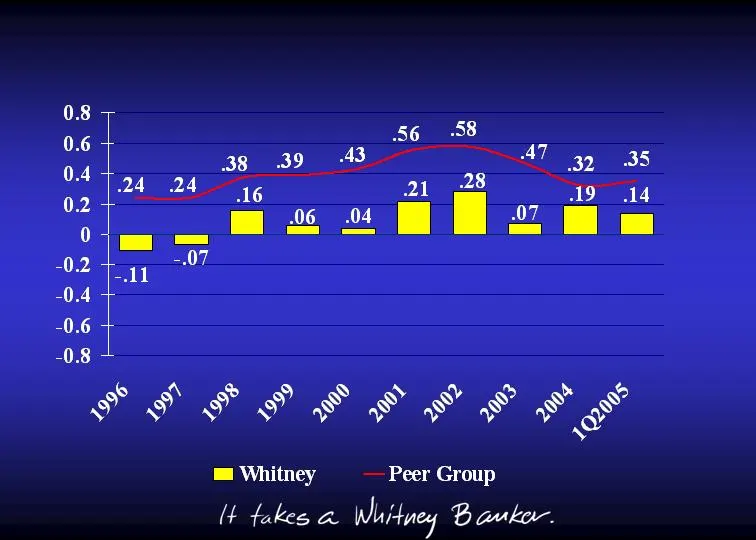
Slide 8: Credit Quality
Credit Quality Percent Net Charge-offs to Average Loans
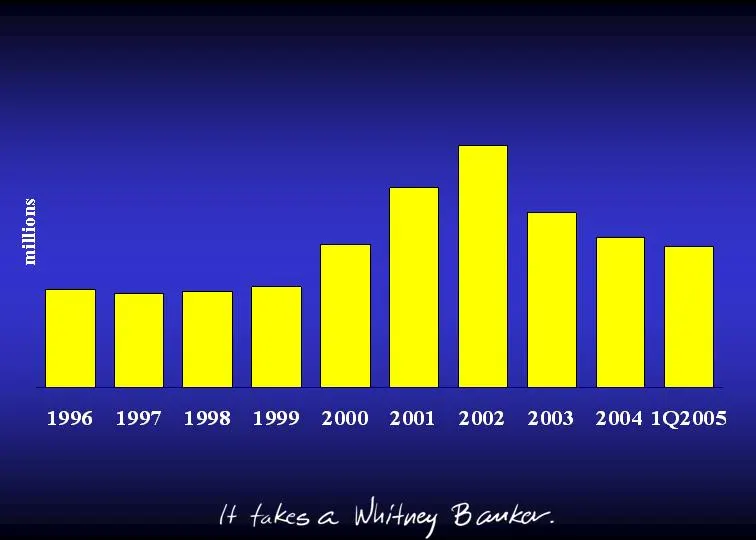
Slide 9: Nonperforming Assets
$17.3 $16.4 $16.8 $17.5 $25.0 $34.8 $42.1 $30.4 $26.1 $24.5 Nonperforming Assets
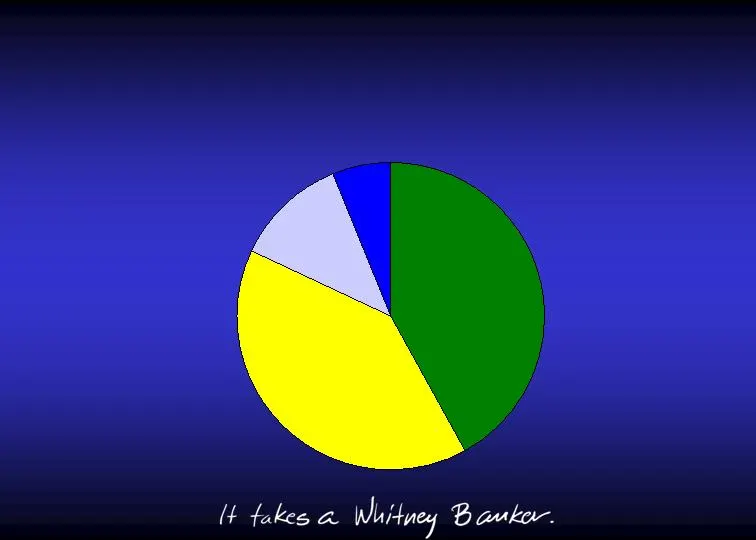
Slide 10: Portfolio Mix - 1Q2005
Commercial and Industrial 42% Commercial Real Estate 40% Residential Mortgages 12% Consumer 6% Portfolio Mix - 1Q2005
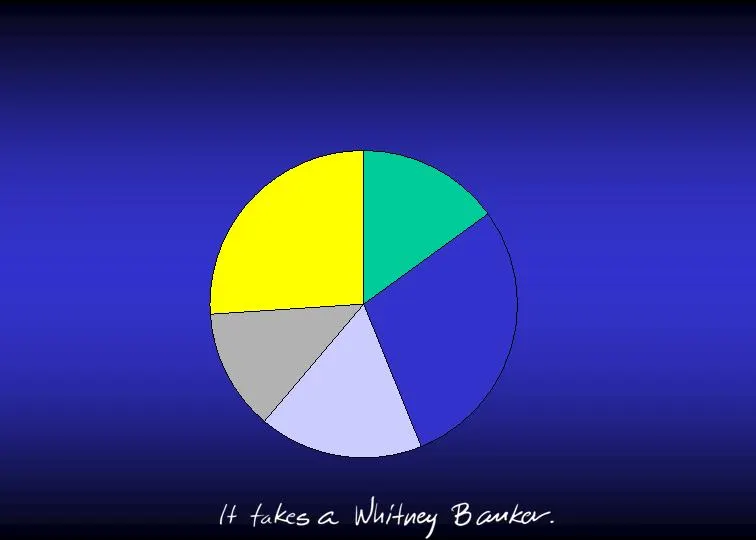
Slide 11: Oil and Gas-Related Loans – 1Q2005
Oil and Gas-Related Loans – 1Q2005 (dollars in millions) Other 15% Support/Sales 13% Transportation 26% $68 $131 $78 $86 $151 Pre-Drill Services 17% Exploration/ Production 29%
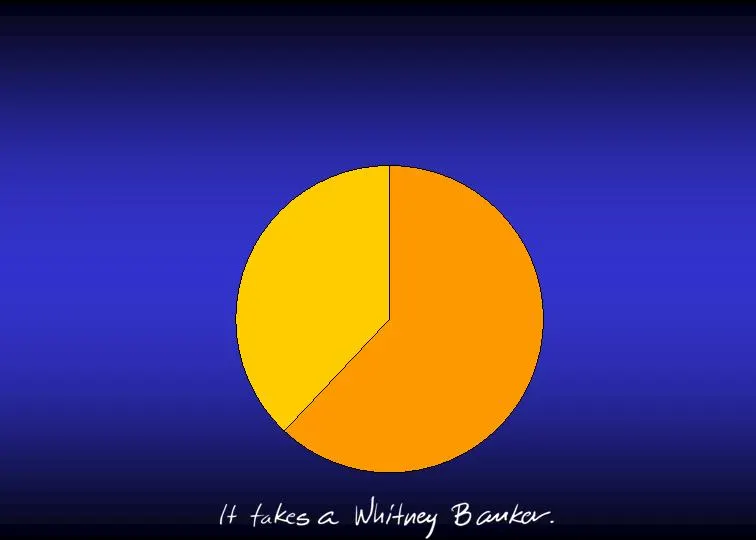
Slide 12: Hospitality Industry Loans – 1Q2005
Hospitality Industry Loans – 1Q2005 (dollars in millions) Hotels/Motels Restaurants/Bars 38% 62% $166 $101

Slide 13: Allowance for Loan Losses Methodology
Allowance for Loan Losses Methodology

Slide 14: Credit Risk Management
Credit Policy Committee Lending Officers/Risk Ratings Process Credit Review Function Credit Risk Management

Slide 15: Allowance for Loan Loss Components
Allowances for Criticized Loans Allowances for Loans with Acceptable Credit Quality Allowances Based on Economic Conditions or Other Factors Allowance for Loan Loss Components

Slide 16: It is Just a Computed Number!
It is Just a Computed Number!

Slide 17: Whitney
& 7 WHITNEY
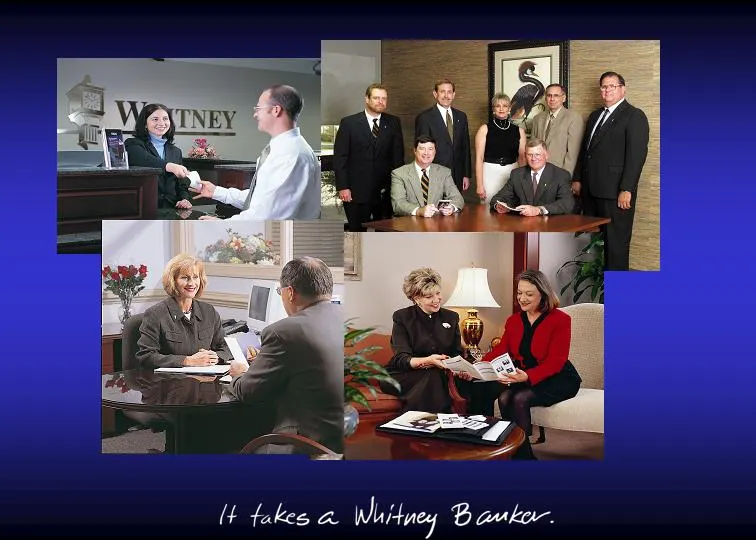
Slide 18: It Takes a Whitney Banker
ae Ut takes a Whitney Bauker.
Slide 19: It Takes a Whitney Banker
meer tay Sr ea >a Madison sy =| BANK :: Your Community Bank Ut takes a Whitney Bauker.
Slide 20: Key Interest Rates Over Last Four Years
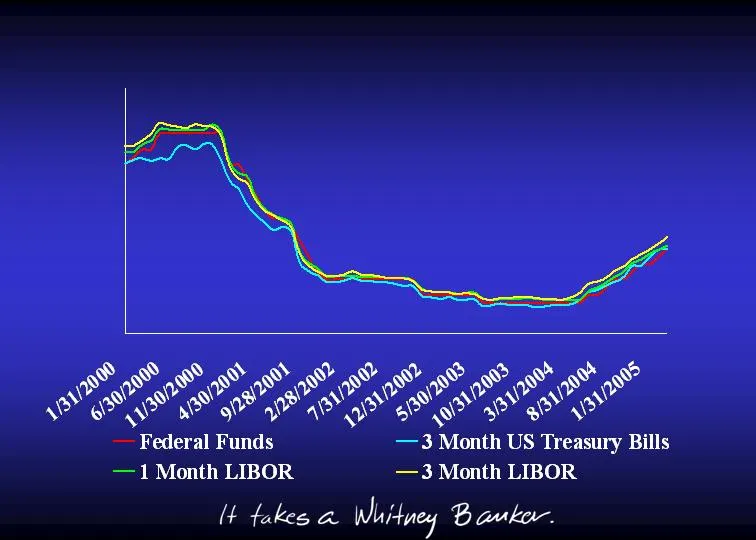
Key Interest Rates Over Last Four Years
Slide 21: Loan Growth
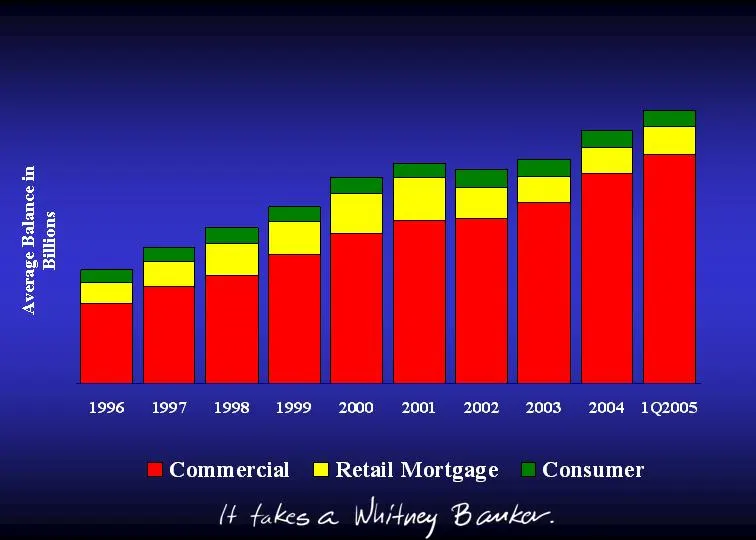
$2.3 $2.8 $3.2 $3.6 $4.2 $4.5 Growth: 23% 20% 14% 14% 18% 6% (2)% 5% 13% 14% $4.4 $4.6 $5.2 $5.6 Loan Growth
Slide 22: Deposit Growth
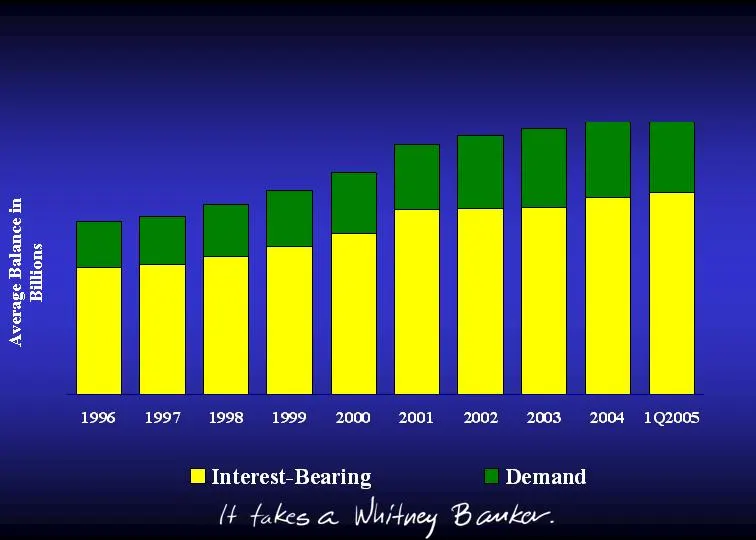
$3.8 $4.0 $4.2 $4.5 $4.9 $5.5 Growth: 4% 3% 7% 7% 9% 13% 4% 3% 7% 8% $5.8 $5.9 $6.3 $6.6 Deposit Growth
Slide 23: Net Interest Income
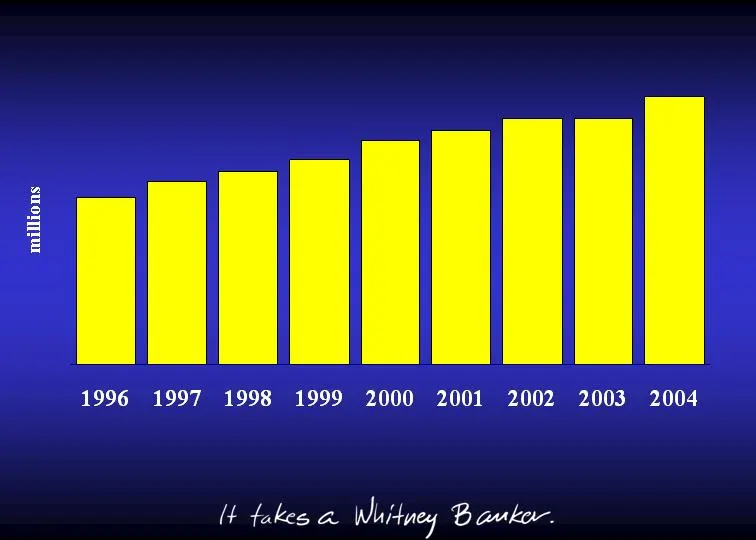
$204.1 $223.0 $234.8 $249.4 $273.2 $285.2 Growth: 4% 9% 5% 6% 10% 4% 5% - - % 9% $300.1 $300.1 NIM $326.2 Net Interest Income 4.68% 4.92% 4.92% 4.83% 4.73% 4.52% 4.62% 4.47% 4.45%
Slide 24: Noninterest Income
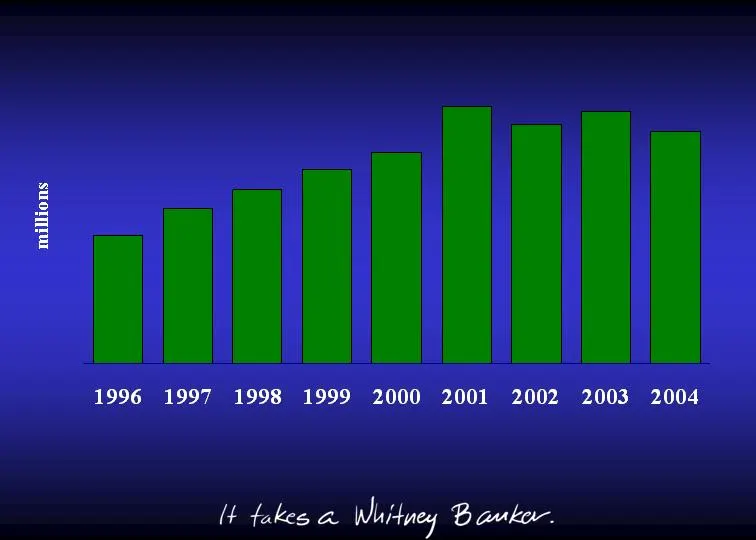
$45.6 $55.2 $61.7 $68.9 $75.1 $91.2 Growth : 12% 21% 12% 12% 9% 21% (7)% 5% (8)% * Includes impact of merchant business sale in 2001 $85.2 $82.5 * * $89.5 Noninterest Income

Slide 25: Components of Noninterest Income
2004 2003 Service charges on deposit accounts $ 37.1 $ 38.3 (3) % Secondary mortgage market operations 4.9 11.2 (56) Bank card fees 10.3 9.2 12 Trust service fees 9.0 8.1 10 Other noninterest income 21.1 21.8 (3) Securities transactions .1 .9 (92) Total noninterest income $ 82.5 $ 89.5 (8) % Growth
Slide 26: Noninterest Expense
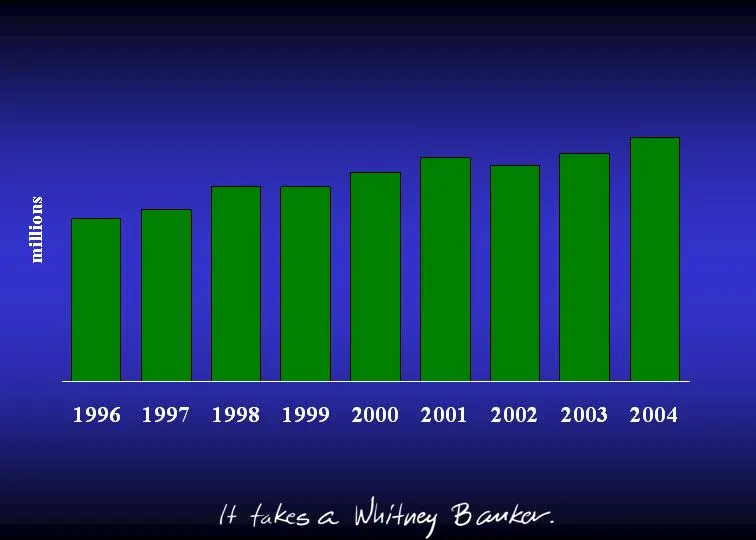
$173.4 $183.3 $207.6 $207.8 $223.2 $239.1 $242.9 % Change : 9% 6% 13% - % 7% 7% (3)% 5% 7% $230.9 $260.3 Noninterest Expense

Slide 27: Components of Noninterest Expense
2004 2003 Growth Employee compensation $ 119.7 $ 114.0 5 % Employee benefits 29.7 27.4 8 Total personnel expense 149.4 141.4 6 Net occupancy expense 20.5 19.5 5 Equipment and data processing expense 17.6 17.3 2 Telecommunication and postage 8.8 8.6 3 Corporate value and franchise taxes 7.5 7.1 6 Leg

Slide 28: Financial Performance: Condensed Income Statement
2004 2003 Growth Net interest income (TE) $ 326 $ 300 9 % Noninterest income 83 90 (8) Total revenue (TE) 409 390 5 Noninterest expense 260 243 7 Provision for loan losses 2 (4) 157 Net income $ 97 $ 99 (1) % Basic EPS $ 2.38 $ 2.47 (4) % Diluted EPS $ 2.35 $ 2.44 (4) % Financial Performance ($ in m

Slide 29: Excellent Financial Performance Continues in 2005
First Quarter 2005 2004 Growth Net interest income (TE) $ 89.9 $ 78.7 14 % Noninterest income 21.4 20.9 2 Total revenue (TE) 111.3 99.6 12 Noninterest expense 66.3 62.0 7 Provision for loan losses 1.5 (2.0) 175 Net income $ 28.8 $ 26.2 10 % Basic EPS $ .71 $ .65 9 % Dilute EPS $ .70 $ .64 9 % Excell
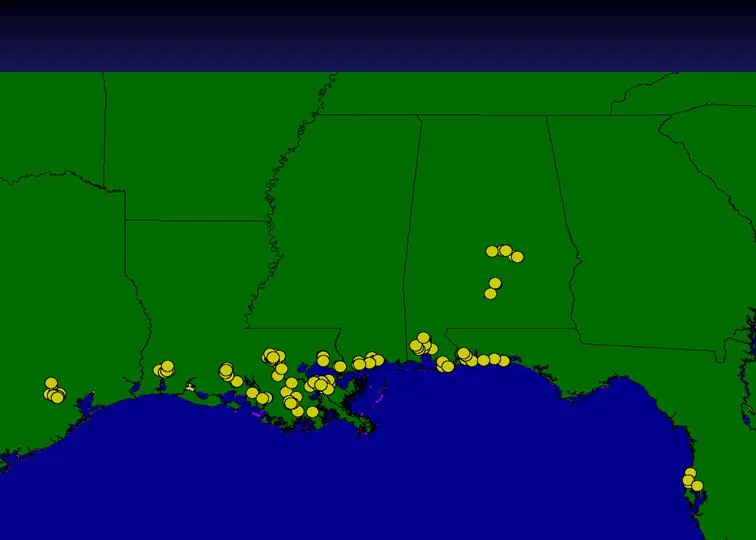
Slide 30: Geographic Footprint
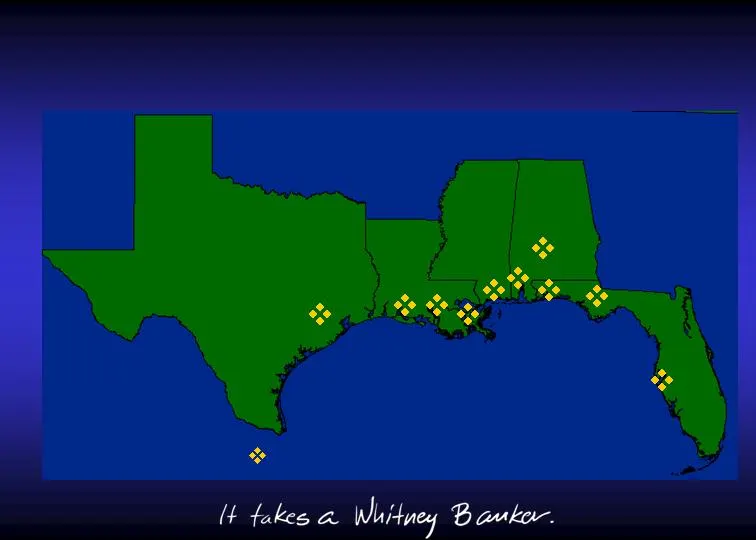
Whitney Locations Texas Louisiana Mississippi Alabama Florida Geographic Footprint
Slide 31: Whitney Territory – Deposit Exposure
Destin Tampa Montgomery New Orleans Houston Whitney Territory – Deposit Exposure $84B $55B $40B $198B Total

Slide 32: It Takes a Whitney Banker
Ut takes a Whitney Bake.

Slide 33: Equipping The Whitney Banker
Equipping The Whitney Banker
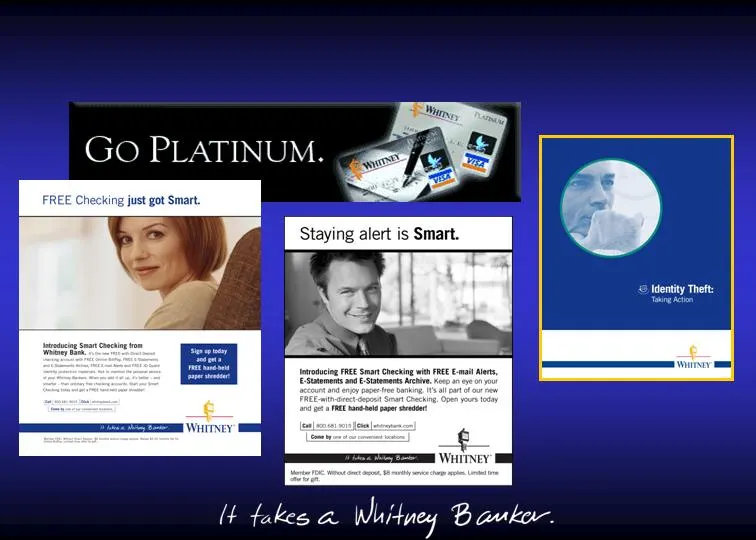
Slide 34: Go PLATINUM
Go PLATINUM. WuItNey Ut takes a Whitney Bauker.

Slide 35: Smart Checking Features
Free-With-Direct Deposit Free Online Bill Pay Free Email Alerts No Monthly Fee Visa Platinum Check Card Free ID Guard Identity Theft Assistance Smart Checking Features
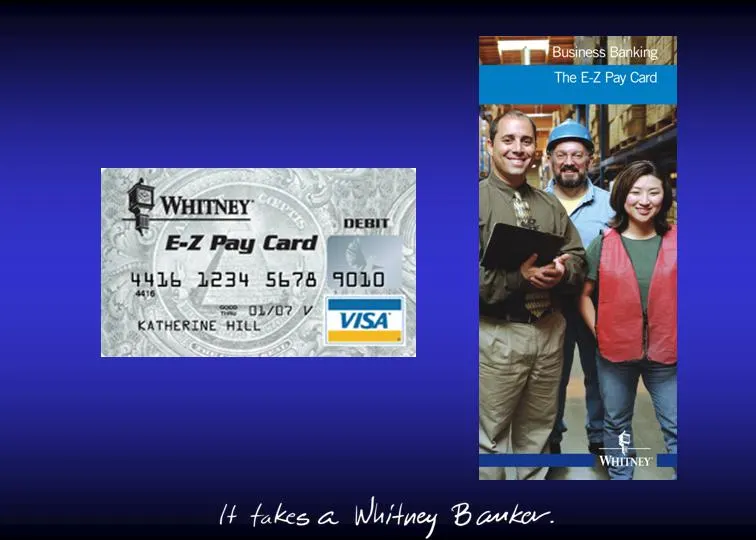
Slide 36: Gwuner
Gwuner E-Z Pay Card 446 1234 5678 40 . SS" UL/02 V KATHERINE HILL VISA Ut fakes a Whitney Bauker.
Slide 37: It Takes a Whitney Banker
Ut takes a Whitney Bauker.

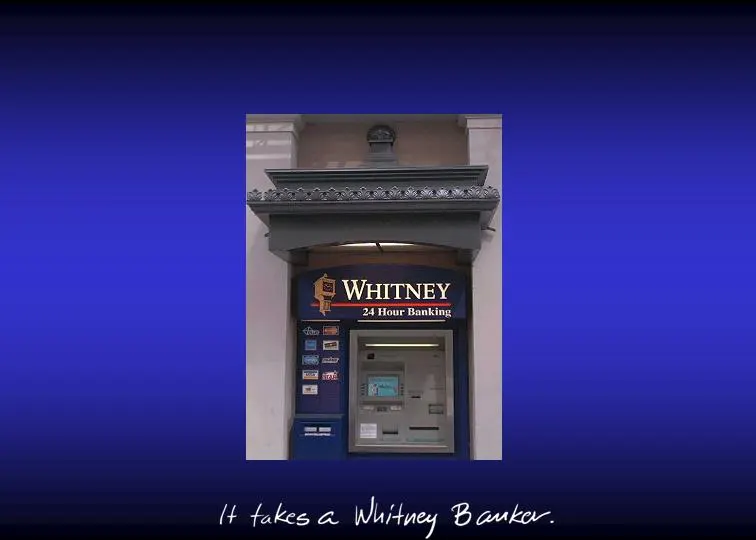
Slide 38: Advantages of Outsourcing ATM's
90% New ATM’s with Improved Reliability Color Touch Screens More Functionality Targeted Contemporary Marketing Graphics Advantages of Outsourcing ATM’s

Slide 39: More Advantages of Outsourcing ATM's
New Network Security Requirements Compliant Pending ADA Requirements Compliant Extended Service Hours More Flexible Deployment More Advantages of Outsourcing ATM’s

Slide 40: Internally Generated Growth in 2004
New Total Markets Percent Loans $ 560 M $ 340 M 60 % Deposits $ 250 M $ 115 M 46 % Internally Generated Growth in 2004 ($ in millions, except percents)

Slide 41: Whitney
& 7 WHITNEY
Source: SEC EDGAR · 8-K filed May 10, 2005
More decks from Whitney Holding Corp
 Q4 2010 Earnings Presentation15 slides · Jan 27, 2011
 Merger or Acquisition (December 2010)18 slides · Dec 23, 2010
 Merger or Acquisition (December 2010)18 slides · Dec 22, 2010
 Stifel Nicolaus Bank & Thrift Conference 201030 slides · Nov 2, 2010
 Q3 2010 Earnings Presentation16 slides · Oct 26, 2010
 Q2 2010 Earnings Presentation18 slides · Jul 27, 2010