Whitney — Stifel Nicolaus Bank & Thrift Conference 2010
30 slides from Whitney's conference presentation, Nov 2, 2010

Slide 1: Stifel Nicolaus Bank & Thrift Conference
Stifel Nicolaus Bank & Thrift Conference November 2, 2010

Slide 2: Forward-Looking Statements
Forward-Looking Statements During this presentation we may make forward-looking statements. Forward-looking statements provide projections of results of operations or of financial condition or state other forward-looking information, such as expectations about future conditions and descriptions of p
Slide 3: Key Investment Highlights
Key Investment Highlights • Stability Since 1883 • Strong brand and core deposit franchise • Taking actions designed to ensure a bright future for our bank, employees and shareholders • Taking aggressive actions to manage our credit issues
Slide 4: Bulk Sales
Bulk Sales Ut fakes a. Whitney Banker WHITNEY HOLDING CORPORATION

Slide 5: Bulk Sales Overview
Bulk Sales Overview • On October 26, 2010 Whitney announced: – Sale of $180 million of nonperforming loans; and – Reclassification of up to additional $100M nonperforming loans as held for sale • Primary objective of bulk sales is to accelerate: – Disposition of problem assets – Exit from the effect
Slide 6: Summary of 4th Quarter Cost of Bulk Sale Strategy
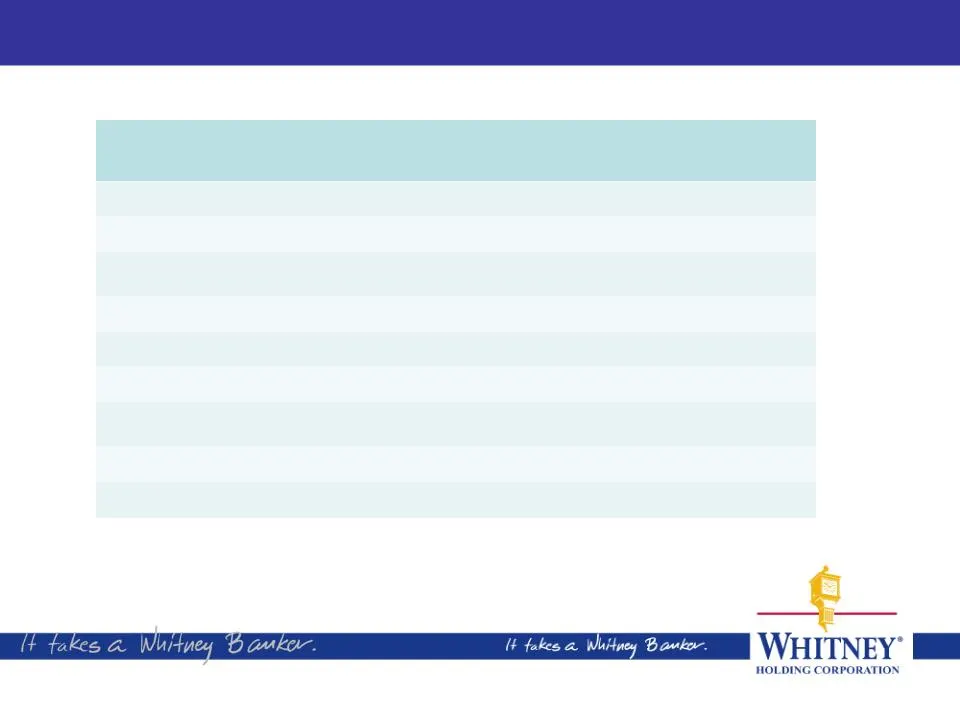
Summary of 4 th Quarter Cost of Bulk Sale Strategy ($s in millions) Pre-tax 4 th Quarter Charge Sale of Notes Net Book Value $165 Proceeds 100 Loss $65 Reclassification of Notes to Held For Sale Net Book Value $100 Adjusted Net Book Value 60 Reclassification Loss $40 Total Estimated Pre-Tax Loss Boo
Slide 7: Proforma Results For Bulk Sales
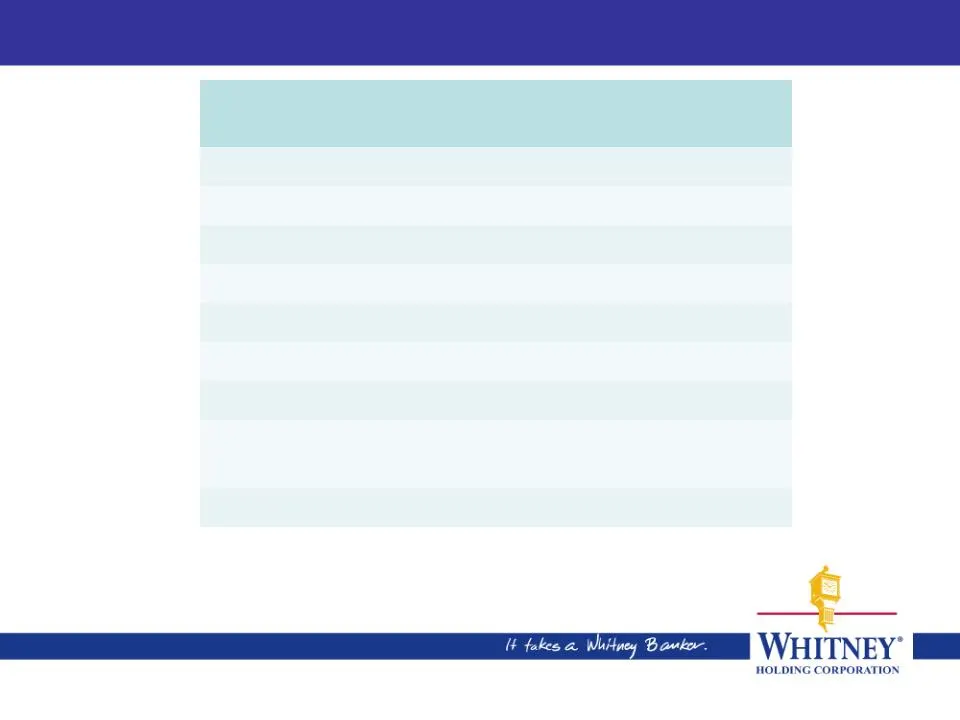
Proforma Results For Bulk Sales ($s in millions) 9/30/10 Proforma 9/30/10* Nonperforming Loans $428 $142 Classified Loans $1,122 $836 NPA ratio 6.64% 3.14% Reserve coverage 52% 142% ALLL ratio 2.89% 2.72% Tangible common equity ratio 8.10% 7.55% Leverage ratio 10.09% 9.23% * Proforma results reflect
Slide 8: Quarterly Review
6~ Quarterly Review Ut fakes a. Whitney Banker WHITNEY HOLDING CORPORATION

Slide 9: Issues And Concerns Have Been Eased or Addressed
Issues And Concerns Have Been Eased or Addressed • Oil spill in the Gulf of Mexico – Leak has been capped and those along the coast are recovering, remaining issues appear manageable • Independent third-party risk rating review project – Completed and fully reflected in our 3Q10 results • Weak econo

Slide 10: Third Quarter 2010 Review
Third Quarter 2010 Review 3Q10 2Q10 3Q09 (Period-end) Total Assets $11.5B $11.4B $11.7B Total Loans $7.7B $8.0B $8.5B Total Deposits $8.9B $8.8B $8.9B Provision for Credit Losses $70.0MM $59.0MM $80.5MM Net Income (loss) ($29.0MM) ($18.0MM) ($30.0MM) Net Income (loss) to common shareholders ($33.1MM
Slide 11: Net Interest Margin Remains Relatively Stable
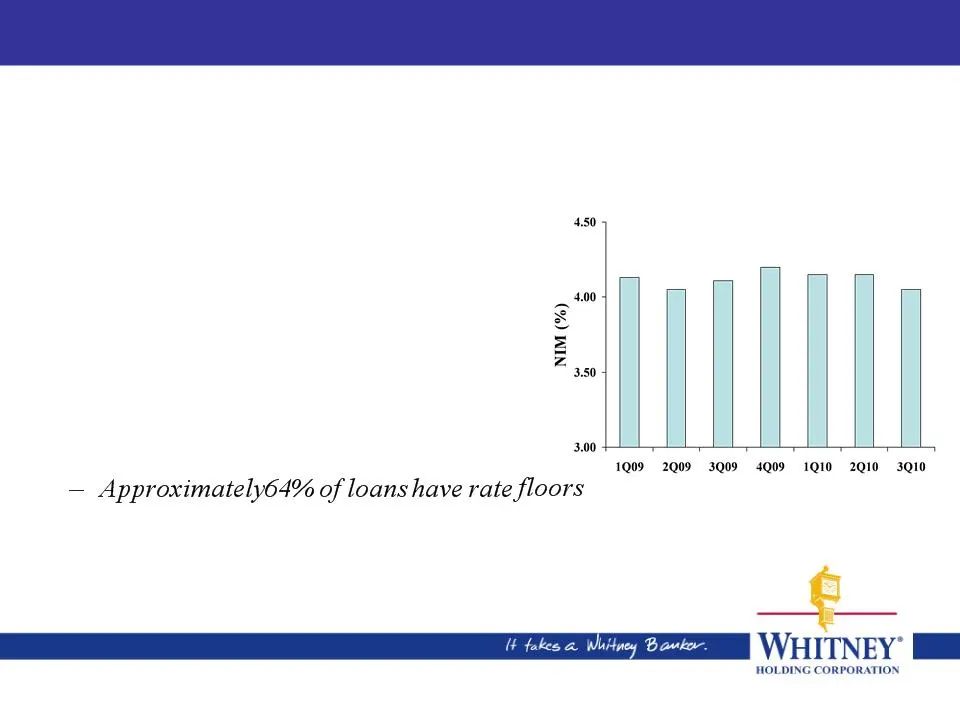
Net Interest Margin Remains Relatively Stable • NIM of 4.05% contracted 10bps in 3Q10 • Lower yield on earning assets • Shift in the mix of earning assets • Active management of loan and deposit pricing • Nonaccrual loans reduced NIM by approximately 20bps • Variable rate loan portfolio – 28% tied t
Slide 12: Asset Quality
Asset Quality WHITNEY

Slide 13: Working Through A Challenging Environment
Working Through A Challenging Environment • Provision for credit losses was $70 million in 3Q10 – More than half was related to the increase in classified loans – $11 million was related to the resolution of problem credits – $15 million was related to lower collateral values on previously impaired

Slide 14: Independent Analysis Provided Clarity, Confidence
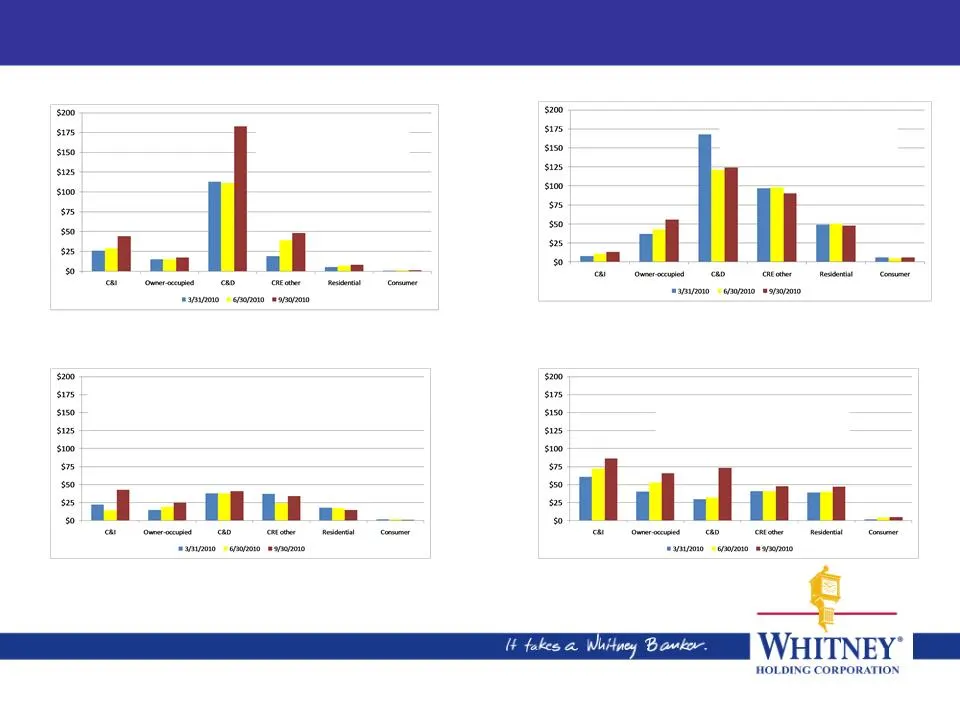
Independent Analysis Provided Clarity, Confidence • Independent, third-party consultant - Alvarez & Marsal • Classified loans increased $236 million, net, during 3Q10 • We believe that most of the newly classified credits have lower loss potential compared to those losses incurred on credits impacte
Slide 15: Additions To Classified Mainly Texas C&D
Additions To Classified Mainly Texas C&D Note: Financial data as of September 30, 2010 Texas Florida Louisiana Alabama/Mississippi Economic Stress Real Estate ‘bubble” Economic Stress Economic Stress & Real Estate ‘bubble’

Slide 16: Well-Defined Weakness Does Not Imply Significant Loss
Well-Defined Weakness Does Not Imply Significant Loss • Well-defined weaknesses can include: – Pre-sales slower than expected compared to original projections – Slowdown in anticipated lease-ups and delay in pad site sales – Projects capable of covering interest payments due to current occupancy rat
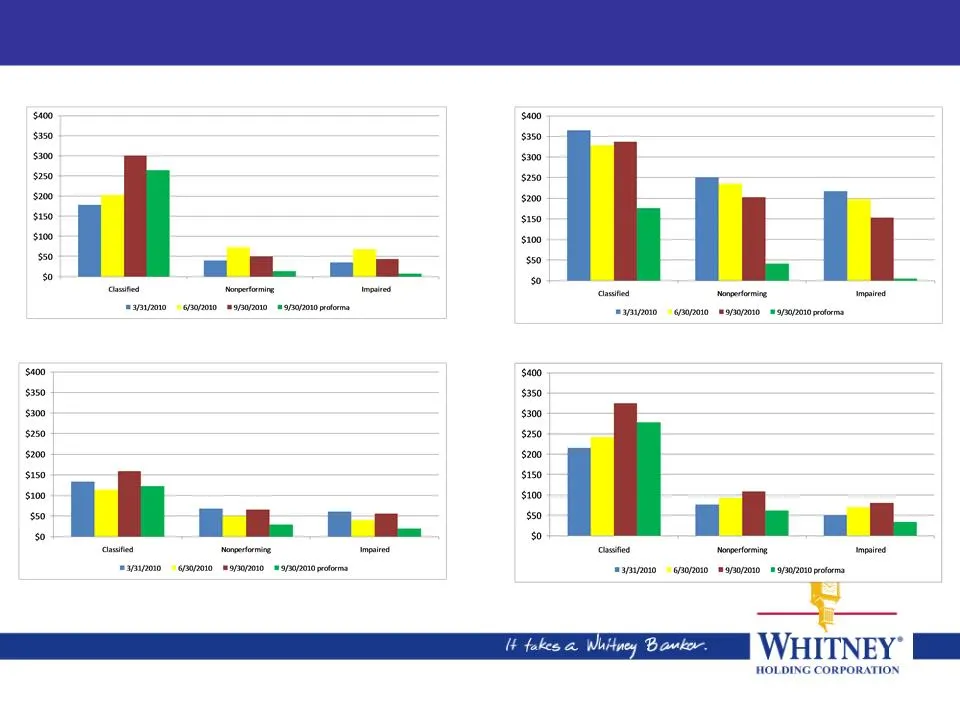
Slide 17: Migration To Nonperforming Mainly In Florida
Migration To Nonperforming Mainly In Florida Texas Florida Louisiana Alabama/Mississippi * Proforma results reflect the sale of approximately $180 million in loans currently under contract and $100 million in loans reclassified to held for sale. Note: Financial data as of September 30, 2010
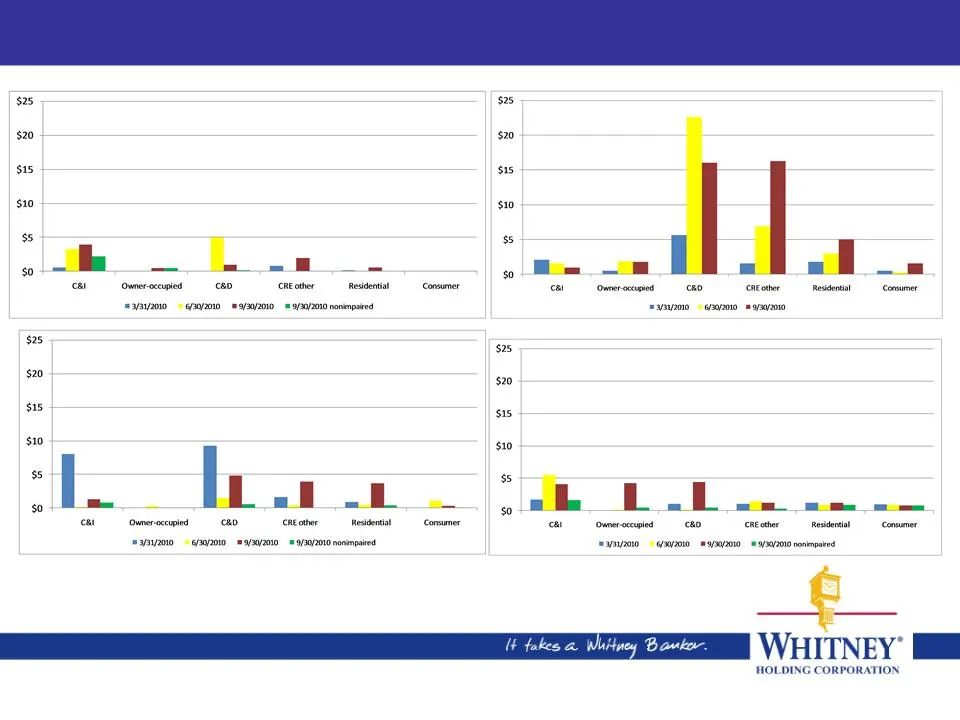
Slide 18: Majority Of Losses From Florida Impaired Loans
Majority Of Losses From Florida Impaired Loans Texas Florida Louisiana Alabama/Mississippi Note: Financial data as of September 30, 2010

Slide 19: Most Of The Top Classified Loans Still Accruing
Most Of The Top 20 Classified Loans Still Accruing • Top 20 Classified Loans – Totaled approximately $250 million, or 22% of total classified loans, at 9/30/10 – The majority, 87%, are still accruing – All of the nonaccrual loans within this group are held for sale – Slightly over 50% are serviced o

Slide 20: Selling Most Of Our Top Nonperforming Loans
Selling Most Of Our Top 20 Nonperforming Loans • Top 20 Nonperforming Loans • Totaled approximately $115 million, or 27% of total nonperforming loans, at 9/30/10 • Slightly over 75% of the top 20 nonperforming loans are either under contract to be sold or are held for sale • Most of loans remaining

Slide 21: Strong Capital Allows Us To Dispose Of Problems
Strong Capital Allows Us To Dispose Of Problems • $1.6 billion total equity – Tangible common equity ratio 8.10% – Leverage ratio 10.09% • Substantially all of the Company’s deferred tax assets have been disallowed for regulatory capital calculations • Do not expect actions addressing nonperforming
Slide 22: Strategic Plan
Strategic Plan a WHITNEY i
Slide 23: It's About Doing Things Better Than We've Done Before
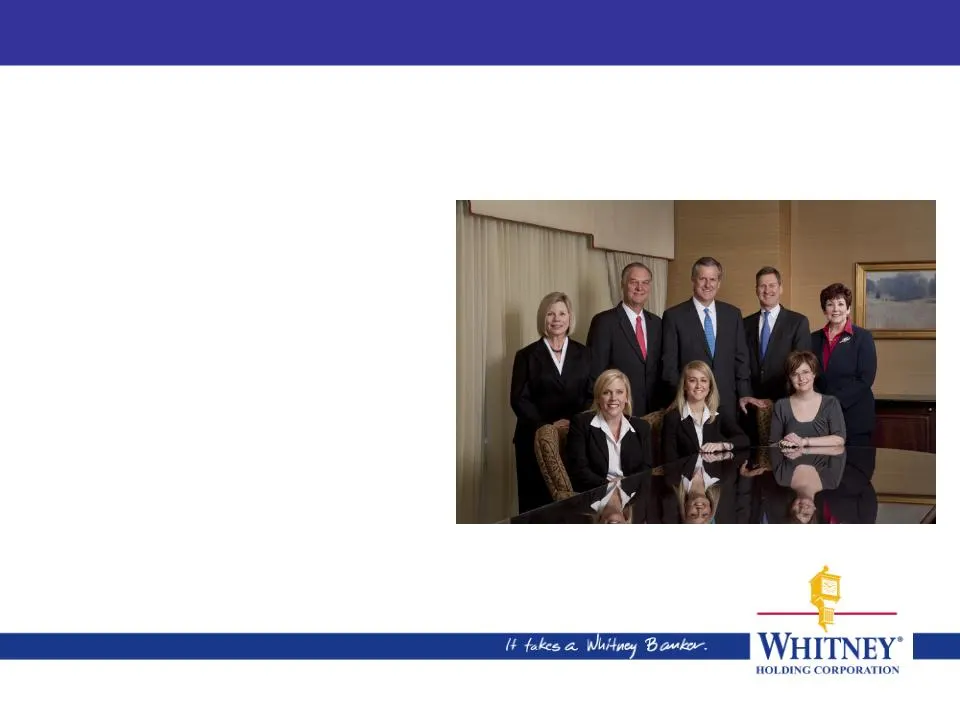
It’s About Doing Things Better Than We’ve Done Before • People • Products • Sales and service
Slide 24: Focus On Generating Business Line Fee Growth
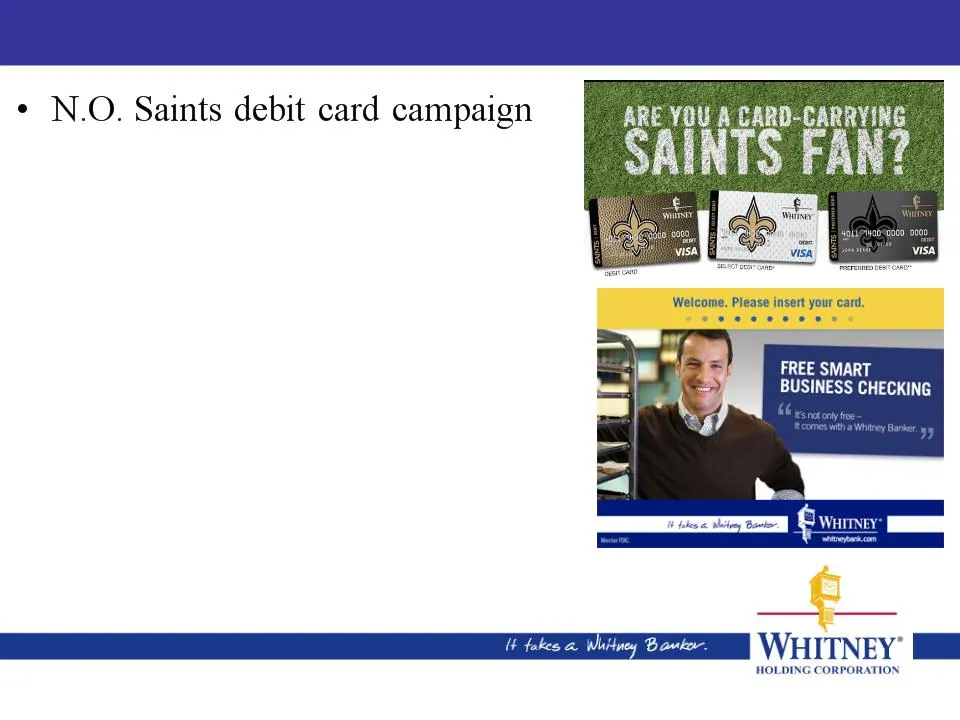
Focus On Generating Business Line Fee Growth – Issued over 17,000 cards to first-time Whitney cardholders • New checking account sales – Up almost 35% over 2009 • Credit card campaigns – Sales were up 216% and outstandings were up 23.5% over last year Note: Financial data as of September 30, 2010
Slide 25: Focus On Generating Business Line Fee Growth
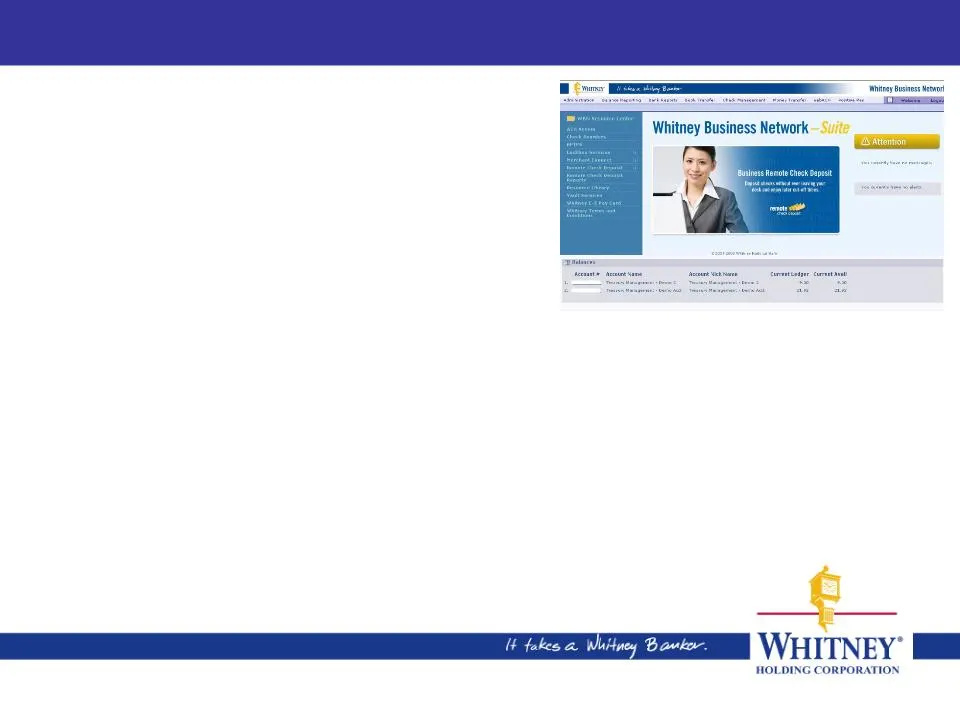
Focus On Generating Business Line Fee Growth • Interest rate swaps • Enrollment in the commercial banking internet banking platform continued to increase • Significant improvements in the brokerage business – Revenue up 15% versus last year • Additional fee income will complement our already strong
Slide 26: Investing In Our Future
Investing In Our Future • Project Genesis, our technology transformation project, is on track • Spent almost the past two years working on, and investing in, this state-of-the-art initiative • Expected to benefit bankers, customers and shareholders in a number of important ways – Employees will be a
Slide 27: a WHITNEY i
a WHITNEY i
Slide 28: Potential For Significant Growth Opportunities Is Improving
Potential For Significant Growth Opportunities Is Improving • Opportunities will be available once the market turns • Committed and focused on creating long-term value for shareholders • Today’s environment “Takes A Whitney Banker”
Slide 29: An Encouraging Outlook
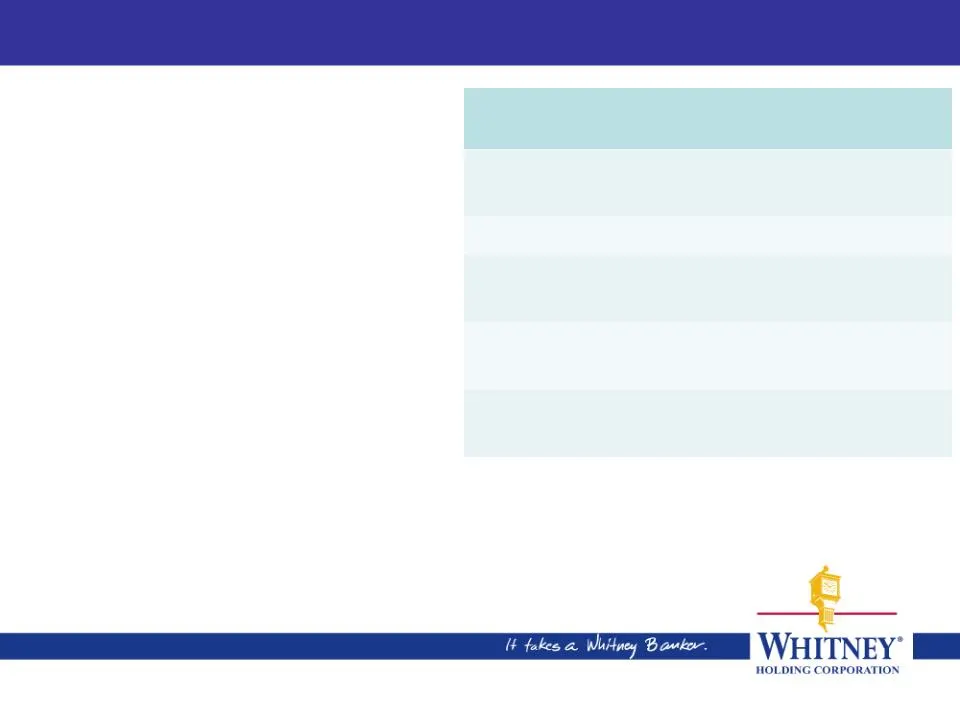
An Encouraging Outlook ($s in millions, except E.P.S.) 2011E 2011E Street Estimate* Company Guidance Provision For Credit Losses $103 $40 - $70 Collection Costs n/a Less than $25 million E.P.S. (Diluted) ($.10) $.30 - $.50 • We feel confident about where we are today • We expect 2011 to be a much be

Slide 30: Stifel Nicolaus Bank & Thrift Conference
Stifel Nicolaus Bank & Thrift Conference November 2, 2010
Source: SEC EDGAR · 8-K filed Nov 2, 2010
More decks from Whitney Holding Corp
 Q4 2010 Earnings Presentation15 slides · Jan 27, 2011
 Merger or Acquisition (December 2010)18 slides · Dec 23, 2010
 Merger or Acquisition (December 2010)18 slides · Dec 22, 2010
 Q3 2010 Earnings Presentation16 slides · Oct 26, 2010
 Q2 2010 Earnings Presentation18 slides · Jul 27, 2010
 Q1 2010 Earnings Presentation16 slides · Apr 27, 2010